Embed Size (px)
Citation preview
RESEARCH Open Access
Predicting phenotypes of asthma and eczemawith machine learningMattia CF Prosperi1,2*, Susana Marinho2, Angela Simpson2, Adnan Custovic2†, Iain E Buchan1†
From The 3rd Annual Translational Bioinformatics Conference (TBC/ISCB-Asia 2013)Seoul, Korea. 2-4 October 2013
Abstract
Background: There is increasing recognition that asthma and eczema are heterogeneous diseases. Weinvestigated the predictive ability of a spectrum of machine learning methods to disambiguate clinical sub-groupsof asthma, wheeze and eczema, using a large heterogeneous set of attributes in an unselected population. Theaim was to identify to what extent such heterogeneous information can be combined to reveal specific clinicalmanifestations.
Methods: The study population comprised a cross-sectional sample of adults, and included representatives of thegeneral population enriched by subjects with asthma. Linear and non-linear machine learning methods, fromlogistic regression to random forests, were fit on a large attribute set including demographic, clinical andlaboratory features, genetic profiles and environmental exposures. Outcome of interest were asthma, wheeze andeczema encoded by different operational definitions. Model validation was performed via bootstrapping.
Results: The study population included 554 adults, 42% male, 38% previous or current smokers. Proportion ofasthma, wheeze, and eczema diagnoses was 16.7%, 12.3%, and 21.7%, respectively. Models were fit on 223 non-genetic variables plus 215 single nucleotide polymorphisms. In general, non-linear models achieved highersensitivity and specificity than other methods, especially for asthma and wheeze, less for eczema, with areas underreceiver operating characteristic curve of 84%, 76% and 64%, respectively. Our findings confirm that allergensensitisation and lung function characterise asthma better in combination than separately. The predictive ability ofgenetic markers alone is limited. For eczema, new predictors such as bio-impedance were discovered.
Conclusions: More usefully-complex modelling is the key to a better understanding of disease mechanisms andpersonalised healthcare: further advances are likely with the incorporation of more factors/attributes andlongitudinal measures.
BackgroundAsthma is the most common chronic disease in devel-oped countries, however, the drug armamentarium avail-able to manage the condition is modest[1]. There isincreasing recognition that asthma is a heterogeneousdisease with multiple endotypes, which may have similarclinical manifestations, or phenotypes, but differentunderlying pathophysiological causes[2,3]. Appropriate
identification of such endotypes is critical for the under-standing of the disease mechanism and the developmentof personalised approaches to its management[4]. Sensi-tisation to allergens from several sources (such as pets,dust mites, cockroaches, and pollens) has been indepen-dently associated with asthma and asthma-related symp-toms[5-8], and among asthmatic patients with theseverity of the disease[9-12]. Also, sensitisation to inha-lant allergens has been found to be associated withdiminished lung function and increased airway respon-siveness[13].It remains unclear to what extent allergen sensitisation
and lung function markers (e.g., airway reactivity, airway
* Correspondence: [email protected]† Contributed equally1Centre for Health Informatics, Institute of Population Health, Faculty ofMedical and Human Sciences, University of Manchester, Manchester, UKFull list of author information is available at the end of the article
Prosperi et al. BMC Medical Genomics 2014, 7(Suppl 1):S7http://www.biomedcentral.com/1755-8794/7/S1/S7
© 2014 Prosperi et al.; licensee BioMed Central Ltd. This is an Open Access article distributed under the terms of the CreativeCommons Attribution License (http://creativecommons.org/licenses/by/2.0), which permits unrestricted use, distribution, andreproduction in any medium, provided the original work is properly cited. The Creative Commons Public Domain Dedication waiver(http://creativecommons.org/publicdomain/zero/1.0/) applies to the data made available in this article, unless otherwise stated.
inflammation), in conjunction with a broader set of otherpotentially relevant information (e.g. environmentalexposures or genetic characteristics), contribute towardsspecific clinical manifestations of different atopic diseases(e.g. asthma vs. eczema). In the past decades, severalapproaches to predict such current or subsequent clinicalmanifestations, both in children and adults, have beenintroduced[14-22]. The performance of prediction mod-els varies in relation to different population strata, andobviously in relation to the clinical outcome or end-pointdefinitions. For instance, one of the earliest works, byCastro-Rodríguez et al.[14], devised a rule-based asthmapredictive index to predict subsequent asthma amongstyoung children with a history of wheezing, attaining sen-sitivity ~0.4 at ~0.8 specificity on various time points.The recent work by Chatzimichail et al.[23] reported~0.95 of both sensitivity and specificity in predicting cur-rent asthma in symptomatic preschool children, using amachine learning approach based on previous symptoms,medications, allergen sensitisation and lung function.In this work, using a rich data set from an unselected
cross-sectional population study, different operationaldefinitions of current asthma, wheeze and eczema arecarefully derived, and we analyse their prognostic factorsfrom a large set of markers, which includes demographic,clinical, laboratory features, genetic profiles and environ-mental exposures. Of note, previous diagnoses (along withanti-asthma medication usage) are removed on purposefrom the input set, as many clinical outcome definitionsare recursively based on them. The aim is to identify towhich extent such heterogeneous information contributesand combines towards the prediction of a specific clinicalpresentation - comparing linear and non-linear machinelearning models fitted with different feature combinations- and eventually prepare the grounds for the deploymentof a personalized diagnostic tool.
MethodsThe study population comprised a cross-sectional sampleof adult individuals, age ≥18 years, including representativesof the general population enriched by subjects with asthma[13,24]. For the sample from the general population, weapproached parents of children who have been under activefollow-up in the Manchester Asthma and Allergy Study(population-based birth cohort study)[25]. The populationof subjects with asthma included well-phenotyped adultswho were identified from a clinical trials database, and hadboth a history of physician-diagnosed asthma and asthmasymptoms within the previous 12 months[26,27]. The studywas approved by the Local Research Ethics Committee(05/Q1406/70) and is registered as N0226171141. Writteninformed consent was obtained from all subjects.A total of 1,102 attributes of the study participants
were collected across a large heterogeneous information
spectrum, including interviewer-administered question-naires, laboratory measurements, doctors’ diagnoses andenvironmental exposures. The collected data included:
• demographic information (e.g. gender, ethnicity,age, place of residence);• questionnaire data related to symptom presenceand severity (e.g. wheeze, shortness of breath, chroniccough), previous/current diagnoses of asthma, hayfever, eczema, food allergies or other illnesses;• use of anti-asthma medications (e.g. short-actingbeta agonists [SABA], long-acting beta agonists[LABA], inhaled corticosteroids [ICS]);• questionnaire data on smoking and alcohol drinkinghabits, current pet ownership, indoor environmentalconditions (e.g. rugs, beds, type of house heating, latexusage), occupation and occupation-related accidents;• objective measures on environmental exposure tohouse dust mite (Der p 1), cat (Fel d 1) and dog (Canf 1) allergen determined in dust samples collectedfrom homes using enzyme-linked immunosorbentassays (ELISAs);• objective measures on environmental exposure toendotoxin (marker of exposure to gram-negative bac-teria) and beta glucan (marker of exposure to moulds)determined in dust samples collected from homes;• body measurements (e.g. height, weight, body massindex [BMI], fat percentage, whole body impedance);• lung function measurements (e.g. forced expiratoryvolume in 1 second [FEV1], forced vital capacity [FVC],peak expiratory flow [PEF], functional reserve capacity[FRC] and residual volume [RV], total lung capacity[TLC], forced expiratory flow 25-75% [FEF25-75] andspecific airway resistance [sRaw]);• measurement of airway inflammation (exhalednitric oxide [eNO])• measurement of airway hyper-responsiveness usingmethacholine challenge, expressed as a provocativeconcentration of methacholine needed to produce a20% fall in FEV1 (PC20), and methacholine dose-response slope (MDRS);• assessment of atopic status using (i) skin prick tests(SPT), (ii) measurement of serum allergen-specificImmunoglobulin E values (IgE), and (iii) componentresolved diagnostics using an immuno-dot blot aspreviously described[28].
In addition, as part of a candidate gene associationstudy, subjects were genotyped for 215 single nucleotidepolymorphisms (SNPs) in genes found to be associatedwith asthma in previous studies (including polymorphismsin chromosomal regions 20p13-p12 and 17q12-21)[24].We used the following (partly overlapping) definitions
of asthma, wheeze and eczema.
Prosperi et al. BMC Medical Genomics 2014, 7(Suppl 1):S7http://www.biomedcentral.com/1755-8794/7/S1/S7
Page 2 of 10
Asthma was encoded with three “operational defini-tions” determined by questionnaire, specifically:
i. current asthma (CA), based on De Marco et al.[29],defined as asthma ever confirmed by a doctor and atleast one symptom of wheeze, nocturnal chest tight-ness, asthma attack within the past 12 months,attacks of breathlessness following activity, at rest orat night-time, having taken anti-asthma medication;ii. level-2 ECRHS II[30] definition (A2), as two positiveanswers to the questions “have you been woken by anattack of shortness of breath at any time in the last 12months”, “have you had an attack of asthma in the last12 months”, “are you currently taking any medicinesincluding inhalers, aerosol or tablets for asthma";iii. level-3 ECRHS II definition (A3), as three positiveanswers out of the set described at the previous point.
Current wheeze (CW) was defined, according to Pekka-nen et al.[31], as the presence of wheeze/breathlessness inthe previous 12 months outside colds.Eczema was defined as self-diagnosed (SDE) or doctor-
confirmed (DDE) eczema.Out of the 1,102 original non-genetic attributes, 223
were selected by clinical researchers, excluding factorsconsidered as irrelevant or completely redundant, andthose that were defining features of diagnoses. Attri-butes were grouped into: demographic/environmentalvariables (n = 74, including age, gender, BMI, wholebody impedance, housing conditions, pet ownership,plus n = 56 variables measuring environmental expo-sures to endotoxin, beta glucan and indoor allergens);lung function, airway inflammation and airway hyper-responsiveness markers (n = 12, including eNO, % pre-dicted FEV1, FVC, FEV1/FVC, FEF25-75, sRaw, PEF, TLC,RV, methacholine challenge MDRS and PC20); allergensensitization assessed either by skin prick testing, speci-fic serum IgE measurement or component resolveddiagnostics (n = 8, n = 7, n = 66, respectively), recordingmean wheal diameters (MWD) and IgE levels, whichwere either log-transformed or discretized into orderedquartile categories (where a negative or below limit ofdetection result was the zero-order category). All 215SNPs were retained and merged to the data set. Beforedata merge, raw SNP data were processed through link-age-disequilibrium filtering/imputation using Haploview[32] and the method of Gabriel et al.[33] (as describedin the previous work by Marinho et al.[24]). Other miss-ing values were replaced by column-wise median andmodes depending on the data types.For descriptive statistics and comparison with other
prediction methods, information about previous diag-noses and medication usage (ICS, SABA, LABA) wasretained but not used as input for the main models.
Main-effects logistic regression (LR) models were fittedselecting features by means of the LogitBoost algorithm[34]. For comparison purposes, a LR model made by thebest single predictor according to the Akaike informationcriterion (named one rule, OR) was considered[35]. A deci-sion tree model (DT)[36] and a decision tree ensemble, therandom forest (RF, 250 trees)[37] were also evaluated,along with the AdaBoost (AB) classifier[38]. Goodness-of-fit functions examined were: accuracy, i.e. percentage ofcorrectly classified cases; area under the receiver operatingcharacteristic curve (AUROC), which is equal to the prob-ability that a classifier ranks a randomly chosen positiveinstance (e.g. condition present/diagnosed) higher than arandomly chosen negative one (e.g. condition absent); sen-sitivity, i.e. the probability that the classification is positivewhen the condition is present (true positive rate); specifi-city, i.e. the probability that the classification is negativewhen the condition is not present (true negative rate).Model performance was estimated and compared as extra-sample via bootstrapping (100 replicates), considering out-of-bag distributions, and assessing significance via t-testsadjusted for sample overlap and multiple comparisons[39-41]. Attribute importance was assessed by means ofRF, calculating the average re-scaled (i.e. divided by itsstandard error) decrease in accuracy by variable randomi-zation (repeated for 1000 times), and comparing it againsta null distribution obtained by shuffling outcome labels,calculating p-values according to the method of Altmannet al.[42] and previous works[43,44]. All analyses werecarried out using R software (http://www.r-project.org/).
ResultsCharacteristics of the study populationThe study population included 554 subjects, with amean (standard deviation) age of 43 (5) years at thetime of the assessment, 42% male, 38% previous or cur-rent smokers. The proportion of CA, CW and DDEwere 16.7%, 12.3%, and 21.7%, respectively. Subjects’characteristics are described in detail in Table 1, as wellas cross-tabulation of outcomes. There was a high levelof agreement between SDE and DDE (95.5%), as well asbetween CA, A2, A3 and CW (from 95.3% of CA vs. A2to 87.7% of CA vs. A3), as expected by their intersectingdefinitions. The lowest agreement was found betweenSDE and CW (73.4%). For ease of reading, we haveomitted information about genetic data, which has beendescribed in detail previously[24] (available uponrequest). Of note, 73.2% attributes had no missing data,and the amount of missingness in the rest was a median(interquartile range, IQR) of 0.7% (0.2%-2.2%).
Model inferenceGiven the levels of agreement between outcomes, infer-ence results will be presented here for CA, CW and DDE
Prosperi et al. BMC Medical Genomics 2014, 7(Suppl 1):S7http://www.biomedcentral.com/1755-8794/7/S1/S7
Page 3 of 10
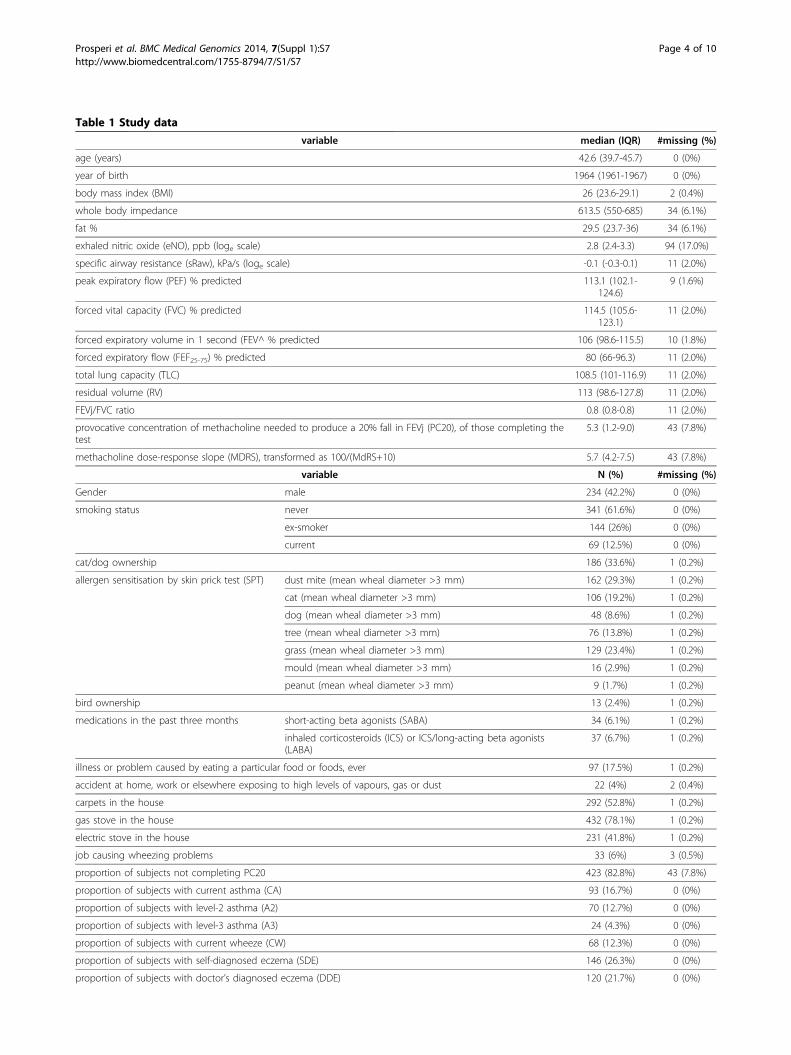
Table 1 Study data
variable median (IQR) #missing (%)
age (years) 42.6 (39.7-45.7) 0 (0%)
year of birth 1964 (1961-1967) 0 (0%)
body mass index (BMI) 26 (23.6-29.1) 2 (0.4%)
whole body impedance 613.5 (550-685) 34 (6.1%)
fat % 29.5 (23.7-36) 34 (6.1%)
exhaled nitric oxide (eNO), ppb (loge scale) 2.8 (2.4-3.3) 94 (17.0%)
specific airway resistance (sRaw), kPa/s (loge scale) -0.1 (-0.3-0.1) 11 (2.0%)
peak expiratory flow (PEF) % predicted 113.1 (102.1-124.6)
9 (1.6%)
forced vital capacity (FVC) % predicted 114.5 (105.6-123.1)
11 (2.0%)
forced expiratory volume in 1 second (FEV^ % predicted 106 (98.6-115.5) 10 (1.8%)
forced expiratory flow (FEF25-75) % predicted 80 (66-96.3) 11 (2.0%)
total lung capacity (TLC) 108.5 (101-116.9) 11 (2.0%)
residual volume (RV) 113 (98.6-127.8) 11 (2.0%)
FEVj/FVC ratio 0.8 (0.8-0.8) 11 (2.0%)
provocative concentration of methacholine needed to produce a 20% fall in FEVj (PC20), of those completing thetest
5.3 (1.2-9.0) 43 (7.8%)
methacholine dose-response slope (MDRS), transformed as 100/(MdRS+10) 5.7 (4.2-7.5) 43 (7.8%)
variable N (%) #missing (%)
Gender male 234 (42.2%) 0 (0%)
smoking status never 341 (61.6%) 0 (0%)
ex-smoker 144 (26%) 0 (0%)
current 69 (12.5%) 0 (0%)
cat/dog ownership 186 (33.6%) 1 (0.2%)
allergen sensitisation by skin prick test (SPT) dust mite (mean wheal diameter >3 mm) 162 (29.3%) 1 (0.2%)
cat (mean wheal diameter >3 mm) 106 (19.2%) 1 (0.2%)
dog (mean wheal diameter >3 mm) 48 (8.6%) 1 (0.2%)
tree (mean wheal diameter >3 mm) 76 (13.8%) 1 (0.2%)
grass (mean wheal diameter >3 mm) 129 (23.4%) 1 (0.2%)
mould (mean wheal diameter >3 mm) 16 (2.9%) 1 (0.2%)
peanut (mean wheal diameter >3 mm) 9 (1.7%) 1 (0.2%)
bird ownership 13 (2.4%) 1 (0.2%)
medications in the past three months short-acting beta agonists (SABA) 34 (6.1%) 1 (0.2%)
inhaled corticosteroids (ICS) or ICS/long-acting beta agonists(LABA)
37 (6.7%) 1 (0.2%)
illness or problem caused by eating a particular food or foods, ever 97 (17.5%) 1 (0.2%)
accident at home, work or elsewhere exposing to high levels of vapours, gas or dust 22 (4%) 2 (0.4%)
carpets in the house 292 (52.8%) 1 (0.2%)
gas stove in the house 432 (78.1%) 1 (0.2%)
electric stove in the house 231 (41.8%) 1 (0.2%)
job causing wheezing problems 33 (6%) 3 (0.5%)
proportion of subjects not completing PC20 423 (82.8%) 43 (7.8%)
proportion of subjects with current asthma (CA) 93 (16.7%) 0 (0%)
proportion of subjects with level-2 asthma (A2) 70 (12.7%) 0 (0%)
proportion of subjects with level-3 asthma (A3) 24 (4.3%) 0 (0%)
proportion of subjects with current wheeze (CW) 68 (12.3%) 0 (0%)
proportion of subjects with self-diagnosed eczema (SDE) 146 (26.3%) 0 (0%)
proportion of subjects with doctor’s diagnosed eczema (DDE) 120 (21.7%) 0 (0%)
Prosperi et al. BMC Medical Genomics 2014, 7(Suppl 1):S7http://www.biomedcentral.com/1755-8794/7/S1/S7
Page 4 of 10
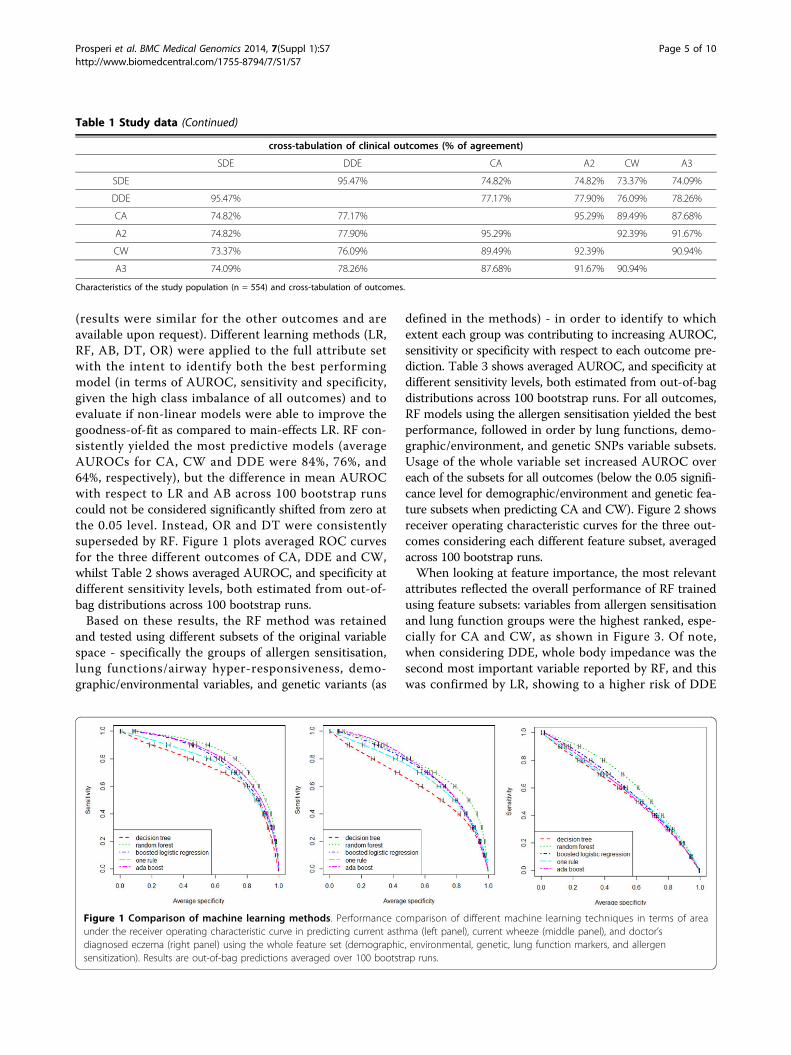
(results were similar for the other outcomes and areavailable upon request). Different learning methods (LR,RF, AB, DT, OR) were applied to the full attribute setwith the intent to identify both the best performingmodel (in terms of AUROC, sensitivity and specificity,given the high class imbalance of all outcomes) and toevaluate if non-linear models were able to improve thegoodness-of-fit as compared to main-effects LR. RF con-sistently yielded the most predictive models (averageAUROCs for CA, CW and DDE were 84%, 76%, and64%, respectively), but the difference in mean AUROCwith respect to LR and AB across 100 bootstrap runscould not be considered significantly shifted from zero atthe 0.05 level. Instead, OR and DT were consistentlysuperseded by RF. Figure 1 plots averaged ROC curvesfor the three different outcomes of CA, DDE and CW,whilst Table 2 shows averaged AUROC, and specificity atdifferent sensitivity levels, both estimated from out-of-bag distributions across 100 bootstrap runs.Based on these results, the RF method was retained
and tested using different subsets of the original variablespace - specifically the groups of allergen sensitisation,lung functions/airway hyper-responsiveness, demo-graphic/environmental variables, and genetic variants (as
defined in the methods) - in order to identify to whichextent each group was contributing to increasing AUROC,sensitivity or specificity with respect to each outcome pre-diction. Table 3 shows averaged AUROC, and specificity atdifferent sensitivity levels, both estimated from out-of-bagdistributions across 100 bootstrap runs. For all outcomes,RF models using the allergen sensitisation yielded the bestperformance, followed in order by lung functions, demo-graphic/environment, and genetic SNPs variable subsets.Usage of the whole variable set increased AUROC overeach of the subsets for all outcomes (below the 0.05 signifi-cance level for demographic/environment and genetic fea-ture subsets when predicting CA and CW). Figure 2 showsreceiver operating characteristic curves for the three out-comes considering each different feature subset, averagedacross 100 bootstrap runs.When looking at feature importance, the most relevant
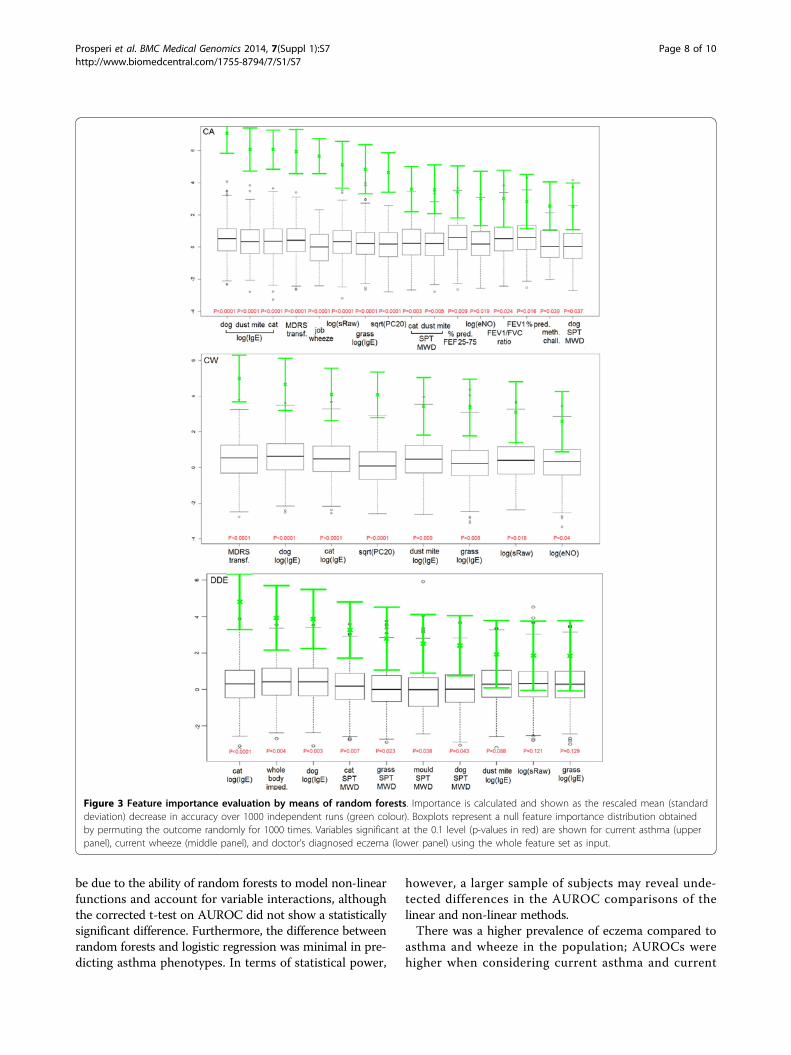
attributes reflected the overall performance of RF trainedusing feature subsets: variables from allergen sensitisationand lung function groups were the highest ranked, espe-cially for CA and CW, as shown in Figure 3. Of note,when considering DDE, whole body impedance was thesecond most important variable reported by RF, and thiswas confirmed by LR, showing to a higher risk of DDE
Figure 1 Comparison of machine learning methods. Performance comparison of different machine learning techniques in terms of areaunder the receiver operating characteristic curve in predicting current asthma (left panel), current wheeze (middle panel), and doctor’sdiagnosed eczema (right panel) using the whole feature set (demographic, environmental, genetic, lung function markers, and allergensensitization). Results are out-of-bag predictions averaged over 100 bootstrap runs.
Table 1 Study data (Continued)
cross-tabulation of clinical outcomes (% of agreement)
SDE DDE CA A2 CW A3
SDE 95.47% 74.82% 74.82% 73.37% 74.09%
DDE 95.47% 77.17% 77.90% 76.09% 78.26%
CA 74.82% 77.17% 95.29% 89.49% 87.68%
A2 74.82% 77.90% 95.29% 92.39% 91.67%
CW 73.37% 76.09% 89.49% 92.39% 90.94%
A3 74.09% 78.26% 87.68% 91.67% 90.94%
Characteristics of the study population (n = 554) and cross-tabulation of outcomes.
Prosperi et al. BMC Medical Genomics 2014, 7(Suppl 1):S7http://www.biomedcentral.com/1755-8794/7/S1/S7
Page 5 of 10
(OR 1.19 per square root increase, 95% CI 1.13-1.27,p-value = 0.0016), and found to be correlated to BMI(Pearson’s r=-0.54, p-value<0.0001). No SNPs were scoredwithin the 25th percentile of RF importance, but crudeassociations with asthma symptoms were confirmed.When considering CW, rs4986790 was the SNP with high-est level of association using a chi-square test on allelecategories (unadjusted p = 0.005), whilst rs6037651 usingthe additive model (unadjusted p = 0.003). When consid-ering DDE, rs2569190 (unadjusted p = 0.003 from chi-square) and rs574174 (unadjusted p = 0.004 from additivemodel). However their significance was not below the 0.05level when correcting for multiple testing (using Benja-mini-Hochberg correction). For CA, rs7212938 andrs8079416 were the top-scoring SNPs under the categori-cal and additive model, respectively (unadjusted p =0.0002 and p = 0.0006), and the significance remainedbelow the 0.1 level after adjusting for multiple testing (p =0.09 and p = 0.03).To compare more thoroughly RF with LR, we analysed
the variable sets selected by the LogitBoost algorithm.Specifically, for CW, five predictors were selected: IgE ofhouse dust mite (OR = 1.207 per loge higher, p = 0.005);IgE of dog (OR = 1.465 per loge higher, p < 0.0001); num-ber of cigarettes smoked (OR = 1.032 per packages/year,p = 0.003); moving house (OR = 3.078 for moving twiceor more as compared to not moving, p = 0.001); MDRS(OR = 0.794 per transformed unit p = 0.0004). For CA,nine predictors were selected: IgE of house dust mite(OR = 1.308 per loge higher, p < 0.0001); IgE of dog (OR
= 1.519 per loge higher, p < 0.0001); job causing wheezingproblems (OR = 13.923 for presence of condition; p <0.0001); rs8079416 (OR = 0.502 as additive model;p = 0.002); rs11540720 (OR = 0.182 as additive model;p = 0.008); rs5743704 (OR = 0.265 as additive model; p =0.011); rs11536889 (OR = 0.265 as additive model; p =0.011); sRaw (OR = 6.509 per loge higher; p = 0.0009);MDRS (OR = 0.839 per transformed unit p = 0.013). ForDDE, one predictor was selected, the IgE of cat (OR =1.378 per loge higher, p < 0.0001). All features selected byLogitBoost were listed as top-ranked variables by the RF,except for SNPs in the CA outcome. Note that these LRmodels were obtained from one data set using a singleLogitBoost selection, and - given also the degree of corre-lation among variables - alternative models with equalperformance may be selected by varying selectionheuristics.
DiscussionWe investigated the ability of linear and non-linearmachine learning models to predict asthma, wheezing,and eczema outcomes, according to different operationaldefinitions, with a heterogeneous set of attributes in anadult population. Models were compared in terms of per-formance, complexity and interpretability. Different fea-ture groups were evaluated and combined in order tounderstand determinants (and combinations thereof) ofasthma symptoms or the presence of eczema. The use ofrandom forests in model building yielded better AUROC,sensitivity and specificity than other methods. This might
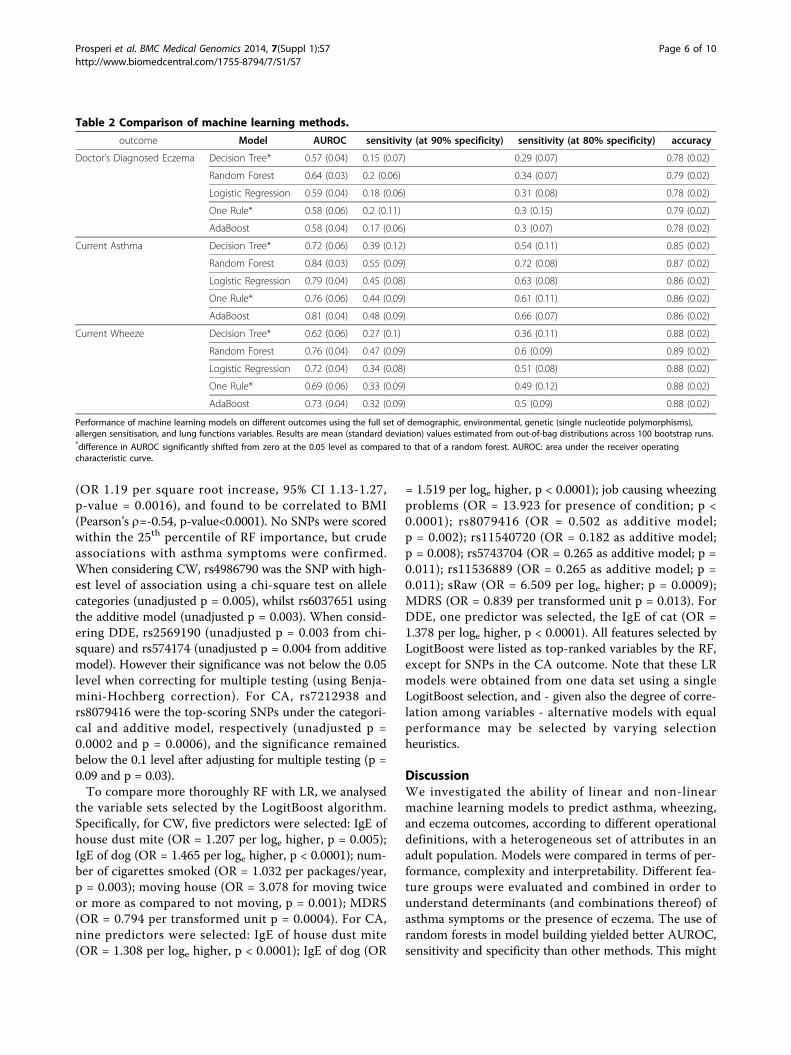
Table 2 Comparison of machine learning methods.
outcome Model AUROC sensitivity (at 90% specificity) sensitivity (at 80% specificity) accuracy
Doctor’s Diagnosed Eczema Decision Tree* 0.57 (0.04) 0.15 (0.07) 0.29 (0.07) 0.78 (0.02)
Random Forest 0.64 (0.03) 0.2 (0.06) 0.34 (0.07) 0.79 (0.02)
Logistic Regression 0.59 (0.04) 0.18 (0.06) 0.31 (0.08) 0.78 (0.02)
One Rule* 0.58 (0.06) 0.2 (0.11) 0.3 (0.15) 0.79 (0.02)
AdaBoost 0.58 (0.04) 0.17 (0.06) 0.3 (0.07) 0.78 (0.02)
Current Asthma Decision Tree* 0.72 (0.06) 0.39 (0.12) 0.54 (0.11) 0.85 (0.02)
Random Forest 0.84 (0.03) 0.55 (0.09) 0.72 (0.08) 0.87 (0.02)
Logistic Regression 0.79 (0.04) 0.45 (0.08) 0.63 (0.08) 0.86 (0.02)
One Rule* 0.76 (0.06) 0.44 (0.09) 0.61 (0.11) 0.86 (0.02)
AdaBoost 0.81 (0.04) 0.48 (0.09) 0.66 (0.07) 0.86 (0.02)
Current Wheeze Decision Tree* 0.62 (0.06) 0.27 (0.1) 0.36 (0.11) 0.88 (0.02)
Random Forest 0.76 (0.04) 0.47 (0.09) 0.6 (0.09) 0.89 (0.02)
Logistic Regression 0.72 (0.04) 0.34 (0.08) 0.51 (0.08) 0.88 (0.02)
One Rule* 0.69 (0.06) 0.33 (0.09) 0.49 (0.12) 0.88 (0.02)
AdaBoost 0.73 (0.04) 0.32 (0.09) 0.5 (0.09) 0.88 (0.02)
Performance of machine learning models on different outcomes using the full set of demographic, environmental, genetic (single nucleotide polymorphisms),allergen sensitisation, and lung functions variables. Results are mean (standard deviation) values estimated from out-of-bag distributions across 100 bootstrap runs.*difference in AUROC significantly shifted from zero at the 0.05 level as compared to that of a random forest. AUROC: area under the receiver operatingcharacteristic curve.
Prosperi et al. BMC Medical Genomics 2014, 7(Suppl 1):S7http://www.biomedcentral.com/1755-8794/7/S1/S7
Page 6 of 10
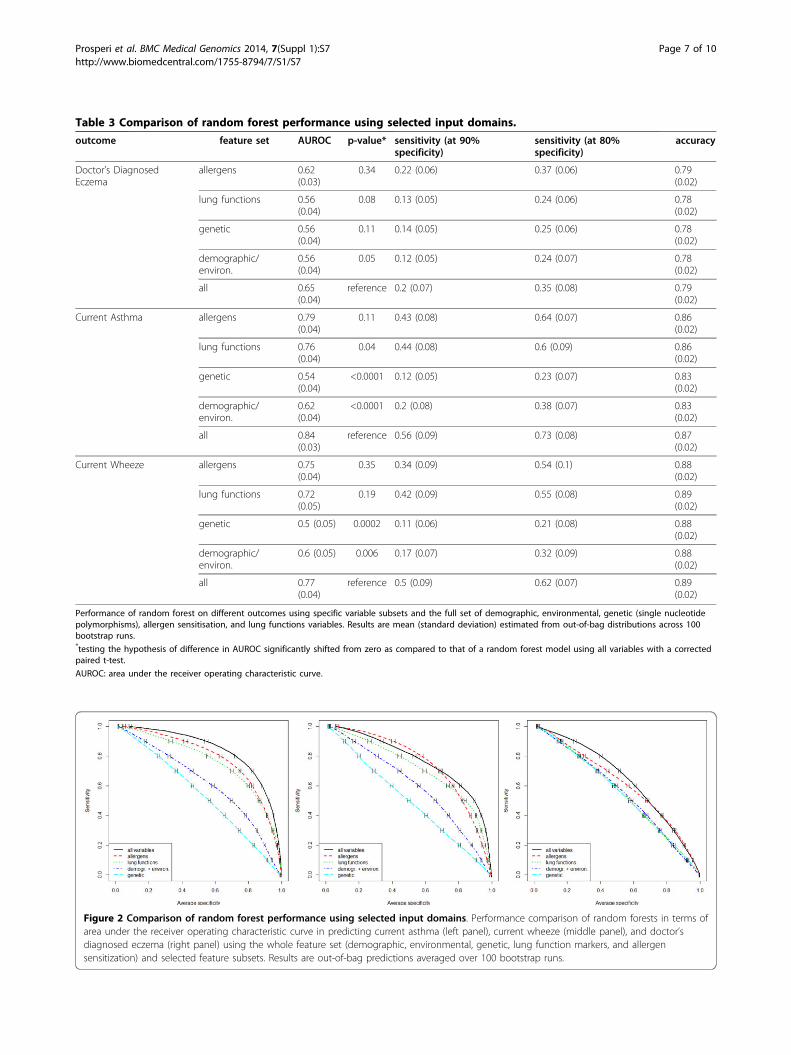
Table 3 Comparison of random forest performance using selected input domains.
outcome feature set AUROC p-value* sensitivity (at 90%specificity)
sensitivity (at 80%specificity)
accuracy
Doctor’s DiagnosedEczema
allergens 0.62(0.03)
0.34 0.22 (0.06) 0.37 (0.06) 0.79(0.02)
lung functions 0.56(0.04)
0.08 0.13 (0.05) 0.24 (0.06) 0.78(0.02)
genetic 0.56(0.04)
0.11 0.14 (0.05) 0.25 (0.06) 0.78(0.02)
demographic/environ.
0.56(0.04)
0.05 0.12 (0.05) 0.24 (0.07) 0.78(0.02)
all 0.65(0.04)
reference 0.2 (0.07) 0.35 (0.08) 0.79(0.02)
Current Asthma allergens 0.79(0.04)
0.11 0.43 (0.08) 0.64 (0.07) 0.86(0.02)
lung functions 0.76(0.04)
0.04 0.44 (0.08) 0.6 (0.09) 0.86(0.02)
genetic 0.54(0.04)
<0.0001 0.12 (0.05) 0.23 (0.07) 0.83(0.02)
demographic/environ.
0.62(0.04)
<0.0001 0.2 (0.08) 0.38 (0.07) 0.83(0.02)
all 0.84(0.03)
reference 0.56 (0.09) 0.73 (0.08) 0.87(0.02)
Current Wheeze allergens 0.75(0.04)
0.35 0.34 (0.09) 0.54 (0.1) 0.88(0.02)
lung functions 0.72(0.05)
0.19 0.42 (0.09) 0.55 (0.08) 0.89(0.02)
genetic 0.5 (0.05) 0.0002 0.11 (0.06) 0.21 (0.08) 0.88(0.02)
demographic/environ.
0.6 (0.05) 0.006 0.17 (0.07) 0.32 (0.09) 0.88(0.02)
all 0.77(0.04)
reference 0.5 (0.09) 0.62 (0.07) 0.89(0.02)
Performance of random forest on different outcomes using specific variable subsets and the full set of demographic, environmental, genetic (single nucleotidepolymorphisms), allergen sensitisation, and lung functions variables. Results are mean (standard deviation) estimated from out-of-bag distributions across 100bootstrap runs.*testing the hypothesis of difference in AUROC significantly shifted from zero as compared to that of a random forest model using all variables with a correctedpaired t-test.
AUROC: area under the receiver operating characteristic curve.
Figure 2 Comparison of random forest performance using selected input domains. Performance comparison of random forests in terms ofarea under the receiver operating characteristic curve in predicting current asthma (left panel), current wheeze (middle panel), and doctor’sdiagnosed eczema (right panel) using the whole feature set (demographic, environmental, genetic, lung function markers, and allergensensitization) and selected feature subsets. Results are out-of-bag predictions averaged over 100 bootstrap runs.
Prosperi et al. BMC Medical Genomics 2014, 7(Suppl 1):S7http://www.biomedcentral.com/1755-8794/7/S1/S7
Page 7 of 10
be due to the ability of random forests to model non-linearfunctions and account for variable interactions, althoughthe corrected t-test on AUROC did not show a statisticallysignificant difference. Furthermore, the difference betweenrandom forests and logistic regression was minimal in pre-dicting asthma phenotypes. In terms of statistical power,
however, a larger sample of subjects may reveal unde-tected differences in the AUROC comparisons of thelinear and non-linear methods.There was a higher prevalence of eczema compared to
asthma and wheeze in the population; AUROCs werehigher when considering current asthma and current
Figure 3 Feature importance evaluation by means of random forests. Importance is calculated and shown as the rescaled mean (standarddeviation) decrease in accuracy over 1000 independent runs (green colour). Boxplots represent a null feature importance distribution obtainedby permuting the outcome randomly for 1000 times. Variables significant at the 0.1 level (p-values in red) are shown for current asthma (upperpanel), current wheeze (middle panel), and doctor’s diagnosed eczema (lower panel) using the whole feature set as input.
Prosperi et al. BMC Medical Genomics 2014, 7(Suppl 1):S7http://www.biomedcentral.com/1755-8794/7/S1/S7
Page 8 of 10
wheeze outcomes (0.84 and 0.76), lower for doctor’s diag-nosed eczema (0.64). Results show clearly that there isa benefit of merging information from different sources,e.g. lung functions, allergen sensitization tests, genetic mar-kers, demographics and environment. However, in generalall models were characterized by a relatively low sensitivitywith any feature set combination. A lower sensitivity wasobtained compared to that of Chatzimichail et al.[23], whoused a similar outcome definition: this is because we expli-citly excluded any previous personal and familiar diagnosisof asthma, wheeze and eczema from the input set, giventhe fact that outcomes are often defined recursively on pre-vious episodes. In fact, when utilising previous diagnoses(plus anti-asthma medication usage), sensitivity increasedto ≥0.8 (≥0.9 when including anti-asthma medication usagevariables) at a minimum specificity of 0.9. However, directcomparison with other methods is only qualitative giventhe different study designs and populations.Regarding the importance of features, our findings con-
firm the important contribution of allergen sensitization(dust mite, dog, cat), along with lung function markers, inpredicting asthma diagnoses or symptom patterns. Thepredictive ability of genetic markers alone is limited,although for the current asthma outcome the LogitBoostalgorithm selected a few over the whole set of variables.Our AUROCs for SNPs are in line with the previous esti-mates of Spycher et al.[20], who analysed the genome-wideprediction of childhood asthma and related phenotypes ina longitudinal birth cohort (reporting AUROC of 0.59 forwheeze and of 0.54 for asthma). However, our analysis wasnot focused on genetic markers: a limited population sam-ple, in terms of the set candidate SNPs as well as of envir-onmental markers, can decrease the power to look forSNP-environment interactions effectively; therefore a moreaccurate study design is warranted for this objective.We observed interesting novel and biologically plausible
association between bio-impedance and eczema. Previousstudies have found that whole body impedance is asso-ciated with steroid treatments[45] and several types of cuta-neous reactions[46], including an indirect association toFilaggrin-related eczema (via stratum corneum hydration)[47]. Further investigation of this association is warranted.Limitation of our study include the use of an in-house,
rather than externally validated assay for componentresolved diagnostics (however, this metric was coupledwith validated skin prick testing and blood Immunoglobu-lin E testing), and the facts that genetic analysis wasrestricted to candidate genes. Another potential limitationwas the naïve policy for missing value imputation; howeverthe extent of missing information was negligible.
ConclusionsBeing a cross-sectional study, with no longitudinalseparation of predictors and outcomes, this study is not
intended to assess different approaches to causal infer-ence. However, our data demonstrate that even withcross-sectional data, there is considerable scope to buildmore usefully complex models to better understandasthma and other complex diseases (such as eczema).Future studies might incorporate more factors/attributesand harness longitudinal data in the prediction of laterclinical outcomes.
Competing interestsThe authors have no competing interests to declare in relation to thismanuscript.
Authors’ contributionsMCFP manuscript writing, machine learning analysis; SM genetic data pre-processing, data collection; AS study design, data collection; AC studydesign, data management; IEB statistical review. All authors reviewed andcontributed to specific sections of the manuscript.
DeclarationsPublication for this article has been funded by grants from J P MoultonCharitable Foundation (sponsoring the MAAS cohort), Medical ResearchCouncil (MRC) grants G0601361, MR/K002449/1, University of Manchester’sLibrary via the Research Councils UK (for open-access publications), and bythe MRC Health eResearch Centre (HeRC) grant MR/K006665/1.This article has been published as part of BMC Medical Genomics Volume 7Supplement 1, 2014: Selected articles from the 3rd TranslationalBioinformatics Conference (TBC/ISCB-Asia 2013). The full contents of thesupplement are available online at http://www.biomedcentral.com/bmcmedgenomics/supplements/7/S1.
Authors’ details1Centre for Health Informatics, Institute of Population Health, Faculty ofMedical and Human Sciences, University of Manchester, Manchester, UK.2Centre for Respiratory Medicine and Allergy, Institute of Inflammation andRepair, University of Manchester, Manchester, UK.
Published: 8 May 2014
References1. Papierniak ES, Lowenthal DT, Harman E: Novel therapies in asthma:
leukotriene antagonists, biologic agents, and beyond. Am J Ther 2013,20(1):79-103.
2. Bacharier LB, Guilbert TW: Diagnosis and management of early asthma inpreschool-aged children. J Allergy Clin Immunol 2012, 130(2):287-296, quiz297-288.
3. Lotvall J, Akdis CA, Bacharier LB, Bjermer L, Casale TB, Custovic A,Lemanske RF, Wardlaw AJ, Wenzel SE, Greenberger PA: Asthma endotypes:a new approach to classification of disease entities within the asthmasyndrome. J Allergy Clin Immunol 2011, 127(2):355-360.
4. Sittka A, Vera J, Lai X, Schmeck B: Asthma phenotyping, therapy, andprevention: what can we learn from systems biology? Pediatr Res 2013.
5. Taylor PE, Jacobson KW, House JM, Glovsky MM: Links between pollen,atopy and the asthma epidemic. International archives of allergy andimmunology 2007, 144(2):162-170.
6. Gent JF, Belanger K, Triche EW, Bracken MB, Beckett WS, Leaderer BP:Association of pediatric asthma severity with exposure to commonhousehold dust allergens. Environmental research 2009, 109(6):768-774.
7. Wang J, Calatroni A, Visness CM, Sampson HA: Correlation of specific IgEto shrimp with cockroach and dust mite exposure and sensitization inan inner-city population. J Allergy Clin Immunol 2011, 128(4):834-837.
8. Sordillo JE, Webb T, Kwan D, Kamel J, Hoffman E, Milton DK, Gold DR:Allergen exposure modifies the relation of sensitization to fraction ofexhaled nitric oxide levels in children at risk for allergy and asthma.J Allergy Clin Immunol 2011, 127(5):1165-1172 e1165.
9. Burrows B, Martinez FD, Halonen M, Barbee RA, Cline MG: Association ofasthma with serum IgE levels and skin-test reactivity to allergens. NEngl J Med 1989, 320(5):271-277.
Prosperi et al. BMC Medical Genomics 2014, 7(Suppl 1):S7http://www.biomedcentral.com/1755-8794/7/S1/S7
Page 9 of 10
10. Beeh KM, Ksoll M, Buhl R: Elevation of total serum immunoglobulin E isassociated with asthma in nonallergic individuals. The Europeanrespiratory journal : official journal of the European Society for ClinicalRespiratory Physiology 2000, 16(4):609-614.
11. Simpson BM, Custovic A, Simpson A, Hallam CL, Walsh D, Marolia H,Campbell J, Woodcock A: NAC Manchester Asthma and Allergy Study(NACMAAS): risk factors for asthma and allergic disorders in adults.Clinical and experimental allergy : journal of the British Society for Allergy andClinical Immunology 2001, 31(3):391-399.
12. Marinho S, Simpson A, Soderstrom L, Woodcock A, Ahlstedt S, Custovic A:Quantification of atopy and the probability of rhinitis in preschoolchildren: a population-based birth cohort study. Allergy 2007,62(12):1379-1386.
13. Marinho S, Simpson A, Marsden P, Smith JA, Custovic A: Quantification ofatopy, lung function and airway hypersensitivity in adults. Clinical andtranslational allergy 2011, 1(1):16.
14. Castro-Rodriguez JA, Holberg CJ, Wright AL, Martinez FD: A clinical indexto define risk of asthma in young children with recurrent wheezing.Am J Respir Crit Care Med 2000, 162(4 Pt 1):1403-1406.
15. Singer F, Luchsinger I, Inci D, Knauer N, Latzin P, Wildhaber JH, Moeller A:Exhaled nitric oxide in symptomatic children at preschool age predictslater asthma. Allergy 2013, 68(4):531-538.
16. Greenberg S: Asthma exacerbations: predisposing factors and predictionrules. Current opinion in allergy and clinical immunology 2013.
17. Wadsworth SJ, Sandford AJ: Personalised medicine and asthmadiagnostics/management. Current allergy and asthma reports 2013,13(1):118-129.
18. Pralong JA, Seed MJ, Yasri R, Agius RM, Cartier A, Labrecque M: Acomputer based asthma hazard prediction model and new molecularweight agents in occupational asthma. Occupational and environmentalmedicine 2013, 70(1):70.
19. Soyiri IN, Reidpath DD: Semistructured black-box prediction: proposedapproach for asthma admissions in London. International journal ofgeneral medicine 2012, 5:693-705.
20. Spycher BD, Henderson J, Granell R, Evans DM, Smith GD, Timpson NJ,Sterne JA: Genome-wide prediction of childhood asthma and relatedphenotypes in a longitudinal birth cohort. J Allergy Clin Immunol 2012,130(2):503-509 e507.
21. Savenije OE, Kerkhof M, Koppelman GH, Postma DS: Predicting who willhave asthma at school age among preschool children. J Allergy ClinImmunol 2012, 130(2):325-331.
22. Vial Dupuy A, Amat F, Pereira B, Labbe A, Just J: A simple tool to identifyinfants at high risk of mild to severe childhood asthma: the persistentasthma predictive score. The Journal of asthma : official journal of theAssociation for the Care of Asthma 2011, 48(10):1015-1021.
23. Chatzimichail E, Paraskakis E, Sitzimi M, Rigas A: An intelligent systemapproach for asthma prediction in symptomatic preschool children.Computational and mathematical methods in medicine 2013, 2013:240182.
24. Marinho S, Custovic A, Marsden P, Smith JA, Simpson A: 17q12-21 variantsare associated with asthma and interact with active smoking in an adultpopulation from the United Kingdom. Annals of allergy, asthma &immunology : official publication of the American College of Allergy, Asthma,& Immunology 2012, 108(6):402-411 e409.
25. Custovic A, Simpson BM, Murray CS, Lowe L, Woodcock A, Asthma NACM,Allergy Study G: The National Asthma Campaign Manchester Asthma andAllergy Study. Pediatric allergy and immunology : official publication of theEuropean Society of Pediatric Allergy and Immunology 2002, 13(Suppl15):32-37.
26. Langley SJ, Goldthorpe S, Craven M, Morris J, Woodcock A, Custovic A:Exposure and sensitization to indoor allergens: association with lungfunction, bronchial reactivity, and exhaled nitric oxide measures inasthma. J Allergy Clin Immunol 2003, 112(2):362-368.
27. Langley SJ, Goldthorpe S, Custovic A, Woodcock A: Relationship amongpulmonary function, bronchial reactivity, and exhaled nitric oxide in alarge group of asthmatic patients. Annals of allergy, asthma & immunology: official publication of the American College of Allergy, Asthma, &Immunology 2003, 91(4):398-404.
28. Kidon MI, Chiang WC, Liew WK, Ong TC, Tiong YS, Wong KN, Angus AC,Ong ST, Gao YF, Reginald K, et al: Mite component-specific IgE repertoireand phenotypes of allergic disease in childhood: the tropical
perspective. Pediatric allergy and immunology : official publication of theEuropean Society of Pediatric Allergy and Immunology 2011, 22(2):202-210.
29. de Marco R, Marcon A, Jarvis D, Accordini S, Almar E, Bugiani M, Carolei A,Cazzoletti L, Corsico A, Gislason D, et al: Prognostic factors of asthmaseverity: a 9-year international prospective cohort study. J Allergy ClinImmunol 2006, 117(6):1249-1256.
30. Siroux V, Boudier A, Anto JM, Cazzoletti L, Accordini S, Alonso J, Cerveri I,Corsico A, Gulsvik A, Jarvis D, et al: Quality-of-life and asthma-severity ingeneral population asthmatics: results of the ECRHS II study. Allergy 2008,63(5):547-554.
31. Pekkanen J, Sunyer J, Anto JM, Burney P, European Community RespiratoryHealth S: Operational definitions of asthma in studies on its aetiology.The European respiratory journal : official journal of the European Society forClinical Respiratory Physiology 2005, 26(1):28-35.
32. Barrett JC, Fry B, Maller J, Daly MJ: Haploview: analysis and visualization ofLD and haplotype maps. Bioinformatics 2005, 21(2):263-265.
33. Gabriel SB, Schaffner SF, Nguyen H, Moore JM, Roy J, Blumenstiel B,Higgins J, DeFelice M, Lochner A, Faggart M, et al: The structure ofhaplotype blocks in the human genome. Science 2002,296(5576):2225-2229.
34. Landwehr N, Hall M, Frank E: Logistic model trees. Mach Learn 2005,59(1-2):161-205.
35. Venables WN, Ripley BD: Modern Applied Statistics with S Springer; 2002.36. Breiman L, Friedman J, Stone C, Olshen RA: Classification and Regression
Trees. Chapman and Hall/CRC; 1984.37. Breiman L: Random forests. Mach Learn 2001, 45(1):5-32.38. Freund Y, Schapire RE: A decision-theoretic generalization of on-line
learning and an application to boosting. J Comput Syst Sci 1997,55(1):119-139.
39. Hastie T, Tibshirani R, Friedman JH: The elements of statistical learning :data mining, inference, and prediction. New York, NY: Springer;, 2 2009.
40. Nadeau C, Bengio Y: Inference for the Generalization Error. Mach Learn2003, 52(3):239-281.
41. Garcia S, Herrera F: An Extension on “Statistical Comparisons of Classifiersover Multiple Data Sets” for all Pairwise Comparisons. J Mach Learn Res2008, 9:2677-2694.
42. Altmann A, Tolosi L, Sander O, Lengauer T: Permutation importance: acorrected feature importance measure. Bioinformatics 2010,26(10):1340-1347.
43. Nicodemus KK, Malley JD, Strobl C, Ziegler A: The behaviour of randomforest permutation-based variable importance measures under predictorcorrelation. BMC Bioinformatics 2010, 11:110.
44. Strobl C, Boulesteix AL, Zeileis A, Hothorn T: Bias in random forest variableimportance measures: illustrations, sources and a solution. BMCBioinformatics 2007, 8:25.
45. Heitmann BL, Anhoj J, Bisgaard AM, Ward L, Bisgaard H: Changes in bodywater distribution during treatment with inhaled steroid in pre-schoolchildren. Annals of human biology 2004, 31(3):333-341.
46. Nyren M, Hagstromer L, Emtestam L: On assessment of skin reactivityusing electrical impedance. Ann Ny Acad Sci 1999, 873:214-220.
47. Nemoto-Hasebe I, Akiyama M, Nomura T, Sandilands A, McLean WHI,Shimizu H: Clinical Severity Correlates with Impaired Barrier in Filaggrin-Related Eczema. J Invest Dermatol 2009, 129(3):682-689.
doi:10.1186/1755-8794-7-S1-S7Cite this article as: Prosperi et al.: Predicting phenotypes of asthma andeczema with machine learning. BMC Medical Genomics 2014 7(Suppl 1):S7.
Prosperi et al. BMC Medical Genomics 2014, 7(Suppl 1):S7http://www.biomedcentral.com/1755-8794/7/S1/S7
Page 10 of 10