Embed Size (px)
Citation preview
KNEE ARTHROPLASTY
Predicting patient satisfaction using the Oxford knee score:where do we draw the line?
Nicholas D. Clement • Deborah Macdonald •
Richard Burnett
Received: 21 January 2013 / Published online: 24 March 2013
� Springer-Verlag Berlin Heidelberg 2013
Abstract
Objectives The aim of this study was to identify threshold
values in the pre- and post-operative Oxford knee score
(OKS), and change in the score for differing levels of
patient satisfaction with their total knee replacement
(TKR).
Methods We prospectively collected pre-operative and
1-year post-operative OKS for 2392 patients undergoing a
TKR. Patient satisfaction was categorically assessed,
according to whether they were: very satisfied, satisfied,
neutral, and unsatisfied. Receiver operating characteristic
curve analysis was used to identify thresholds in the OKS
score that identified each level of patient satisfaction.
Results The post-operative OKS was the most accurate
predictor of the level of patient satisfaction (area under the
curve = 0.86). Very satisfied patients had a threshold value
in the post-operative OKS of C36, which decreased to C27
points for satisfied patients, and further still to B25 for
unsatisfied patients.
Conclusion The threshold values, we have identified for
the different levels of satisfaction using the post-operative
OKS, which is the most accurate predictor, can be used to
predict level of patient satisfaction and give quantification
of the OKS.
Keywords Satisfaction � Total knee replacement �Outcome � Oxford score � Thresholds
Introduction
Patient reported outcome measures (PROMs) are now
routinely collected for audit and research purposes [1]. The
Oxford knee score [2] (OKS) is the PROM of choice to
evaluate total knee replacement (TKR) in England and
Wales and has been approved for audit and performance
assessment purposes [3]. Despite collecting these data, it is
not clear how this should be interpreted or what an
improvement of X point’s means to a patient. A recent
study tried to clarify this by demonstrating that a post-
operative threshold OKS of 30 points or more, or an
absolute improvement in the OKS of 11 points or more
identified those patients with the greatest level of satis-
faction 6 months after a TKR [4]. However, this study
assessed satisfaction using a linear scale, with no clear
categorical definition of whether patients were very satis-
fied, satisfied, neutral, or unsatisfied. Hence, no threshold
OKS to achieve these differing levels of satisfaction was
able to be calculated. A knowledge of these thresholds, at
which these levels of satisfaction are attained, would help
to interpret the OKS and aid with communication with
patients, e.g. X post-operative score is associated with X
level of satisfaction.
In addition to patient communication, the identified
thresholds in the post-operative OKS for patient satisfac-
tion could be used to grade outcome. Numerous studies
have reported the outcome of knee arthroplasty using a
categorised grading of the post-operative OKS [5, 6], but
this categorisation was based on the patients with a total
hip replacement (THR) assessed using the Oxford hip score
(OHS) [7]. The OHS and OKS are different questionnaires,
and although they demonstrate similar pre-operative scores
in patients undergoing THR and TKR, respectively, the
post-operative OHS is greater due to a larger improvement
N. D. Clement (&) � D. Macdonald � R. Burnett
Department of Orthopaedics and Trauma, The Royal Infirmary
of Edinburgh, Little France, EH16 4SA Edinburgh, UK
e-mail: [email protected]
123
Arch Orthop Trauma Surg (2013) 133:689–694
DOI 10.1007/s00402-013-1728-3
as compared to the OKS [4]. Hence, using the categorisa-
tion of post-operative OKS as defined for the OHS would
result in patients having a worse outcome as compared to
those undergoing a THR. The thresholds to achieve each
level of satisfaction (very satisfied, satisfied, neutral, or
unsatisfied) could be used to assign a new categorisation
system for the post-operative OKS according to a patients
perception of their outcome.
The primary aim of this study was to identify threshold
values in the pre- and post-operative OKS, and change in
the score for differing levels of patient satisfaction with
their TKR 1-year following surgery. The secondary aim
was to assess whether the post-operative OKS could be
categorized to reflect the level patient satisfaction.
Patients and methods
During a 5-year period (2006–2010), patients undergoing
TKR at the study centre had prospectively outcome data
recorded. Only patients with primary osteoarthritis were
included. OKS [2] were recorded pre-operatively and
1-year post-operatively. The OKS consists of twelve
questions assessed on a Likert scale with values from 0 to
4, a summative score is then calculated where 48 is the best
possible score (least symptomatic) and 0 is the worst
possible score (most symptomatic). A minimal clinically
important difference is smallest change of a score to be of
importance, and was defined as half the standard deviation
(SD) of the OKS (4 points) according pre-operative scores
for the study cohort, which is an accepted methodology [8,
9].
Patient satisfaction was assessed by asking the question
‘‘How satisfied are you with your operated knee?’’ 1-year
after surgery. The response was recorded using a four point
Likert scale: very satisfied, satisfied, neutral, and unsatis-
fied. In addition to this categories patients who recorded
very satisfied or satisfied were classified as satisfied, which
has been used previously to assess patient satisfaction after
TKR [10].
The study centre serves a population of approximately
780,000 people [11]. During the study period the most
commonly performed TKRs were the Kinemax (Stryker
Howmedica Osteonics, Allendale, New Jersey), Triathlon
(Stryker), and the PFC Sigma (DePuy, Johnson & Johnson
Professional Inc, Raynham, Massachusetts). All patients
were reviewed at a pre-assessment clinic. A standardised
rehabilitation protocol was used for all patients, with active
mobilisation on the first day post-operatively. Patients were
then reviewed at 6 weeks, 6 months and 12 months post-
operatively.
Statistical analysis was performed using Statistical
Package for Social Sciences version 17.0 (SPSS Inc.,
Chicago, IL, USA). A Student’s t test, paired and unpaired,
were used to compare linear variables between groups.
Dichotomous variables were assessed using a Chi-square
test. Four different predictive models where assessed
according to level of satisfaction:
1. Very satisfied and satisfied versus neutral and
unsatisfied;
2. Very satisfied versus satisfied and neutral and
unsatisfied;
3. Satisfied versus neutral and unsatisfied;
4. Unsatisfied versus very satisfied and satisfied and
neutral.
Receiver-operating characteristic (ROC) curve analysis
were used to identify thresholds (cut points) for pre-oper-
ative, 1-year post-operative, and change in the OKS score
that identified patient satisfaction group according to the
aforementioned definitions. The area under the ROC curve
ranges from 0.5, indicating a test with no accuracy, to 1.0
where the test is perfectly accurate by identifying all sat-
isfied patients. The threshold is equivalent to the point
(OKS) at which the sensitivity and specificity are maximal
in predicting patient satisfaction [12].
Ethical approval was obtained for analysis and publi-
cation of the presented data from the regional ethics
committee.
Results
There were 2,392 TKR performed during the study period
with complete pre- and post-operative data. There were
1,017 male patients and 1357 female patients, with a mean
age of 70.4 (SD 9.4, range 17–92) years. The mean pre-
operative OKS was 18.9 (SD 7.2, range 0–45) and post-
operatively this increased to 34.3 (SD 10.1, range 4–48).
There was a significant improvement of 15.5 (95 % con-
fidence interval (CI) 15.0–15.7, p \ 0.0001 paired t test),
which was beyond the minimal clinically important
difference.
There were 1,309 (55 %) very satisfied patients, 613
(26 %) satisfied patients, 270 (11 %) were neutral, and 122
(5 %) were unsatisfied with their TKR. However, in
addition 78 (3 %) patients did not answer this question and
were excluded from further analysis. There was a signifi-
cant difference between levels of satisfaction for pre-
operative and post-operative OKS, worse (lower) pre- and
post-operative OKS were observed with decreasing level of
satisfaction (Table 1). In addition, the mean change
(improvement) in the OKS also significantly diminished
with decreasing level of satisfaction (Table 1). Interest-
ingly all levels of satisfaction had a clinically significant
improvement in their OKS (greater than the minimal
690 Arch Orthop Trauma Surg (2013) 133:689–694
123
clinically important difference), except for those patients
who were unsatisfied.
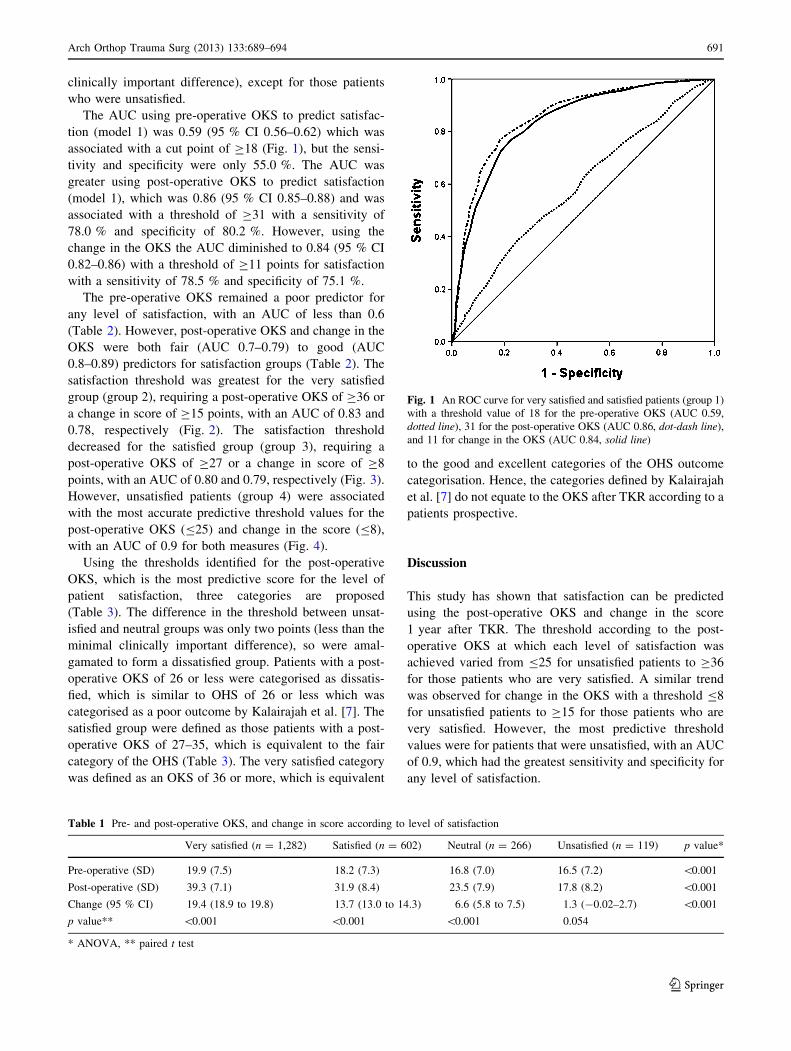
The AUC using pre-operative OKS to predict satisfac-
tion (model 1) was 0.59 (95 % CI 0.56–0.62) which was
associated with a cut point of C18 (Fig. 1), but the sensi-
tivity and specificity were only 55.0 %. The AUC was
greater using post-operative OKS to predict satisfaction
(model 1), which was 0.86 (95 % CI 0.85–0.88) and was
associated with a threshold of C31 with a sensitivity of
78.0 % and specificity of 80.2 %. However, using the
change in the OKS the AUC diminished to 0.84 (95 % CI
0.82–0.86) with a threshold of C11 points for satisfaction
with a sensitivity of 78.5 % and specificity of 75.1 %.
The pre-operative OKS remained a poor predictor for
any level of satisfaction, with an AUC of less than 0.6
(Table 2). However, post-operative OKS and change in the
OKS were both fair (AUC 0.7–0.79) to good (AUC
0.8–0.89) predictors for satisfaction groups (Table 2). The
satisfaction threshold was greatest for the very satisfied
group (group 2), requiring a post-operative OKS of C36 or
a change in score of C15 points, with an AUC of 0.83 and
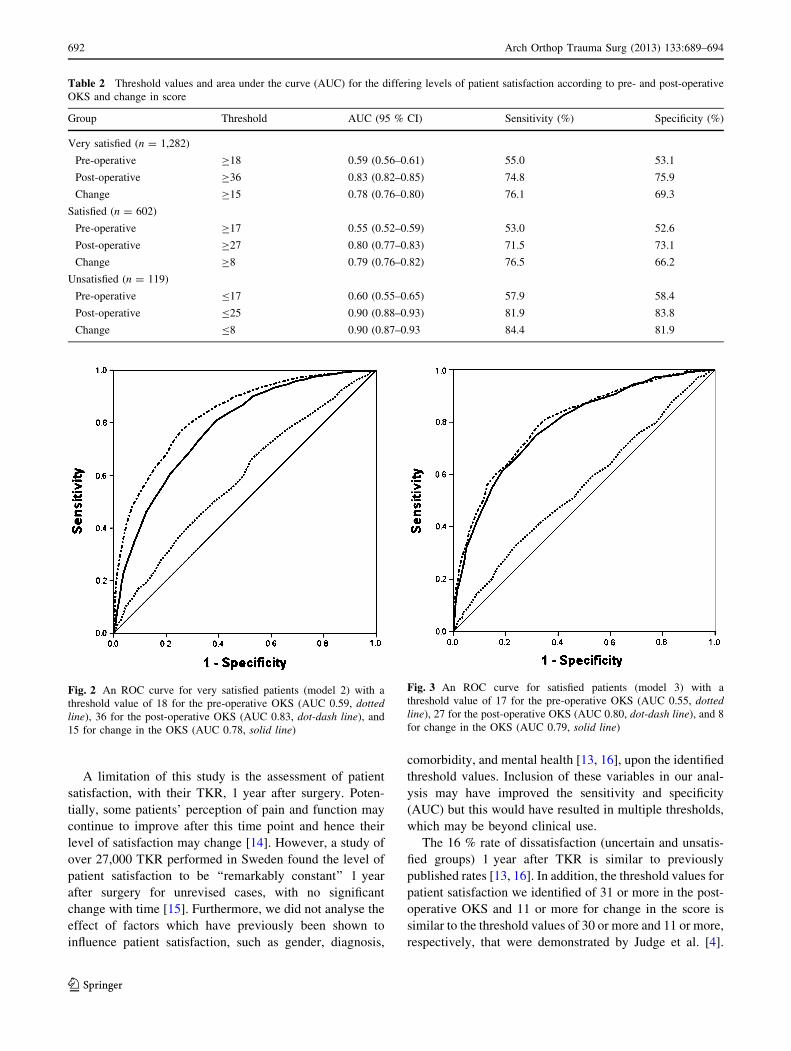
0.78, respectively (Fig. 2). The satisfaction threshold
decreased for the satisfied group (group 3), requiring a
post-operative OKS of C27 or a change in score of C8
points, with an AUC of 0.80 and 0.79, respectively (Fig. 3).
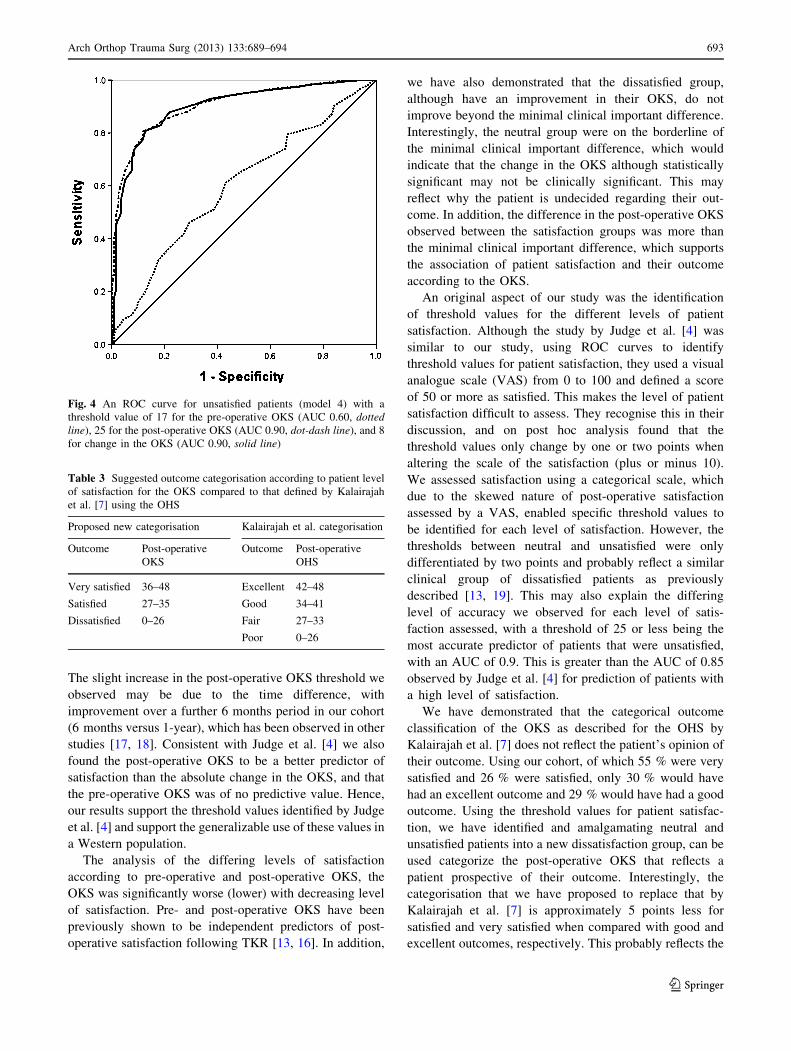
However, unsatisfied patients (group 4) were associated
with the most accurate predictive threshold values for the
post-operative OKS (B25) and change in the score (B8),
with an AUC of 0.9 for both measures (Fig. 4).
Using the thresholds identified for the post-operative
OKS, which is the most predictive score for the level of
patient satisfaction, three categories are proposed
(Table 3). The difference in the threshold between unsat-
isfied and neutral groups was only two points (less than the
minimal clinically important difference), so were amal-
gamated to form a dissatisfied group. Patients with a post-
operative OKS of 26 or less were categorised as dissatis-
fied, which is similar to OHS of 26 or less which was
categorised as a poor outcome by Kalairajah et al. [7]. The
satisfied group were defined as those patients with a post-
operative OKS of 27–35, which is equivalent to the fair
category of the OHS (Table 3). The very satisfied category
was defined as an OKS of 36 or more, which is equivalent
to the good and excellent categories of the OHS outcome
categorisation. Hence, the categories defined by Kalairajah
et al. [7] do not equate to the OKS after TKR according to a
patients prospective.
Discussion
This study has shown that satisfaction can be predicted
using the post-operative OKS and change in the score
1 year after TKR. The threshold according to the post-
operative OKS at which each level of satisfaction was
achieved varied from B25 for unsatisfied patients to C36
for those patients who are very satisfied. A similar trend
was observed for change in the OKS with a threshold B8
for unsatisfied patients to C15 for those patients who are
very satisfied. However, the most predictive threshold
values were for patients that were unsatisfied, with an AUC
of 0.9, which had the greatest sensitivity and specificity for
any level of satisfaction.
Table 1 Pre- and post-operative OKS, and change in score according to level of satisfaction
Very satisfied (n = 1,282) Satisfied (n = 602) Neutral (n = 266) Unsatisfied (n = 119) p value*
Pre-operative (SD) 19.9 (7.5) 18.2 (7.3) 16.8 (7.0) 16.5 (7.2) \0.001
Post-operative (SD) 39.3 (7.1) 31.9 (8.4) 23.5 (7.9) 17.8 (8.2) \0.001
Change (95 % CI) 19.4 (18.9 to 19.8) 13.7 (13.0 to 14.3) 6.6 (5.8 to 7.5) 1.3 (-0.02–2.7) \0.001
p value** \0.001 \0.001 \0.001 0.054
* ANOVA, ** paired t test
Fig. 1 An ROC curve for very satisfied and satisfied patients (group 1)
with a threshold value of 18 for the pre-operative OKS (AUC 0.59,
dotted line), 31 for the post-operative OKS (AUC 0.86, dot-dash line),
and 11 for change in the OKS (AUC 0.84, solid line)
Arch Orthop Trauma Surg (2013) 133:689–694 691
123
A limitation of this study is the assessment of patient
satisfaction, with their TKR, 1 year after surgery. Poten-
tially, some patients’ perception of pain and function may
continue to improve after this time point and hence their
level of satisfaction may change [14]. However, a study of
over 27,000 TKR performed in Sweden found the level of
patient satisfaction to be ‘‘remarkably constant’’ 1 year
after surgery for unrevised cases, with no significant
change with time [15]. Furthermore, we did not analyse the
effect of factors which have previously been shown to
influence patient satisfaction, such as gender, diagnosis,
comorbidity, and mental health [13, 16], upon the identified
threshold values. Inclusion of these variables in our anal-
ysis may have improved the sensitivity and specificity
(AUC) but this would have resulted in multiple thresholds,
which may be beyond clinical use.
The 16 % rate of dissatisfaction (uncertain and unsatis-
fied groups) 1 year after TKR is similar to previously
published rates [13, 16]. In addition, the threshold values for
patient satisfaction we identified of 31 or more in the post-
operative OKS and 11 or more for change in the score is
similar to the threshold values of 30 or more and 11 or more,
respectively, that were demonstrated by Judge et al. [4].
Table 2 Threshold values and area under the curve (AUC) for the differing levels of patient satisfaction according to pre- and post-operative
OKS and change in score
Group Threshold AUC (95 % CI) Sensitivity (%) Specificity (%)
Very satisfied (n = 1,282)
Pre-operative C18 0.59 (0.56–0.61) 55.0 53.1
Post-operative C36 0.83 (0.82–0.85) 74.8 75.9
Change C15 0.78 (0.76–0.80) 76.1 69.3
Satisfied (n = 602)
Pre-operative C17 0.55 (0.52–0.59) 53.0 52.6
Post-operative C27 0.80 (0.77–0.83) 71.5 73.1
Change C8 0.79 (0.76–0.82) 76.5 66.2
Unsatisfied (n = 119)
Pre-operative B17 0.60 (0.55–0.65) 57.9 58.4
Post-operative B25 0.90 (0.88–0.93) 81.9 83.8
Change B8 0.90 (0.87–0.93 84.4 81.9
Fig. 2 An ROC curve for very satisfied patients (model 2) with a
threshold value of 18 for the pre-operative OKS (AUC 0.59, dottedline), 36 for the post-operative OKS (AUC 0.83, dot-dash line), and
15 for change in the OKS (AUC 0.78, solid line)
Fig. 3 An ROC curve for satisfied patients (model 3) with a
threshold value of 17 for the pre-operative OKS (AUC 0.55, dottedline), 27 for the post-operative OKS (AUC 0.80, dot-dash line), and 8
for change in the OKS (AUC 0.79, solid line)
692 Arch Orthop Trauma Surg (2013) 133:689–694
123
The slight increase in the post-operative OKS threshold we
observed may be due to the time difference, with
improvement over a further 6 months period in our cohort
(6 months versus 1-year), which has been observed in other
studies [17, 18]. Consistent with Judge et al. [4] we also
found the post-operative OKS to be a better predictor of
satisfaction than the absolute change in the OKS, and that
the pre-operative OKS was of no predictive value. Hence,
our results support the threshold values identified by Judge
et al. [4] and support the generalizable use of these values in
a Western population.
The analysis of the differing levels of satisfaction
according to pre-operative and post-operative OKS, the
OKS was significantly worse (lower) with decreasing level
of satisfaction. Pre- and post-operative OKS have been
previously shown to be independent predictors of post-
operative satisfaction following TKR [13, 16]. In addition,
we have also demonstrated that the dissatisfied group,
although have an improvement in their OKS, do not
improve beyond the minimal clinical important difference.
Interestingly, the neutral group were on the borderline of
the minimal clinical important difference, which would
indicate that the change in the OKS although statistically
significant may not be clinically significant. This may
reflect why the patient is undecided regarding their out-
come. In addition, the difference in the post-operative OKS
observed between the satisfaction groups was more than
the minimal clinical important difference, which supports
the association of patient satisfaction and their outcome
according to the OKS.
An original aspect of our study was the identification
of threshold values for the different levels of patient
satisfaction. Although the study by Judge et al. [4] was
similar to our study, using ROC curves to identify
threshold values for patient satisfaction, they used a visual
analogue scale (VAS) from 0 to 100 and defined a score
of 50 or more as satisfied. This makes the level of patient
satisfaction difficult to assess. They recognise this in their
discussion, and on post hoc analysis found that the
threshold values only change by one or two points when
altering the scale of the satisfaction (plus or minus 10).
We assessed satisfaction using a categorical scale, which
due to the skewed nature of post-operative satisfaction
assessed by a VAS, enabled specific threshold values to
be identified for each level of satisfaction. However, the
thresholds between neutral and unsatisfied were only
differentiated by two points and probably reflect a similar
clinical group of dissatisfied patients as previously
described [13, 19]. This may also explain the differing
level of accuracy we observed for each level of satis-
faction assessed, with a threshold of 25 or less being the
most accurate predictor of patients that were unsatisfied,
with an AUC of 0.9. This is greater than the AUC of 0.85
observed by Judge et al. [4] for prediction of patients with
a high level of satisfaction.
We have demonstrated that the categorical outcome
classification of the OKS as described for the OHS by
Kalairajah et al. [7] does not reflect the patient’s opinion of
their outcome. Using our cohort, of which 55 % were very
satisfied and 26 % were satisfied, only 30 % would have
had an excellent outcome and 29 % would have had a good
outcome. Using the threshold values for patient satisfac-
tion, we have identified and amalgamating neutral and
unsatisfied patients into a new dissatisfaction group, can be
used categorize the post-operative OKS that reflects a
patient prospective of their outcome. Interestingly, the
categorisation that we have proposed to replace that by
Kalairajah et al. [7] is approximately 5 points less for
satisfied and very satisfied when compared with good and
excellent outcomes, respectively. This probably reflects the
Fig. 4 An ROC curve for unsatisfied patients (model 4) with a
threshold value of 17 for the pre-operative OKS (AUC 0.60, dottedline), 25 for the post-operative OKS (AUC 0.90, dot-dash line), and 8
for change in the OKS (AUC 0.90, solid line)
Table 3 Suggested outcome categorisation according to patient level
of satisfaction for the OKS compared to that defined by Kalairajah
et al. [7] using the OHS
Proposed new categorisation Kalairajah et al. categorisation
Outcome Post-operative
OKS
Outcome Post-operative
OHS
Very satisfied 36–48 Excellent 42–48
Satisfied 27–35 Good 34–41
Dissatisfied 0–26 Fair 27–33
Poor 0–26
Arch Orthop Trauma Surg (2013) 133:689–694 693
123
fact that post THR the OHS improves by 5 points more
than the OKS after TKR [4].
The threshold values we have identified for the different
levels of satisfaction using the post-operative OKS, which
is the most accurate predictor, could be used to predict
level of patient satisfaction and give quantification of the
score. These values can be used to categorise the outcome
of TKR using the post-operative OKS according to a
patient’s perspective of their outcome.
Conflict of interest The authors declare no conflict of interest with
the content of this study.
References
1. Dawson J, Doll H, Fitzpatrick R, Jenkinson C, Carr AJ (2010)
The routine use of patient reported outcome measures in
healthcare settings. BMJ 340:c186
2. Dawson J, Fitzpatrick R, Murray D, Carr A (1998) Questionnaire
on the perceptions of patients about total knee replacement.
J Bone Joint Surg Br 80:63–69
3. Department for Health. Equity and excellence: liberating the
NHS. 2010. http://www.dh.gov.uk/en/Publlicationsandstatistics/
Publications/PubicationsPolicyAndGuidance/DH_117353 (date
last accessed 16th Decemeber 2012)
4. Judge A, Arden NK, Kiran A, Price A, Javaid MK, Beard D,
Murray D, Field RE (2012) Interpretation of patient-reported
outcomes for hip and knee replacement surgery: identification of
thresholds associated with satisfaction with surgery. J Bone Joint
Surg Br 94:412–418
5. Pearse AJ, Hooper GJ, Rothwell A, Frampton C (2010) Survival
and functional outcome after revision of a unicompartmental to a
total knee replacement: the New Zealand national joint registry.
J Bone Joint Surg Br 92:508–512
6. Keenan AC, Wood AM, Arthur CA, Jenkins PJ, Brenkel IJ,
Walmsley PJ (2012) Ten-year survival of cemented total knee
replacement in patients aged less than 55 years. J Bone Joint Surg
Br 94:928–931
7. Kalairajah Y, Azurza K, Hulme C, Molloy S, Drabu KJ (2005)
Health outcome measures in the evaluation of total hip arthro-
plasties–a comparison between the Harris hip score and the
Oxford hip score. J Arthroplast 20:1037–1041
8. Norman GR, Sloan JA, Wywich KW (2003) Interpretatation of
the changes in health-related quality of life: the remarkable uni-
versality of half a standard deviation. Med Care 41:582–592
9. Schmitt JS, Di Fabio RP (2004) Reliable change and minimum
difference (MID) proportions facilitated group responsivemess
comparisons using indvidual threshold criteria. J Clin Epidemiol
57:1008–1019
10. Scott CEH, MacDonald D, Howie CR, Biant LC (2010) Pre-
dicting Patient Dissatisfaction following Total Knee Replace-
ment: A prospective study of 1217 cases. J Bone Joint Surg Br
92-B:1253–1258
11. General Register Office for Scotland. http://www.gro-scotland.
gov.uk/files2/stats/gros-mid-2008-population-estimates-scotland-
population-estimates-by-sex-age-and-administrative-area/j10750
08.htm (date last accessed 16th Decemeber 2012)
12. Farrar JT, Young JP Jr, LaMoreaux L, Werth JL, Poole RM
(2001) Clinical importance of changes in chronic pain intensity
measured on an 11-point numerical pain rating scale. Pain
94:149–158
13. Scott CE, Howie CR, MacDonald D, Biant LC (2010) Predicting
dissatisfaction following total knee replacement: a prospective
study of 1217 patients. J Bone Joint Surg Br 92:1253–1258
14. Brander V, Gondek S, Martin E, Stulberg SD (2007) Pain and
depression influence outcome 5 years after knee replacement
surgery. Clin Orthop Relat Res 464:21–26
15. Robertsson O, Dunbar M, Pehrsson T, Knutson K, Lidgren L
(2000) Patient satisfaction after knee arthroplasty: a report on
27,372 knees operated on between 1981 and 1995 in Sweden.
Acta Orthop Scand 71:262–267
16. Baker PN, van der Meulen JH, Lewsey J, Gregg PJ (2007) The
role of pain and function in determining patient satisfaction after
total knee replacement. Data from the national joint registry for
England and Wales. J Bone Joint Surg Br 89:893–900
17. Johnston L, Maclennan G, McCormack K, Ramsay C, Walker A
(2009) The Knee Arthroplasty Trial (KAT) design features,
baseline characteristics, and two-year functional outcomes after
alternative approaches to knee replacement. J Bone Joint Surg
Am 91:134–141
18. Clement ND, MacDonald D, Howie CR, Biant LC (2011) The
outcome of primary total hip and knee arthroplasty in patients
aged 80 years or more. J Bone Joint Surg Br 93:1265–1270
19. Scott CE, Bugler KE, Clement ND, MacDonald D, Howie CR,
Biant LC (2012) Patient expectations of arthroplasty of the hip
and knee. J Bone Joint Surg Br 94:974–981
694 Arch Orthop Trauma Surg (2013) 133:689–694
123