Embed Size (px)
Citation preview
TARABA JOURNAL OF ENGINEERING AND TECHNOLOGY
(TAJET), FACULTY OF ENGINEERING, TARABA STATE
UNIVERSITY, JALINGO. WWW.TAJET.COM.NG. ISSN: PRINT-
2636 7386; E-2659 1278
37
Moses et al., Predicting Inverted Electrical Resistivity from Geotechnical
Engineering Parameters, TAJET 2(1), August 2021: 37-42
Predicting Inverted Electrical Resistivity from Geotechnical
Engineering Parameters Moses, G.1, Sani, J. E2., Munta, S3, Al-Kadriyar A4 and Ijimdiya, T. S5.
1,2Department of Civil Engineering, Nigerian Defence Academy, Kaduna, Nigeria. 3Department of Civil Engineering, Taraba State University, Jalingo, Taraba State, Nigeria.
4Postgraduate student, Department of Civil Engineering, Nigerian Defence Academy, Kaduna, Nigeria. 5Department of Civil Engineering, Ahmadu Bello University, Zaria, Nigeria.
Corresponding author: [email protected]
Introduction
The study of the structure and composition of the earth's interior
is called Geophysics. An applied branch of geophysics, which
employed the physical methods (such as electrical, seismic,
magnetic, electromagnetic and gravitational) on the Earth surface to
measure the physical properties of the subsurface, along with the
anomalies in those properties is said to be Exploration Geophysics
[1]. It is mostly used to detect the availability and position of
economically useful mineral depositions; examples of such are ore
minerals; fossil fuels and other hydrocarbons; geothermal
reservoirs; and groundwater reservoirs. Typically, geophysical site
investigation techniques can give a voluminous value and produce
image of the subsurface without disturbing the subsoil physically.
[1].
Electrical Resistivity, Ground Penetrating Radar and
Magnetism are examples of geophysical techniques that are
convenient and use specific imaging equipment. Electrical
geophysical is a non-destructive test, less time consuming and a
low-cost method that help to know the resistivity of a soil [2].
Geophysics enables engineers to predict the subsoil layer properties
based on the soil resistivity.
A surface geophysical technique provides an alternative wide-
area method for subsurface characterization and information
regarding relevant material properties [3]. Ground penetrating radar,
electrical resistivity, and magnetism are examples of Geophysical
Investigation Techniques which are convenient and are used in
specific imaging equipment. The relationship between mechanical
properties of sedimentary rocks and P-wave velocity were studied
by [4]. Simple regression analysis and an already acquired data are
used by [4]. The already acquired data were then subjected to multi-
regression analysis. A lot of empirical equations that has high
correlation coefficients were also derived, which are useful for rock
engineering practitioners [5].
A little study has been carried out to correlate electrical
resistivity of subsurface and geotechnical parameters of soil.
Cosenza et al. [6] established a qualitative and quantitative
correlation between resistivity and CPT values, when 2D electrical
resistivity surveys with Wenner electrode configuration were
conducted. Sudha et al. [7] used 2D electrical resistivity at two
different locations in India to investigate the relationship between
electrical resistivity and SPT values. Also, investigation was carried
out by [8] on the electrical resistivity of soil-cement admixture, at
different cement-mixing ratio, water content and curing time.
ARTICLE INFO
History :
Received: 1st July, 2020
Accepted: 1st August, 2021
Received in revised form:
10th August, 2021
Published: 28th September, 2021
Keywords
Coefficient of Correlation, Electrical
Resistivity, Engineering parameters,
Inverted Electrical Resistivity.
ABSTRACT
In the study, the inverted electrical resistivity of soils was predicted using their
geotechnical engineering parameters obtained by carrying out the field electrical
resistivity of 76 samples within the FCT, Abuja with the corresponding engineering
parameters. The inverted electrical resistivity was determined and used as the
dependable data while the geotechnical parameters (natural moisture content, specific
gravity, liquid limit, plastic limit, sieve passing No 200, cohesion, angle of internal
friction bulk density) were the in dependent variables. A Terrameter SAS 300C was used
for the measurements and the data were analyzed to determine the regression equation
of the inverted resistivity and the individual geotechnical parameters. The level of
correlation between dependable and all independent variables were determined using
the Coefficients of determination for each equation, which generally ranged from no
correlation to mild correlations. The highest coefficient of determination was obtained
for cohesion, with an R2 value of 0.40 which is considered to have a mild correlation with
the model. It can be recommended that the model developed by using inverted resistivity
and cohesion should be used to predict inverted electrical resistivity.
© 2021 TAJET All rights reserved

TARABA JOURNAL OF ENGINEERING AND TECHNOLOGY
(TAJET), FACULTY OF ENGINEERING, TARABA STATE
UNIVERSITY, JALINGO. WWW.TAJET.COM.NG. ISSN: PRINT-
2636 7386; E-2659 1278
38
Moses et al., Predicting Inverted Electrical Resistivity from Geotechnical
Engineering Parameters, TAJET 2(1), August 2021: 37-42
Correlation of SPT and compressive strength shows a good result of
soil-cement admixture with electrical resistivity. Oh and Sun [9]
concluded that electrical resistivity of soil has a good correlation
with SPT values after a combined analysis of electrical resistivity
and SPT for the assessment of earth filled dam were used.
Geotechnical characterization through geotechnical and electrical
data in India were carried out by [10]. Correlation between water
content and electrical resistivity of sand in Bhopal, India were also
worked on by [11]. Bery and Saad [12] characterized the
geotechnical site using the electrical resistivity method of approach
in Malaysia. The main aim of this study is the correlation of Inverted
Electrical Resistivity values with the geotechnical engineering
parameters.
Methodology Soil samples were collected from about 76 different locations.
The sites were located and data was collected at different parts of
the Federal Capital Territory, Abuja depending on the availability of
the data. Federal Capital Territory, Abuja is located on a latitude
9.072264° N and longitude 7.491302° E.
Natural Moisture Content
The natural moisture content of the soil was determined
according to BS 1377 (1990) Test 1 (A). An appropriate weight of
the wet soil was placed in a container of known mass. The soil plus
the container was weighed to the nearest 0.01g, after which they
were kept in an oven and allowed to dry at a temperature of 105 to
110 ºC for a period of 24 hours. Immediately after drying, the
container plus the dry soil was weighed again. The moisture content
was then calculated using the relationship in equation 1.
𝑊 =𝑀2 − 𝑀1
𝑀3 − 𝑀1
× 100 (1)
where W = Moisture content (%), M1 = mass of container (g), M2 =
mass of container + wet soil (g) and M3 = mass of container + dry
soil. The procedure was repeated three times, from which average
natural moisture content was determined.
Specific Gravity
The specific gravity test was conducted for the natural soil in
accordance with Test 6 (B) BS 1377 (1990). About 25 g of soil
sample passing 2 mm BS sieve size was oven dried at 105 ºC –110
ºC. The sample was allowed to cool in a desiccator and then placed
in 50 ml density bottle with the stopper attached. The weight of the
soil, bottle and stopper were measured. Distilled water was then
added to the bottle to cover the sample; care was taken not to trap
air in the bottle. The bottle, stopper plus the soil and water were also
weighed. The bottle was emptied and filled with distilled water
alone, again the weight of the bottle, stopper and water were
recorded. The entire procedure was repeated three times using 25 g
of sample each time in order to obtain an average value for the
specific gravity. The specific gravity of soil particles was calculated
using the expression in equation 2.
𝐺𝑠 =𝑊2 − 𝑊1
(𝑊4 − 𝑊1) − (𝑊3 − 𝑊1) (2)
where Gs = Specific Gravity, W1 = mass of density bottle and stopper
(g), W2 = mass of density bottle, soil and stopper (g), W3 = mass of
density bottle, stopper and distilled water and soil sample (g) and
W4 = mass of density bottle, stopper and distilled water only (g).
Atterberg Limits
The liquid limit, plastic limit, plasticity index and linear
shrinkage tests were carried out according to BS 1377 (1990) Test 1
(A) for the natural soil samples. The sample for the liquid limit (LL)
test was dried sufficiently and broken up; 200 g of the material
passing through the 425 µm BS test sieve was obtained. The sample
was then placed on a clean glass plate, using the palette knife and
the spatula the soil was thoroughly mixed with water until a
homogenous paste was obtained. The paste was wrapped in an
airtight cellophane bag for not less than 24 hours in order to allow
moisture to penetrate through the sample. The paste was then placed
on the glass plate and mixed thoroughly for some few minutes.
Some of the remixed paste was placed in the brass cup of the
Casagrande apparatus. After leveling the sample, a standard
grooving tool was drawn through the paste along a diameter through
the pivot. The crank was turned to lift drop the cup at two
revolutions per second. The number of blows that is required to
close the groove for 13 mm distance was recorded after which about
10 g of the paste was immediately taken from the cup for the
moisture content determination. These procedures were repeated by
adding more water to the paste. Thus the moisture content for each
test was increased, the soil flowed more easily and the number of
blows for closure of the groove decreased. Four tests were
conducted on each batch of the sample for number of blows ranging
between 50 and 10. A graph of moisture content versus number of
blows was plotted to a logarithmic scale. The liquid limit was taken
at the moisture content corresponding to 25 number blows.
For the plastic limit (PL), about 20 g of dried soil passing 425
µm BS test sieve was placed on a flat glass plate and mixed
thoroughly with water until the mixture was plastic enough and be
shaped into a small ball. The paste was rolled between the finger and
the thumb into 6 mm diameter threads, and then rolled between the
fingertips and the glass plate with sufficient pressure to reduce
threads to 3 mm diameter. The procedure was repeated severally
until the thread crumbled. Immediately, the moisture content of the
crumbled threads was determined. The procedure was repeated two
TARABA JOURNAL OF ENGINEERING AND TECHNOLOGY
(TAJET), FACULTY OF ENGINEERING, TARABA STATE
UNIVERSITY, JALINGO. WWW.TAJET.COM.NG. ISSN: PRINT-
2636 7386; E-2659 1278
39
Moses et al., Predicting Inverted Electrical Resistivity from Geotechnical
Engineering Parameters, TAJET 2(1), August 2021: 37-42
to three times and the moisture content determined from the mean
values of the tests.
The plasticity index (PI) was determined from liquid limit and
plastic limit results for both the natural and stabilized soil using the
expression in equation 3.
𝑃𝐼 = 𝐿𝐿 − 𝑃𝐿 (3)
Particle Size Distribution (Wet Sieving).
The particle size distribution was conducted in accordance with
BS 1377(1990) Part 2A. 200 g of the soil was weighed, wet sieved
to remove clay and silt particles using BS No. 200 (0.075 mm) sieve
under tap water. Washing was done carefully to avoid damage to the
sieves. After washing, the sample was dried in an oven set to 105 °C
for 24 hours. After drying, the standard BS sieves were arranged in
descending order of sieve size. The oven-dried sample was
transferred into the top most sieves and shaken for at least 10
minutes on a mechanical sieve shaker. After sieving, the mass
retained on each sieve was then weighed. The percentages passing
each sieve size was calculated and plotted on a semi-log graph of
percentage passing against sieve sizes.
Electrical Resistivity
The geophysical investigation involved the resistivity method
using vertical electrical sounding technique. The principle of the
resistivity method is that an electric current is passed into the ground
with the aid of two electrodes (anode and cathode), and the resultant
potential difference is measured with another set of two electrodes.
The ratio of the potential difference to the current is displayed by
the Terrameter as electrical resistance. The electrodes are then
arranged in a straight line, about a center point symmetrically. A
geometric factor in meters is calculated as a function of the electrode
spacing. The resistance reading obtained by the Terrameter is
multiplied by this to give an apparent resistivity value. The electrode
spacing is increased progressively, keeping the center point of the
electrode array at a fixed location.
A Terrameter SAS 300C was used to carry out the resistivity
measurements in the field. The full Schlumberger configuration was
adopted for the soundings. Maximum half-current electrode spread,
(AB/2) was between 1 and 50 while the half-potential electrode
separation (MN/2) was maintained between 0.3 and 5m. The
separation between adjacent sounding centers varies from 180-200
m, while the traverse lines were spaced usually at 1km intervals but
sometimes according to accessibility.
Results and Discussion
The results of field tests conducted on the selected locations as
apparent resistivity was converted to Inverted Resistivity were
analyzed and correlations of Inverted Resistivity with geotechnical
engineering parameters were also presented in accordance with the
correlation coefficient of determination R2. According to the values
of R2, the relationship between any two parameters are classified as
(R2 < 0.30) are considered to have no correlation, (R2 of 0.30 - 0.499)
are considered to be a mild relationship, (R2 of 0.50 - 0.699) are
considered to be a moderate relationship and, (R2 of 0.70 - 1.0) are
considered to be a strong relationship [13].
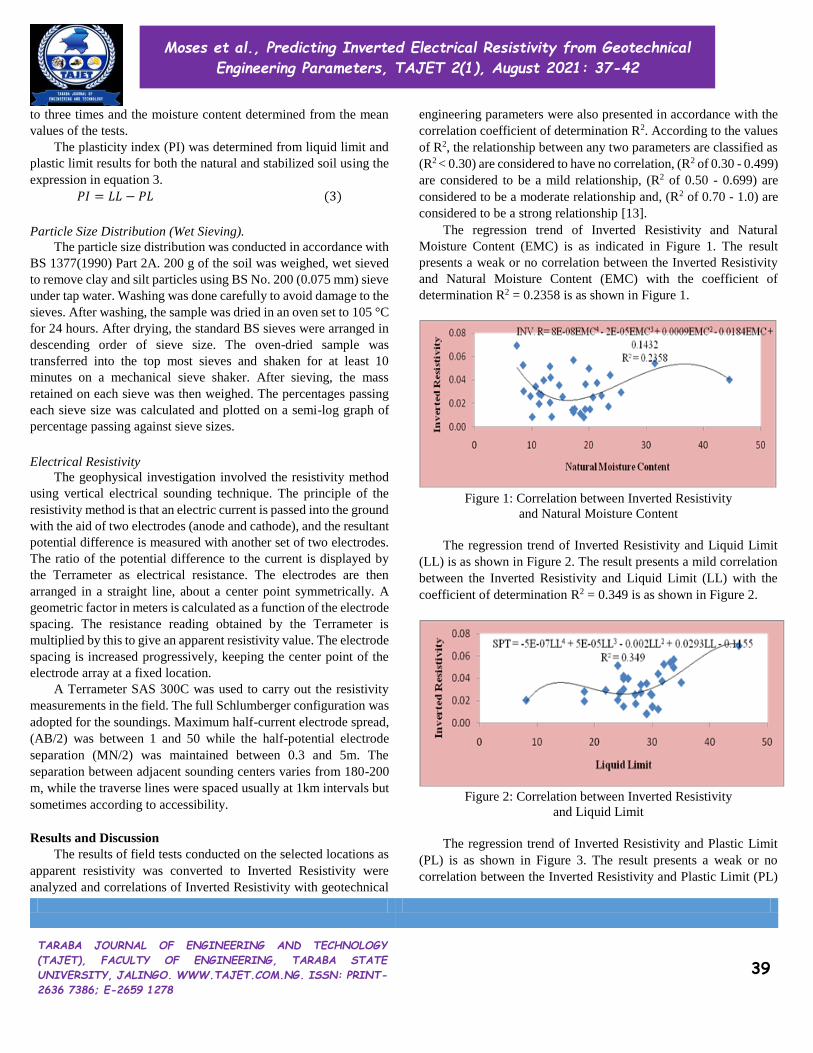
The regression trend of Inverted Resistivity and Natural
Moisture Content (EMC) is as indicated in Figure 1. The result
presents a weak or no correlation between the Inverted Resistivity
and Natural Moisture Content (EMC) with the coefficient of
determination R2 = 0.2358 is as shown in Figure 1.
Figure 1: Correlation between Inverted Resistivity
and Natural Moisture Content
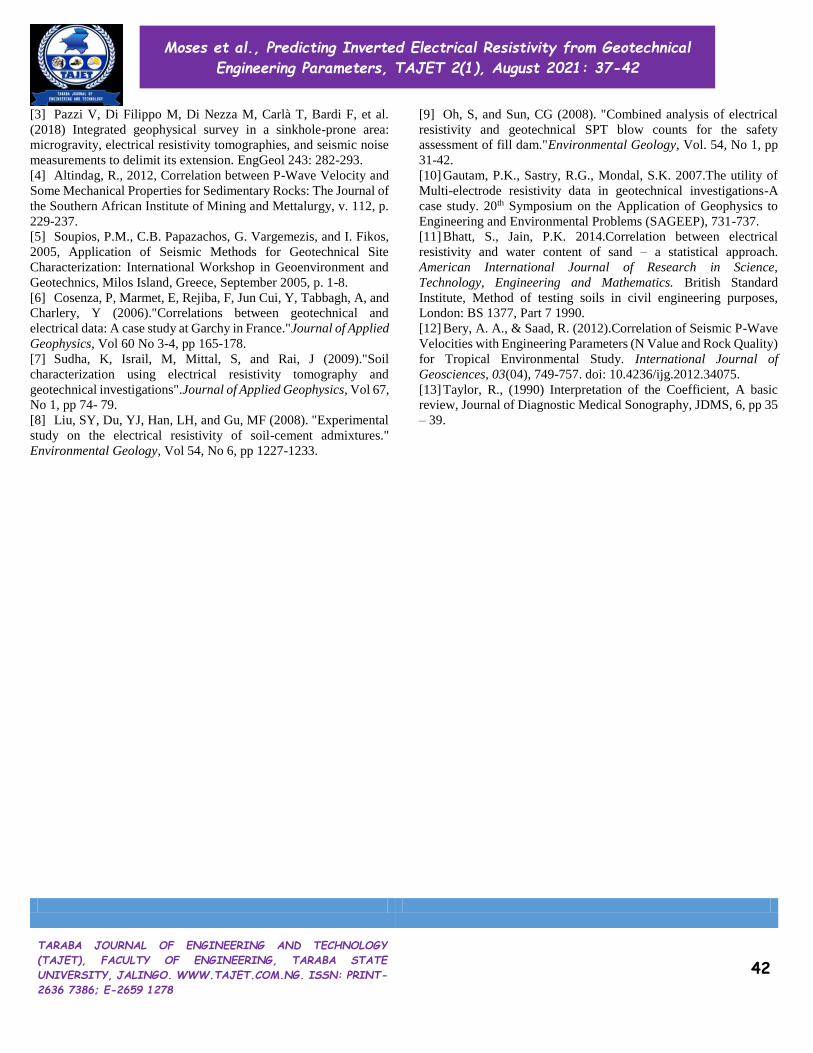
The regression trend of Inverted Resistivity and Liquid Limit
(LL) is as shown in Figure 2. The result presents a mild correlation
between the Inverted Resistivity and Liquid Limit (LL) with the
coefficient of determination R2 = 0.349 is as shown in Figure 2.
Figure 2: Correlation between Inverted Resistivity
and Liquid Limit
The regression trend of Inverted Resistivity and Plastic Limit
(PL) is as shown in Figure 3. The result presents a weak or no
correlation between the Inverted Resistivity and Plastic Limit (PL)

TARABA JOURNAL OF ENGINEERING AND TECHNOLOGY
(TAJET), FACULTY OF ENGINEERING, TARABA STATE
UNIVERSITY, JALINGO. WWW.TAJET.COM.NG. ISSN: PRINT-
2636 7386; E-2659 1278
40
Moses et al., Predicting Inverted Electrical Resistivity from Geotechnical
Engineering Parameters, TAJET 2(1), August 2021: 37-42
with the coefficient of determination R2 = 0.1564 is as shown in
Figure 3.
Figure 3: Correlation between Resistivity and Plastic Limit
The regression trend of Inverted Resistivity and Plasticity Index
(PI) is as shown in Figure 4. The result presents a mild correlation
between the Inverted Resistivity and Plasticity Index (PI) with the
coefficient of determination R2 = 0.3344 is as shown in Figure 4.
Figure 4: Correlation between Inverted Resistivity
and Plasticity Index
The regression trend of Inverted Resistivity and Sieve No. 200
is as indicated in Figure 5. The result presents a weak or no
correlation between the Inverted Resistivity and Sieve No. 200 with
the coefficient of determination R2 = 0.1317 is as shown in Figure
5.
The regression trend of Inverted Resistivity and Cohesion (C)
is as shown in Figure 6. The result presents a mild correlation
between the Inverted Resistivity and Cohesion (C) with the
coefficient of determination R2 = 0.4004 is as shown in Figure 6.
The regression trend of Inverted Resistivity and Angle of
Internal Resistance (Φ°) is as shown in Figure 7. The result presents
a weak or no correlation between the Inverted Resistivity and Angle
of Internal Friction (Φ°) with the coefficient of determination R2 =
0.110 is as shown in Figure 7.
The regression trend of Inverted Resistivity and Coefficient of
Consolidation (CV) is as shown in Figure 8. The result presents a
weak or no correlation between the Inverted Resistivity and
Coefficient of Consolidation (CV) with the coefficient of
determination R2 = 0.1455 is as shown in Figure 8.
Figure 5: Correlation between Inverted Resistivity
and Sieve No. 200
Figure 6: Correlation between Inverted Resistivity and Cohesion
Figure 7: Correlation between Inverted Resistivity and Angle of
Internal Friction
The regression trend of Inverted Resistivity and Coefficient of
Uniformity (MV) is as shown in Figure 9. The result presents a weak
or no correlation between the Inverted Resistivity and Coefficient of
Uniformity (MV) with the coefficient of determination R2 = 0.201 is
as shown in Figure 9.

TARABA JOURNAL OF ENGINEERING AND TECHNOLOGY
(TAJET), FACULTY OF ENGINEERING, TARABA STATE
UNIVERSITY, JALINGO. WWW.TAJET.COM.NG. ISSN: PRINT-
2636 7386; E-2659 1278
41
Moses et al., Predicting Inverted Electrical Resistivity from Geotechnical
Engineering Parameters, TAJET 2(1), August 2021: 37-42
Figure 8: Correlation between Inverted Resistivity
and Coefficient of Consolidation
Figure 9: Correlation between Inverted Resistivity
and Coefficient of Uniformity
The regression trend of Inverted Resistivity and Specific
Gravity (GS) is as shown in Figure 10. The result presents a weak or
no correlation between the Inverted Resistivity and Specific Gravity
(GS) with the coefficient of determination R2 = 0.0823 is as shown
in Figure 10.
Figure 10: Correlation between Inverted Resistivity
and Specific Gravity
The regression trend of Inverted Resistivity and Bulk Density
is as shown in Figure 11. The result present a weak or no correlation
between the Inverted Resistivity and Bulk Density with the
coefficient of determination R2 = 0.2711 as shown in Figure 11.
Figure 11: Correlation between Inverted Resistivity
and Bulk Density
Conclusion
Predictive Inverted Electrical Resistivity from Geotechnical
Engineering Parameters was evaluated by carrying out a simple
regression analysis with all the basic engineering parameters.
Relationship between Inverted Electrical Resistivity and other
parameters demonstrate a 4th order Polynomial trend. Generally, the
results show that the coefficient of determination ranges from no
correlation to mild correlations. It can be seen that cohesion has the
highest R2 value of 0.40 which is considered to have a mild
correlation. This is preceded by Liquid Limit with R2 value of 0.35
and Plasticity Index with R2 value of 0.33. Also, Bulk Density,
Natural Moisture Content, Plastic Limit, Coefficient of
consolidation, coefficient of volume compressibility, Sieve #200,
Angle of Internal Friction and Specific Gravity have R2 value of
0.27, 0.24, 0.16, 0.16, 0.14, 0.13, 0.11 and 0.08 respectively which
are considered to have weak or no correlations according to Taylor
1990. It is therefore recommended that correlation of inverted
electrical resistivity be made with cohesion that gave mild
correlation of 0.40.
References
[1] Mohd, H.Z.A., S. Rosli, A. Fauziah, C.W. Devapriya, and
F.T.B. Mohamed, 2012, Seismic Refraction Investigation in Near
Surface Landslides at the Kindasang Area in Sabah, Malaysia:
Sciverse Science Direct, Procedia Engineering, v. 50, p. 516-531.
[2] Hatta, K. A., & Syed Osman, S. B. A. (2015).Correlation of
Electrical Resistivity and SPT-N Value from Standard Penetration
Test (SPT) of Sandy Soil.Applied Mechanics and Materials, 785,
702-706.doi: 10.4028/www.scientific.net/AMM.785.702
TARABA JOURNAL OF ENGINEERING AND TECHNOLOGY
(TAJET), FACULTY OF ENGINEERING, TARABA STATE
UNIVERSITY, JALINGO. WWW.TAJET.COM.NG. ISSN: PRINT-
2636 7386; E-2659 1278
42
Moses et al., Predicting Inverted Electrical Resistivity from Geotechnical
Engineering Parameters, TAJET 2(1), August 2021: 37-42
[3] Pazzi V, Di Filippo M, Di Nezza M, Carlà T, Bardi F, et al.
(2018) Integrated geophysical survey in a sinkhole-prone area:
microgravity, electrical resistivity tomographies, and seismic noise
measurements to delimit its extension. EngGeol 243: 282-293.
[4] Altindag, R., 2012, Correlation between P-Wave Velocity and
Some Mechanical Properties for Sedimentary Rocks: The Journal of
the Southern African Institute of Mining and Mettalurgy, v. 112, p.
229-237.
[5] Soupios, P.M., C.B. Papazachos, G. Vargemezis, and I. Fikos,
2005, Application of Seismic Methods for Geotechnical Site
Characterization: International Workshop in Geoenvironment and
Geotechnics, Milos Island, Greece, September 2005, p. 1-8.
[6] Cosenza, P, Marmet, E, Rejiba, F, Jun Cui, Y, Tabbagh, A, and
Charlery, Y (2006)."Correlations between geotechnical and
electrical data: A case study at Garchy in France."Journal of Applied
Geophysics, Vol 60 No 3-4, pp 165-178.
[7] Sudha, K, Israil, M, Mittal, S, and Rai, J (2009)."Soil
characterization using electrical resistivity tomography and
geotechnical investigations".Journal of Applied Geophysics, Vol 67,
No 1, pp 74- 79.
[8] Liu, SY, Du, YJ, Han, LH, and Gu, MF (2008). "Experimental
study on the electrical resistivity of soil-cement admixtures."
Environmental Geology, Vol 54, No 6, pp 1227-1233.
[9] Oh, S, and Sun, CG (2008). "Combined analysis of electrical
resistivity and geotechnical SPT blow counts for the safety
assessment of fill dam."Environmental Geology, Vol. 54, No 1, pp
31-42.
[10] Gautam, P.K., Sastry, R.G., Mondal, S.K. 2007.The utility of
Multi-electrode resistivity data in geotechnical investigations-A
case study. 20th Symposium on the Application of Geophysics to
Engineering and Environmental Problems (SAGEEP), 731-737.
[11] Bhatt, S., Jain, P.K. 2014.Correlation between electrical
resistivity and water content of sand – a statistical approach.
American International Journal of Research in Science,
Technology, Engineering and Mathematics. British Standard
Institute, Method of testing soils in civil engineering purposes,
London: BS 1377, Part 7 1990.
[12] Bery, A. A., & Saad, R. (2012).Correlation of Seismic P-Wave
Velocities with Engineering Parameters (N Value and Rock Quality)
for Tropical Environmental Study. International Journal of
Geosciences, 03(04), 749-757. doi: 10.4236/ijg.2012.34075.
[13] Taylor, R., (1990) Interpretation of the Coefficient, A basic
review, Journal of Diagnostic Medical Sonography, JDMS, 6, pp 35
– 39.