Embed Size (px)
Citation preview

RESEARCH ARTICLE Open Access
Predicting inpatient hospital payments inthe United States: a retrospective analysisMark W. Smith1*, Bernard Friedman2, Zeynal Karaca2† and Herbert S. Wong2†
Abstract
Background: The Affordable Care Act (ACA) has increased rates of public and private health insurance in theUnited States. Increasing coverage could raise hospital revenue and reduce the need to shift costs to insuredpatients. The consequences of ACA on hospital revenues could be examined if payments were known for mosthospitals in the United States. Actual payment data are considered confidential, however, and only charges arewidely available. Payment-to-charge ratios (PCRs), which convert hospital charges to an estimated payment, havebeen estimated for hospitals in 10 states. Here we evaluated whether PCRs can be predicted for hospitals in statesthat do not provide detailed financial data.
Methods: We predicted PCRs for 5 payer categories for over 1,000 community hospitals in 10 states as a functionof state, market, hospital, and patient characteristics. Data sources included the Healthcare Cost and UtilizationProject (HCUP) State Inpatient Databases, HCUP Hospital Market Structure file, Medicare Provider of Service file, andstate information from several sources. We performed out-of-sample prediction to determine the magnitude ofprediction errors by payer category.
Results: Many individual, hospital, and state factors were significant predictors of PCRs. Root mean squared error ofprediction ranged from 32 to over 100 % of the mean and varied considerably by which states were included orpredicted. The cost-to-charge ratio (CCR) was highly correlated with PCRs for Medicare, Medicaid, and privateinsurance but not for self-pay or other insurance categories.
Conclusions: Inpatient payments can be estimated with modest accuracy for community hospital stays funded byMedicare, Medicaid, and private insurance. They improve upon CCRs by allowing separate estimation by payer type.PCRs are currently the only approach to estimating fee-for-service payments for privately insured stays, whichrepresent a sizable proportion of stays for individuals under age 65. Additional research is needed to improve thepredictive accuracy of the models for all payers.
BackgroundThree major elements of hospital cost accounting arethe charge to payers, the total payment received frompayers, and the cost to produce the services provided.Payments usually fall well below charges because ofnegotiated discounts and delayed or missed payments.Under the Affordable Care Act (ACA), more than 20
million people are expected to gain insurance throughMedicaid or health insurance exchanges [1]. Increasingcoverage could raise hospital revenue and reduce the
need to shift costs to insured patients. The consequencesof ACA on hospital revenues could be examined ifpayments were known for most hospitals in the UnitedStates. Reliable payment data could also enable con-sumers to choose providers that offer better value thanothers, eventually leading to market-level gains in effi-ciency. Such data would also support research on howhospitals negotiate payments for specific conditions,how prices vary among payers, and the financial implica-tions of payer mix within a hospital market area.Medicare and Medicaid fee-for-service payments can
be calculated based on publicly available information,although the effort is labor intensive. Payments fromprivate payers are not publicly available because hospi-tals treat them as proprietary. A standard approach to
* Correspondence: [email protected]†Equal contributors1Truven Health Analytics, 7700 Old Georgetown Rd, Suite 650, Bethesda, MD20814, USAFull list of author information is available at the end of the article
© 2015 Smith et al. Open Access This article is distributed under the terms of the Creative Commons Attribution 4.0International License (http://creativecommons.org/licenses/by/4.0/), which permits unrestricted use, distribution, andreproduction in any medium, provided you give appropriate credit to the original author(s) and the source, provide a link tothe Creative Commons license, and indicate if changes were made. The Creative Commons Public Domain Dedication waiver(http://creativecommons.org/publicdomain/zero/1.0/) applies to the data made available in this article, unless otherwise stated.
Smith et al. BMC Health Services Research (2015) 15:372 DOI 10.1186/s12913-015-1040-8

estimating private payments has been to apply theMedicare cost-to-charge ratio (CCR) to charges for in-patient stays; if profit margins are low then on averagecosts should be similar to payments. This method is onlyapproximate, however, in two senses: payments receivedare not the same as costs incurred, and there can bewide variation in the payments made by private payers,Medicare, and other payers for identical stays. Improvingthe quality of economic analyses will require bettermethods for estimating payments.Levit, Friedman, and Wong [2] obtained confidential
financial data on community hospital stays in 10 states.The data enabled them to calculate hospital-level “price-to-charge” ratios (PCRs) for five types of payers: Medi-care, Medicaid, private insurance, uninsured individuals,and other payers such as workers compensation programs.(Because of the ambiguity of price, we will hereafter referto PCRs as payment-to-charge ratios. The constructionand meaning remain the same as in Levit et al.) The esti-mated payment for a stay in hospital i funded by payer j issimply the charge multiplied by PCRij.The purpose of PCRs is to enable researchers to read-
ily estimate the payment for a hospital stay when exactpayment data are unavailable. Data sources for the PCRestimates include patient demographic and clinical in-formation from administrative claims data, as well aspublicly available information on the hospital and itsmarket, and selected state policies. The PCR is the linkbetween charges, which are widely available, and pay-ments, which are not. PCRs improve on the traditionalCCR method by directly estimating the payment ratherthan approaching it indirectly through estimated costand by providing better granularity in payer types.Accuracy of the PCR is essential to reliable prediction
of payment. Accurate PCRs would be assured if appro-priate financial data were available for all hospital stays.At this time, however, only 10 states of the 46 contribut-ing data to the Healthcare Cost and Utilization Project(HCUP) provide the requisite financial data. We there-fore extended the work of Levit et al. [2] by investigatingwhether PCRs can be estimated for states in which suchfinancial data are not available. Our approach was tomodel the PCRs in the 10 original states using only theinformation that is widely available for states contribut-ing to HCUP. We then assessed the size and stability ofout-of-sample prediction errors for each payer categoryand determined the correlation of the PCRs with trad-itional CCRs.
MethodsEmpirical modelOur goal was to model a separate ratio of payments tocharges for each payer. The data consisted of individ-ual claims that were aggregated to stays and sorted by
primary payer. The payment-to-charge ratio for payertype j is the ratio of total payments to total chargesacross all stays at the hospital with that primary payer.Nearly all values are positive and a few exceed 1.0. Weretained for analysis stays associated with PCRsgreater than zero and no greater than 1.0; the othersrepresent outliers or cannot be modeled with a loga-rithmic link function.We predicted the five PCRs in separate equations as
functions of state, market, hospital, and patient char-acteristics using a generalized linear model with a loglink and gamma-distributed errors. Each equation hasthis form:
g PCRij� � ¼ αj þ βijCij þ γ ijHij þ δijSi þ εij;
where i indexes hospitals, j indexes payer category, Cij
represents casemix variables, Hij are hospital characteris-tics, and Si are state characteristics that apply to everyhospital in the state. A time subscript was unnecessarybecause we analyzed a single year of PCR data. The log-linear specification was chosen on the basis of skewness inresiduals of ordinary least squares models. A PCR is specificto a payer j within a hospital i, so the unit of analysis wasthe hospital-payer combination. Person-level characteristicswere therefore represented by hospital-level means acrossall stays in the dataset.There is potential endogeneity among the PCRs at a
hospital. In a study of the links among hospital marketconcentration, pricing, and profits, Robinson [3] foundevidence that hospitals cut costs in response to lowerMedicare margins, thereby improving margins for bothpublicly and privately insured patients. Hospitals mayreact to higher private-sector profits by raising costs,thereby reducing profits or causing losses for publiclyfunded stays [4]. Hospitals’ margins on publicly insuredpatients may also affect how hard they bargain with pri-vate insurers. A recent review by Frakt [5] found thatcost-shifting from public to private insurance occurs,although it may be less than popularly imagined. Bothstudies imply that the Medicare and Medicaid paymentlevels may affect payment levels for other payers.We wished to capture this within-hospital interaction
in order to improve the accuracy of the PCR estimates.Our approach was an iterative estimation method pro-posed by Telser [6]. Equations are estimated individuallyand the errors are saved. Next, each payer equation isestimated a second time, with the first-stage errors ofthe other payer equations as new independent variables.The process may be repeated. There is no firm guidanceavailable on when the estimates will converge, althoughConniffe [7] suggests that it may occur as soon as thesecond stage. Here we adopt a two-stage model.
Smith et al. BMC Health Services Research (2015) 15:372 Page 2 of 12

We assessed goodness of fit through model character-istics and by assessing the match of actual and predictedPCRs. The specific criteria include the predicted mean,mean absolute error (mean of the absolute value of thepredicted errors), and root mean squared error (RMSE).RMSE is similar to mean absolute error but gives extraweight to larger deviations. Lower mean absolute errorand lower RMSE indicate better fit.
VariablesWe represented casemix through payer-level averageswithin hospital of stay-level indicators for female gen-der, age group (1–7, 18–35, 36–45, 45–55, or 56 yearsand older), race/ethnicity (non-Hispanic White, non-Hispanic Black, Hispanic, and other or missing), andAll-Patient Refined Diagnosis Related Group (APR-DRG) severity level. The severity levels indicate “theextent of physiologic decompensation or organ systemloss of function” [8]. The levels range from 0–4, where0 indicates no decompensation or loss of function and4 indicates almost total decompensation or loss. Eachvalue is represented by a separate indicator variable inthe regression models. Each stands for the proportionof hospital stays during the study period that fell intothat APR-DRG category.Hospital classifications included average DRG weight,
indicators for hospital designation as a critical-accessfacility, a rural referral center, a sole community pro-vider, or a teaching hospital. We calculated average DRGweight within each payer across all discharges whoseprimary payer was the relevant payer category. It isweighted by discharge, rather than by person, as a singleindividual could have more than one hospital stay in ourdata. The critical-access designation was created to en-hance the financial viability of small, isolated, rural, orotherwise necessary hospitals by requiring Medicare topay them on a cost basis rather than prospectively [9].Rural referral centers are rural hospitals with relativelyhigh volume that treat a large number of complicatedcases and transfers from small rural hospitals. TheHerfindahl-Hirschman Index (HHI) captured competi-tion in the hospital market. We defined the market asevery hospital within 15 miles of the one at which astay took place. Changing the radius likely would notaffect the results [10].As noted earlier, we limited our data to community
hospitals in 10 states for which PCRs had been devel-oped by Levit et al. [2]. The states were California,Florida, Massachusetts, Nevada, New Jersey, Virginia,West Virginia, Wisconsin, and two Northern statesthat did not give permission to be identified.We extracted state-level variables from a variety of
state sources that were likely to have an association withPCRs. Several variables capture state Medicaid program
rules and funding and proxy the demand for Medicaidservices. Others reflect general economic conditions ofthe state, which serve as proxies for the supply and de-mand for health care and the likelihood of being insured.The Medicaid data include the Medicaid income eligibil-ity threshold as a proportion of the federal poverty level,for children and separately for adults; the Children’sHealth Insurance Program (CHIP) uptake rate; and theMedicaid spending per capita. We included the numberof federally qualified health centers (FQHCs) for every1,000 nonelderly uninsured individuals in the state.FQHCs are safety-net providers who have access to spe-cial federal grants. The Medicare area wage index wasincluded because hospitals in high- versus low-wageareas may have a different mix of labor and technology,which in turn may be reflected in charges. We hypothe-sized that the state’s fiscal and economic conditions willaffect both supply and demand for health care and thelevel of private vs. public insurance. Included in thestate’s financial health were the unemployment rate, therelative size of the state budget deficit, health spendingper capita, per capita personal income, and the numberof uninsured low-income residents under age 65. If therewas no information pertaining to 2006—the year of thestays we studied—then we used the most recent year forwhich data were available. If that year was 2007 or later,then we used the data as a proxy for 2006 values.The models for Medicare and Medicaid stays each
contained four additional variables: the average num-ber of Medicare (or Medicaid) stays and its square,and the average length of stay (ALOS) for Medicare(or Medicaid) stays, and its square. These variablesreflect the hospital's scale and efficiency. Including thesquare enabled us to estimate whether payments relateto scale and efficiency without the assumption oflinearity.
DataHealthcare cost and utilization project (HCUP)Stay-level records were extracted from the HCUP StateInpatient Databases (SID), sponsored by the Agency forHealthcare Research and Quality (AHRQ). HCUP is oneof the largest data sources on inpatient care in the UnitedStates, featuring records on more than 90 % of communityhospital stays each year [11]. HCUP databases integratethe data collected by state governments, hospital associa-tions, and private data organizations to create a nationalhealth care information resource of hospital, ambulatorysurgery center, and emergency department data. In 2006the SID captured most inpatient stays from all communityhospitals in 46 states. The records include information onpatient demographics, diagnoses, procedures, charges,payers and prices (payments), and hospital characteristics.
Smith et al. BMC Health Services Research (2015) 15:372 Page 3 of 12
HCUP hospital market structure fileThe HHI was derived from the HCUP Hospital MarketStructure file. HHI equals the sum of the squares of themarket shares for hospitals in the market.
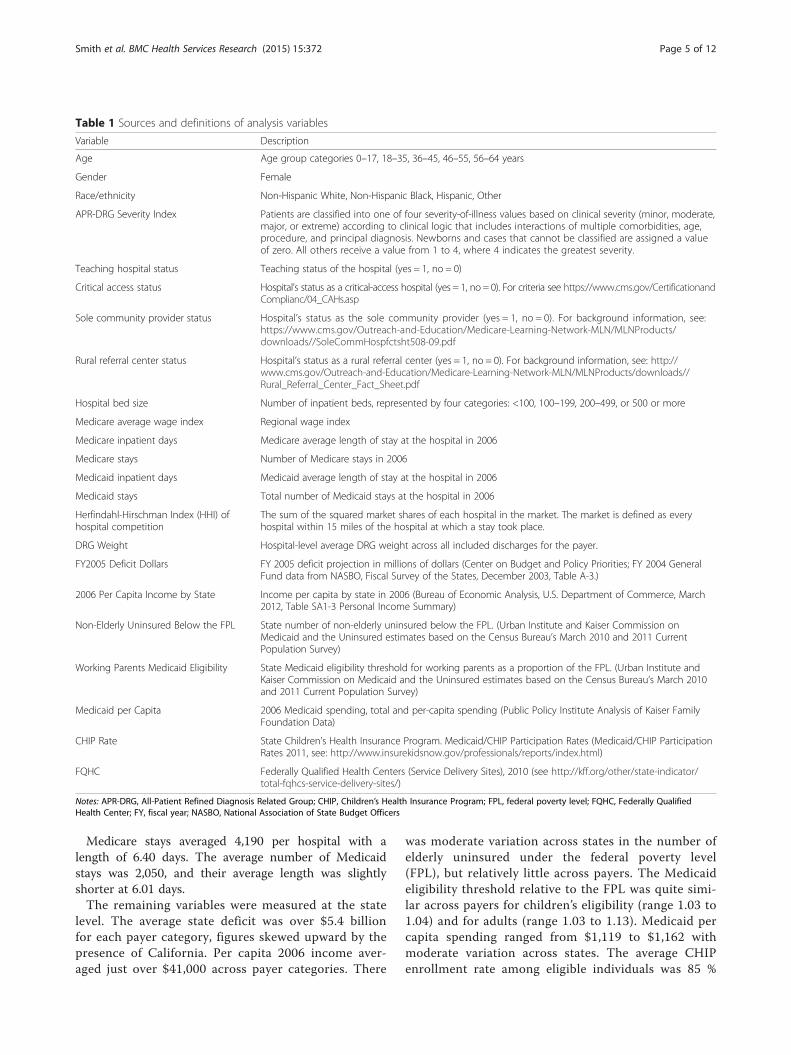
State dataTable 1 lists the data sources for the state policies de-scribed earlier.
PCR valuesWe obtained from AHRQ the PCR values developed byLevit et al. [2]. They represent the dependent variablesof the regression models.
State fixed effectsAlthough our models control for a variety of state pol-icies and characteristics, there could still be unobservedvariation related to PCRs. We therefore estimated thesame models a second time with state fixed effects inplace of the state-level variables.
Out-of-sample validationTo validate the PCR models, we arbitrarily chose onelarge state from each of three Census regions to excludefrom a second round of regressions: California (West),Wisconsin (Midwest), and Florida (South). We then ap-plied the resulting coefficients to stays in the omitted stateand compared the estimated PCRs to the actual PCRs.
Comparison to CCRsHCUP cost-to-charge ratios (CCRs) may be used to esti-mate a hospital’s cost of producing care [12]. AlthoughPCRs represent the payment rather than cost, theyshould be similar to CCRs because hospitals oftenexperience low profit margins. If the PCRs and the CCRcorrelate highly, then the choice between them couldbecome one of researcher convenience. Conversely, lowcorrelations would suggest that studies using the CCRmay be biased for one or more payer types, the cost andthe payment may diverge substantially for certain payertypes, or that PCRs cannot be estimated accurately forsome states.At the hospital level we calculated the Pearson correl-
ation of each of the five estimated PCRs with thehospital CCR. The PCRs were the actual values for the10 states from which they could be calculated directly(Levit et al. [2]) and predicted values from the second-stage regressions for the remaining 35 states. Becausewe believe that values below zero or greater than orequal to 1.0 represent outliers, in the correlation ana-lysis we dropped hospitals for which any of the PCRshad those values. Results are shown with chi-squaresignificance tests.
Analyses were carried out in SAS 9.2 (SAS Institute;Cary, NC) and Stata 11 (StataCorp; College Station, TX).
ResultsDescriptive statisticsThe contributing states had 1,144 hospitals in 2006 [2],about 20 % of all US community hospitals. After elimin-ating hospitals with missing or outlier PCRs, the countof hospitals by category was 1,110 for Medicare, 1,061for Medicaid, 1,105 for private insurance, 899 for self-pay, and 868 for other insurance.Table 2 presents descriptive statistics. The figures are
the means of hospital-level figures. For example, .566 inthe second column indicates that among hospitals withany Medicare patients, an average of 56.6 % of Medicarestays are for females.The average PCR ranged from. 320 for Medicare stays
to. 630 for those funded by other insurance. Within eachpayment category the PCRs had a range of 0.70 orgreater, which represents wide variation across hospitals.The first set of independent variables represents pa-
tient characteristics. Women represented the majority ofinsured stays. The age distribution varied considerablyby payer type, which may reflect the rising illness ratesacross age groups, the effect (for Medicaid in particular)of eligibility based on pregnancy, and the preponderanceof people over age 65 in Medicare based on age-relatedeligibility. Blacks and Hispanics were most common inthe Medicaid and self-pay categories, which reflected alower income and consequent lower likelihood of privateinsurance. There was considerable missingness in therace/ethnicity category, however, which limited our abil-ity to draw firm conclusions. Only a small percentage ofstays (1.3 to 4.2 %) ended in death. Relatively low APR-DRG Severity scores of 1 and 2 were most common,accounting for more than 70 % of stays.Most hospital characteristics had similar frequencies
across payers. Stays in critical access hospital were mostcommon in stays funded by Medicare (9.5 %) or privateinsurance (9.3 %), although they were much less com-mon for self-paid stays and those with other types of in-surance. Only 3.3 to 4.3 % of stays across funders werein rural referral centers, reflecting their relatively smallsize. Sole community providers accounted for similarnumbers of stays across payers as well, from 7.6 to 8.7%. Stays in teaching hospitals were very common,representing 29.4 to 32.4 % of stays on average. TheHerfindahl-Hirschman Index of hospital-market com-petition averaged between 3.45 and 3.81 by payer, withhighest values for stays funded by Medicare and Me-dicaid. The average DRG weight varied considerablyacross payer groups, from .878 for Medicaid to 1.32for Medicare, reflecting the difference in age distribu-tions across payers.
Smith et al. BMC Health Services Research (2015) 15:372 Page 4 of 12
Medicare stays averaged 4,190 per hospital with alength of 6.40 days. The average number of Medicaidstays was 2,050, and their average length was slightlyshorter at 6.01 days.The remaining variables were measured at the state
level. The average state deficit was over $5.4 billionfor each payer category, figures skewed upward by thepresence of California. Per capita 2006 income aver-aged just over $41,000 across payer categories. There
was moderate variation across states in the number ofelderly uninsured under the federal poverty level(FPL), but relatively little across payers. The Medicaideligibility threshold relative to the FPL was quite simi-lar across payers for children’s eligibility (range 1.03 to1.04) and for adults (range 1.03 to 1.13). Medicaid percapita spending ranged from $1,119 to $1,162 withmoderate variation across states. The average CHIPenrollment rate among eligible individuals was 85 %
Table 1 Sources and definitions of analysis variables
Variable Description
Age Age group categories 0–17, 18–35, 36–45, 46–55, 56–64 years
Gender Female
Race/ethnicity Non-Hispanic White, Non-Hispanic Black, Hispanic, Other
APR-DRG Severity Index Patients are classified into one of four severity-of-illness values based on clinical severity (minor, moderate,major, or extreme) according to clinical logic that includes interactions of multiple comorbidities, age,procedure, and principal diagnosis. Newborns and cases that cannot be classified are assigned a valueof zero. All others receive a value from 1 to 4, where 4 indicates the greatest severity.
Teaching hospital status Teaching status of the hospital (yes = 1, no = 0)
Critical access status Hospital’s status as a critical-access hospital (yes = 1, no = 0). For criteria see https://www.cms.gov/CertificationandComplianc/04_CAHs.asp
Sole community provider status Hospital’s status as the sole community provider (yes = 1, no = 0). For background information, see:https://www.cms.gov/Outreach-and-Education/Medicare-Learning-Network-MLN/MLNProducts/downloads//SoleCommHospfctsht508-09.pdf
Rural referral center status Hospital’s status as a rural referral center (yes = 1, no = 0). For background information, see: http://www.cms.gov/Outreach-and-Education/Medicare-Learning-Network-MLN/MLNProducts/downloads//Rural_Referral_Center_Fact_Sheet.pdf
Hospital bed size Number of inpatient beds, represented by four categories: <100, 100–199, 200–499, or 500 or more
Medicare average wage index Regional wage index
Medicare inpatient days Medicare average length of stay at the hospital in 2006
Medicare stays Number of Medicare stays in 2006
Medicaid inpatient days Medicaid average length of stay at the hospital in 2006
Medicaid stays Total number of Medicaid stays at the hospital in 2006
Herfindahl-Hirschman Index (HHI) ofhospital competition
The sum of the squared market shares of each hospital in the market. The market is defined as everyhospital within 15 miles of the hospital at which a stay took place.
DRG Weight Hospital-level average DRG weight across all included discharges for the payer.
FY2005 Deficit Dollars FY 2005 deficit projection in millions of dollars (Center on Budget and Policy Priorities; FY 2004 GeneralFund data from NASBO, Fiscal Survey of the States, December 2003, Table A-3.)
2006 Per Capita Income by State Income per capita by state in 2006 (Bureau of Economic Analysis, U.S. Department of Commerce, March2012, Table SA1-3 Personal Income Summary)
Non-Elderly Uninsured Below the FPL State number of non-elderly uninsured below the FPL. (Urban Institute and Kaiser Commission onMedicaid and the Uninsured estimates based on the Census Bureau’s March 2010 and 2011 CurrentPopulation Survey)
Working Parents Medicaid Eligibility State Medicaid eligibility threshold for working parents as a proportion of the FPL. (Urban Institute andKaiser Commission on Medicaid and the Uninsured estimates based on the Census Bureau’s March 2010and 2011 Current Population Survey)
Medicaid per Capita 2006 Medicaid spending, total and per-capita spending (Public Policy Institute Analysis of Kaiser FamilyFoundation Data)
CHIP Rate State Children’s Health Insurance Program. Medicaid/CHIP Participation Rates (Medicaid/CHIP ParticipationRates 2011, see: http://www.insurekidsnow.gov/professionals/reports/index.html)
FQHC Federally Qualified Health Centers (Service Delivery Sites), 2010 (see http://kff.org/other/state-indicator/total-fqhcs-service-delivery-sites/)
Notes: APR-DRG, All-Patient Refined Diagnosis Related Group; CHIP, Children’s Health Insurance Program; FPL, federal poverty level; FQHC, Federally QualifiedHealth Center; FY, fiscal year; NASBO, National Association of State Budget Officers
Smith et al. BMC Health Services Research (2015) 15:372 Page 5 of 12
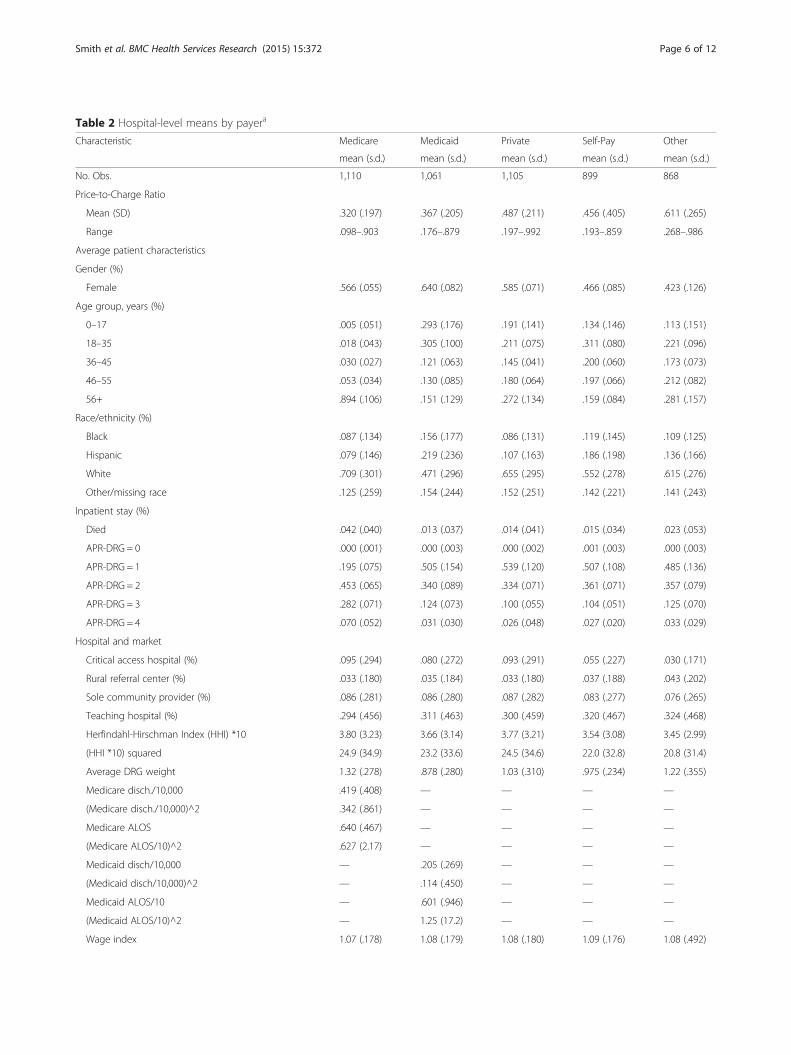
Table 2 Hospital-level means by payera
Characteristic Medicare Medicaid Private Self-Pay Other
mean (s.d.) mean (s.d.) mean (s.d.) mean (s.d.) mean (s.d.)
No. Obs. 1,110 1,061 1,105 899 868
Price-to-Charge Ratio
Mean (SD) .320 (.197) .367 (.205) .487 (.211) .456 (.405) .611 (.265)
Range .098–.903 .176–.879 .197–.992 .193–.859 .268–.986
Average patient characteristics
Gender (%)
Female .566 (.055) .640 (.082) .585 (.071) .466 (.085) .423 (.126)
Age group, years (%)
0–17 .005 (.051) .293 (.176) .191 (.141) .134 (.146) .113 (.151)
18–35 .018 (.043) .305 (.100) .211 (.075) .311 (.080) .221 (.096)
36–45 .030 (.027) .121 (.063) .145 (.041) .200 (.060) .173 (.073)
46–55 .053 (.034) .130 (.085) .180 (.064) .197 (.066) .212 (.082)
56+ .894 (.106) .151 (.129) .272 (.134) .159 (.084) .281 (.157)
Race/ethnicity (%)
Black .087 (.134) .156 (.177) .086 (.131) .119 (.145) .109 (.125)
Hispanic .079 (.146) .219 (.236) .107 (.163) .186 (.198) .136 (.166)
White .709 (.301) .471 (.296) .655 (.295) .552 (.278) .615 (.276)
Other/missing race .125 (.259) .154 (.244) .152 (.251) .142 (.221) .141 (.243)
Inpatient stay (%)
Died .042 (.040) .013 (.037) .014 (.041) .015 (.034) .023 (.053)
APR-DRG = 0 .000 (.001) .000 (.003) .000 (.002) .001 (.003) .000 (.003)
APR-DRG = 1 .195 (.075) .505 (.154) .539 (.120) .507 (.108) .485 (.136)
APR-DRG = 2 .453 (.065) .340 (.089) .334 (.071) .361 (.071) .357 (.079)
APR-DRG = 3 .282 (.071) .124 (.073) .100 (.055) .104 (.051) .125 (.070)
APR-DRG = 4 .070 (.052) .031 (.030) .026 (.048) .027 (.020) .033 (.029)
Hospital and market
Critical access hospital (%) .095 (.294) .080 (.272) .093 (.291) .055 (.227) .030 (.171)
Rural referral center (%) .033 (.180) .035 (.184) .033 (.180) .037 (.188) .043 (.202)
Sole community provider (%) .086 (.281) .086 (.280) .087 (.282) .083 (.277) .076 (.265)
Teaching hospital (%) .294 (.456) .311 (.463) .300 (.459) .320 (.467) .324 (.468)
Herfindahl-Hirschman Index (HHI) *10 3.80 (3.23) 3.66 (3.14) 3.77 (3.21) 3.54 (3.08) 3.45 (2.99)
(HHI *10) squared 24.9 (34.9) 23.2 (33.6) 24.5 (34.6) 22.0 (32.8) 20.8 (31.4)
Average DRG weight 1.32 (.278) .878 (.280) 1.03 (.310) .975 (.234) 1.22 (.355)
Medicare disch./10,000 .419 (.408) — — — —
(Medicare disch./10,000)^2 .342 (.861) — — — —
Medicare ALOS .640 (.467) — — — —
(Medicare ALOS/10)^2 .627 (2.17) — — — —
Medicaid disch/10,000 — .205 (.269) — — —
(Medicaid disch/10,000)^2 — .114 (.450) — — —
Medicaid ALOS/10 — .601 (.946) — — —
(Medicaid ALOS/10)^2 — 1.25 (17.2) — — —
Wage index 1.07 (.178) 1.08 (.179) 1.08 (.180) 1.09 (.176) 1.08 (.492)
Smith et al. BMC Health Services Research (2015) 15:372 Page 6 of 12
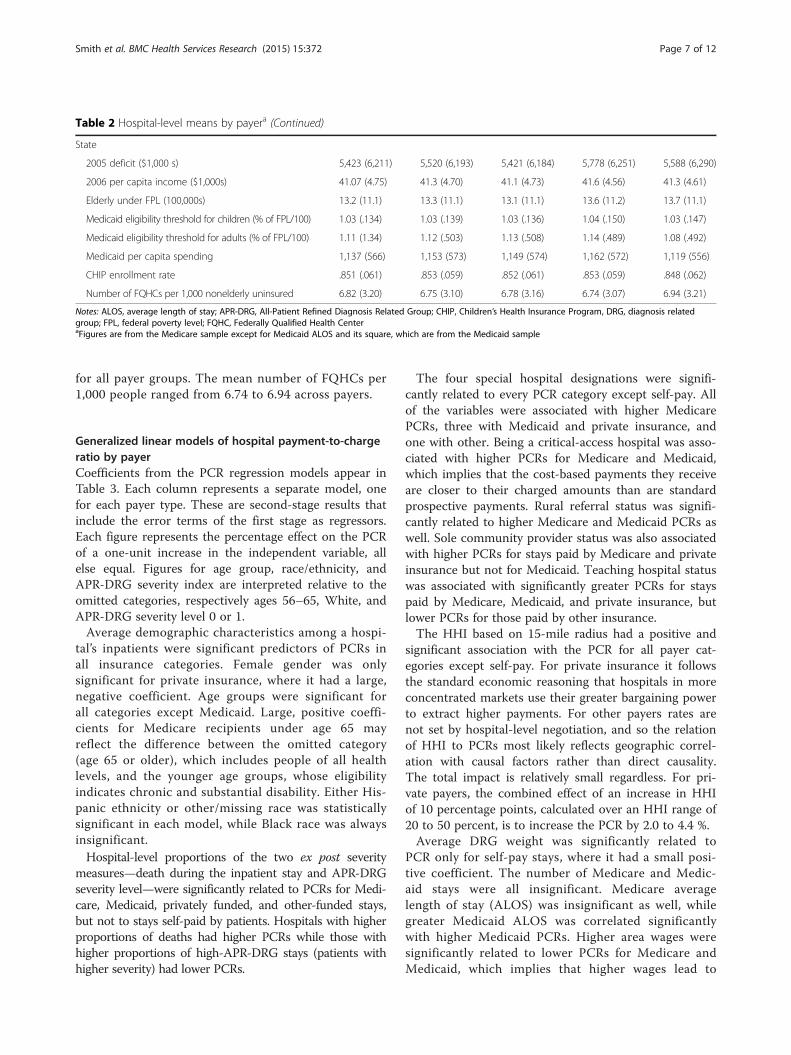
for all payer groups. The mean number of FQHCs per1,000 people ranged from 6.74 to 6.94 across payers.
Generalized linear models of hospital payment-to-chargeratio by payerCoefficients from the PCR regression models appear inTable 3. Each column represents a separate model, onefor each payer type. These are second-stage results thatinclude the error terms of the first stage as regressors.Each figure represents the percentage effect on the PCRof a one-unit increase in the independent variable, allelse equal. Figures for age group, race/ethnicity, andAPR-DRG severity index are interpreted relative to theomitted categories, respectively ages 56–65, White, andAPR-DRG severity level 0 or 1.Average demographic characteristics among a hospi-
tal’s inpatients were significant predictors of PCRs inall insurance categories. Female gender was onlysignificant for private insurance, where it had a large,negative coefficient. Age groups were significant forall categories except Medicaid. Large, positive coeffi-cients for Medicare recipients under age 65 mayreflect the difference between the omitted category(age 65 or older), which includes people of all healthlevels, and the younger age groups, whose eligibilityindicates chronic and substantial disability. Either His-panic ethnicity or other/missing race was statisticallysignificant in each model, while Black race was alwaysinsignificant.Hospital-level proportions of the two ex post severity
measures—death during the inpatient stay and APR-DRGseverity level—were significantly related to PCRs for Medi-care, Medicaid, privately funded, and other-funded stays,but not to stays self-paid by patients. Hospitals with higherproportions of deaths had higher PCRs while those withhigher proportions of high-APR-DRG stays (patients withhigher severity) had lower PCRs.
The four special hospital designations were signifi-cantly related to every PCR category except self-pay. Allof the variables were associated with higher MedicarePCRs, three with Medicaid and private insurance, andone with other. Being a critical-access hospital was asso-ciated with higher PCRs for Medicare and Medicaid,which implies that the cost-based payments they receiveare closer to their charged amounts than are standardprospective payments. Rural referral status was signifi-cantly related to higher Medicare and Medicaid PCRs aswell. Sole community provider status was also associatedwith higher PCRs for stays paid by Medicare and privateinsurance but not for Medicaid. Teaching hospital statuswas associated with significantly greater PCRs for stayspaid by Medicare, Medicaid, and private insurance, butlower PCRs for those paid by other insurance.The HHI based on 15-mile radius had a positive and
significant association with the PCR for all payer cat-egories except self-pay. For private insurance it followsthe standard economic reasoning that hospitals in moreconcentrated markets use their greater bargaining powerto extract higher payments. For other payers rates arenot set by hospital-level negotiation, and so the relationof HHI to PCRs most likely reflects geographic correl-ation with causal factors rather than direct causality.The total impact is relatively small regardless. For pri-vate payers, the combined effect of an increase in HHIof 10 percentage points, calculated over an HHI range of20 to 50 percent, is to increase the PCR by 2.0 to 4.4 %.Average DRG weight was significantly related to
PCR only for self-pay stays, where it had a small posi-tive coefficient. The number of Medicare and Medic-aid stays were all insignificant. Medicare averagelength of stay (ALOS) was insignificant as well, whilegreater Medicaid ALOS was correlated significantlywith higher Medicaid PCRs. Higher area wages weresignificantly related to lower PCRs for Medicare andMedicaid, which implies that higher wages lead to
Table 2 Hospital-level means by payera (Continued)
State
2005 deficit ($1,000 s) 5,423 (6,211) 5,520 (6,193) 5,421 (6,184) 5,778 (6,251) 5,588 (6,290)
2006 per capita income ($1,000s) 41.07 (4.75) 41.3 (4.70) 41.1 (4.73) 41.6 (4.56) 41.3 (4.61)
Elderly under FPL (100,000s) 13.2 (11.1) 13.3 (11.1) 13.1 (11.1) 13.6 (11.2) 13.7 (11.1)
Medicaid eligibility threshold for children (% of FPL/100) 1.03 (.134) 1.03 (.139) 1.03 (.136) 1.04 (.150) 1.03 (.147)
Medicaid eligibility threshold for adults (% of FPL/100) 1.11 (1.34) 1.12 (.503) 1.13 (.508) 1.14 (.489) 1.08 (.492)
Medicaid per capita spending 1,137 (566) 1,153 (573) 1,149 (574) 1,162 (572) 1,119 (556)
CHIP enrollment rate .851 (.061) .853 (.059) .852 (.061) .853 (.059) .848 (.062)
Number of FQHCs per 1,000 nonelderly uninsured 6.82 (3.20) 6.75 (3.10) 6.78 (3.16) 6.74 (3.07) 6.94 (3.21)
Notes: ALOS, average length of stay; APR-DRG, All-Patient Refined Diagnosis Related Group; CHIP, Children’s Health Insurance Program, DRG, diagnosis relatedgroup; FPL, federal poverty level; FQHC, Federally Qualified Health CenteraFigures are from the Medicare sample except for Medicaid ALOS and its square, which are from the Medicaid sample
Smith et al. BMC Health Services Research (2015) 15:372 Page 7 of 12
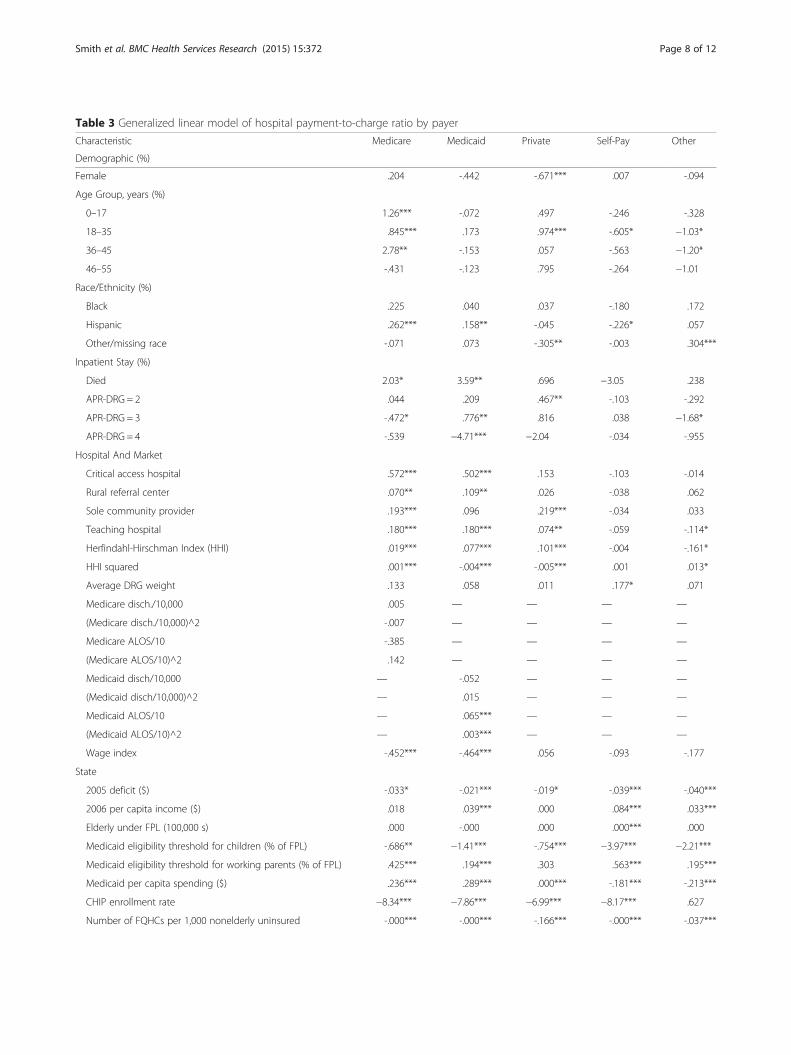
Table 3 Generalized linear model of hospital payment-to-charge ratio by payer
Characteristic Medicare Medicaid Private Self-Pay Other
Demographic (%)
Female .204 -.442 -.671*** .007 -.094
Age Group, years (%)
0–17 1.26*** -.072 .497 -.246 -.328
18–35 .845*** .173 .974*** -.605* −1.03*
36–45 2.78** -.153 .057 -.563 −1.20*
46–55 -.431 -.123 .795 -.264 −1.01
Race/Ethnicity (%)
Black .225 .040 .037 -.180 .172
Hispanic .262*** .158** -.045 -.226* .057
Other/missing race -.071 .073 -.305** -.003 .304***
Inpatient Stay (%)
Died 2.03* 3.59** .696 −3.05 .238
APR-DRG = 2 .044 .209 .467** -.103 -.292
APR-DRG = 3 -.472* .776** .816 .038 −1.68*
APR-DRG = 4 -.539 −4.71*** −2.04 -.034 -.955
Hospital And Market
Critical access hospital .572*** .502*** .153 -.103 -.014
Rural referral center .070** .109** .026 -.038 .062
Sole community provider .193*** .096 .219*** -.034 .033
Teaching hospital .180*** .180*** .074** -.059 -.114*
Herfindahl-Hirschman Index (HHI) .019*** .077*** .101*** -.004 -.161*
HHI squared .001*** -.004*** -.005*** .001 .013*
Average DRG weight .133 .058 .011 .177* .071
Medicare disch./10,000 .005 — — — —
(Medicare disch./10,000)^2 -.007 — — — —
Medicare ALOS/10 -.385 — — — —
(Medicare ALOS/10)^2 .142 — — — —
Medicaid disch/10,000 — -.052 — — —
(Medicaid disch/10,000)^2 — .015 — — —
Medicaid ALOS/10 — .065*** — — —
(Medicaid ALOS/10)^2 — .003*** — — —
Wage index -.452*** -.464*** .056 -.093 -.177
State
2005 deficit ($) -.033* -.021*** -.019* -.039*** -.040***
2006 per capita income ($) .018 .039*** .000 .084*** .033***
Elderly under FPL (100,000 s) .000 -.000 .000 .000*** .000
Medicaid eligibility threshold for children (% of FPL) -.686** −1.41*** -.754*** −3.97*** −2.21***
Medicaid eligibility threshold for working parents (% of FPL) .425*** .194*** .303 .563*** .195***
Medicaid per capita spending ($) .236*** .289*** .000*** -.181*** -.213***
CHIP enrollment rate −8.34*** −7.86*** −6.99*** −8.17*** .627
Number of FQHCs per 1,000 nonelderly uninsured -.000*** -.000*** -.166*** -.000*** -.037***
Smith et al. BMC Health Services Research (2015) 15:372 Page 8 of 12

higher charges that are not fully captured in wageadjustments made in these federal programs. Alterna-tively it could reflect higher charges for other reasonsin areas that also have higher wages.The state characteristics in the models were strongly
associated with several PCRs. Lower PCRs were mostoften associated with worse economic conditions (higherdeficits, lower income) and a more generous (higher)Medicaid eligibility threshold for children. Conversely,more generous eligibility thresholds for working-age par-ents were associated with higher PCRs for four of the fiveinsurance categories. Higher Medicaid spending per capitawas positively related to PCRs for Medicaid, Medicaid,and private insurance but lower PCRs for self-pay andother insurance. Higher CHIP enrollment rates wereassociated with sharply lower PCRs for all categories ex-cept other insurance. A greater number of FQHCs weresignificantly related to lower PCRs in all models.At least one of the first-stage error terms was signifi-
cant in the Medicare, Medicaid, and private insurancemodels. In two cases the relationship was reflected inmutual significance of one’s error in the other’s model:Medicare and Medicaid, and Medicare and privateinsurance. The insignificant coefficients were muchsmaller and were as likely to be negative as positive.
Alternative models with state fixed effectsAn alternative set of models replaced the state-level vari-ables with state fixed effects. Of the 9 included stateeffects—California was the excluded category—from 3 to7 were significant at the 99 % confidence level in eachregression. They produced results (not shown) similarto those of the main models but with slightly worsecorrected values of the corrected Akaike InformationCriterion [13], a measure of overall goodness of fit.We therefore conclude that the main models are doinga sufficient job of capturing state-level variation rele-vant to PCRs.
Out-of-sample validationTable 4 resents results of the out-of-sample validationexercise. We estimated the regression models for eachPCR a total of three times, each time omitting one state.We then estimated the RMSE of the PCRs for theincluded states and, based on out-of-sample estimation,for the omitted states.Out-of-sample RMSE values were lowest for Medicare
(range .177 to .269) and Medicaid (.116 to .287) andhighest for self-pay and other categories (.452 to .900).In-sample RMSE was lower than the out-of-sampleRMSE in most cases, as expected.
Table 3 Generalized linear model of hospital payment-to-charge ratio by payer (Continued)
First-Stage Errors
Medicare PCR — 1.30*** .582*** .095 .196
Medicaid PCR 1.37*** — .224 .151 -.012
Private PCR .598*** .109 — -.236 -.025
Self-Pay PCR -.012 -.022 -.226 — -.092
Other PCR -.007 -.021 -.058** -.089 —
Intercept 6.71*** 6.53 6.57 8.26 1.61
Number of Observations 852 856 854 778 817
Notes: Figure are exponentiated coefficients. ALOS, average length of stay; APR-DRG, All-Patient Refined Diagnosis Related Group; CHIP, Children’s Health InsuranceProgram; disch., stay; DRG, diagnosis related group, FPL, federal poverty level; FQHC, federally qualified health center; PCR, payment-to-charge ratio*p < .05, **p < .01, ***p < .001
Table 4 Out-of-sample validation: RMSEs by payer and omittedstate
Dependent variable RMSE for included states RMSE for omitted state
Omitting California
PCR 1 Medicare .174 .177
PCR 2 Medicaid .186 .287
PCR 3 Private .194 .339
PCR 4 Self-Pay .226 .608
PCR 5 Other .224 .702
Omitting Wisconsin
PCR 1 Medicare .166 .269
PCR 2 Medicaid .191 .203
PCR 3 Private .180 .454
PCR 4 Self-Pay .236 .452
PCR 5 Other .271 .594
Omitting Florida
PCR 1 Medicare .173 .269
PCR 2 Medicaid .196 .116
PCR 3 Private .210 .311
PCR 4 Self-Pay .231 .538
PCR 5 Other .273 .900
Notes: RMSE, root mean squared error
Smith et al. BMC Health Services Research (2015) 15:372 Page 9 of 12
The results varied notably by omitted state. For privatelyfunded stays, for example, the RMSE for the omitted statewas .339 for California, .454 for Wisconsin, and .311 forFlorida. The average PCR for privately funded stays acrossall states was .487. The out-of-sample RMSEs for privatelyfunded stays therefore represent 69.6 %, 93.2 %, and63.9 % of the mean, respectively.
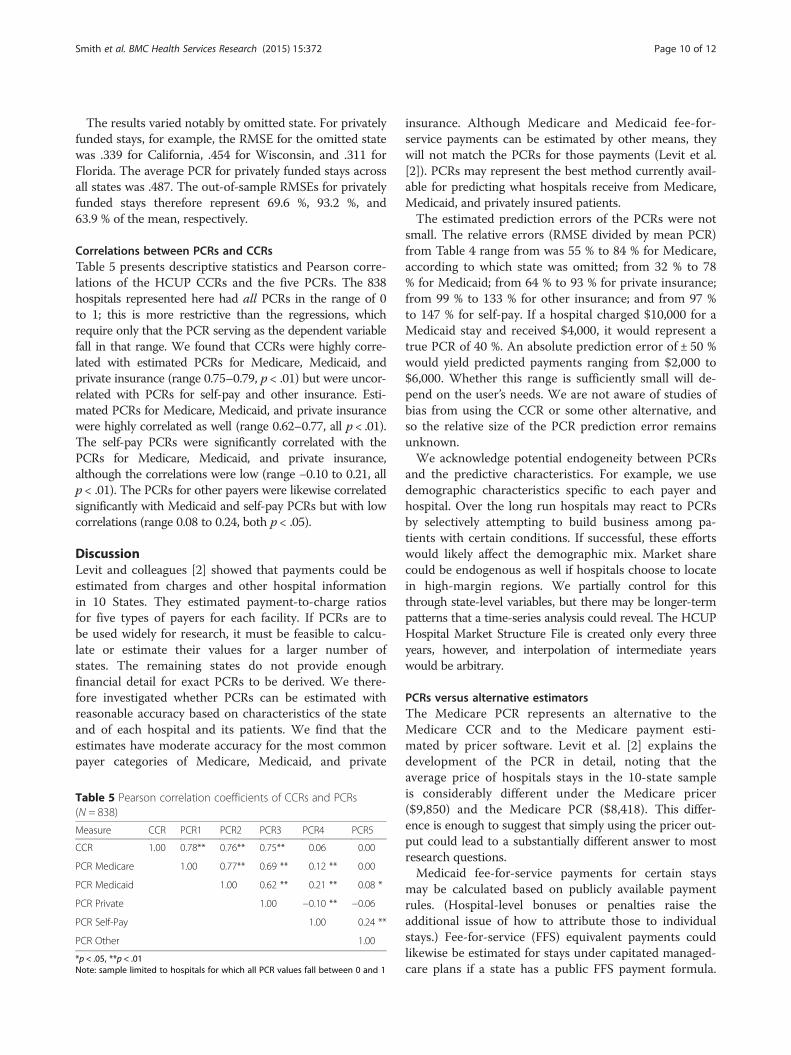
Correlations between PCRs and CCRsTable 5 presents descriptive statistics and Pearson corre-lations of the HCUP CCRs and the five PCRs. The 838hospitals represented here had all PCRs in the range of 0to 1; this is more restrictive than the regressions, whichrequire only that the PCR serving as the dependent variablefall in that range. We found that CCRs were highly corre-lated with estimated PCRs for Medicare, Medicaid, andprivate insurance (range 0.75–0.79, p < .01) but were uncor-related with PCRs for self-pay and other insurance. Esti-mated PCRs for Medicare, Medicaid, and private insurancewere highly correlated as well (range 0.62–0.77, all p < .01).The self-pay PCRs were significantly correlated with thePCRs for Medicare, Medicaid, and private insurance,although the correlations were low (range −0.10 to 0.21, allp < .01). The PCRs for other payers were likewise correlatedsignificantly with Medicaid and self-pay PCRs but with lowcorrelations (range 0.08 to 0.24, both p < .05).
DiscussionLevit and colleagues [2] showed that payments could beestimated from charges and other hospital informationin 10 States. They estimated payment-to-charge ratiosfor five types of payers for each facility. If PCRs are tobe used widely for research, it must be feasible to calcu-late or estimate their values for a larger number ofstates. The remaining states do not provide enoughfinancial detail for exact PCRs to be derived. We there-fore investigated whether PCRs can be estimated withreasonable accuracy based on characteristics of the stateand of each hospital and its patients. We find that theestimates have moderate accuracy for the most commonpayer categories of Medicare, Medicaid, and private
insurance. Although Medicare and Medicaid fee-for-service payments can be estimated by other means, theywill not match the PCRs for those payments (Levit et al.[2]). PCRs may represent the best method currently avail-able for predicting what hospitals receive from Medicare,Medicaid, and privately insured patients.The estimated prediction errors of the PCRs were not
small. The relative errors (RMSE divided by mean PCR)from Table 4 range from was 55 % to 84 % for Medicare,according to which state was omitted; from 32 % to 78% for Medicaid; from 64 % to 93 % for private insurance;from 99 % to 133 % for other insurance; and from 97 %to 147 % for self-pay. If a hospital charged $10,000 for aMedicaid stay and received $4,000, it would represent atrue PCR of 40 %. An absolute prediction error of ± 50 %would yield predicted payments ranging from $2,000 to$6,000. Whether this range is sufficiently small will de-pend on the user’s needs. We are not aware of studies ofbias from using the CCR or some other alternative, andso the relative size of the PCR prediction error remainsunknown.We acknowledge potential endogeneity between PCRs
and the predictive characteristics. For example, we usedemographic characteristics specific to each payer andhospital. Over the long run hospitals may react to PCRsby selectively attempting to build business among pa-tients with certain conditions. If successful, these effortswould likely affect the demographic mix. Market sharecould be endogenous as well if hospitals choose to locatein high-margin regions. We partially control for thisthrough state-level variables, but there may be longer-termpatterns that a time-series analysis could reveal. The HCUPHospital Market Structure File is created only every threeyears, however, and interpolation of intermediate yearswould be arbitrary.
PCRs versus alternative estimatorsThe Medicare PCR represents an alternative to theMedicare CCR and to the Medicare payment esti-mated by pricer software. Levit et al. [2] explains thedevelopment of the PCR in detail, noting that theaverage price of hospitals stays in the 10-state sampleis considerably different under the Medicare pricer($9,850) and the Medicare PCR ($8,418). This differ-ence is enough to suggest that simply using the pricer out-put could lead to a substantially different answer to mostresearch questions.Medicaid fee-for-service payments for certain stays
may be calculated based on publicly available paymentrules. (Hospital-level bonuses or penalties raise theadditional issue of how to attribute those to individualstays.) Fee-for-service (FFS) equivalent payments couldlikewise be estimated for stays under capitated managed-care plans if a state has a public FFS payment formula.
Table 5 Pearson correlation coefficients of CCRs and PCRs(N = 838)
Measure CCR PCR1 PCR2 PCR3 PCR4 PCR5
CCR 1.00 0.78** 0.76** 0.75** 0.06 0.00
PCR Medicare 1.00 0.77** 0.69 ** 0.12 ** 0.00
PCR Medicaid 1.00 0.62 ** 0.21 ** 0.08 *
PCR Private 1.00 −0.10 ** −0.06
PCR Self-Pay 1.00 0.24 **
PCR Other 1.00
*p < .05, **p < .01Note: sample limited to hospitals for which all PCR values fall between 0 and 1
Smith et al. BMC Health Services Research (2015) 15:372 Page 10 of 12
Gathering the information, particularly interstate variationsin Medicaid payment and coverage, could be quite burden-some for a regional or national study. For Medicaid-fundedstays within one or a few states, though, this approachcould be preferable.PCRs may be the only option beyond CCRs for esti-
mating prices for privately insured and self-paid stays,and the few funded by other types of insurance. Little orno information is publicly available on payments fromthose insurance sources, and almost by constructionthere is no information on self-paid stays.We found that CCRs were highly correlated with PCRs
for Medicare, Medicaid, and private insurance. A highcorrelation makes sense given the relatively low profitmargins of hospitals; a low profit margin indicates thatpayments are similar to costs on average. CCRs did notcorrelate well with PCRs for self-pay and other insur-ance, however. This could reflect an inherent lack ofcorrelation or variation across hospitals in our ability toaccurately estimate PCRs for those categories of payers.Regardless, correlation does not imply a lack of bias northe relative size of any bias in CCRs or PCRs, but merelythat the CCR and PCR values tend to move in tandemacross hospitals.
Uses of PCRsPCRs can assist researchers and policymakers in severalways. The most obvious is to observe how paymentsvary by primary payer. They can be used to understanddifferences in payments across geographic regions, atany level of geographic specificity, and to see how thosereact to policies at the state and federal level. A study byWhite [14] analyzed how hospitals respond to Medicarepayment cuts; PCRs would provide an alternative andstraightforward method for measuring Medicare pay-ments, and it would allow estimation of the impact ofMedicare payment changes on payments by privateinsurers. PCRs can help public policymakers to betterunderstand hospitals’ responses to differential paymentamounts for similar services across payers. PCRs repre-sent an alternative to proprietary databases for obtainingestimated payments for privately insured stays. They alsoprovide insight into payments received for uninsuredstays, a category not found in claims databases becauseno insurance claim was filed.We see three options for researchers considering use
of PCRs. One is to use the parameter estimates from ourtables with relevant hospital and state characteristics todevelop PCRs for additional states. This approach wouldbe useful for developing payment metrics for broadanalyses. If greater precision is needed, then it may beadvisable instead to use the estimates from Levit et al.[2] in the original 10 states. A third option is to useCCRs as a rough approximation of PCRs. The two have
fairly high correlations for major payer categories. Withthe caveats noted above, using CCRs may be sufficientfor comparisons within a small group of hospitals.
ConclusionHospital payments for stays funded by Medicare, Medicaid,and private insurance can be predicted with moderateaccuracy for states where this information is not provided.Together with the directly calculated PCRs availablefrom Levit et al. [2], researchers can now obtain pay-ment estimates for community hospital stays frommajor payer groups.The results illustrate the wide range of hospital payment-
to-charge ratios by payer and the considerable variation inthese ratios across states. Because the prediction errors arelarge for predicted PCRs of self-pay and other insurance,better models will be needed before they can be estimatedwith acceptable accuracy.
Competing interestsThe authors declare that they have no competing interests.
Authors’ contributionsBF and HW conceived of the study. All authors participated in studyplanning. MS and ZK oversaw the statistical analyses. All authors participatedin interpretation of study results. MS drafted the manuscript withcontributions from ZK and HW. All authors read and approved the finalmanuscript.
AcknowledgementsThe analysis included data from the following HCUP Partner organizations:California Office of Statewide Health Planning & Development, FloridaAgency for Health Care Administration, Massachusetts Division of HealthCare Finance and Policy, Nevada Department of Health and Human Services,New Jersey Department of Health, Virginia Health Information, West VirginiaHealthcare Authority, Wisconsin Department of Health Services, and twoadditional Northern states for which permission to identify was not obtained.This work was funded by Agency for Healthcare Research and Quality. Theauthors thank Yu Sun for programming support, Arpit Misra for helpfulcomments, and Linda Lee for editorial assistance. The views expressed in thisarticle are those of the authors and do not necessarily reflect those of theAgency for Healthcare Research and Quality or the U.S. Department ofHealth and Human Services.
Author details1Truven Health Analytics, 7700 Old Georgetown Rd, Suite 650, Bethesda, MD20814, USA. 2Agency for Healthcare Research and Quality, 540 Gaither Road,Rockville, MD 20850, USA.
Received: 29 September 2014 Accepted: 4 September 2015
References1. Foster RS: Estimated financial effects of the ‘Patient Protection and
Affordable Care Act,’ as amended. https://www.cms.gov/ActuarialStudies/Downloads/PPACA_2010-04-22.pdf. Accessed 22 January 2015.
2. Levit KR, Friedman B, Wong HS. Estimating inpatient hospital prices fromstate administrative data and hospital financial reports. Health Serv Res.2013;48:1779–97.
3. Robinson J. Hospitals respond to Medicare payment shortfalls by bothshifting costs and cutting them, based on market concentration. Health Aff.2011;30:1265–71.
4. Stensland J, Gaumer ZR, Miller ME. Private-payer profits can induce negativeMedicare margins. Health Aff. 2010;29:1045–51.
5. Frakt AB. How much do hospitals cost shift? A review of the evidence.Milbank Quarterly. 2011;89:90–130.
Smith et al. BMC Health Services Research (2015) 15:372 Page 11 of 12
6. Telser L. Iterative estimation of a set of linear regression equations. J AmStat Assoc. 1964;59:845–62.
7. Conniffe D. A note on seemingly unrelated regressions. Econometrica.1982;50:229–33.
8. Averill AF, Goldfield N, Hughes JS, Bonazelli J, McCullough EC, Steinbeck BA,Mullin R, Tang AM, Muldoon J, Turner L, Gay J: All Patient Refined DiagnosisRelated Groups (APR-DRGs), version 20: methodology overview. http://www.hcup-us.ahrq.gov/db/nation/nis/APR-DRGsV20MethodologyOverviewandBibliography.pdf. Accessed 22 January 2015.
9. Rosko M, Mutter R. Inefficiency differences between critical access hospitals andprospectively paid rural hospitals. J Health Polit Policy Law. 2010;35:95–126.
10. Wong HS, Zhan CL, Mutter R. Do different measures of hospital competitionmatter in empirical investigations of hospital behavior? Rev Ind Organ.2005;26:61–87.
11. Agency for Healthcare Research and Quality [AHRQ]: Databases and relatedtools from HCUP. Fact sheet. AHRQ Publication No. 10-P009-EF, March 2011.http://www.ahrq.gov/research/findings/factsheets/tools/hcupdata/index.html. Accessed 22 January 2015.
12. Agency for Healthcare Research and Quality [AHRQ]: Healthcare Cost andUtilization Project (HCUP). Cost-to-charge ratio files. www.hcup-us.ahrq.gov/db/state/costtocharge.jsp. Accessed 22 January 2015.
13. Burnham KP, Anderson DR. Multimodel inference: understanding AIC andBIC in model selection. Soc Methods Res. 2004;33:90–130.
14. White C. How do hospitals cope with sustained slow growth in Medicareprices? Health Serv Res. 2014;49:11–31.
Submit your next manuscript to BioMed Centraland take full advantage of:
• Convenient online submission
• Thorough peer review
• No space constraints or color figure charges
• Immediate publication on acceptance
• Inclusion in PubMed, CAS, Scopus and Google Scholar
• Research which is freely available for redistribution
Submit your manuscript at www.biomedcentral.com/submit
Smith et al. BMC Health Services Research (2015) 15:372 Page 12 of 12