Embed Size (px)
Citation preview

Predicting indices of climate extremes using eigenvectors of
SST and MSLP
Malcolm Haylock, CRU

Predictands
• 601R Mean climatological precipitation (mm/day)
• precXXp XXth percentile of rainday amounts (mm/day)
• fracXXp Fraction of total precipitation above annual XXth percentile
• 606R10 No. of days precip >= 10mm
• 641CDD Max no. consecutive dry days
• 642CWD Max no. consecutive wet days
• pww Mean wet-day persistence
• persist_dd Mean dry-day persistence
• persist_corr Correlation for spell lengths
• wet_spell_mean mean wet spell lengths (days)
• wet_spell_perc median wet spell lengths (days)
• wet_spell_sd standard deviation wet spell lengths (days)
• dry_spell_mean mean dry spell lengths (days)
• dry_spell_perc median dry spell lengths (days)
• dry_spell_sd standard deviation dry spell lengths (days)
• 643R3d Greatest 3-day total rainfall
• 644R5d Greatest 5-day total rainfall
• 645R10d Greatest 10-day total rainfall
• 646SDII Simple Daily Intensity (rain per rainday)
• 691R90N No. of events > long-term 90th percentile
• 692R90T % of total rainfall from events > long-term 90th percentile
33 rainfall indices calculated seasonally for 27 stations in SE England
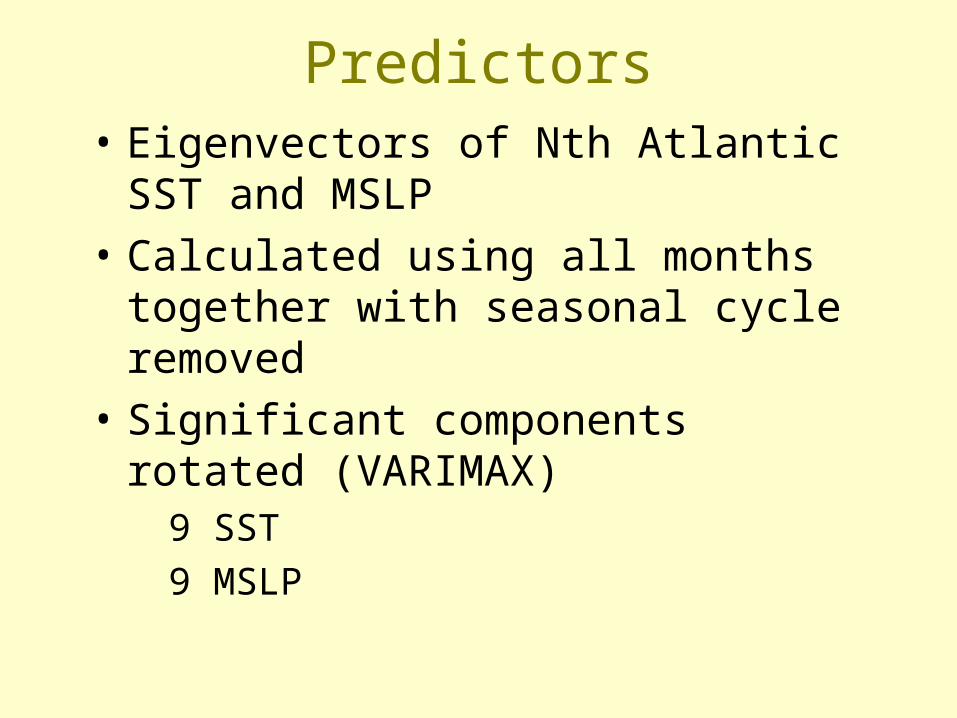
Predictors• Eigenvectors of Nth Atlantic SST and
MSLP
• Calculated using all months together with seasonal cycle removed
• Significant components rotated (VARIMAX) 9 SST 9 MSLP

1960 1970 1980 1990 2000 2010
-3
-2
-1
0
1
2
3
4
SST Scores PC: 1

1960 1970 1980 1990 2000 2010
-6
-4
-2
0
2
4
6
SST Scores PC: 2

1960 1970 1980 1990 2000 2010
-4
-3
-2
-1
0
1
2
3
SST Scores PC: 3

1960 1970 1980 1990 2000 2010
-4
-3
-2
-1
0
1
2
3
4
SST Scores PC: 1

1960 1970 1980 1990 2000 2010
-4
-3
-2
-1
0
1
2
3
4
SST Scores PC: 2

1960 1970 1980 1990 2000 2010
-4
-3
-2
-1
0
1
2
3
4
SST Scores PC: 3

The Model• 1960-2000
• Multiple linear regression using singular value decomposition
• Best predictors selected using cross-validation For each combination of predictors (2n):
• Remove a year
• Find MLR coefficients
• Hindcast missing year
• Assess skill using all hindcasts

Skill of model
• Build model using all years except 1979-93 then hindcast these years and compare
• Double cross-validation For each year in 1960-2000:
• Remove a year
• Use cross-validation to find best model
• Hindcast missing year
• Assess skill using all hindcasts

LEPS - Linear Error in Probability Space
0
0.25
0.5
0.75
1
Predictand
Cu
mu
lati
ve F
req
ue
ncy
Obs. Forecast
abs(pf - pv) LEPS=1- abs(pf - pv)1 is perfect forecast0 is worst possible forecast
pf
pv

…LEPS• For single forecast
LEPS' = LEPS - LEPS(climatology)= abs(pv - 0.5) - abs(pf - pv)
• For set of forecasts
pS
LEPSLEPS
'
'%
pSS ',0' If = LEPS'(perfect forecast)
pSS ',0' If = LEPS'(worst case)
100 = all perfect forecasts 0 = all climatology-100 = all worst case forecasts

-100 -80 -60 -40 -20 0 20 40 60 80 100
-100
-80
-60
-40
-20
0
20
40
60
80
100
LEPS(hindcast)
LEP
S(d
x-va
l)
LEPS(hindcast) vs LEPS(dx-val) SST onlySST only. LEPS(hindcast) vs LEPS(dx-val)


-100 -80 -60 -40 -20 0 20 40 60 80 100
-100
-80
-60
-40
-20
0
20
40
60
80
100
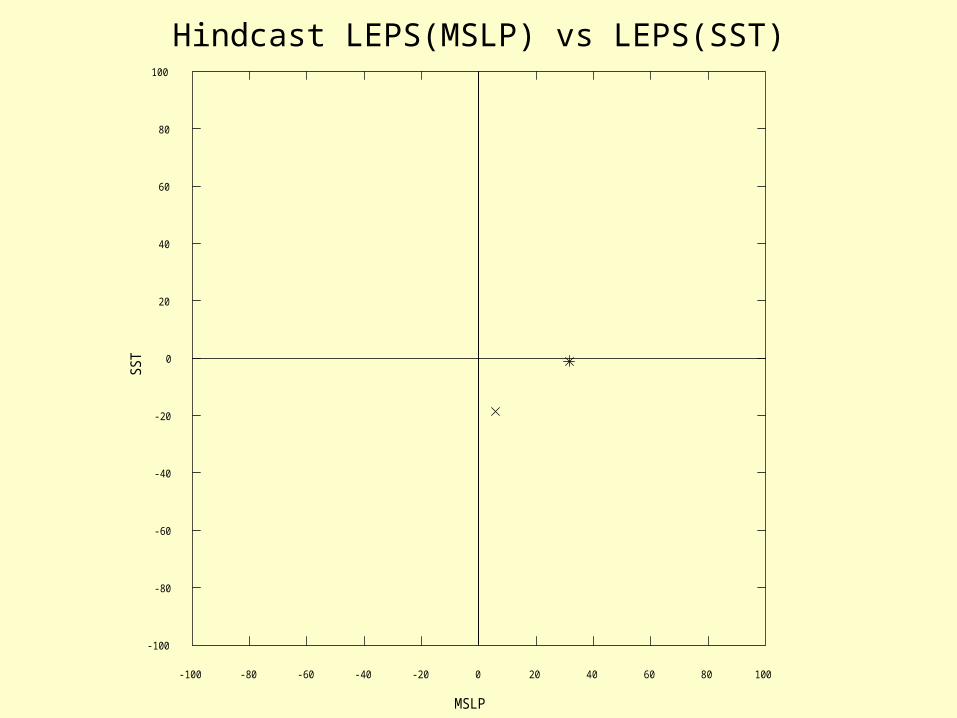
MSLP
SS
T
Hindcast LEPS(MSLP) vs LEPS(SST)Hindcast LEPS(MSLP) vs LEPS(SST)

Where to...
• NW England
• Other European stations
• Combined SST and MSLP (trim predictors)
• Other predictors?