Embed Size (px)
Citation preview
Team Project - Business Intelligence using Data Mining
S r i k a n t h S V
A y e s h a R a h m a n
M o t o k i S a i t o
R a n g a s a y e e L a l g u d i C h a n d r a s e k a r a n
A n a n d A g r a w a l
I n d i a n S c h o o l o f B u s i n e s s
Predicting Indian Movie Ratings on IMDB
2
1 Executive Summary
The Indian movie industry produces the maximum number of movies per year at 1000/year,
higher than any other country’s movie industry. However, very few movies taste success and
are ranked high. Given the low success rate, models and mechanisms to predict reliably the
ranking and / or box office collections of a movie can help de-risk the business significantly
and increase average returns. Various stakeholders such as actors, financiers, directors etc.
can use these predictions to make more informed decisions. Some of the questions that can be
answered using prediction models are given below.
1. Does the cast or director matter in the success or ranking of an Indian movie?
2. Is the genre of the Indian movie a key determinant of rank or success?
3. Does running time matter?
Further, a DVD rental agency or a distribution house could use these predictions to determine
which titles to stock or promote respectively.
Data from the Internet Movie Database (IMDB) was gleaned and various data mining and
prediction techniques such as multi-linear regression, regression tree and K-nearest neighbors
were used to devise a model that can predict an Indian movie’s ranking with an RMSE of 1.5
on a scale of 1 to 10.
2 Problem Description
While extensive description and data is available for Hollywood movies, detailed
descriptions about movies from other countries are hard to find. India, especially, is an
interesting case in point. The Indian movie industry produces approximately 1000 movies per
year, one of the highest worldwide. However, a structured database or a central repository of
Indian movie data is not available.
The objective of the project is to predict the ranking of Indian movies on www.imdb.com
using information available from different sources including IMDB itself.
IMDB Rating / Ranking: IMDB offers a rating / ranking scale that allows users to rate films
by choosing one of ten categories in the range 1–10, with each user able to submit one rating.
The points of reference given to users of these categories are the descriptions "1 (awful)" and
3
"10 (excellent)"; and these are the only descriptions of categories. Due to the minimum
category being scored one, the mid-point of the range of scores is 5.5, rather than 5.0 as
might intuitively be expected given a maximum score of ten. This rating system has since
been implemented for television programming on an episode-by-episode basis1.
3 Data
3.1 Data Preparation
Initially, a total of 2.5 million records were collected from IMDB2. The data downloaded was
a raw data dump of 15 list files with each list file containing the movie ID and one other
potential predictor or movie attribute. The attributes are:
Votes
Month and year of release
Genres – Drama, Action, Romance, Comedy, Other
Running time
Languages – Hindi, Telugu, Tamil, Other
As a first step, a database containing information about all the aforementioned attributes
needed to be created in order to carry out further modeling or processing. Excel was unable to
handle the large number of records. As an alternative to excel, the Java Movie Database
(JMDB) tool provided a way to aggregate the information available on the IMDB into a
relational database and search for information using SQL queries.
Note that the IMDB site predominantly contains data for Hollywood movies. However, of the
millions of records, only 958 records had the country of origin as India and all other relevant
information for the attributes listed above. Quite a few Indian movies had a few lines in a
language, regional or English. In these cases, this language was also listed against the movie
language attribute. Since this information is not relevant information for our purposes, these
records were cleaned to reflect the language in which the movie was made or dubbed.
1 http://en.wikipedia.org/wiki/Internet_Movie_Database#User_ratings_of_films Accessed on Dec 28, 2011
2 Data source: ftp://ftp.fu-berlin.de/pub/misc/movies/database/
4
Based on domain knowledge and the palate of the Indian moviegoer, more attributes and
interaction variables were added to the list. To do this, Filmfare award winning actors,
actresses and directors were added to the database. The list was obtained from Wikipedia
http://en.wikipedia.org/. After further processing, the number of award winning actors,
actresses and directors were added to each movie record.
To summarize, the added attributes are:
Interaction variables:
o Romance & Comedy Genre (RomCom)
o Action & Comedy Genre (ActCom)
o Masala Genre – Drama, Action, Romance, Comedy
Star power scores:
o Star actor count
o Star actress count
o Star director count
3.2 Data Exploration
TIBCO Spotfire Visualization tool was used to explore the data and study relationships
between the predictors or between a predictor and the predicted or “Y” variable, which is
movie rank (1-10) for this project. Some relationships are illustrated using plots in the
Appendix Data Exploration.
All predictors listed in Data Preparation section were deemed valid except the year of release
and the number of votes. The year typically is not expected to impact movie ranking or box
office collection and the number of votes a movie receives is not available apriori and can
only be used for profiling.
4 Results
Since the objective is to predict a numerical Y, i.e. movie rank, which ranges from 1 to 10,
multi-linear regression, regression tree and K-Nearest Neighbor methods of prediction were
5
used. Spotfire Miner was used to run the multi-linear regression and regression tree and
XLMiner was used to run K-Nearest Neighbors.
Multi-linear regression
Movie rank = 5.29 (Intercept) + 0.17 Drama + 0.06 Action -0.06 Romance -0.18 Comedy
+ 0.04 Other Genre + .00209 Running - 0.31 Hindi - 0.05 Telugu -0.07 Tamil -0.17
English + 0.05 Other Language + 0.19 RomCom - 0.14 ActRom + 0.1 Masala + 0.05
Month + 0.04 Star Actress Count + 0.04 Star Actor count + 0.04 Star-pairing + 0.64 Star
Director count
The regression tree and K-Nearest Neighbor lift charts are provided in the Appendix,
Prediction Models.
5 Performance
The performance of the three methods of prediction is similar. Given that the movie rank
ranges from 1-10, an RMSE of 1.5 seems tolerable. Error variance of all three methods
hovers around 1.5.
Prediction Method RMSE Training RMSE Validation
Multi-linear regression 1.3601 1.3892
Regression tree 1.2610 1.4526
K-Nearest Neighbors (50-30-20 partition) 0.0824 (Validation) 1.7433 (Test)
Table 1 Performance of prediction methods
6 Findings
1. Language related predictors: Movies from other languages or regional languages have
a higher rank compared to movies in mainstream languages such as Hindi, Tamil or
Telugu. While this seems like an interesting result, a caveat is that movies from
regional languages are under represented in the dataset. Further, only the popular and
better movies in regional languages are available in IMDB. Therefore, this result
might not hold water in a dataset representative of the population.
6
2. Genre related predictors: While slapstick comedy alone doesn’t improve a movie’s
rank, movies with comedy laced with romance (RomCom) have a higher rank on
average. Given the number of movies with comedy as a central theme, this result
could serve as a useful way to differentiate a movie from its competition and gain the
popular vote. Further, masala movies hold their own with a higher rank amongst other
Indian movies.
3. Star Power: Directors have much higher clout and influence a movie’s rank more
strongly compared to actors, actresses or the star pairing in a movie. While this is
surprising, this is hinting at the potential of star directors to extract a quality
performance from his / her cast and delivers a superior product after understanding
the pulse of the audience.
7 Conclusion The prediction model arrived at provides some key insights on the palate of the audience of
an Indian movie and gives a sense for what governs the movie ranking on IMDB. The
predictive accuracy can be improved if a better and more exhaustive listing of Indian movies
were available on IMDB. Using Filmfare awards information for actors, actresses and
directors, the predictive accuracy of the model was improved and brought to fore some
interesting aspects.
Similarly, the model can be improved by incorporating more social media information and
capturing user sentiments and feedback such as Likes, Mentions, Referrals, Tweets and Re-
tweets on platforms such as Facebook and Twitter.
A recent venture called Khyati Entertainment Pvt. Ltd3 makes for interesting reading as the
method they use for prediction uses similar predictors to those used in this project! This could
potentially mark the beginning of yet another lucrative space for using data mining for
business intelligence.
3 http://articles.timesofindia.indiatimes.com/2011-12-26/bhopal/30558648_1_film-critic-box-office-
bollywood-movie
7
8 Appendix
8.1 Data Exploration
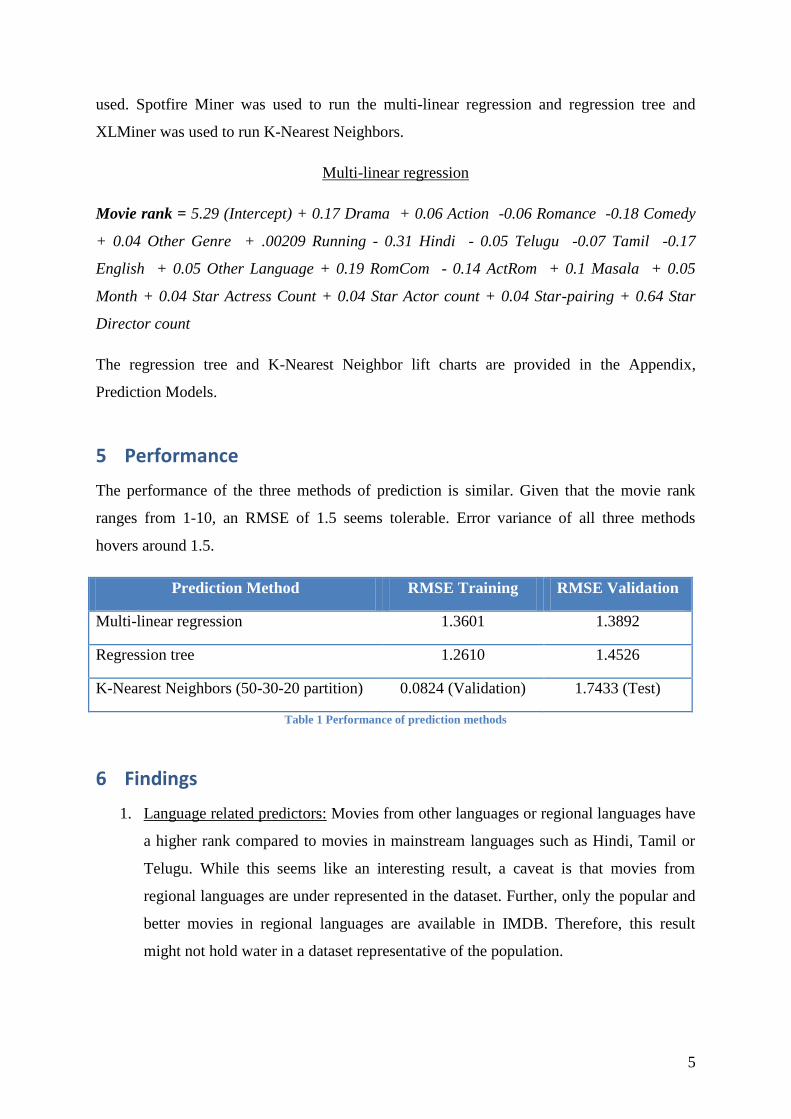
Figure 1 Rank v/s Month of release
From Figure 1, it can be seen that movies that release towards the end of the year are ranked
slightly higher. This improvement is quantified using regression and K-NN models.
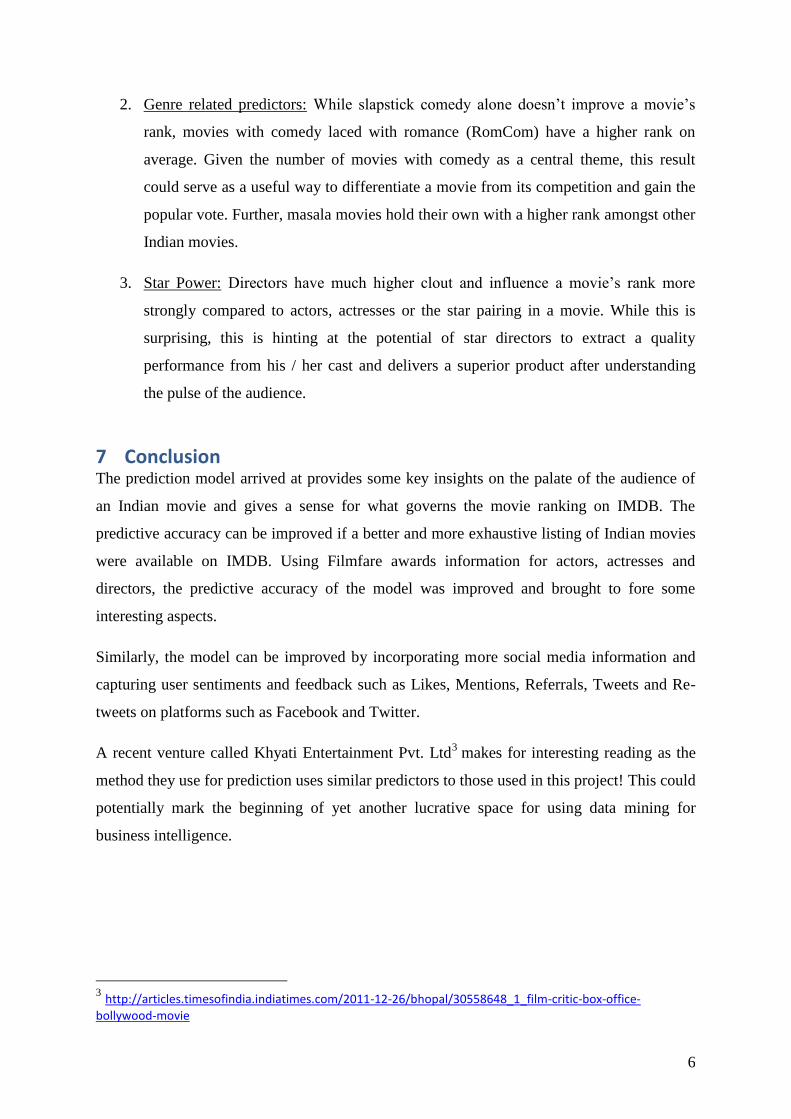
Figure 2 Votes v/s Rank
8
From Figure 2, it can be seen that better ranked movies have higher votes. However, since
voting information is not available prior to release, this relationship is more useful for
profiling and explanation.
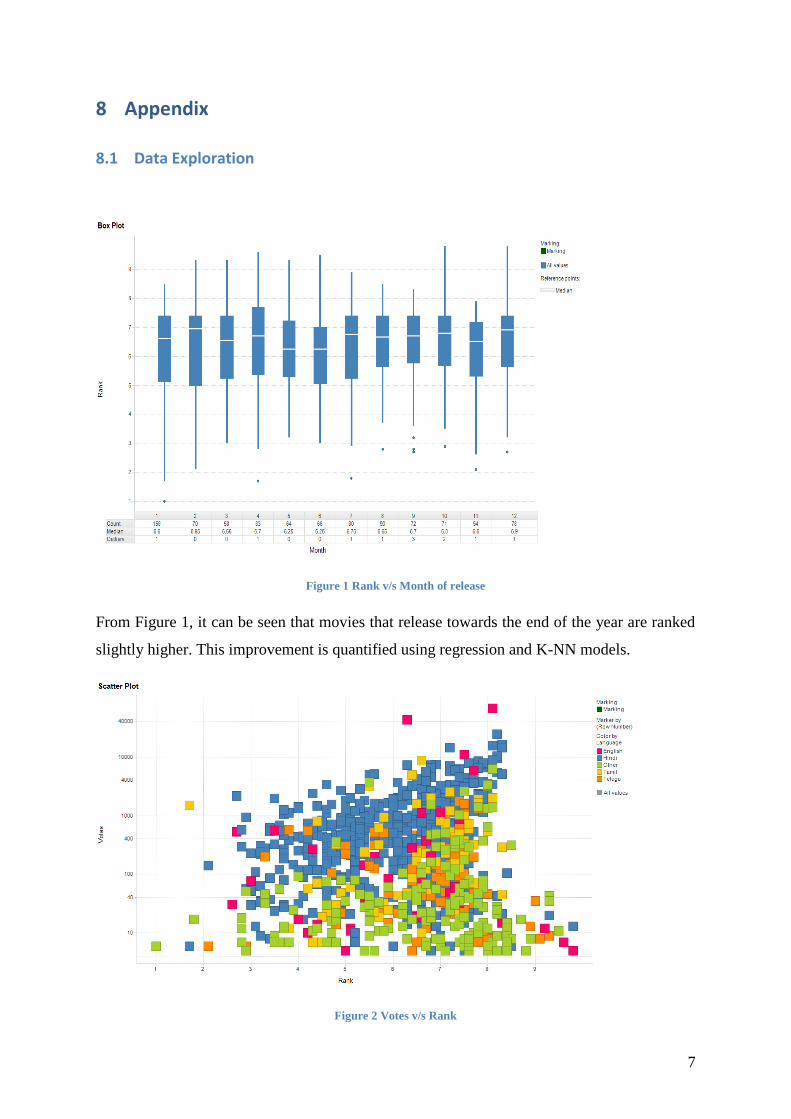
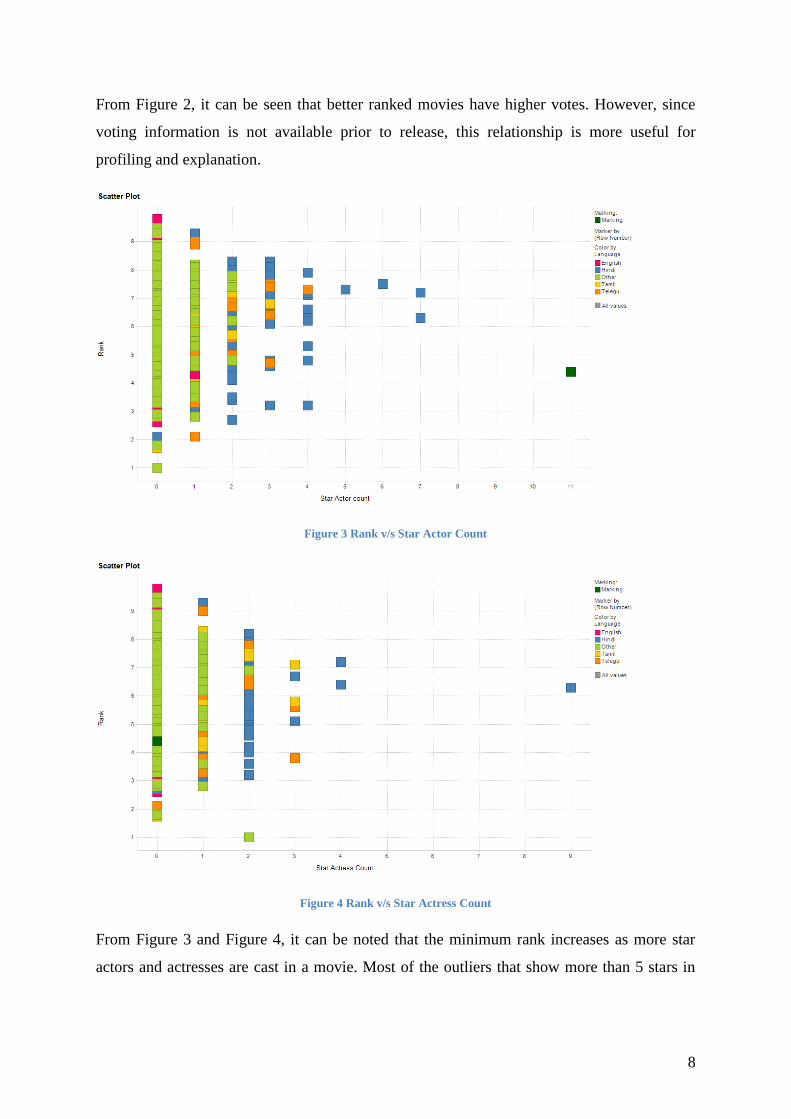
Figure 3 Rank v/s Star Actor Count
Figure 4 Rank v/s Star Actress Count
From Figure 3 and Figure 4, it can be noted that the minimum rank increases as more star
actors and actresses are cast in a movie. Most of the outliers that show more than 5 stars in
9
the same movie are because of special appearance by Filmfare award winners, e.g.: Raj
Kapoor documentary (1987), Om Shanti Om (2007).
8.2 Prediction Models
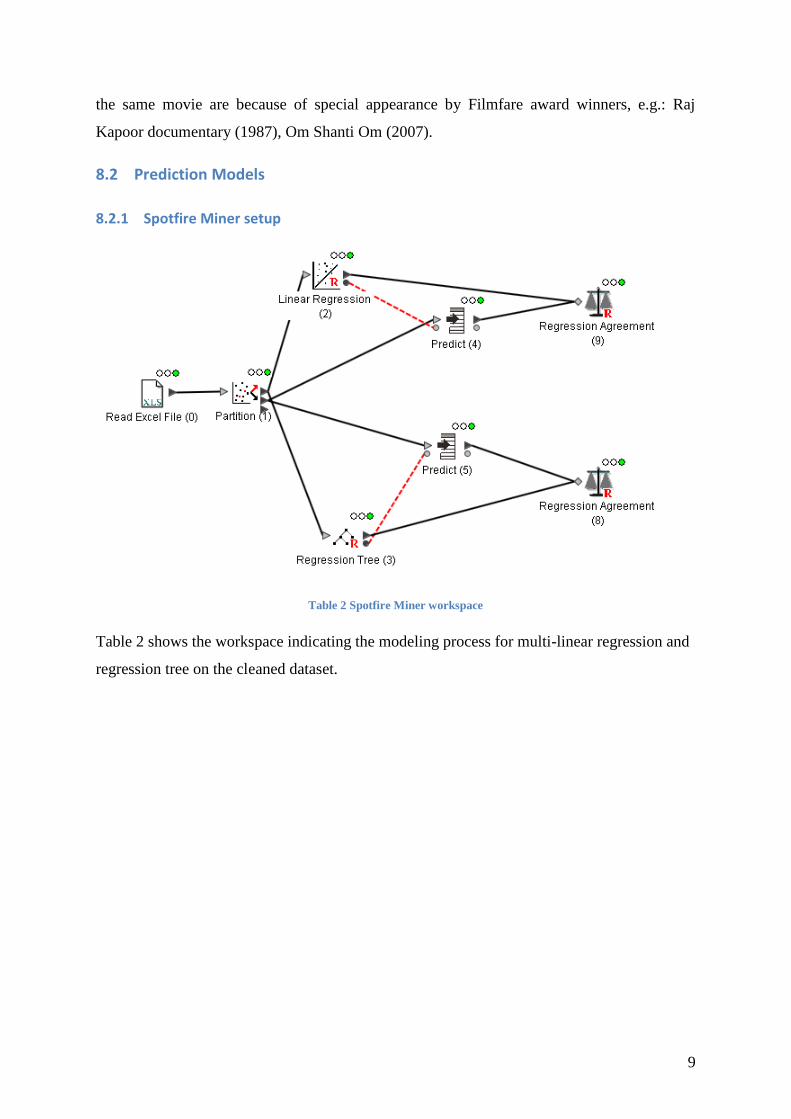
8.2.1 Spotfire Miner setup
Table 2 Spotfire Miner workspace
Table 2 shows the workspace indicating the modeling process for multi-linear regression and
regression tree on the cleaned dataset.
10
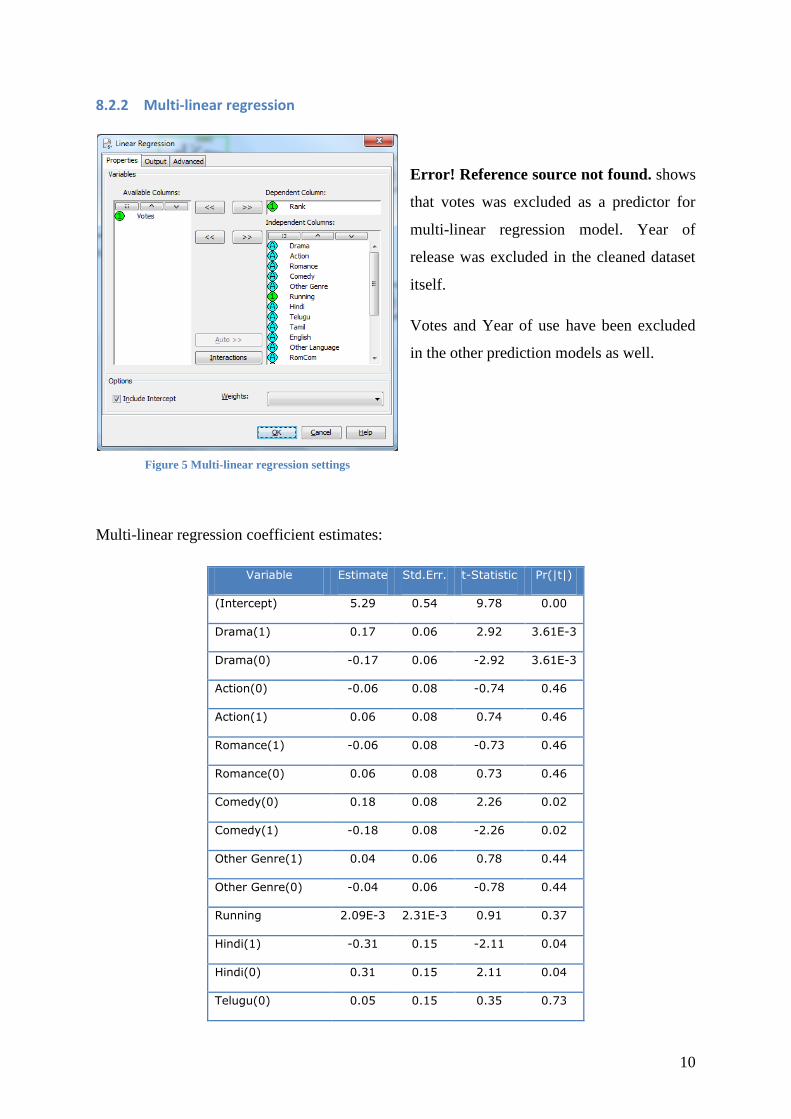
8.2.2 Multi-linear regression
Error! Reference source not found. shows
that votes was excluded as a predictor for
multi-linear regression model. Year of
release was excluded in the cleaned dataset
itself.
Votes and Year of use have been excluded
in the other prediction models as well.
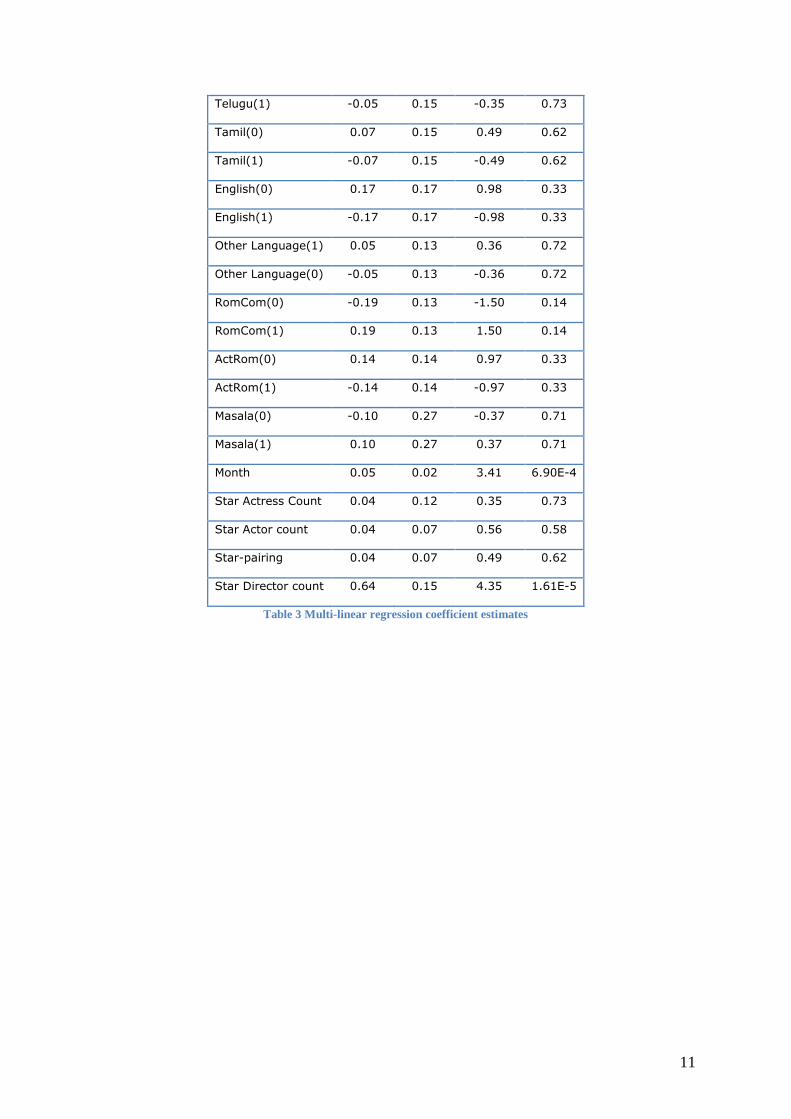
Multi-linear regression coefficient estimates:
Variable Estimate Std.Err. t-Statistic Pr(|t|)
(Intercept) 5.29 0.54 9.78 0.00
Drama(1) 0.17 0.06 2.92 3.61E-3
Drama(0) -0.17 0.06 -2.92 3.61E-3
Action(0) -0.06 0.08 -0.74 0.46
Action(1) 0.06 0.08 0.74 0.46
Romance(1) -0.06 0.08 -0.73 0.46
Romance(0) 0.06 0.08 0.73 0.46
Comedy(0) 0.18 0.08 2.26 0.02
Comedy(1) -0.18 0.08 -2.26 0.02
Other Genre(1) 0.04 0.06 0.78 0.44
Other Genre(0) -0.04 0.06 -0.78 0.44
Running 2.09E-3 2.31E-3 0.91 0.37
Hindi(1) -0.31 0.15 -2.11 0.04
Hindi(0) 0.31 0.15 2.11 0.04
Telugu(0) 0.05 0.15 0.35 0.73
Figure 5 Multi-linear regression settings
11
Telugu(1) -0.05 0.15 -0.35 0.73
Tamil(0) 0.07 0.15 0.49 0.62
Tamil(1) -0.07 0.15 -0.49 0.62
English(0) 0.17 0.17 0.98 0.33
English(1) -0.17 0.17 -0.98 0.33
Other Language(1) 0.05 0.13 0.36 0.72
Other Language(0) -0.05 0.13 -0.36 0.72
RomCom(0) -0.19 0.13 -1.50 0.14
RomCom(1) 0.19 0.13 1.50 0.14
ActRom(0) 0.14 0.14 0.97 0.33
ActRom(1) -0.14 0.14 -0.97 0.33
Masala(0) -0.10 0.27 -0.37 0.71
Masala(1) 0.10 0.27 0.37 0.71
Month 0.05 0.02 3.41 6.90E-4
Star Actress Count 0.04 0.12 0.35 0.73
Star Actor count 0.04 0.07 0.56 0.58
Star-pairing 0.04 0.07 0.49 0.62
Star Director count 0.64 0.15 4.35 1.61E-5
Table 3 Multi-linear regression coefficient estimates
12
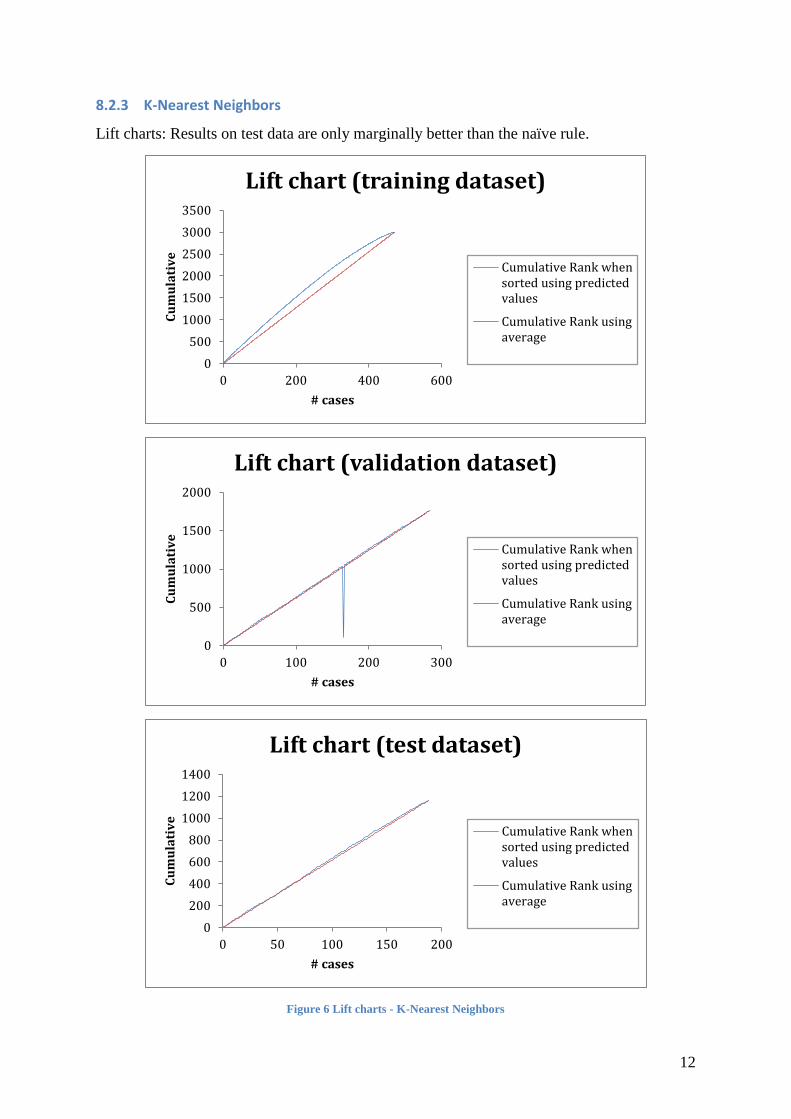
8.2.3 K-Nearest Neighbors
Lift charts: Results on test data are only marginally better than the naïve rule.
Figure 6 Lift charts - K-Nearest Neighbors
0
500
1000
1500
2000
2500
3000
3500
0 200 400 600
Cu
mu
lati
ve
# cases
Lift chart (training dataset)
Cumulative Rank whensorted using predictedvalues
Cumulative Rank usingaverage
0
500
1000
1500
2000
0 100 200 300
Cu
mu
lati
ve
# cases
Lift chart (validation dataset)
Cumulative Rank whensorted using predictedvalues
Cumulative Rank usingaverage
0
200
400
600
800
1000
1200
1400
0 50 100 150 200
Cu
mu
lati
ve
# cases
Lift chart (test dataset)
Cumulative Rank whensorted using predictedvalues
Cumulative Rank usingaverage
13
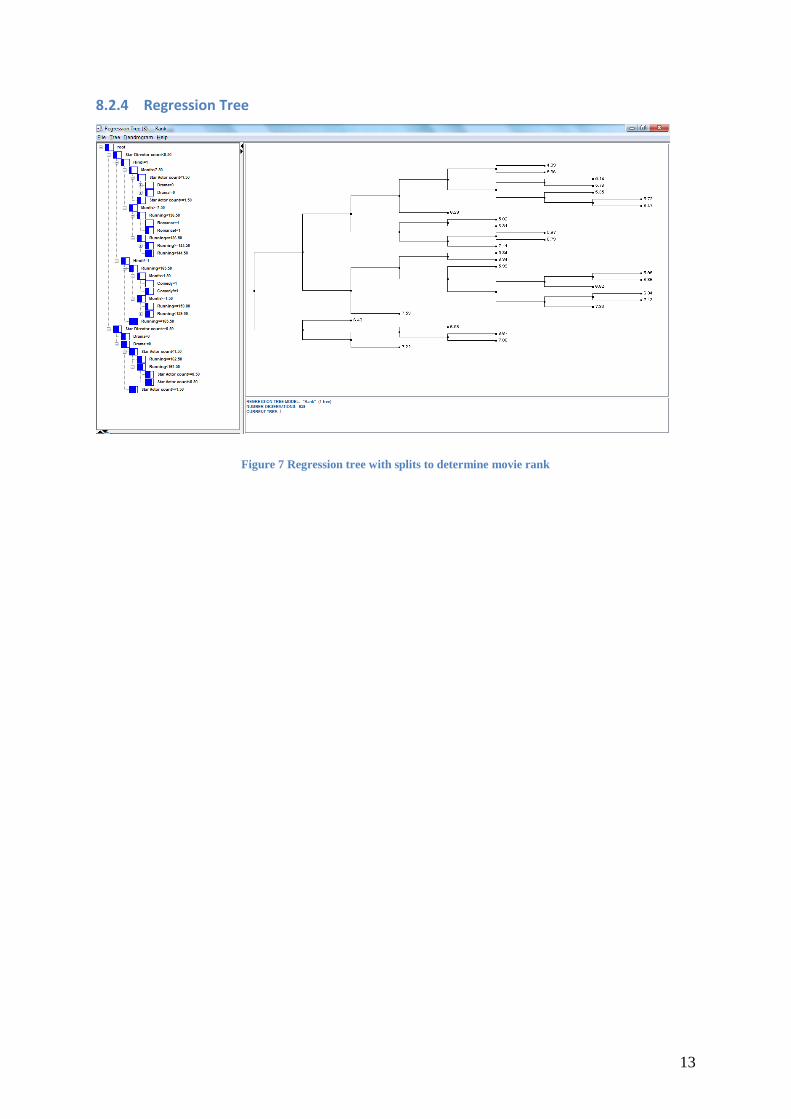
8.2.4 Regression Tree
Figure 7 Regression tree with splits to determine movie rank