Embed Size (px)
Citation preview

1
Predicting Human Interruptibility with Sensors JAMES FOGARTY, SCOTT E. HUDSON, CHRISTOPHER G. ATKESON, DANIEL AVRAHAMI, JODI FORLIZZI, SARA KIESLER, JOHNNY C. LEE, AND JIE YANG Human Computer Interaction Institute, Carnegie Mellon University ________________________________________________________________________ A person seeking another person’s attention is normally able to quickly assess how interruptible that other person currently is. Such assessments allow behavior that we consider natural, socially appropriate, or simply polite. This is in sharp contrast to current computer and communication systems, which are largely unaware of the social situations surrounding their usage and the impact that their actions have on these situations. If systems could model human interruptibility, they could use this information to negotiate interruptions at appropriate times, thus improving human computer interaction. This paper presents a series of studies that quantitatively demonstrate that simple sensors can support the construction of models that estimate human interruptibility as well as people. These models can be constructed without using complex sensors, such as vision-based techniques, and their use in everyday office environments is therefore both practical and affordable. Although currently based on a demographically limited sample, our results indicate a substantial opportunity for future research to validate these results over larger groups of office workers. Our results also motivate the development of systems that use these models to negotiate interruptions at socially appropriate times. Categories and Subject Descriptors: H5.2 [Information Interfaces and Presentation]: User Interfaces; H5.3 [Group and Organization Interfaces]: Collaborative Computing; H1.2 [Models and Principles]: User/Machine Systems; I2.6 [Artificial Intelligence]: Learning. General Terms: Design, Measurement, Experimentation, Human Factors. Additional Key Words and Phrases: Situationally appropriate interaction, managing human attention, context-aware computing, sensor-based interfaces, machine learning. ________________________________________________________________________ 1. INTRODUCTION
People have developed a variety of conventions that define behavior that is socially
appropriate in different situations [Bark1968]. In office working environments, social
conventions around interruptions dictate when it is appropriate for one person to interrupt
another. These conventions, together with the reaction of the person who has been
interrupted, allow an evaluation of whether or not a particular interruption was
appropriate. Social conventions around interruptions also allow the development of an a
priori expectation of whether or not an interruption would be appropriate [Hatc1987].
Current computer and communication systems are largely unaware of the social
conventions defining appropriate behavior, of the social situations surrounding their
usage, and the impact that their actions have on social situations. Whether it is a mobile
phone that rings while its owner is in a meeting with a supervisor, or a laptop that
interrupts an important presentation to announce that the battery is fully charged, current
omputers and communication systems frequently create socially awkward interruptions
Submitted for Review – Do not Distribute

2
or unduly demand attention because they do not have any model of whether it is
appropriate to interrupt. Without such a model, it is impossible for these systems to
develop informed a priori expectations about the impact their interruptions will have on
users and the social situations surrounding usage. As computing and telecommunications
systems have become more ubiquitous and more portable, the problem has become more
troublesome.
People who design or use computer and communication systems can currently adopt
one of two strategies for managing the damage caused by inappropriate interruptions.
One strategy is to avoid building or using proactive systems, forcing systems to be silent
and wait passively until a user initiates interaction. Although this approach is reasonable
for many applications in a desktop computing environment, many applications in
intelligent spaces and other mobile or ubiquitous computing environments could benefit
from a system being able to initiate interactions [Horv1999a]. A second strategy is to
design and use systems that can be temporarily disabled during potentially inappropriate
time intervals. However, this approach can be self-defeating. Although turning off a
mobile phone prevents unimportant interruptions, it also prevents interruptions that could
have conveyed critical information that was needed at that moment. Because systems do
not have a mechanism for weighing the importance of information against the
appropriateness of an interruption, people are forced into extremes of either allowing all
interruptions or forbidding all interruptions. This problem is amplified when people
forget to re-enable systems after the potentially inappropriate time interval has passed
[Mile2000].
If we could develop relatively robust estimators of human interruptibility, we might
be able to make a variety of significant advances in human computer interaction and
computer mediated communication. These advances would allow the users of these
systems to be more efficient and more comfortable with the systems. Such systems
would not need to deprive people of control. For example, mobile phones could
automatically inform a caller that the person being called appears to be busy, allowing the
caller to consider the importance of the call in deciding whether to interrupt the
apparently busy person or instead leave a message [Schm2000]. Email and messaging
applications could delay auditory notification of less important messages when the
recipient appears to be having a meeting or conversation in his or her office, but would
never prevent delivery of the information. Information displays might choose between
several methods of conveying information according to the importance of a piece of

3
information and the current situational appropriateness of each method of
communication. Many specific applications could be designed for different domains.
For example, information about interruptibility might be combined with information on
expertise and other relevant factors to automatically route incoming technical support
requests to the most appropriate member of a technical support staff.
Other researchers have studied interruptions from a psychological perspective.
Classic experiments in the 1920s showed tasks that were interrupted were more likely to
be recalled after a delay than tasks that were not interrupted [Zeig1927]. Much of the
psychological literature on interruptions has been devoted to examining this effect
[Adam1995, Gill1989, Hess1994]. Recent research in human computer interaction has
sought to find technological interventions that might help to negotiate multiple and
sometimes complex tasks.
McFarlane tested four known methods for deciding when to interrupt people
[McFa1999]. Although his results have implications for structuring appropriate
interactions, no single method emerged as best across all performance measures.
Czerwinski et al studied interruptions created by an instant messaging application and the
effects of these interruptions on different computer tasks [Cutr2001, Czer2000a,
Czer2000b]. Importantly, these studies found that even when an instant messaging
notification is ignored, it is still disruptive to task performance. These studies focused on
computer tasks, and leave open questions related to the effect of interruptions on the
social situations surrounding computer usage. Voida et al discuss such social situations
while analyzing tensions in instant messaging related to uncertainty about the level of
attention being given by a remote person [Void2002]. They suggest that instant
messaging applications might benefit from providing better indications of the availability
of a remote person. Begole et al presents an analysis of activity logs from an awareness
application for distributed workgroups [Bego2002]. They find that certain patterns may
indicate when a person will become available for communication, but note that only
information related to computer usage is available for their analysis.
Horvitz et al have shown that models can be used to infer goals and provide
appropriate assistance [Horv1998]. Observing low-level mouse and keyboard events,
their Lumière prototype modeled tasks that a person might be performing and used its
interpretation to provide assistance. Oliver et al’s SEER system uses models to recognize
a set of human activities from computer activity, ambient audio, and a video stream
[Oliv2002]. These activities are a phone conversation, a presentation, a face-to-face
4
conversation, engagement in some other activity, conversation outside the field of view
of the camera, and not present. While the techniques used by Oliver et al make SEER
more practical for deployment than some other vision-based systems, SEER still requires
a reasonable amount of calibration for its vision systems. The activities it models are also
assumed to relate to interruptibility, but they examine these activities only in a controlled
environment and cannot directly estimate interruptibility.
Horvitz et al presents methods for estimating the importance of a potential
interruption in their discussion of the Priorities prototype [Horv1999b]. Although they
focus on using a text classification strategy to identify important emails, they note that
the methods they present can apply to other classes of notifications. These types of
methods will be important to creating systems that balance interruptibility against the
importance of potential interruptions.
Hudson et al used an experience sampling technique to explore the perceptions that
managers in a research environment had about interruptions [Huds2002]. They found
that there was a tension between desiring uninterrupted time to complete tasks and
desiring the helpful information sometimes obtained from an interruption. In a result
similar to that discussed by Perlow [Perl1999], Hudson et al found that people sometimes
isolate themselves from potential interruptions by ignoring notifications or moving to a
different physical location. We point out that this strategy demonstrates the problem we
previously discussed, that people are choosing to forbid all interruptions because the
systems they use cannot determine whether a potential interruption is appropriate.
Hudson proposes that researchers focus on making interruptions more effective, rather
than on reducing them, and suggests socially translucent systems [Eric2000] as an
approach. Bellotti and Edwards express a similar concern that context-aware systems
will not always get it right, and need to be designed such that they defer to people in an
accessible and useful manner [Bell2001].
This paper describes work to develop and quantitatively evaluate statistical models
that use sensors to estimate human interruptibility. Because people use social
conventions and externally visible cues to estimate interruptibility and do not rely on
invisible internal phenomena like cognitive state, it should be possible to develop such
models empirically. One approach to this problem would be the top-down creation,
deployment, and evaluation of various combinations of models and sensors. However,
the uncertainty surrounding the usefulness of various sensors makes it very likely that
significant time and resources would be spent building and evaluating sensors that would

5
be ill-suited or sub-optimal for the task. This work is instead based on a bottom-up
approach, in which we collected and analyzed more than 600 hours of audio and video
recordings from the actual working environments of four subjects who had no prior
relationship with our research group. We simultaneously collected self-reports on the
interruptibility of these subjects. Using these recordings, we have examined the ability of
other people to estimate the interruptibility of the people in the recordings. We have also
created models of interruptibility based on the assumption that changes in behavior or
context are indicative of interruptibility. These models use sensor values that were
manually simulated by human coding of the recordings, using a Wizard of Oz technique
[Dahl1993, Maul1993]. This paper also presents similar models of interruptibility based
on automated analysis of the trecordings.
This paper shows that models of interruptibility based on simple sensors can provide
estimates of interruptibility that are as good as the estimates provided by people watching
audio and video recordings of an environment. More specifically, we present a study
demonstrating that people using the audio and video recordings to estimate
interruptibility can correctly distinguish between “Highly Non-Interruptible” situations
and other situations with an accuracy of 76.9%. A model based on manually simulated
sensors makes this same distinction with an accuracy of 82.4%. Both of these accuracies
are relative to a chance accuracy of 68% that could be obtained by always estimating that
a situation was not “Highly Non-Interruptible.” These types of models can be built using
only a handful of very simple sensors, and do not require the infrastructure associated
with vision-based systems. While this study is based on a limited demographic and will
need to be validated for different groups of office workers, this result is still very
promising. The favorable comparison between human judgment and our models
indicates an opportunity for using interruptibility estimates in computer and
communication systems.
The work presented in this paper represents two primary contributions over our
previously presented work [Huds2003]. First, our study of the performance of human
estimator subjects provides an important point of comparison for automated models of
human interruptibility. This comparison suggests that the accuracy of our automated
models is sufficient to consider including them in systems. Second, this paper
demonstrates an implementation of a sensor to determine whether anybody in a room is
talking, which is an important sensor in our automated models. Models based on this
implemented sensor provide evidence that we can implement the sensors necessary to

6
include our automated models in systems. As a final contribution, the models presented
in this paper are more accurate than models presented in our previous work, because they
investigate more potential features with more advanced techniques.
In the following section, we introduce our subjects, the collection of audio and video
recordings in their work environments, and the specifics of their self-reports on
interruptibility. Afterwards, we present an overview of this collected data, as described
by the self-reports on interruptibility and our set of manually simulated sensors. This is
followed by a presentation of our first study, examining human estimates of
interruptibility based on the recordings. We then move to our second study, discussing
models of interruptibility based on our manually simulated sensors, including an analysis
of the usefulness of various sensors and a comparison of these models to the results of
our study of human estimates. We next compare models based on manually simulated
sensors to models based on simple automated analyses of the audio and video recordings.
Finally, we offer a short conclusion and discuss opportunities for future work.
2. DATA COLLECTION
The audio and video recordings discussed in this paper were collected in the actual
working environments of four subjects with no prior relationship to our research group.
In order to increase the uniformity in the data for this exploratory work, we selected four
subjects with similar working environments and work tasks. Each subject serves in a
high-level staff position in our university, with significant responsibilities for day-to-day
administration of a large university department and/or graduate program. The subjects
have private offices with closable doors, but their job responsibilities require them to
interact with many different people during the day and they generally do not have full
control over their time. They usually worked with their doors open and responded to a
variety of “walk in” requests. Because this group of people almost never closed their
office doors, it is likely that the absence of this explicit indication of non-interruptibility
makes it more difficult to estimate their interruptibility.
The working environments were recorded using a computer with an 80 GB disk and
an audio/video capture and compression card connected to a small camera and
microphone. By pressing the space bar on a keyboard attached to the computer, subjects
could disable recording for a thirty-minute interval. Each computer had speakers, used
for informing subjects that recording had been disabled, to advise them recording was
about to resume, and to request interruptibility self-reports. While a display was used to
configure the recording software and focus the camera, the machines did not have
7
displays while they were collecting data. Signs were posted to alert guests to the
presence of a recording device, and the subjects were encouraged to disable recording if
they or a guest was uncomfortable with it. We also provided subjects with a mechanism
for retroactively requesting that portions of the recordings be destroyed prior to viewing.
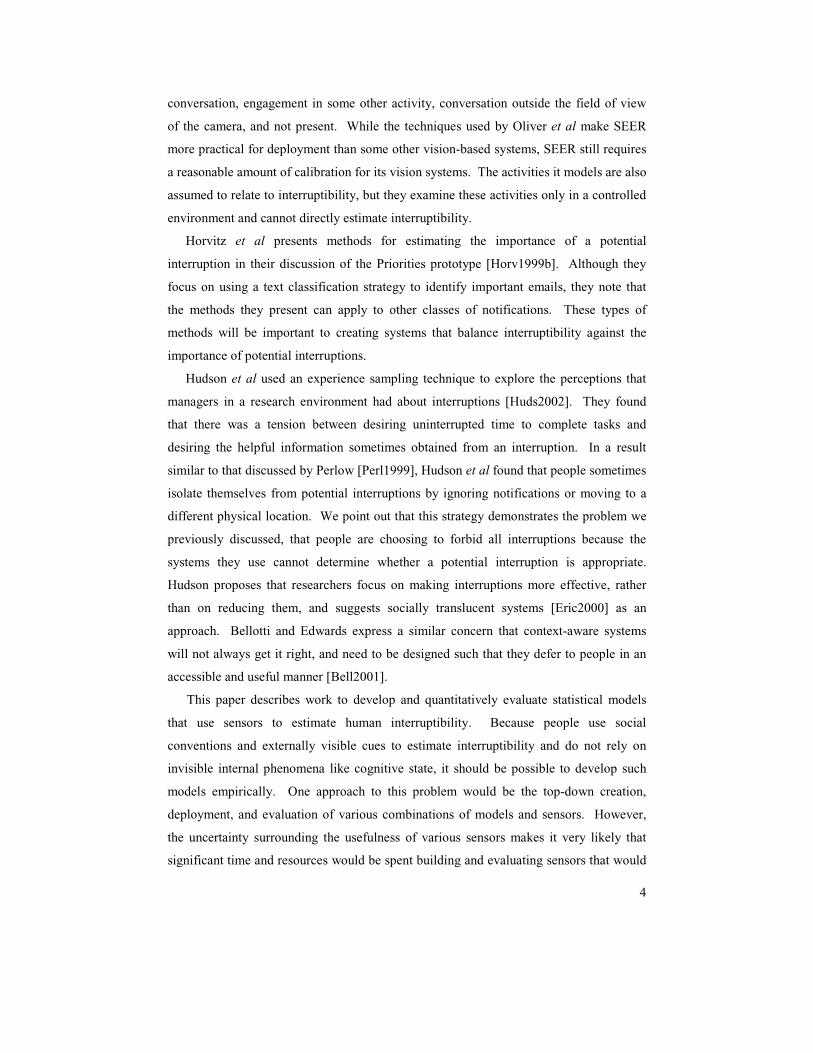
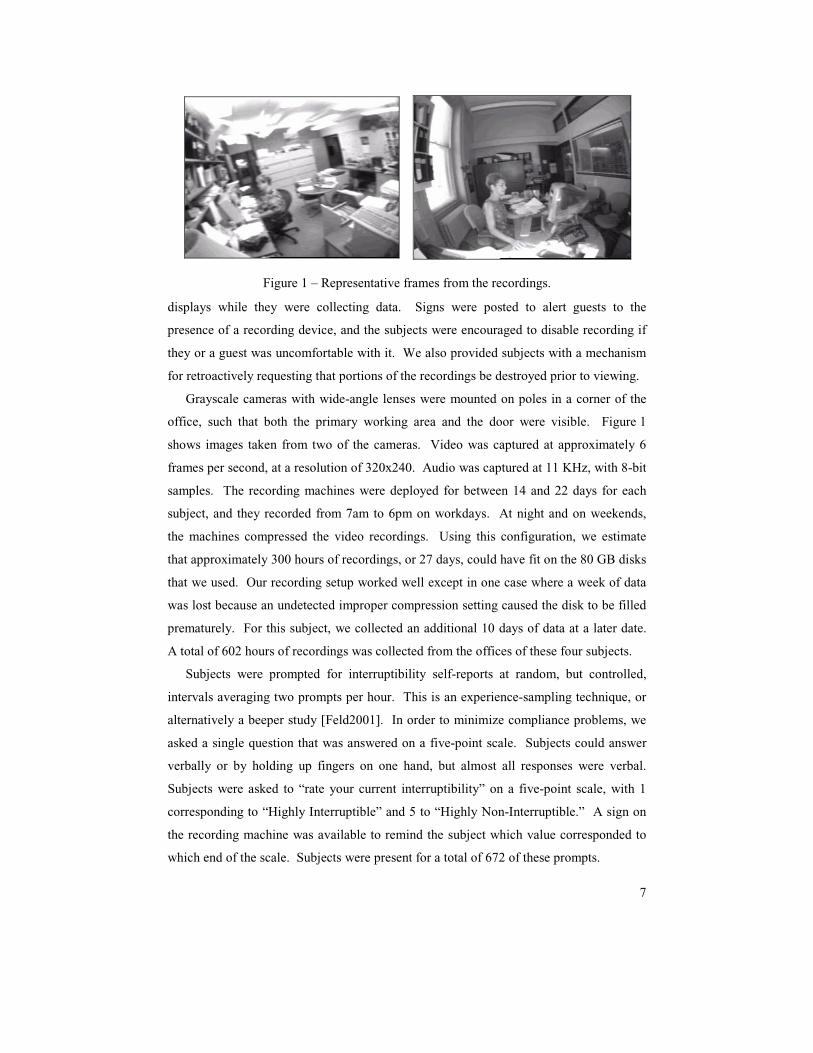
Grayscale cameras with wide-angle lenses were mounted on poles in a corner of the
office, such that both the primary working area and the door were visible. Figure 1
shows images taken from two of the cameras. Video was captured at approximately 6
frames per second, at a resolution of 320x240. Audio was captured at 11 KHz, with 8-bit
samples. The recording machines were deployed for between 14 and 22 days for each
subject, and they recorded from 7am to 6pm on workdays. At night and on weekends,
the machines compressed the video recordings. Using this configuration, we estimate
that approximately 300 hours of recordings, or 27 days, could have fit on the 80 GB disks
that we used. Our recording setup worked well except in one case where a week of data
was lost because an undetected improper compression setting caused the disk to be filled
prematurely. For this subject, we collected an additional 10 days of data at a later date.
A total of 602 hours of recordings was collected from the offices of these four subjects.
Subjects were prompted for interruptibility self-reports at random, but controlled,
intervals averaging two prompts per hour. This is an experience-sampling technique, or
alternatively a beeper study [Feld2001]. In order to minimize compliance problems, we
asked a single question that was answered on a five-point scale. Subjects could answer
verbally or by holding up fingers on one hand, but almost all responses were verbal.
Subjects were asked to “rate your current interruptibility” on a five-point scale, with 1
corresponding to “Highly Interruptible” and 5 to “Highly Non-Interruptible.” A sign on
the recording machine was available to remind the subject which value corresponded to
which end of the scale. Subjects were present for a total of 672 of these prompts.
Figure 1 – Representative frames from the recordings.

8
3. DATA OVERVIEW
This section characterizes the recordings collected from our subjects. The overall
distribution of the interruptibility self-reports is shown in Figure 2. The distributions for
individual subjects are shown in Table 1. For 54 of these 672 samples, the subject was
present and clearly heard the prompt, but did not respond within 30 seconds of the
prompt. We examined these individually and determined that the subject was either on
the phone or engaged in a conversation with a guest for the vast majority of the 54 cases.
Results in the literature suggest that these activities are highly correlated with
non-interruptibility, and this expectation is validated in the remainder of our data. To
simplify analysis and model building, we have placed these 54 cases in the “Highly
Non-Interruptible” category.
While there are clearly differences in the self-report distributions for the individual
subjects, it is especially important to note that subjects reported a value of “Highly
Non-Interruptible” for 215 prompts, or approximately 32% of the data. An informal
inspection found that responses of “Highly Non-Interruptible” were sometimes given
calmly and other times given curtly by clearly agitated subjects. Overall, it appears that
the subjects made a distinction between this response and the other four responses. For
050
100150200250
1 2 3 4 5
Highly Interruptible Highly Non-Interruptible
Figure 2 – Interruptibility self-report distribution.
Highly Interruptible Highly Non-Interruptible 1 2 3 4 5
Subject 1 9
6.6% 14
10.2% 40
29.2% 18
13.1% 56
40.9%
Subject 2 17
10.2% 21
12.7% 58
34.9% 27
16.3% 43
25.9%
Subject 3 52
31.5% 26
15.8% 20
12.1% 10
6.1% 57
34.5%
Subject 4 14
6.9% 25
12.3% 45
22.1% 61
29.9% 59
28.9%
All 92
13.7% 86
12.8% 163
24.3% 116
17.3% 215
32.0%
Table 1 – Individual subject self-report distributions.
9
many of the analyses presented in this paper, we will examine this distinction and
evaluate the ability of estimators to distinguish between “Highly Non-Interruptible”
situations and other situations.
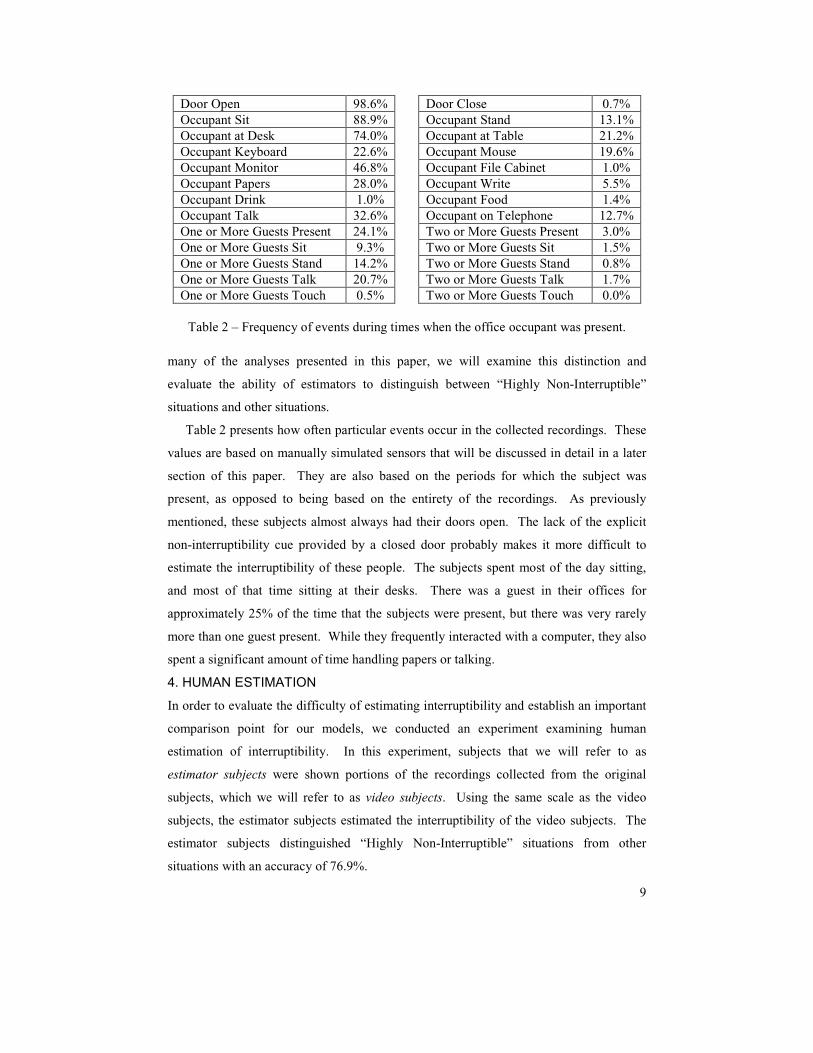
Table 2 presents how often particular events occur in the collected recordings. These
values are based on manually simulated sensors that will be discussed in detail in a later
section of this paper. They are also based on the periods for which the subject was
present, as opposed to being based on the entirety of the recordings. As previously
mentioned, these subjects almost always had their doors open. The lack of the explicit
non-interruptibility cue provided by a closed door probably makes it more difficult to
estimate the interruptibility of these people. The subjects spent most of the day sitting,
and most of that time sitting at their desks. There was a guest in their offices for
approximately 25% of the time that the subjects were present, but there was very rarely
more than one guest present. While they frequently interacted with a computer, they also
spent a significant amount of time handling papers or talking.
4. HUMAN ESTIMATION
In order to evaluate the difficulty of estimating interruptibility and establish an important
comparison point for our models, we conducted an experiment examining human
estimation of interruptibility. In this experiment, subjects that we will refer to as
estimator subjects were shown portions of the recordings collected from the original
subjects, which we will refer to as video subjects. Using the same scale as the video
subjects, the estimator subjects estimated the interruptibility of the video subjects. The
estimator subjects distinguished “Highly Non-Interruptible” situations from other
situations with an accuracy of 76.9%.
Door Open 98.6% Door Close 0.7% Occupant Sit 88.9% Occupant Stand 13.1% Occupant at Desk 74.0% Occupant at Table 21.2% Occupant Keyboard 22.6% Occupant Mouse 19.6% Occupant Monitor 46.8% Occupant File Cabinet 1.0% Occupant Papers 28.0% Occupant Write 5.5% Occupant Drink 1.0% Occupant Food 1.4% Occupant Talk 32.6% Occupant on Telephone 12.7% One or More Guests Present 24.1% Two or More Guests Present 3.0% One or More Guests Sit 9.3% Two or More Guests Sit 1.5% One or More Guests Stand 14.2% Two or More Guests Stand 0.8% One or More Guests Talk 20.7% Two or More Guests Talk 1.7% One or More Guests Touch 0.5% Two or More Guests Touch 0.0%
Table 2 – Frequency of events during times when the office occupant was present.

10
4.1 Methodology
Using a website that regularly advertises experiments conducted at our university, we
recruited 40 estimator subjects, each of which was paid for a session that was scheduled
to last one hour. A majority, but not all, of our estimator subjects were students at our
university or at another university within walking distance. In order to protect the
privacy of the video subjects, the estimator subjects were shown still images of the video
subjects and asked if they were personally familiar with any of the video subjects. They
were only shown recordings of video subjects that they were not personally familiar with.
Four estimator subjects were familiar with one of the video subjects, and one estimator
subject was familiar with two of the video subjects.
Each session started with an explanation of the task. Estimator subjects were told to
evaluate the recordings as if they were walking into that situation and needed to decide
how interruptible the video subject was prior to deciding whether to interrupt the video
subject. A practice portion was started, and the experimenter introduced the estimator
subject to the interface shown in Figure 3. A 15-inch LCD screen was used at a
resolution of 640x480, so our video was displayed in a 6-inch by 4.5-inch box. The
interface presented five initially unchecked radio buttons for each estimate. Estimator
subjects were told that they could watch the video more than once before making an
estimate, and they were advised that they should be as accurate as possible without
worrying about speed. The estimator subject then used the interface to estimate the
interruptibility of a video subject for 6 randomly selected practice self-reports. This was
followed by the main portion, in which the estimator subject estimated the interruptibility
of a video subject for 60 self-reports. The main portion self-reports were selected
Figure 3 – The interface used by estimator subjects for human estimation.
11
randomly without replacement between estimator subjects, thus ensuring that every
self-report would be used once before any self-report was used twice. After the main
portion was completed, estimator subjects provided information about their general
strategies for making estimates during the main portion and their specific strategies for
making estimates from particular recordings. Half of the subjects provided general
strategies first, and half of the subjects provided specific strategies first. To collect
specific strategies, we had each estimator subject provide an estimate for 6 randomly
selected self-reports. After the estimator subject had provided an estimate, and before the
estimator subject had seen the next recording, the estimator subject was asked to provide
a three to five sentence description of the strategy used to make the estimate. To collect
general strategies, we asked the estimator subject to provide a five to seven sentence
description of the strategies used during the main portion. After the free-response portion
of the general strategy collection, we collected answers to two seven-point Likert scales
discussed later in this section. The sessions were not timed, but none lasted longer than
the scheduled hour.
During both the practice and main portions, the interface alternated between showing
15 seconds and 30 seconds of the recordings from immediately before a self-report. Half
of the estimator subjects started with being shown 15 seconds, and half started with being
shown 30 seconds. We chose to use 15 seconds of the recordings because people
naturally make these estimates very quickly. A person glancing in an open office door
can usually decide whether it is appropriate to interrupt. We felt that showing too much
of the recordings for each estimate might affect how estimator subjects made their
decisions. While it would normally be considered inappropriate to look in an open office
door for 15 seconds, we felt that the additional temporal information presented in 15
seconds should help to correct for the differences between normal circumstances and our
recordings. Although we felt 15 seconds of the recordings would be sufficient for
making an estimate, the 30 seconds condition was included to determine whether the
additional time improved accuracy. As we will discuss later in this section, our estimator
subjects felt that 15 seconds of the recordings was sufficient and their performance did
not improve with the longer recordings.
Of the original 672 interruptibility self-reports, recordings for 587 self-reports were
used for gathering estimates from the estimator subjects. The others were not used
because they were potentially sensitive or because a technological artifact, such as the
appearance of gap in the video shortly before a prompt, might have been distracting to the
12
estimator subject. Given that 40 subjects each provided estimates for 60 self-reports
selected randomly without replacement, each of the 587 self-reports had four or five
estimates generated for it, including at least two that were based on 15 seconds of the
recordings and at least two that were based on 30 seconds of the recordings.
4.2 Estimator Subject Strategies
Our estimator subjects reported strategies that are consistent with our intuition and the
available literature indicating that social and task engagement are important [Sesh2001].
We will not attempt to analyze the reported strategies in this paper, but instead present
informal observations about commonly reported strategies.
The presence of person other than the video subject was reported as important in
many of the strategies. As one subject commented, “You can’t just barge in on someone
else’s appointment time.” Similarly, our estimator subjects reported that they did not
want to interrupt a video subject who was on the telephone. In regard to both the
presence of another person and the video subject being on the telephone, our estimator
subjects generally reported that they attempted to determine if a conversation was work-
related or of a more social nature. Our estimator subjects reported feeling it was more
appropriate to interrupt conversations of a social nature.
Our estimator subjects also reported cues related to the environment and activities of
the video subject. Several estimator subjects reported checking whether the door was
open or closed. Many reported feeling that a video subject was more interruptible if
music were playing. Reports indicated that it was difficult to estimate the interruptibility
of a video subject who was using a computer or reading, but did indicate that they felt
less comfortable interrupting a subject who was typing quickly, as opposed to
occasionally typing or only using the mouse. This relates to estimator subject reports that
they attempted to interpret the body language of the video subject, considering them more
interruptible if they appeared to be happy or relaxing and less interruptible if they
appeared stressed or upset.
Finally, a number of estimator subjects reported that they felt more comfortable
interrupting when a video subject was between tasks, such as when a guest had just left
the office. Estimator subjects reported feeling that the subject was already interrupted in
this situation, and that their interruption would not be problematic. But estimator
subjects also felt that they should not interrupt when a video subject was quickly
switching back and forth between attending to two things, as they felt this indicated that
the video subject was focused on a task.

13
4.3 Experiment Results
Table 3 presents the human estimates from this experiment in the form of a confusion
matrix. The rows in this matrix correspond to the values reported by the video subjects,
and the columns correspond to the values estimated by the estimator subjects. The
unshaded values in the diagonal represent instances when the estimator subject correctly
estimated the same value given by the video subject. By summing the diagonal, we can
see that the estimator subjects were correct for 738 instances, or approximately 30.7% of
the data. Because “Highly Non-Interruptible” is the most common value, always
estimating that value establishes a baseline chance accuracy of 706 correct, or 29.4%.
Our estimator subjects performed only slightly better than chance, a difference which is
not significant (χ2(1, 4800) = 1.01, p > .31). This indicates that interruptibility
estimation, as posed, is difficult.
It is interesting to note that the mistakes made by the estimator subjects do not appear
to be random, but instead appear to include a certain amount of bias, perhaps related to
self-interest. If the mistakes were random, we might expect approximately the same
number of entries in the upper right half of the confusion matrix as in the lower left half
of the matrix. This would mean that estimator subjects were as likely to confuse the
video subject for being more interruptible as they were to confuse the video subject for
being less interruptible. Instead, there are 450 entries in the upper right half, or
approximately 18.7% of the data, and 1212 entries in the lower left half, or approximately
50.5% of the data. For approximately half of the estimates, estimator subjects described
the video subject as more interruptible than the video subject actually reported.
Aggregating for each estimator subject, this data shows that estimator subjects reported
Estimator Subject Value
Highly Interruptible
Highly
Non-Interruptible
1 2 3 4 5
1 172
7.2% 92
3.8% 41
1.7% 31
1.3% 10
0.4%
2 94
3.9% 110
4.6% 72
3.0% 36
1.5% 5
0.2%
3 150
6.3% 204
8.5% 133
5.5% 79
3.3% 45
1.9%
4 82
3.4% 110
4.6% 116
4.8% 73
3.0% 39
1.6% V
ideo
Sub
ject
Val
ue
5 89
3.7% 121
5.0% 101
4.2% 145
6.0% 250
10.4% Overall Accuracy: 30.7% Accuracy Within 1: 65.8%
Table 3 – Confusion matrix for human estimates of interruptibility.
14
lower values than the video subjects (t(39) = -8.79, p < .001). This may imply a
systematic bias towards viewing another person as interruptible when we are interested in
making an interruption.
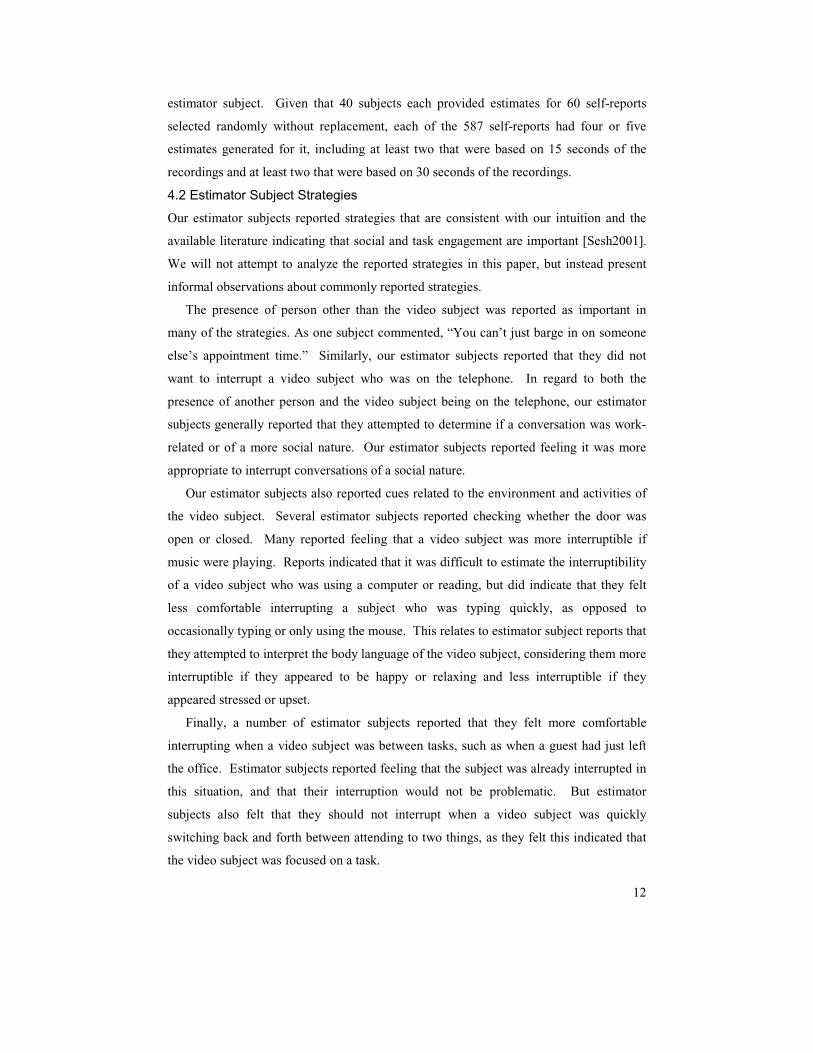
Figure 4 illustrates a simple transformation that, when applied to Table 4, reduces the
problem to distinguishing between responses of “Highly Non-Interruptible” and other
responses. As discussed in the data overview, this transformation of the problem is
interesting because it seems that the video subjects viewed “Highly Non-Interruptible”
responses as different from the other responses. Because this reduced form will be used
throughout this paper, it is worth clarifying that the upper left cell represents instances in
which both the video subject and the estimator subject responded with any value other
than “Highly Non-Interruptible.” The bottom right cell represents instances when both
the video subject and the estimator subject responded with “Highly Non-Interruptible.”
The other two cells represent instances when either the video subject or the estimator
subject responded with “Highly Non-Interruptible,” but the other did not. For this
problem, the estimator subjects have an overall accuracy of 76.9%, significantly better
than a chance performance of 70.6% (χ2(1, 4800) = 24.5, p < .001). Note that the bias
discussed in the 5 choice problem is still present in this reduced form. Estimator subjects
erred in estimating that the video subject was not “Highly Non-Interruptible” almost 5
times as often as they erred by estimating that the video subject was “Highly
Non-Interruptible.”
While an accuracy of 76.9% may seem low for human performance of a task very
similar to everyday tasks, we find this level of accuracy believable because of the context
in which people normally make these types of estimates. People do not typically make an
initial estimate of interruptibility and then blindly proceed according to this initial
estimate. Instead, the evaluation of interruptibility is an early step in a negotiated process
⇒
Estimator Subject
All
Other Values
Highly Non
All Other Values
1595 66.5%
99 4.1%
Vid
eo S
ubje
ct
Highly Non
456 19.0%
250 10.4%
Accuracy: 76.9%
Figure 4 – Transforming the 5 choice problem into a 2 choice problem
15
[Goff1982]. An initial estimate indicating that a person is not interruptible allows an
early exit from a negotiation, but other cues allow a person to decide against interrupting
despite an initial evaluation indicating that they could. Other cues can include eye
contact avoidance and the continuation of a task that would be interrupted. In designing
systems to use interruptibility estimates, it will be important to support a negotiated entry,
rather than assuming that an interruptibility estimate provides absolute guidance.
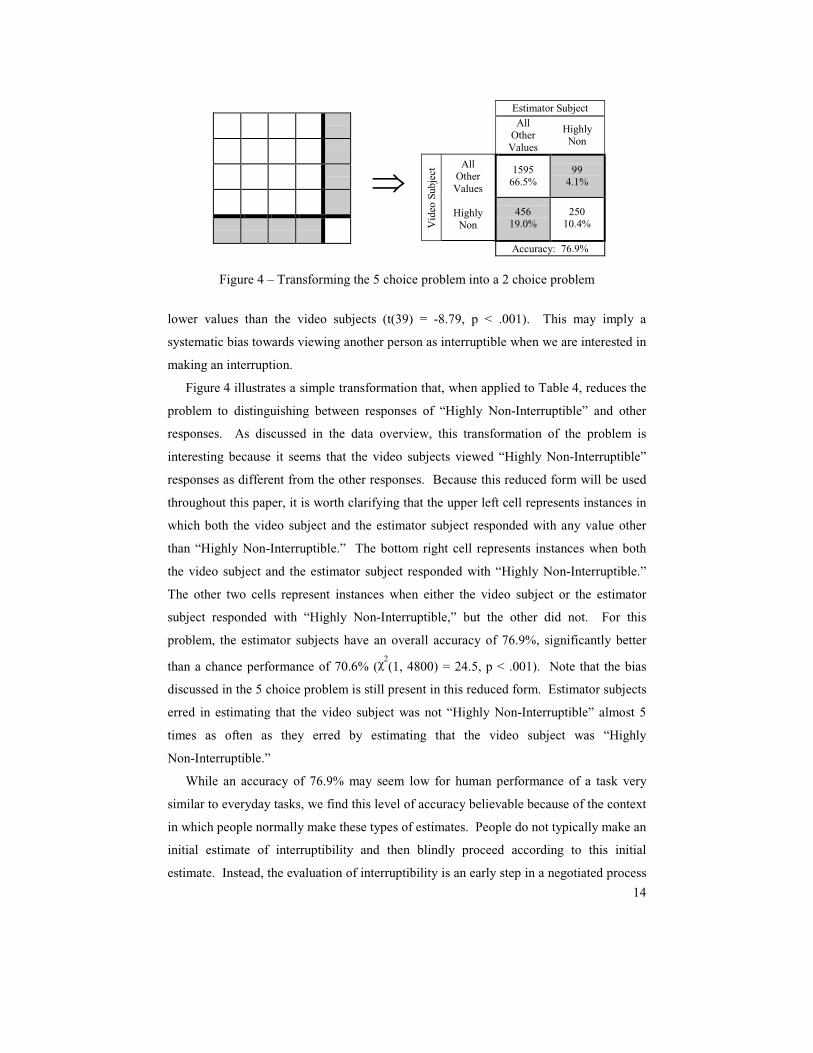
4.4 Estimator Subject Confidence
The validity of our human estimation results is strengthened by data collected from the
estimator subjects regarding confidence in their estimates. The first Likert scale in the
general strategy portion of the experiment stated “I am confident in the accuracy of my
judgments.” Each estimator subject responded on a seven-point scale ranging from
“Strongly Disagree,” which we will refer to as 1, to “Strongly Agree,” which we will
refer to as 7. Given the results for this scale, as shown in Figure 5, it is clear that our
estimator subjects were confident in the accuracy of their estimates. Every subject
responded with at least a neutral value on the seven-point scale, and 95% of the subjects
responded somewhere on the “Agree” half of the scale. We believe that these confidence
levels indicate that the recordings provided enough information for estimator subjects to
make estimates with which they were comfortable.
Interestingly, the subjects who were most confident in their estimates did not perform
better. In the 5 choice problem, subjects responding with a 6 or 7 actually did slightly
worse than subjects responding with a 4 or 5, though this difference is not significant
(χ2(1, 2400) = 1.94, p > .15). They also performed slightly worse in the 2 choice
problem, but this difference was also not significant (χ2(1, 2400) = 0.83, p > .36).
0
5
10
15
20
1 2 3 4 5 6 7
StronglyDisagree
StronglyAgree
Figure 5 – “I am confident in the accuracy of my judgements.”
16
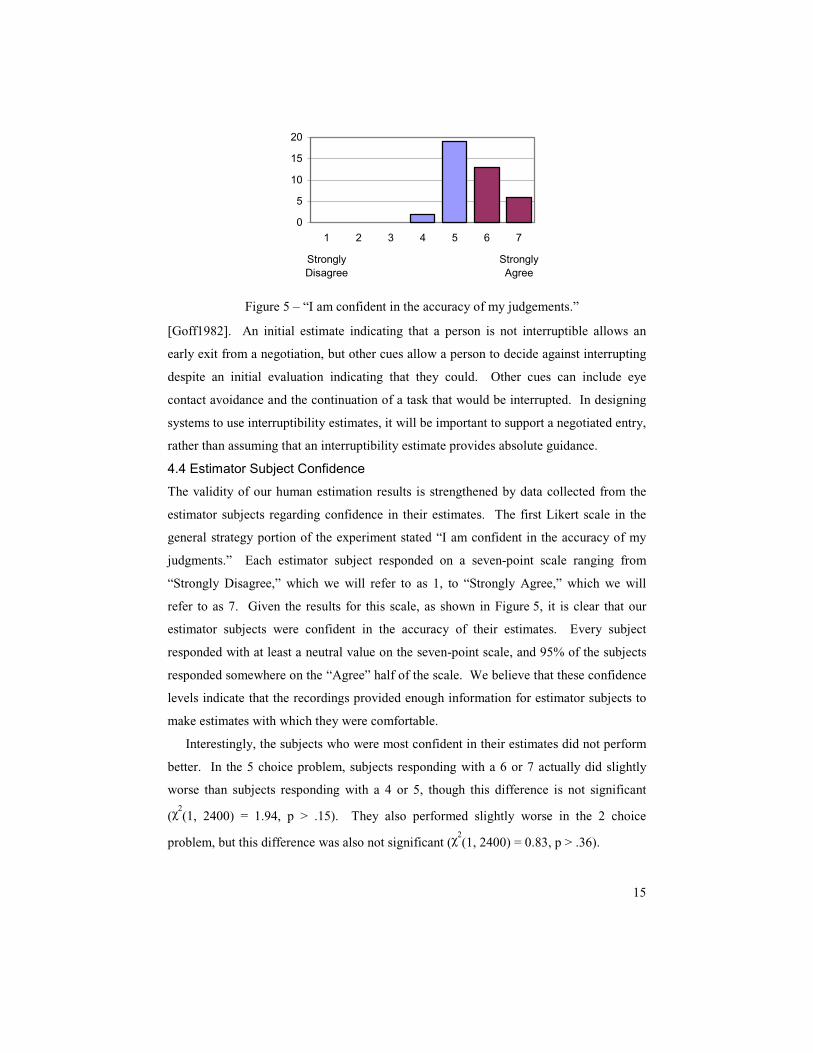
4.5 Recording Duration
As discussed in the introduction to this experiment, we felt that 15 seconds of the
recordings would be sufficient for estimating interruptibility, and we included cases with
30 seconds of the recordings to determine whether the additional time was helpful. This
section presents evidence supporting our initial belief that 15 seconds of the recordings
was sufficient and that the additional information in 30 seconds of the recordings was not
helpful.
The second Likert scale in the general strategy portion of our experiment stated “The
15 second videos were long enough for making judgments.” Figure 6 shows the
estimator subject responses, which indicate that the estimator subjects generally found 15
seconds of video to be sufficient. Only 4 subjects responded with a value less than
neutral, and 30 responded with a value greater than neutral. Note that subjects who
indicated a confidence level of 6 or 7 using 15 seconds of the recordings did slightly
worse in both the 5 choice problem and the 2 choice problem compared to subjects who
indicated a lower confidence level with using 15 seconds of the recordings, though these
differences were not significant (χ2(1, 1200) = 2.59, p > .10, χ
2(1, 1200) = 0.07, p > .78).
These results show that most estimator subjects felt that 15 seconds of the recordings was
sufficient for making interruptibility estimates. Further, they show that estimator subjects
who desired more information to inform their decision did not do any worse than
estimator subjects who were comfortable with the amount of information available.
Further evidence that 15 seconds of the recordings was sufficient can be seen in the
lack of an improvement with 30 seconds of the recordings were available. In the 5 choice
problem, the overall accuracy of estimates based on 30 seconds of the recordings is
slightly worse than that of estimates based on 15 seconds of the recordings, but this
difference is not significant (χ2(1, 2400) = 1.76, p > .18). In the 2 choice problem,
02468
1012
1 2 3 4 5 6 7
StronglyDisagree
StronglyAgree
Figure 6 - “The 15 second videos were long enough for making judgments.”

17
estimates based on 30 seconds of the recordings were better than the estimates based on
15 seconds of the recordings, but not significantly better (χ2(1, 2400) = 0.06, p > .80).
These results indicate that the extra information available in 30 seconds of the recordings
did not improve the accuracy of the estimator subjects, which is consistent with human
ability to make these decisions very quickly in everyday environments.
4.6 Multiple Viewings
Estimator subjects were encouraged to watch the recordings more than once if they felt it
would help them make an accurate estimate. In order to determine if this was helpful to
the estimator subjects, our interface logged the number of times the recording was viewed
for each estimate. An overwhelming majority of the estimates, more than 92%, were
based on a single viewing. This is what we expected, given that people are accustomed
to quickly making these estimates during everyday activities. While the estimates based
on more than one viewing are more accurate than estimates based on a single viewing
(36.5% vs. 30.3%, χ2(1, 2400) = 3.00, p < .10), it is unclear how to interpret the
difference. There are a variety of reasons why an estimator subject might choose to view
a recording more than once, and the set of recordings viewed more than once is probably
not random. Rather than focus on this difference that cannot be interpreted, we will
instead reiterate that estimator subjects chose to base a vast majority of their estimates on
a single viewing of the recordings.
4.7 Discussion
This section has presented an experiment to explore human estimation of interruptibility.
This experiment showed that human estimators performed only slightly better than
chance when asked to estimated interruptibility on a 5 point scale from “Highly
Interruptible” to “Highly Non-Interruptible”. These human estimators appear to have
systematically interpreted the video subjects as being more interruptible than the video
subjects reported. By reducing the problem to distinguishing between “Highly
Non-Interruptible” conditions and other conditions, we establish a human estimator
accuracy of 76.9%. However, this reduced form still shows a substantial bias towards
estimating people to be more interruptible than those people report.
We have presented evidence that the human estimators were generally confident in
the accuracy of their estimates and generally felt that 15 seconds of the recordings were
sufficient for making the estimates. By analyzing their estimates, we have shown that
neither the length of the recording used nor estimator confidence in their estimates
appears to have a significant impact on overall accuracy. This is consistent with our view

18
that people are accustomed to making these decisions very quickly in everyday
environments and using these estimates as an early part of a negotiated entry into an
interruption.
While our estimator subjects were not personally familiar with our video subjects, it is
not clear that our results would have been different if we had used estimator subjects who
already knew our video subjects. We are not aware of any studies that show whether
people are actually better at estimating the interruptibility of people that they personally
know, or instead are just more deferential. It may be the case that people place higher
cost on the disruption associated with interrupting somebody they personally know, thus
causing them to avoid interrupting in questionable circumstances. A carefully
constructed set of studies would be necessary to gain insight into these issues.
Taken as a whole, these results seem to indicate that automatic estimates of human
interruptibility can be based on short periods of time immediately preceding a potential
interruption. Because human estimators had difficulty accurately estimating the
interruptibility of a video subject on a 5 point scale, it seems that it might be reasonable
for automatic estimators to focus on recognizing “Highly Non-Interruptible” conditions.
Automatic estimators could identify extremely inappropriate times for interruptions and
allow systems to avoid them while using negotiated approaches during other times. This
strategy appears to work well in human interaction [Goff1982] and also seems worth
pursuing as an approach to human computer interaction.
19
5. MODELS BASED ON WIZARD OF OZ SIMULATED SENSORS
While people regularly estimate interruptibility during their everyday tasks, we are
interested in whether models based on practical sensors can automatically provide these
estimates. This section presents a collection of sensors that we manually simulated using
a Wizard of Oz technique [Dahl1993, Maul1993]. As discussed in our introduction, the
decision to use simulated sensors allows us to consider a variety of sensors without
requiring that we first build the sensors. We can thus limit the time and resources spent
on a sensor that is ill-suited or sub-optimal for predicting interruptibility. After
discussing our simulated sensors, this section presents and analyzes models based on
these simulated sensors. This section partially duplicates preliminary results discussed in
a previous paper [Huds2003], but significantly adds to the sensors, models, and analyses
presented in that paper.
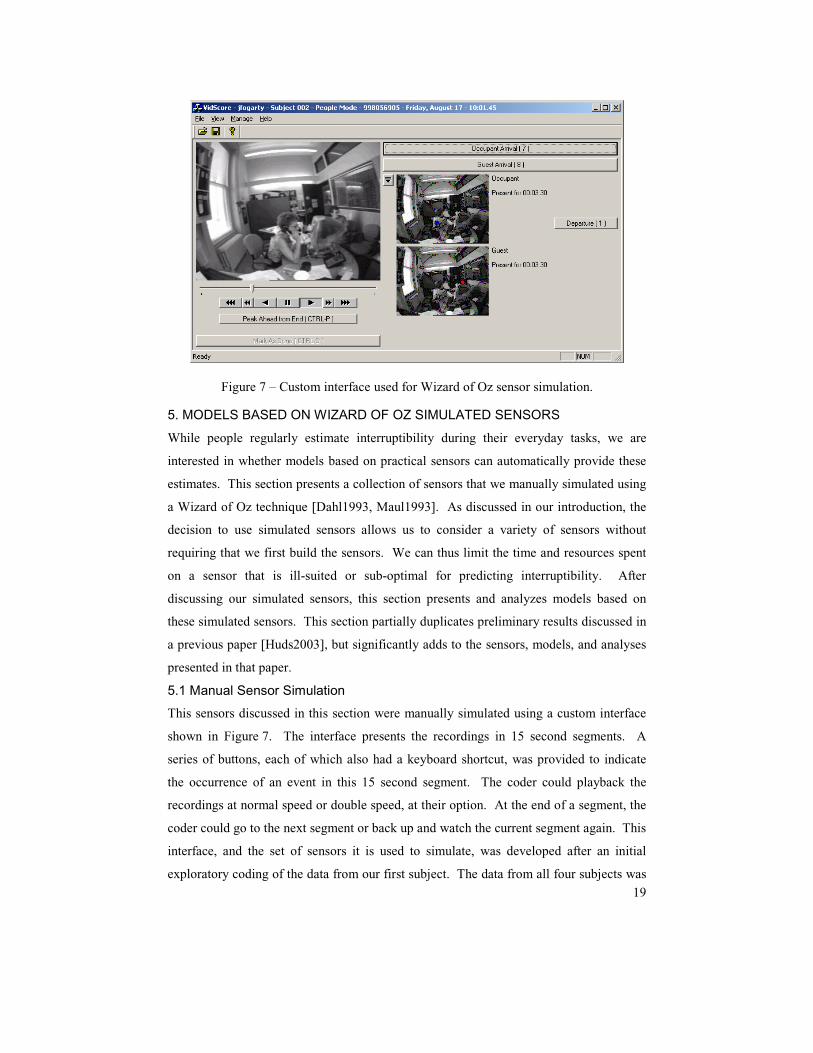
5.1 Manual Sensor Simulation
This sensors discussed in this section were manually simulated using a custom interface
shown in Figure 7. The interface presents the recordings in 15 second segments. A
series of buttons, each of which also had a keyboard shortcut, was provided to indicate
the occurrence of an event in this 15 second segment. The coder could playback the
recordings at normal speed or double speed, at their option. At the end of a segment, the
coder could go to the next segment or back up and watch the current segment again. This
interface, and the set of sensors it is used to simulate, was developed after an initial
exploratory coding of the data from our first subject. The data from all four subjects was
Figure 7 – Custom interface used for Wizard of Oz sensor simulation.
20
coded after the procedures were finalized. Our coders began their work training for
consistency. In order to evaluate agreement among coders, we recoded a randomly
selected 5% of the recordings and found 93.4% agreement at a granularity of 15 second
intervals. In order to minimize coding time, and because we believe that information in
close temporal proximity will be most useful in predicting interruptibility, we have only
coded 5 minutes of the recordings immediately preceding each self-report, for a total of
56 hours of coded recordings.
We found presenting the video in 15 second units to be a good compromise between
coding every desirable piece of information and completing the coding process in an
acceptable amount of time. Coders could operate at speeds near or even better than
real-time in the common cases where very little activity was apparent, but could also
control the pacing such that they did not fall behind or lose data when multiple activities
were occurring. The interface used the values given by coders to automatically optimize
the coding of later sensors. For example, the first pass over the video coded whether or
not the occupant of the room was present and how many guests were present. This
information was used to ensure that the coder was never asked to watch the recordings
and code the occupant actions for a segment during which the occupant was never
present. Similarly, coders were not asked to watch the recordings and code guest
activities when no guests were present. These optimizations allowed our coders to
manually simulate sensors at a rate of between three to four minutes of coding time per
minute of processed recording.
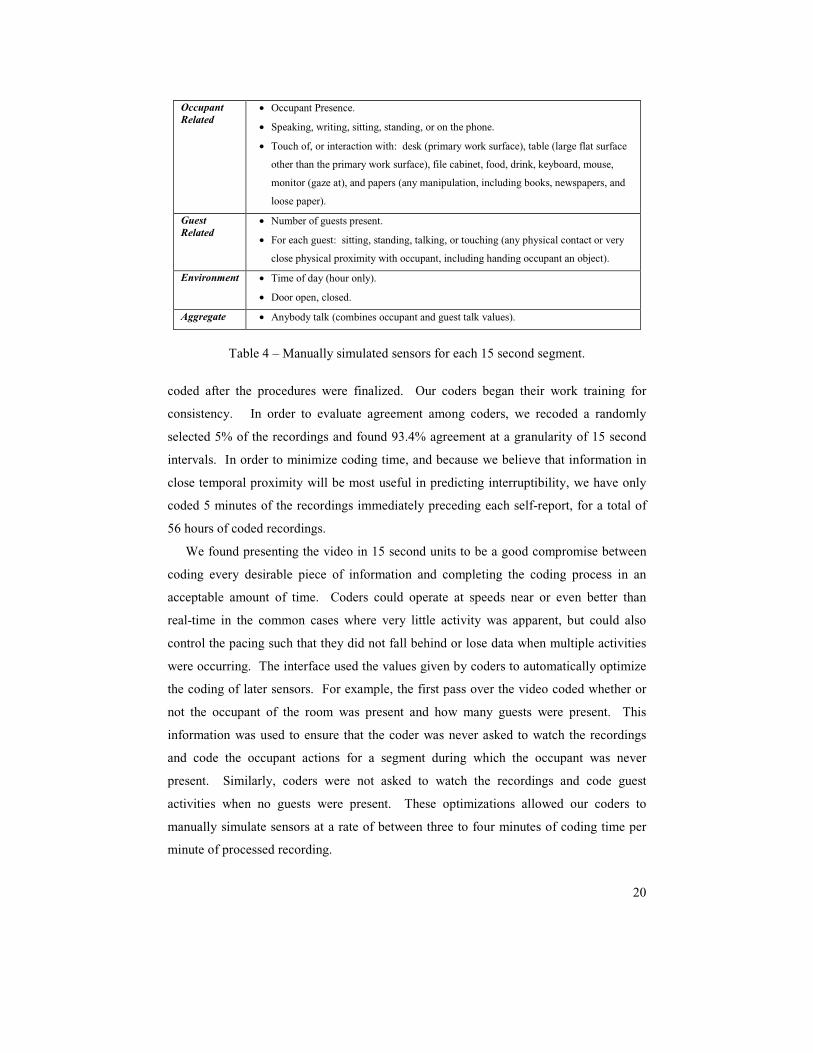
Occupant Related
• Occupant Presence.
• Speaking, writing, sitting, standing, or on the phone.
• Touch of, or interaction with: desk (primary work surface), table (large flat surface
other than the primary work surface), file cabinet, food, drink, keyboard, mouse,
monitor (gaze at), and papers (any manipulation, including books, newspapers, and
loose paper).
Guest Related
• Number of guests present.
• For each guest: sitting, standing, talking, or touching (any physical contact or very
close physical proximity with occupant, including handing occupant an object).
Environment • Time of day (hour only).
• Door open, closed.
Aggregate • Anybody talk (combines occupant and guest talk values).
Table 4 – Manually simulated sensors for each 15 second segment.
21
Using a total of four passes, our coding of the recordings identified occurrences of the
24 events or situations included in Table 4. This set of manually simulated sensors was
chosen because we had an a priori belief that they might be related to interruptibility,
because we believed that a sensor could plausibly be built to detect them, and because
they could be observed in our recordings. While we also believe that such information as
what applications are running on a computer could be useful, we could not directly
observe such information in our recordings. Some of these sensors would be easier to
build than others, and we have included sensors that might be difficult to build because
knowing if they would be useful in predicting interruptibility could justify the effort that
would be necessary to develop them.
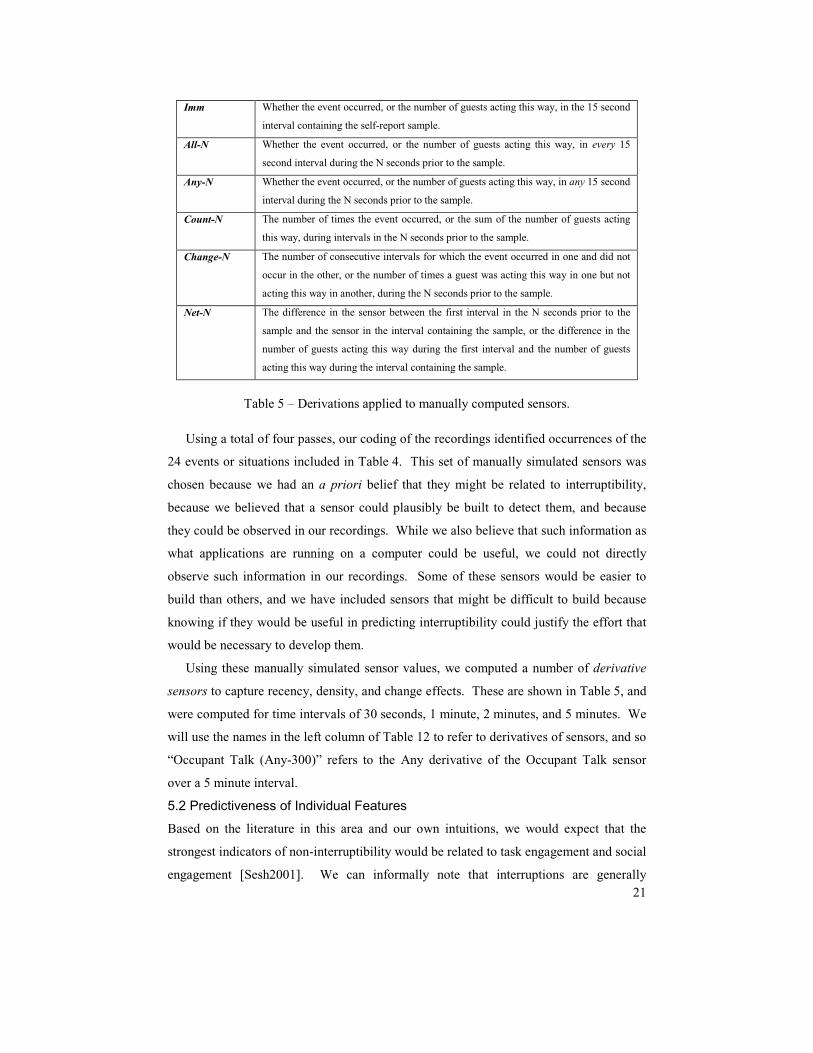
Using these manually simulated sensor values, we computed a number of derivative
sensors to capture recency, density, and change effects. These are shown in Table 5, and
were computed for time intervals of 30 seconds, 1 minute, 2 minutes, and 5 minutes. We
will use the names in the left column of Table 12 to refer to derivatives of sensors, and so
“Occupant Talk (Any-300)” refers to the Any derivative of the Occupant Talk sensor
over a 5 minute interval.
5.2 Predictiveness of Individual Features
Based on the literature in this area and our own intuitions, we would expect that the
strongest indicators of non-interruptibility would be related to task engagement and social
engagement [Sesh2001]. We can informally note that interruptions are generally
Imm Whether the event occurred, or the number of guests acting this way, in the 15 second
interval containing the self-report sample.
All-N Whether the event occurred, or the number of guests acting this way, in every 15
second interval during the N seconds prior to the sample.
Any-N Whether the event occurred, or the number of guests acting this way, in any 15 second
interval during the N seconds prior to the sample.
Count-N The number of times the event occurred, or the sum of the number of guests acting
this way, during intervals in the N seconds prior to the sample.
Change-N The number of consecutive intervals for which the event occurred in one and did not
occur in the other, or the number of times a guest was acting this way in one but not
acting this way in another, during the N seconds prior to the sample.
Net-N The difference in the sensor between the first interval in the N seconds prior to the
sample and the sensor in the interval containing the sample, or the difference in the
number of guests acting this way during the first interval and the number of guests
acting this way during the interval containing the sample.
Table 5 – Derivations applied to manually computed sensors.
22
inappropriate when somebody is talking, as it is almost always considered rude to
interrupt a person who is talking. It is also particularly inappropriate to interrupt a person
who is speaking on a telephone, perhaps because the remote party to a conversation
cannot participate in the subtle non-verbal negotiation of the interruption.
While we felt that these types of activities would need to be detected in order to
produce good estimates of interruptibility, it was not clear exactly which sensors would
be the most helpful. It was also not clear which easily built sensors might work almost as
well as sensors that would be very difficult to build. To gain some insight into these
issues, we examined the predictive power of the individual features using an information
gain metric [Mitc1997].
Described simply, information gain is based on sorting a set of observations according
to the value of a feature associated with each observation. This sorting removes the
entropy associated with variations in that feature. This reduction of entropy from sorting
for each feature provides an estimate of the predictiveness of that feature. The absolute
value of this difference is not particularly interesting, only the relative values for the
features. Further, information gain only indicates potential usefulness in prediction, and
cannot by itself indicate whether a feature indicates interruptibility or non-interruptibility.
Finally, the notion of predictiveness measured by information gain includes sensitivity to
frequency, and so an event that always indicates interruptibility but almost never occurs
would not be highly ranked.
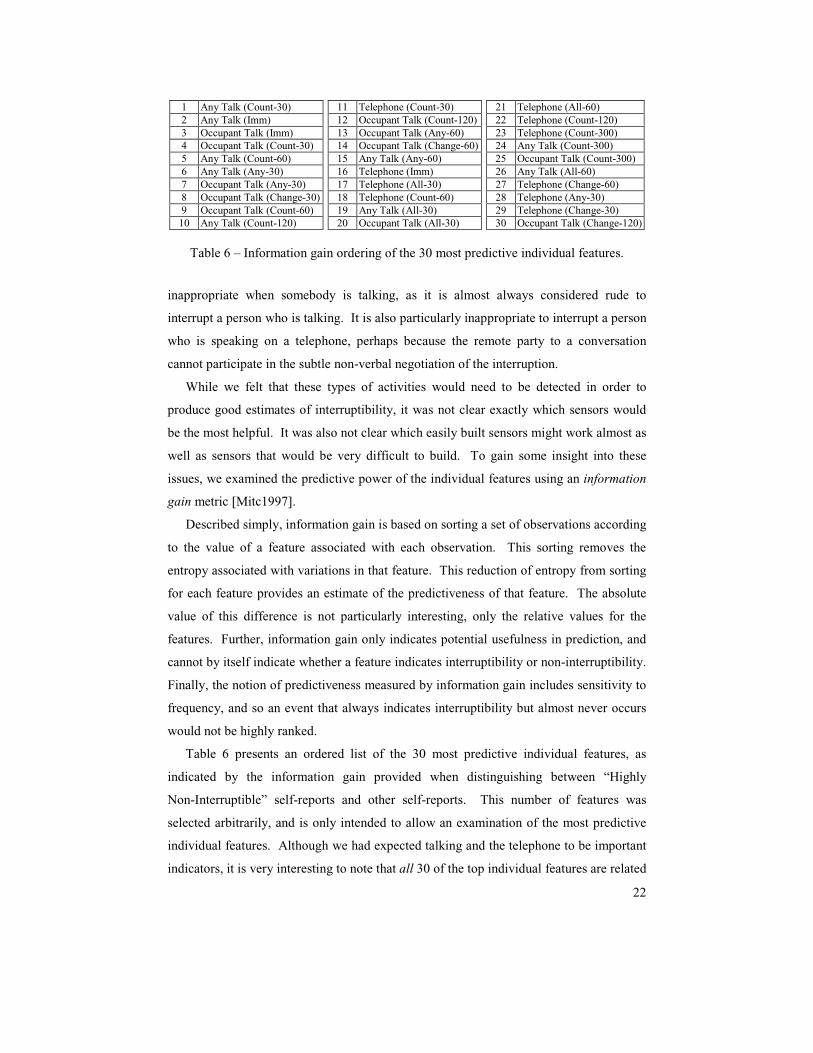
Table 6 presents an ordered list of the 30 most predictive individual features, as
indicated by the information gain provided when distinguishing between “Highly
Non-Interruptible” self-reports and other self-reports. This number of features was
selected arbitrarily, and is only intended to allow an examination of the most predictive
individual features. Although we had expected talking and the telephone to be important
indicators, it is very interesting to note that all 30 of the top individual features are related
1 Any Talk (Count-30) 11 Telephone (Count-30) 21 Telephone (All-60) 2 Any Talk (Imm) 12 Occupant Talk (Count-120) 22 Telephone (Count-120) 3 Occupant Talk (Imm) 13 Occupant Talk (Any-60) 23 Telephone (Count-300) 4 Occupant Talk (Count-30) 14 Occupant Talk (Change-60) 24 Any Talk (Count-300) 5 Any Talk (Count-60) 15 Any Talk (Any-60) 25 Occupant Talk (Count-300) 6 Any Talk (Any-30) 16 Telephone (Imm) 26 Any Talk (All-60) 7 Occupant Talk (Any-30) 17 Telephone (All-30) 27 Telephone (Change-60) 8 Occupant Talk (Change-30) 18 Telephone (Count-60) 28 Telephone (Any-30) 9 Occupant Talk (Count-60) 19 Any Talk (All-30) 29 Telephone (Change-30)
10 Any Talk (Count-120) 20 Occupant Talk (All-30) 30 Occupant Talk (Change-120)
Table 6 – Information gain ordering of the 30 most predictive individual features.
23
to either the telephone or talking. This metric does not consider the redundancy between
the features in this chart. While sensors for talking and the telephone will be important
throughout this paper, the models discussed in the rest of this paper will also examine
what additional features can complement the information gained from talking and
telephone sensors. This metric shows that, if allowed to use only one sensor, a sensor
related to talking or the telephone is the most useful.
5.3 Correlation-Based Feature Selection
As we begin to examine the use of multiple features, we should note that the combination
of manually simulated sensors and sensor derivations yields a very large number of
possible features. Using all of these features to build our models could have very
negative effects on the models. Although the details of these negative effects vary
according to the techniques used by the model, they can mostly be described as a problem
of the model being distracted by unnecessary features. In a phenomenon known as
overfitting, a model mistakenly interprets minor details or quirks in data as representative
of data it will be asked to evaluate in the future. The overall accuracy of its future
estimates is then lower than it should be, because it is confused by differences in the
minor details that it previously mistook for important. Overfitting is very similar to the
degree-of-freedom problems found in models with excessive parameters.
In order to help keep our models from overfitting, we applied a correlation-based
feature selection technique [Hall2000] as implemented in the Weka machine learning
software package [Witt1999]. This technique uses correlations between different features
and the value that will be estimated to select a set of features according to the criterion
that “Good feature subsets contain features highly correlated with the (value to be
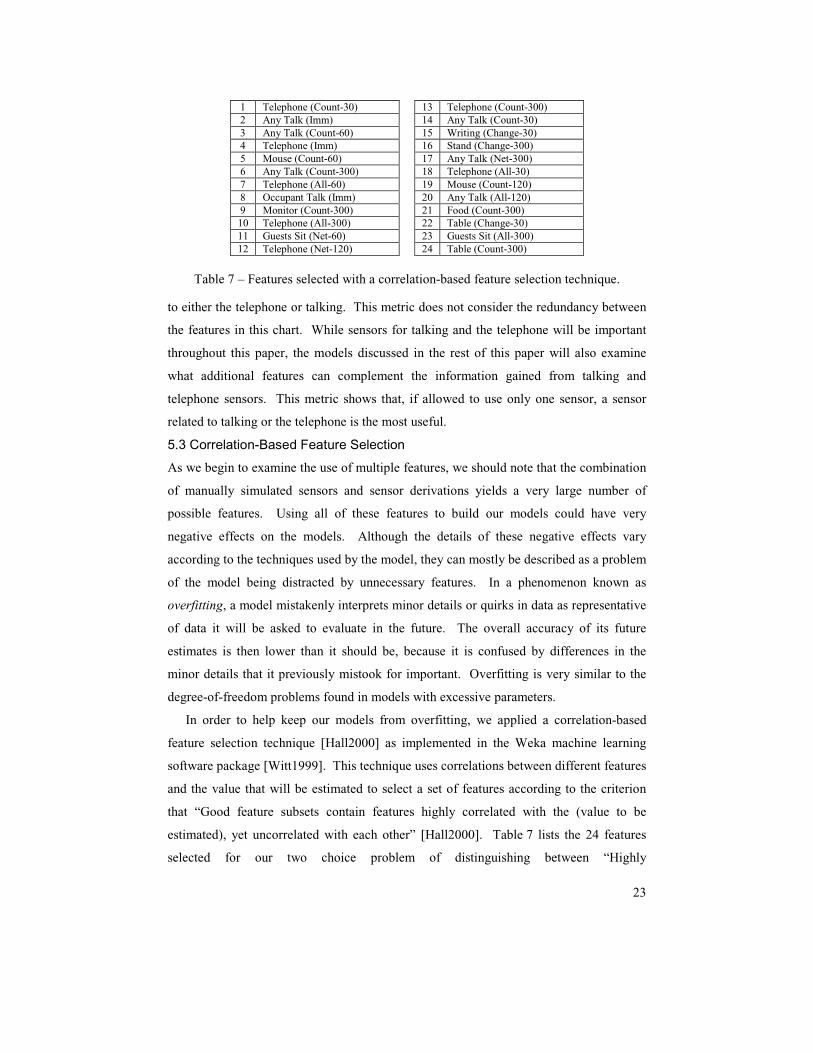
estimated), yet uncorrelated with each other” [Hall2000]. Table 7 lists the 24 features
selected for our two choice problem of distinguishing between “Highly
1 Telephone (Count-30) 13 Telephone (Count-300) 2 Any Talk (Imm) 14 Any Talk (Count-30) 3 Any Talk (Count-60) 15 Writing (Change-30) 4 Telephone (Imm) 16 Stand (Change-300) 5 Mouse (Count-60) 17 Any Talk (Net-300) 6 Any Talk (Count-300) 18 Telephone (All-30) 7 Telephone (All-60) 19 Mouse (Count-120) 8 Occupant Talk (Imm) 20 Any Talk (All-120) 9 Monitor (Count-300) 21 Food (Count-300) 10 Telephone (All-300) 22 Table (Change-30) 11 Guests Sit (Net-60) 23 Guests Sit (All-300) 12 Telephone (Net-120) 24 Table (Count-300)
Table 7 – Features selected with a correlation-based feature selection technique.

24
Non-Interruptible” conditions and other conditions, in the order of their selection. Unlike
information gain, the number of features selected here is not arbitrary. The correlation-
based feature selection technique indicates the point at which it believes additional
features are redundant and may lead to overfitting, which in this case is after the
(Count-300) derivative of the Table feature. The top several features relate to the
occupant being on the telephone or somebody in the office talking and are consistent with
our expectations about activities that might be correlated with non-interruptibility. The
fifth feature is a count of how many 15 second intervals in the previous minute have
included the occupant using the mouse. We can also see that some sensors, such as
interaction with a file cabinet, did not yield any selected features. This may be because
such sensors are not related to interruptibility, or it may because the events they
represented did not occur often enough to emerge as predictive in our data.
In the next subsection, we will create models of human interruptibility based on the
features selected in this subsection. While we will revisit feature selection in a later
subsection, the feature selection technique used here has some benefits that should be
discussed. First, this technique is computationally very cheap compared to the feature
selection techniques we will visit in a later subsection. In a deployed system, the feature
selection techniques used here could regularly examine a huge number of possibly
interesting features and quickly select a subset appropriate for modeling. Second, this
technique is independent of the models that will be created from the selected features. As
such, the selected features are appropriate for use with a variety of models.
5.4 Initial Model Construction
This subsection presents models constructed using several standard machine learning
techniques. Specifically, we will be using decision trees [Quin1993] and naïve Bayes
predictors [Duda1973, Lang1994]. We have obtained similar results with support vector
machines [Burg1998] and AdaBoost with decision stumps [Freu1997], but will not
discuss them here for the sake of brevity. We will also not attempt to fully describe each
of these techniques here. Instead, interested readers are encouraged to consult the
original references or a machine learning text, such as [Mitc1997]. All of our models
were constructed using the Weka machine learning software package [Witt1999], a
widely available open source software package.
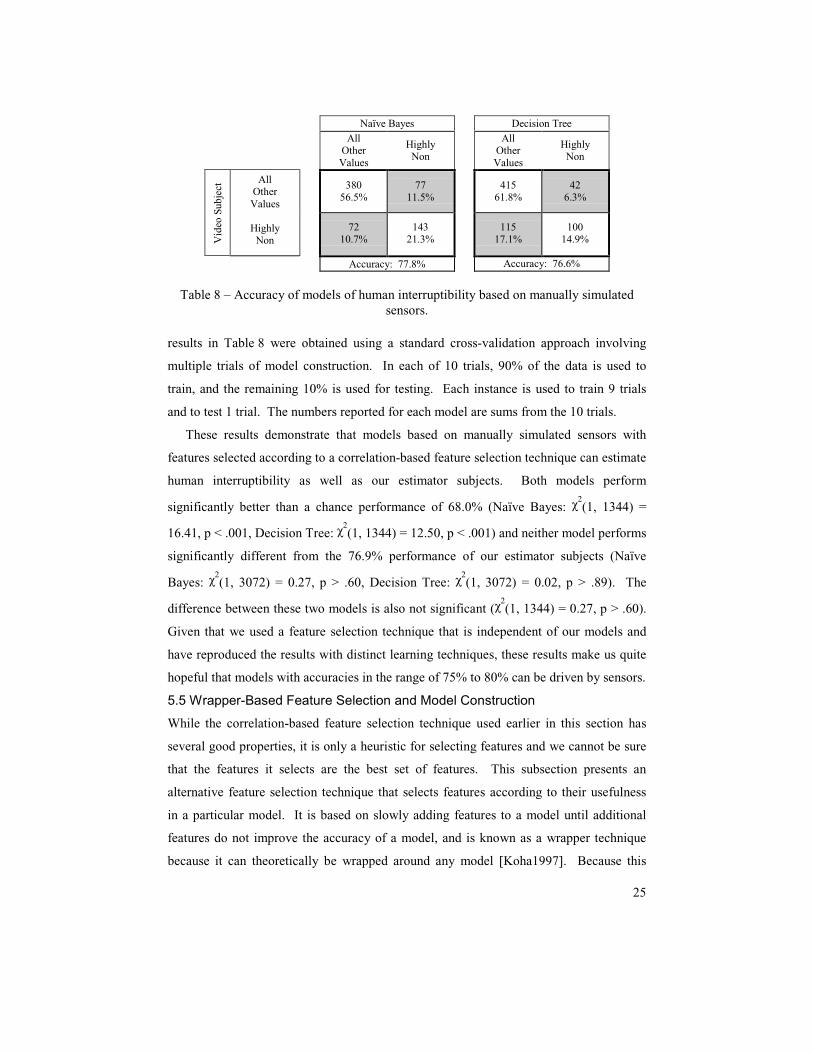
Confusion matrices for models constructed from the features in Table 7 are presented
in Table 8. Remember that chance in the two choice problem is an accuracy of 68.0%,
which could be obtained by always predicting the “All Other Values” category. The
25
results in Table 8 were obtained using a standard cross-validation approach involving
multiple trials of model construction. In each of 10 trials, 90% of the data is used to
train, and the remaining 10% is used for testing. Each instance is used to train 9 trials
and to test 1 trial. The numbers reported for each model are sums from the 10 trials.
These results demonstrate that models based on manually simulated sensors with
features selected according to a correlation-based feature selection technique can estimate
human interruptibility as well as our estimator subjects. Both models perform
significantly better than a chance performance of 68.0% (Naïve Bayes: χ2(1, 1344) =
16.41, p < .001, Decision Tree: χ2(1, 1344) = 12.50, p < .001) and neither model performs
significantly different from the 76.9% performance of our estimator subjects (Naïve
Bayes: χ2(1, 3072) = 0.27, p > .60, Decision Tree: χ
2(1, 3072) = 0.02, p > .89). The
difference between these two models is also not significant (χ2(1, 1344) = 0.27, p > .60).
Given that we used a feature selection technique that is independent of our models and
have reproduced the results with distinct learning techniques, these results make us quite
hopeful that models with accuracies in the range of 75% to 80% can be driven by sensors.
5.5 Wrapper-Based Feature Selection and Model Construction
While the correlation-based feature selection technique used earlier in this section has
several good properties, it is only a heuristic for selecting features and we cannot be sure
that the features it selects are the best set of features. This subsection presents an
alternative feature selection technique that selects features according to their usefulness
in a particular model. It is based on slowly adding features to a model until additional
features do not improve the accuracy of a model, and is known as a wrapper technique
because it can theoretically be wrapped around any model [Koha1997]. Because this
Naïve Bayes Decision Tree
All
Other Values
Highly Non
All Other Values
Highly Non
All Other Values
380
56.5% 77
11.5%
415 61.8%
42 6.3%
Vid
eo S
ubje
ct
Highly Non
72
10.7% 143
21.3%
115 17.1%
100 14.9%
Accuracy: 77.8% Accuracy: 76.6%
Table 8 – Accuracy of models of human interruptibility based on manually simulated
sensors.

26
technique requires the repeated use of a machine learning technique, it is computationally
much more expensive than techniques like correlation-based feature selection. The
results presented here were used in conjunction with a feature search technique that starts
with an empty set of features and adds or removes features from the set until there is no
change that results in an improvement. A cross-validation technique is used, such that
models created during the process are trained with 90% of the data and evaluated using
10% of the data. This approach is limited by the fact that it selects features appropriate to
the particular model used during feature selection, and these features may not be
appropriate for other models. Used with a naïve Bayes model, for example, this method
will not select locally predictive features that could be useful to a decision tree model.
Conversely, the locally predictive features selected when this technique is used with a
decision tree model may detract from the accuracy of a naïve Bayes model.
Table 9 presents the results of applying a wrapper-based feature selection technique
with a naïve Bayes classifier. The 10 features shown here were selected as good features
1 Any Talk (Imm) 2 Drink (Any-30) 3 Desk (Change-300) 4 Telephone (Imm) 5 Time of Day (Hour Only) 6 Stand (Any-120) 7 Stand (Net-120) 8 Guests Sit (Net-30) 9 Desk (Net-60)
10 Drink (Count-300)
Naïve Bayes
All
Other Values
Highly Non
All Other Values
411 61.2%
46 6.8%
Vid
eo S
ubje
ct
Highly Non
80 11.9%
135 20.1%
Accuracy: 81.25%
Table 9 – Wrapper-based feature selection with naïve Bayes classifier and results of
the final naïve Bayes classifier
1 Any Talk (Imm) 2 Telephone (Count-30) 3 Time of Day (Hour Only) 4 Desk (Change-120) 5 Monitor (Any-300) 6 Occupant Talk (Net-120) 7 Writing (Count-30) 8 Writing (Count-60) 9 Papers (Count-300)
10 Mouse (All-120)
Decision Tree
All
Other Values
Highly Non
All Other Values
413 61.5%
44 6.5%
Vid
eo S
ubje
ct
Highly Non
74 11.0%
141 21.0%
Accuracy: 82.4%
Table 10 – Wrapper-based feature selection with decision tree and results of the final
decision tree

27
for the naïve Bayes classifier, and they may not be good features for another classifier.
They yield a naïve Bayes classifier model with an accuracy of 81.25%, significantly
better than the chance performance of 68.0% (χ2(1, 1344) = 31.13, p < .001), significantly
better than the performance of our estimator subjects (χ2(1, 3072) = 5.82, p < .05), and
better than the performance of the naïve Bayes classifier built with the correlation-based
feature selection, though this difference is not significant (χ2(1, 1344) = 2.42, p > .11).
Table 10 presents similar results obtained with a decision tree classifier. Coincidentally,
10 features are also selected in this case, though they are different than the features
selected for use with the naïve Bayes classifier. The selected features yield a decision
tree classifier with an accuracy of 82.4%, significantly better than chance (χ2(1, 1344) =
37.56, p < .001), significantly better than the performance of our estimator subjects (χ2(1,
3072) = 9.51, p < .01), and significantly better than the performance of the decision tree
classifier built with the correlation-based feature selection (χ2(1, 3072) = 9.51, p < .01).
The difference between the decision tree model built here and the naïve Bayes model
built here is not significant (χ2(1, 1344) = 0.32, p > .57).
The models presented in this subsection both distinguish between “Highly
Non-Interruptible” situations and other situations with an accuracy that is significantly
better than the 76.9% accuracy of our estimator subjects. The tradeoff for obtaining these
better results is that we have expended much more computational resources during model
creation and have selected features that may be appropriate only with the models we used
when selecting them. These results, taken with the results in the previous subsection,
support the view that it should be possible to create robust models of human
interruptibility. Because the estimates given by our models match and even surpass the
accuracy of estimates given by our estimator subjects, it should be possible to design
systems that effectively use these estimates as part of a negotiated interruption process.
28
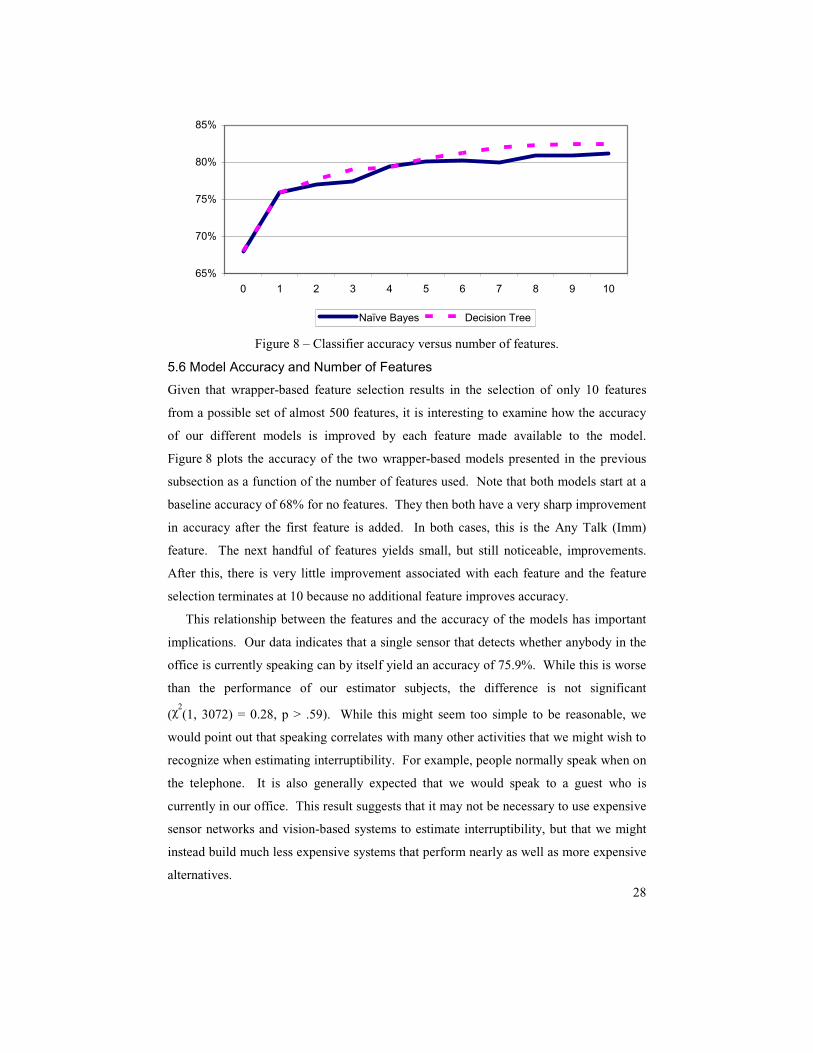
5.6 Model Accuracy and Number of Features
Given that wrapper-based feature selection results in the selection of only 10 features
from a possible set of almost 500 features, it is interesting to examine how the accuracy
of our different models is improved by each feature made available to the model.
Figure 8 plots the accuracy of the two wrapper-based models presented in the previous
subsection as a function of the number of features used. Note that both models start at a
baseline accuracy of 68% for no features. They then both have a very sharp improvement
in accuracy after the first feature is added. In both cases, this is the Any Talk (Imm)
feature. The next handful of features yields small, but still noticeable, improvements.
After this, there is very little improvement associated with each feature and the feature
selection terminates at 10 because no additional feature improves accuracy.
This relationship between the features and the accuracy of the models has important
implications. Our data indicates that a single sensor that detects whether anybody in the
office is currently speaking can by itself yield an accuracy of 75.9%. While this is worse
than the performance of our estimator subjects, the difference is not significant
(χ2(1, 3072) = 0.28, p > .59). While this might seem too simple to be reasonable, we
would point out that speaking correlates with many other activities that we might wish to
recognize when estimating interruptibility. For example, people normally speak when on
the telephone. It is also generally expected that we would speak to a guest who is
currently in our office. This result suggests that it may not be necessary to use expensive
sensor networks and vision-based systems to estimate interruptibility, but that we might
instead build much less expensive systems that perform nearly as well as more expensive
alternatives.
65%
70%
75%
80%
85%
0 1 2 3 4 5 6 7 8 9 10
Naïve Bayes Decision Tree
Figure 8 – Classifier accuracy versus number of features.
29
5.7 An “Easy to Build” Feature Set
Given the results of the previous subsection, we now consider the construction of models
that use only sensors that are readily available or could be easily constructed. In fact, we
originally created the Any Talk aggregate simulated sensor because it would be easier to
build than a sensor that attempted to differentiate between the occupant of an office
talking and guests talking. This proposed sensor could be combined with simple software
that indicates mouse and keyboard activity. An inexpensive piece of hardware placed
between the telephone and the wall can sense whether the phone is currently off the hook.
Finally, the time of day is readily available. Throughout this section, we will refer to this
set of 5 sensors from our manually simulated data as “Easy to Build” features.
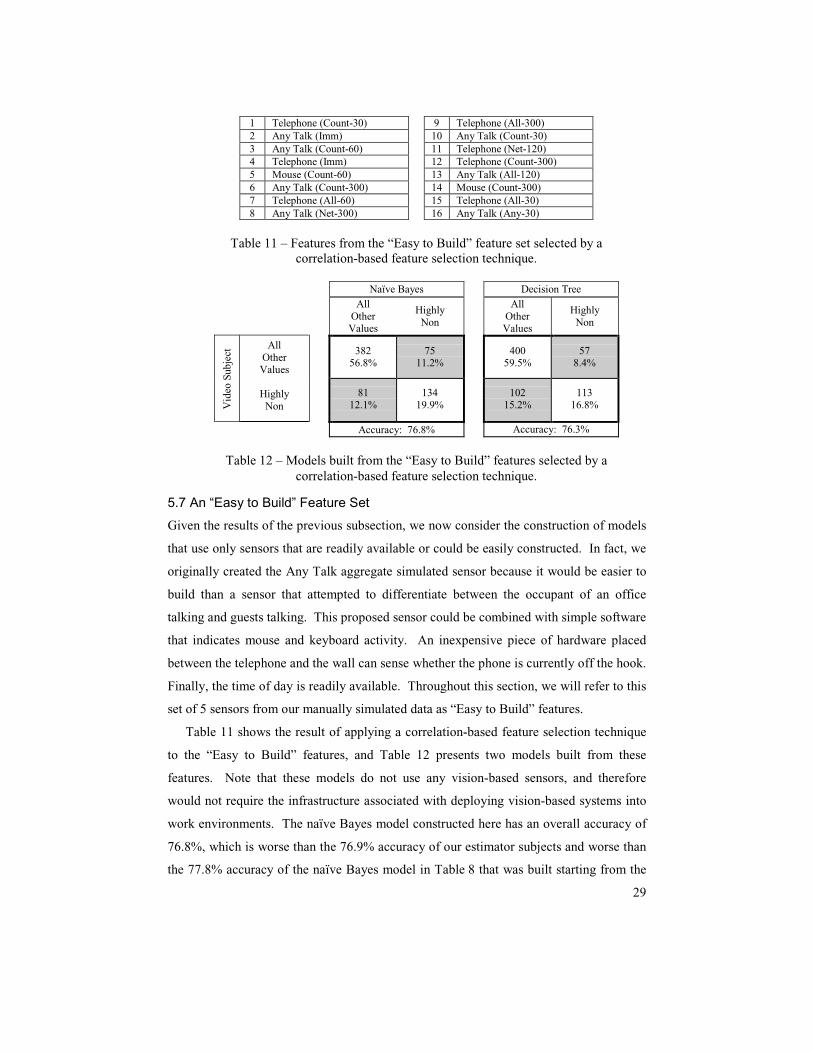
Table 11 shows the result of applying a correlation-based feature selection technique
to the “Easy to Build” features, and Table 12 presents two models built from these
features. Note that these models do not use any vision-based sensors, and therefore
would not require the infrastructure associated with deploying vision-based systems into
work environments. The naïve Bayes model constructed here has an overall accuracy of
76.8%, which is worse than the 76.9% accuracy of our estimator subjects and worse than
the 77.8% accuracy of the naïve Bayes model in Table 8 that was built starting from the
1 Telephone (Count-30) 9 Telephone (All-300) 2 Any Talk (Imm) 10 Any Talk (Count-30) 3 Any Talk (Count-60) 11 Telephone (Net-120) 4 Telephone (Imm) 12 Telephone (Count-300) 5 Mouse (Count-60) 13 Any Talk (All-120) 6 Any Talk (Count-300) 14 Mouse (Count-300) 7 Telephone (All-60) 15 Telephone (All-30) 8 Any Talk (Net-300) 16 Any Talk (Any-30)
Table 11 – Features from the “Easy to Build” feature set selected by a
correlation-based feature selection technique.
Naïve Bayes Decision Tree
All
Other Values
Highly Non
All Other Values
Highly Non
All Other Values
382
56.8% 75
11.2%
400 59.5%
57 8.4%
Vid
eo S
ubje
ct
Highly Non
81
12.1% 134
19.9%
102 15.2%
113 16.8%
Accuracy: 76.8% Accuracy: 76.3%
Table 12 – Models built from the “Easy to Build” features selected by a
correlation-based feature selection technique.

30
entire set of sensors, though neither of these differences is significant (χ2(1, 3072) =
0.002, p > .96, χ2(1, 1344) = 0.21, p > .64). Similarly, the decision tree model
constructed here has an overall accuracy of 76.3%, which is worse than the performance
of our estimator subjects and worse than the performance of the decision tree model in
Table 8 that was built starting from the entire set of sensors, but neither of these
differences is significant (χ2(1, 3072) = 0.08, p > .77, χ
2(1, 1344) = 0.02, p > .89).
Table 13 and Table 14 present the selected features and the final models from
applying wrapper-based feature selection to the “Easy to Build” features with a naïve
Bayes model and a decision tree model. The naïve Bayes result of a 78.9% overall
accuracy is better than the 76.9% overall accuracy of our estimator subjects, though not
significantly better (χ2(1, 3072) = 1.19, p > .27), and also worse than the 81.25% overall
accuracy of the model in Table 9 that was built from the full set of sensors, but not
significantly worse (χ2(1, 1344) = 1.19, p > .27). The decision tree model accuracy of
79.2% is also better than our estimator subject accuracy, but the difference is not
1 Any Talk (Imm) 2 Any Talk (Count-30) 3 Telephone (All-30) 4 Mouse (Imm) 5 Mouse (Change-30) 6 Telephone (All-120) 7 Mouse (All-120) 8 Mouse (Net-60)
Naïve Bayes
All
Other Values
Highly Non
All Other Values
396 58.9%
61 9.1%
Vid
eo S
ubje
ct
Highly Non
81 12.1%
134 19.9%
Accuracy: 78.9%
Table 13 – “Easy to Build” features for wrapper-based feature selection and results of
the final naïve Bayes model.
1 Any Talk (Imm) 2 Telephone (Count-30) 3 Time of Day (Hour Only) 4 Any Talk (Net-120)
Decision Tree
All
Other Values
Highly Non
All Other Values
396 58.9%
61 9.1%
Vid
eo S
ubje
ct
Highly Non
79 11.8%
136 20.2%
Accuracy: 79.2%
Table 14 – “Easy to Build” features for wrapper-based feature selection and results of
the final decision tree model.

31
significant (χ2(1, 3072) = 1.58, p > .20). It is also worse than the 82.4% overall accuracy
of the model in Table 10 that was built from the full set of sensors, but not significantly
worse (χ2(1, 1344) = 2.32, p > .12).
These results for the “Easy to Build” sensors are very promising because they indicate
that models of human interruptibility can be based on technology that is already available
or easily built. This implies that we do not need to solve hard computer vision problems
or hard artificial intelligence problems before proceeding with creating systems that use
models of human interruptibility.
5.8 Models of the 5 Choice Problem
Up until this point, we have focused on models that distinguished between “Highly
Non-Interruptible” situations and other situations. In this subsection we present models
of the full 5 point scale and discuss how these models can support a level of flexibility for
systems that is not available from models of the 2 choice problem. It is important to note
that the techniques we use here do not have any notion of the fact that our five possible
values represent a scale. As far as the techniques are concerned, the five values are
completely unrelated. While there are techniques that support numeric values like a
scale, informal experimentation with some of these techniques did not yield an
improvement over the results we present here.
Table 15 presents the results of wrapper-based feature selection for the 5 choice
problem with a naïve Bayes classifier. The 47.6% overall accuracy of this model is
significantly better than our estimator subjects 30.7% performance (χ2(1, 3072) = 66.17,
p < .001). Table 16 presents the results from a decision tree model. Its 51.5% overall
1 Occupant Talk (Any-30) 2 Sit (All-30) 3 Table (Count-60) 4 Food (Any-120) 5 File Cabinet (Any-300) 6 Door Close (Any-300)
Naïve Bayes
Highly
Interruptible
Highly Non-Interruptible
1 2 3 4 5
133
4.9% 6
0.9%27
4.0%0
0.0% 26
3.9%
212
1.8% 12
1.8%39
5.8%4
0.6% 19
2.8%
311
1.6% 2
0.3%106 15.8
7 1.0%
37 5.5%
47
1.0% 1
0.1%55
8.2%23
3.4% 30
4.5%
Vid
eo S
ubje
ct V
alue
511
1.6% 5
0.7%42
6.3%11
1.6% 146
21.7%
Overall Accuracy: 47.6%
Accuracy Within 1: 71.7%
Table 15 – Wrapper-based feature selection with naïve Bayes classifier and results of the final naïve Bayes classifier
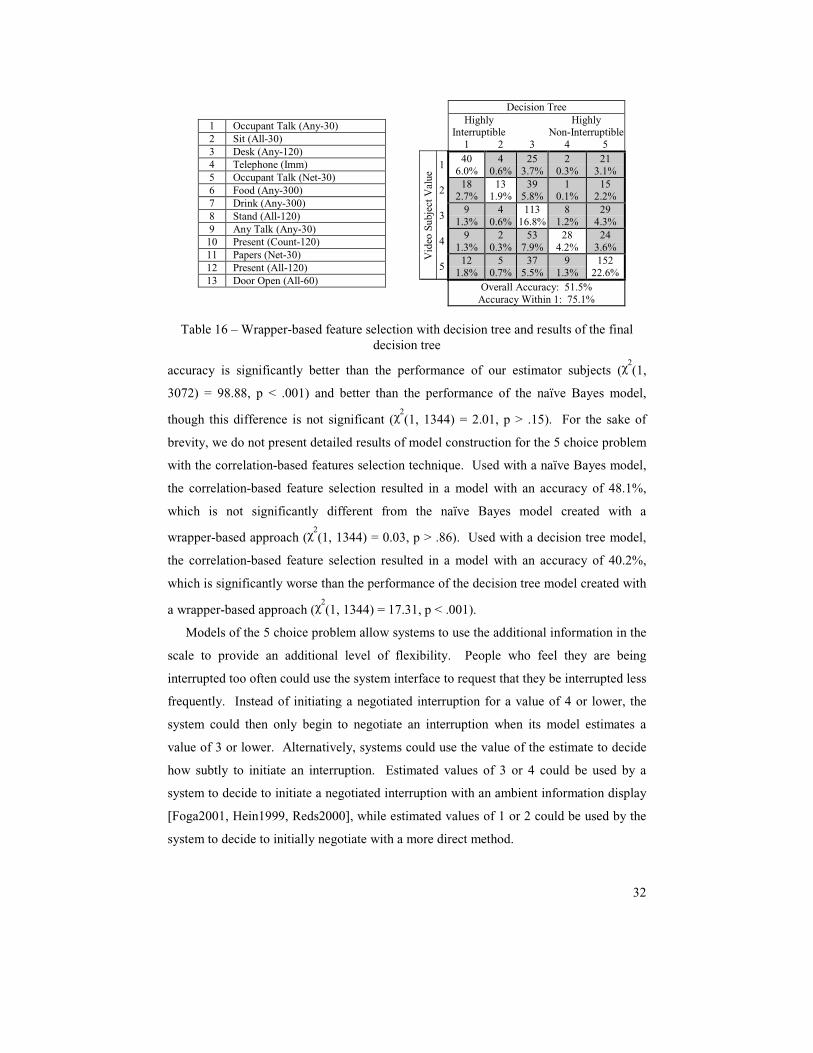
32
accuracy is significantly better than the performance of our estimator subjects (χ2(1,
3072) = 98.88, p < .001) and better than the performance of the naïve Bayes model,
though this difference is not significant (χ2(1, 1344) = 2.01, p > .15). For the sake of
brevity, we do not present detailed results of model construction for the 5 choice problem
with the correlation-based features selection technique. Used with a naïve Bayes model,
the correlation-based feature selection resulted in a model with an accuracy of 48.1%,
which is not significantly different from the naïve Bayes model created with a
wrapper-based approach (χ2(1, 1344) = 0.03, p > .86). Used with a decision tree model,
the correlation-based feature selection resulted in a model with an accuracy of 40.2%,
which is significantly worse than the performance of the decision tree model created with
a wrapper-based approach (χ2(1, 1344) = 17.31, p < .001).
Models of the 5 choice problem allow systems to use the additional information in the
scale to provide an additional level of flexibility. People who feel they are being
interrupted too often could use the system interface to request that they be interrupted less
frequently. Instead of initiating a negotiated interruption for a value of 4 or lower, the
system could then only begin to negotiate an interruption when its model estimates a
value of 3 or lower. Alternatively, systems could use the value of the estimate to decide
how subtly to initiate an interruption. Estimated values of 3 or 4 could be used by a
system to decide to initiate a negotiated interruption with an ambient information display
[Foga2001, Hein1999, Reds2000], while estimated values of 1 or 2 could be used by the
system to decide to initially negotiate with a more direct method.
1 Occupant Talk (Any-30) 2 Sit (All-30) 3 Desk (Any-120) 4 Telephone (Imm) 5 Occupant Talk (Net-30) 6 Food (Any-300) 7 Drink (Any-300) 8 Stand (All-120) 9 Any Talk (Any-30)
10 Present (Count-120) 11 Papers (Net-30) 12 Present (All-120) 13 Door Open (All-60)
Decision Tree
Highly
Interruptible
Highly Non-Interruptible
1 2 3 4 5
140
6.0% 4
0.6%25
3.7%2
0.3% 21
3.1%
218
2.7% 13
1.9%39
5.8%1
0.1% 15
2.2%
39
1.3% 4
0.6%113
16.8%8
1.2% 29
4.3%
49
1.3% 2
0.3%53
7.9%28
4.2% 24
3.6%
Vid
eo S
ubje
ct V
alue
512
1.8% 5
0.7%37
5.5%9
1.3% 152
22.6%
Overall Accuracy: 51.5%
Accuracy Within 1: 75.1%
Table 16 – Wrapper-based feature selection with decision tree and results of the final decision tree
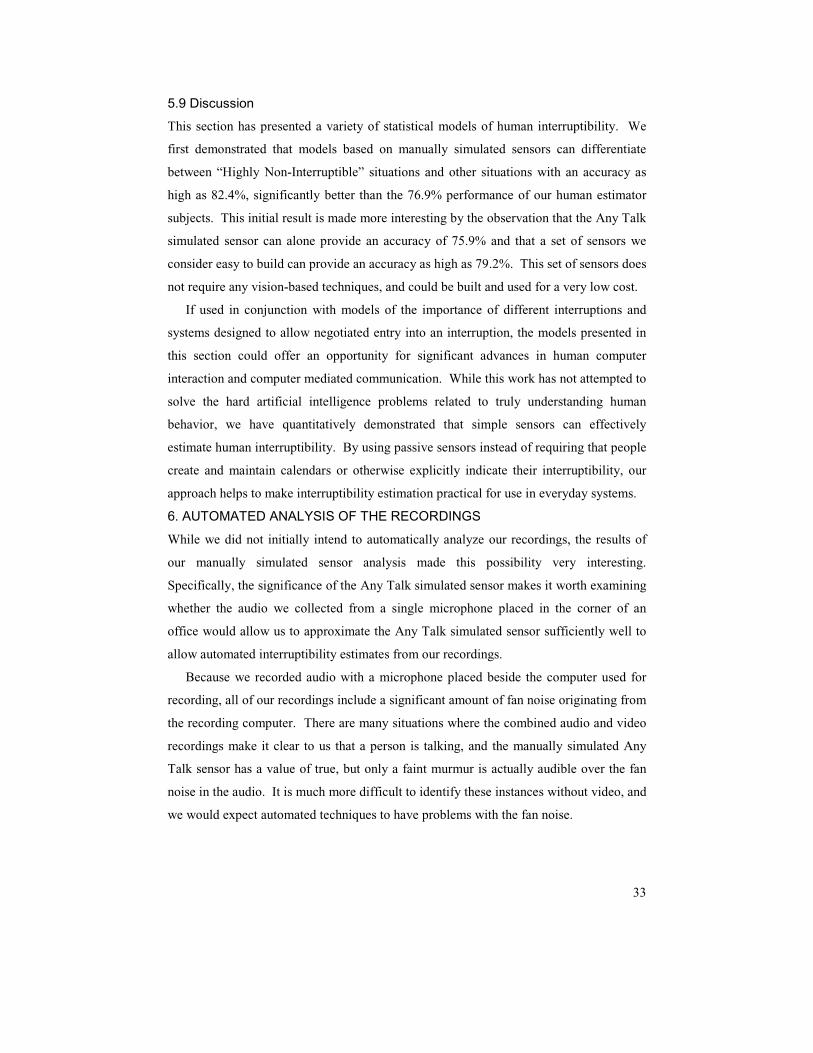
33
5.9 Discussion
This section has presented a variety of statistical models of human interruptibility. We
first demonstrated that models based on manually simulated sensors can differentiate
between “Highly Non-Interruptible” situations and other situations with an accuracy as
high as 82.4%, significantly better than the 76.9% performance of our human estimator
subjects. This initial result is made more interesting by the observation that the Any Talk
simulated sensor can alone provide an accuracy of 75.9% and that a set of sensors we
consider easy to build can provide an accuracy as high as 79.2%. This set of sensors does
not require any vision-based techniques, and could be built and used for a very low cost.
If used in conjunction with models of the importance of different interruptions and
systems designed to allow negotiated entry into an interruption, the models presented in
this section could offer an opportunity for significant advances in human computer
interaction and computer mediated communication. While this work has not attempted to
solve the hard artificial intelligence problems related to truly understanding human
behavior, we have quantitatively demonstrated that simple sensors can effectively
estimate human interruptibility. By using passive sensors instead of requiring that people
create and maintain calendars or otherwise explicitly indicate their interruptibility, our
approach helps to make interruptibility estimation practical for use in everyday systems.
6. AUTOMATED ANALYSIS OF THE RECORDINGS
While we did not initially intend to automatically analyze our recordings, the results of
our manually simulated sensor analysis made this possibility very interesting.
Specifically, the significance of the Any Talk simulated sensor makes it worth examining
whether the audio we collected from a single microphone placed in the corner of an
office would allow us to approximate the Any Talk simulated sensor sufficiently well to
allow automated interruptibility estimates from our recordings.
Because we recorded audio with a microphone placed beside the computer used for
recording, all of our recordings include a significant amount of fan noise originating from
the recording computer. There are many situations where the combined audio and video
recordings make it clear to us that a person is talking, and the manually simulated Any
Talk sensor has a value of true, but only a faint murmur is actually audible over the fan
noise in the audio. It is much more difficult to identify these instances without video, and
we would expect automated techniques to have problems with the fan noise.
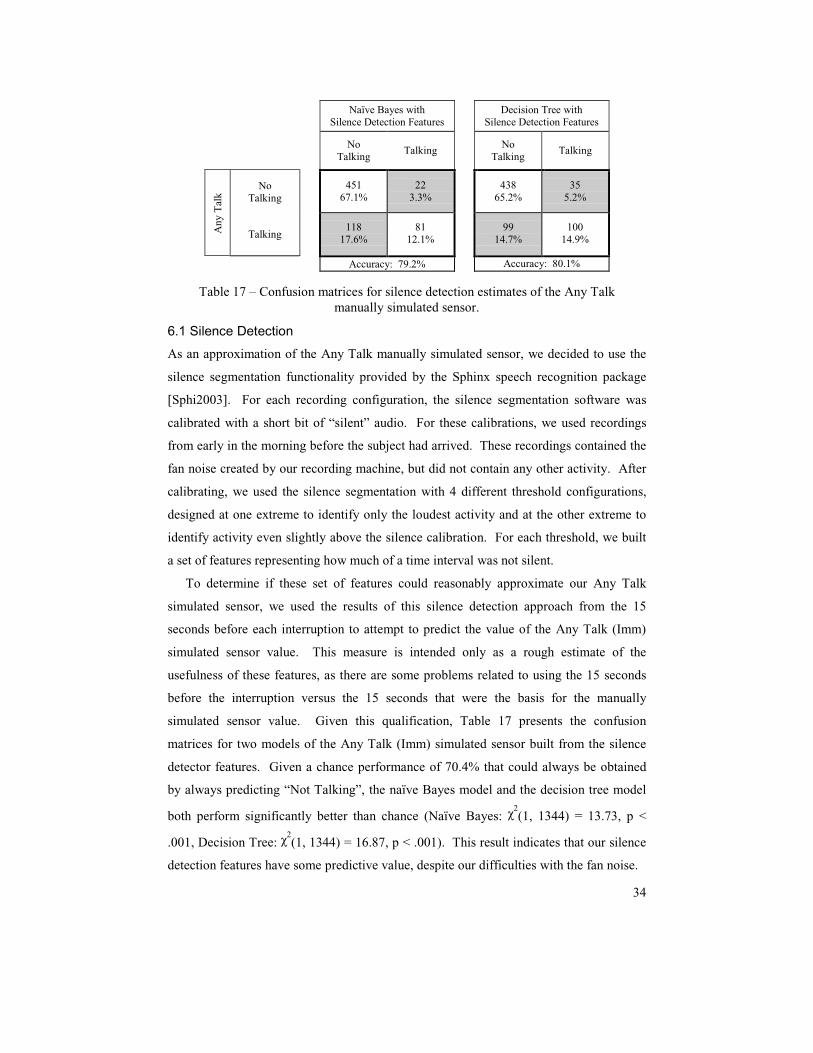
34
6.1 Silence Detection
As an approximation of the Any Talk manually simulated sensor, we decided to use the
silence segmentation functionality provided by the Sphinx speech recognition package
[Sphi2003]. For each recording configuration, the silence segmentation software was
calibrated with a short bit of “silent” audio. For these calibrations, we used recordings
from early in the morning before the subject had arrived. These recordings contained the
fan noise created by our recording machine, but did not contain any other activity. After
calibrating, we used the silence segmentation with 4 different threshold configurations,
designed at one extreme to identify only the loudest activity and at the other extreme to
identify activity even slightly above the silence calibration. For each threshold, we built
a set of features representing how much of a time interval was not silent.
To determine if these set of features could reasonably approximate our Any Talk
simulated sensor, we used the results of this silence detection approach from the 15
seconds before each interruption to attempt to predict the value of the Any Talk (Imm)
simulated sensor value. This measure is intended only as a rough estimate of the
usefulness of these features, as there are some problems related to using the 15 seconds
before the interruption versus the 15 seconds that were the basis for the manually
simulated sensor value. Given this qualification, Table 17 presents the confusion
matrices for two models of the Any Talk (Imm) simulated sensor built from the silence
detector features. Given a chance performance of 70.4% that could always be obtained
by always predicting “Not Talking”, the naïve Bayes model and the decision tree model
both perform significantly better than chance (Naïve Bayes: χ2(1, 1344) = 13.73, p <
.001, Decision Tree: χ2(1, 1344) = 16.87, p < .001). This result indicates that our silence
detection features have some predictive value, despite our difficulties with the fan noise.
Naïve Bayes with
Silence Detection Features Decision Tree with
Silence Detection Features
No
Talking Talking
No
Talking Talking
No Talking
451
67.1% 22
3.3%
438 65.2%
35 5.2%
Any
Tal
k
Talking 118
17.6% 81
12.1%
99 14.7%
100 14.9%
Accuracy: 79.2% Accuracy: 80.1%
Table 17 – Confusion matrices for silence detection estimates of the Any Talk
manually simulated sensor.
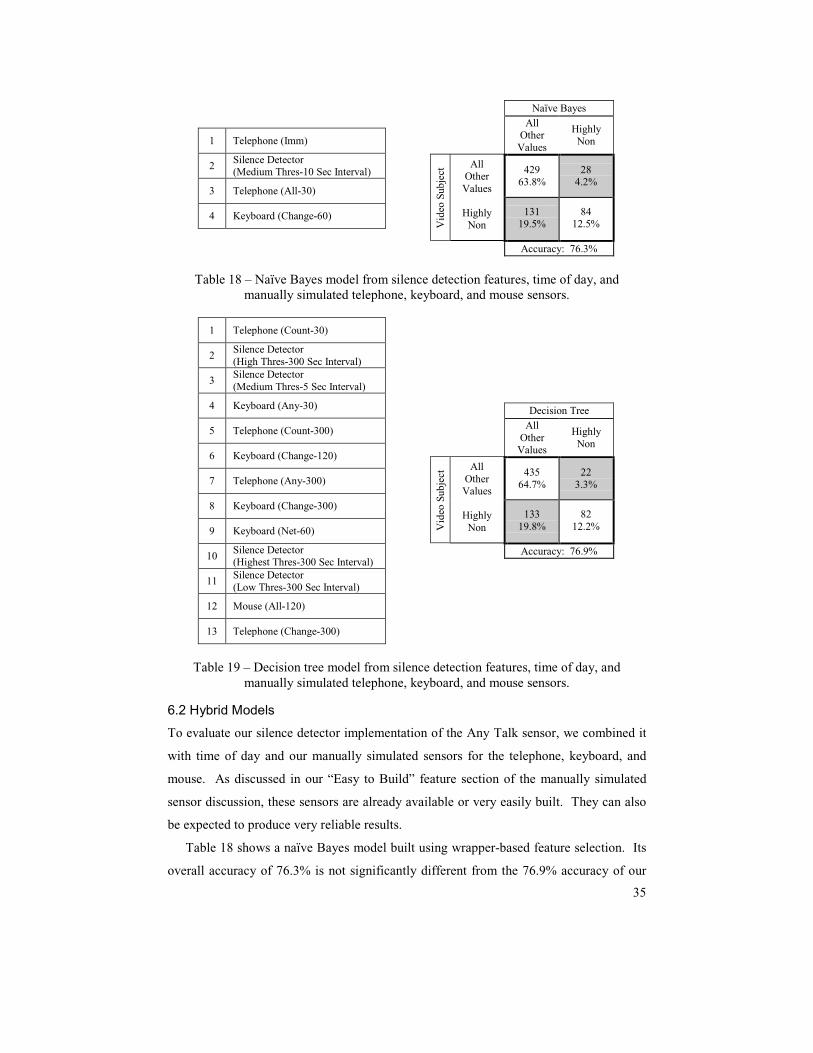
35
6.2 Hybrid Models
To evaluate our silence detector implementation of the Any Talk sensor, we combined it
with time of day and our manually simulated sensors for the telephone, keyboard, and
mouse. As discussed in our “Easy to Build” feature section of the manually simulated
sensor discussion, these sensors are already available or very easily built. They can also
be expected to produce very reliable results.
Table 18 shows a naïve Bayes model built using wrapper-based feature selection. Its
overall accuracy of 76.3% is not significantly different from the 76.9% accuracy of our
1 Telephone (Imm)
2 Silence Detector (Medium Thres-10 Sec Interval)
3 Telephone (All-30)
4 Keyboard (Change-60)
Naïve Bayes
All
Other Values
Highly Non
All Other Values
429 63.8%
28 4.2%
Vid
eo S
ubje
ct
Highly Non
131 19.5%
84 12.5%
Accuracy: 76.3%
Table 18 – Naïve Bayes model from silence detection features, time of day, and
manually simulated telephone, keyboard, and mouse sensors.
1 Telephone (Count-30)
2 Silence Detector (High Thres-300 Sec Interval)
3 Silence Detector (Medium Thres-5 Sec Interval)
4 Keyboard (Any-30)
5 Telephone (Count-300)
6 Keyboard (Change-120)
7 Telephone (Any-300)
8 Keyboard (Change-300)
9 Keyboard (Net-60)
10 Silence Detector (Highest Thres-300 Sec Interval)
11 Silence Detector (Low Thres-300 Sec Interval)
12 Mouse (All-120)
13 Telephone (Change-300)
Decision Tree
All
Other Values
Highly Non
All Other Values
435 64.7%
22 3.3%
Vid
eo S
ubje
ct
Highly Non
133 19.8%
82 12.2%
Accuracy: 76.9%
Table 19 – Decision tree model from silence detection features, time of day, and
manually simulated telephone, keyboard, and mouse sensors.
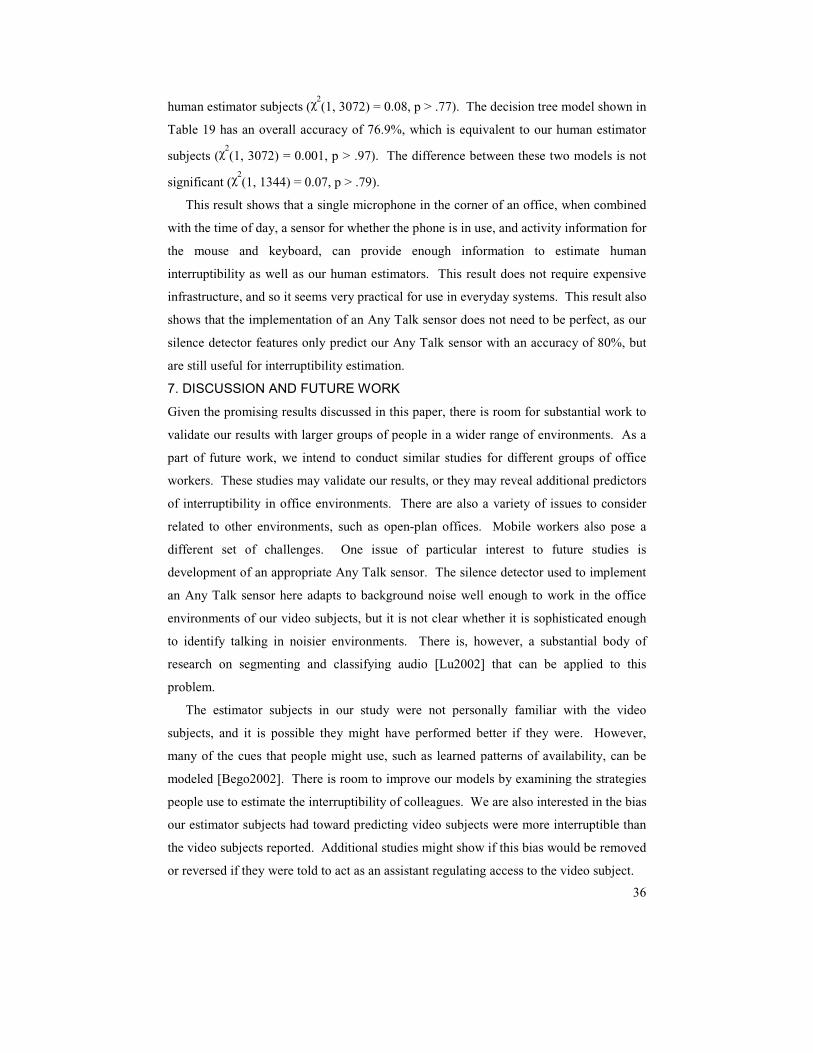
36
human estimator subjects (χ2(1, 3072) = 0.08, p > .77). The decision tree model shown in
Table 19 has an overall accuracy of 76.9%, which is equivalent to our human estimator
subjects (χ2(1, 3072) = 0.001, p > .97). The difference between these two models is not
significant (χ2(1, 1344) = 0.07, p > .79).
This result shows that a single microphone in the corner of an office, when combined
with the time of day, a sensor for whether the phone is in use, and activity information for
the mouse and keyboard, can provide enough information to estimate human
interruptibility as well as our human estimators. This result does not require expensive
infrastructure, and so it seems very practical for use in everyday systems. This result also
shows that the implementation of an Any Talk sensor does not need to be perfect, as our
silence detector features only predict our Any Talk sensor with an accuracy of 80%, but
are still useful for interruptibility estimation.
7. DISCUSSION AND FUTURE WORK
Given the promising results discussed in this paper, there is room for substantial work to
validate our results with larger groups of people in a wider range of environments. As a
part of future work, we intend to conduct similar studies for different groups of office
workers. These studies may validate our results, or they may reveal additional predictors
of interruptibility in office environments. There are also a variety of issues to consider
related to other environments, such as open-plan offices. Mobile workers also pose a
different set of challenges. One issue of particular interest to future studies is
development of an appropriate Any Talk sensor. The silence detector used to implement
an Any Talk sensor here adapts to background noise well enough to work in the office
environments of our video subjects, but it is not clear whether it is sophisticated enough
to identify talking in noisier environments. There is, however, a substantial body of
research on segmenting and classifying audio [Lu2002] that can be applied to this
problem.
The estimator subjects in our study were not personally familiar with the video
subjects, and it is possible they might have performed better if they were. However,
many of the cues that people might use, such as learned patterns of availability, can be
modeled [Bego2002]. There is room to improve our models by examining the strategies
people use to estimate the interruptibility of colleagues. We are also interested in the bias
our estimator subjects had toward predicting video subjects were more interruptible than
the video subjects reported. Additional studies might show if this bias would be removed
or reversed if they were told to act as an assistant regulating access to the video subject.

37
We intend to build systems that use the types of models presented in this paper.
Functional systems will allow us to continue to evaluate and improve upon these models,
including examining models that learn the individual nuances of people over time.
Building systems will also allow us to explore many issues related to application use of
these models. These issues include balancing the importance of a piece of information
with the cost of the interruption required to deliver it. We are also interested in estimates
of human interruptibility as one part of a multi-stage negotiation of interruption. There
are also a variety of issues to consider around using such models in awareness and
computer mediated communication applications.
We have presented studies that quantitatively demonstrate that models created from
simple sensors can estimate human interruptibility as well as our human estimator
subjects could when watching our recordings. Because anybody in a room talking is the
most predictive feature we examined, our models do not require complex sensors, such as
vision-based techniques, and can instead be built from a single microphone in an office
and very simple sensors for telephone, mouse, and keyboard activity. By using a passive
approach, instead of requiring people to explicitly indicate interruptibility or create and
maintain calendars, our approach makes interruptibility estimation feasible for use in
everyday systems. Used with models of the importance of potential interruptions and
system designs that support negotiated interruptions, our models offer the opportunity for
significant advances in human computer interaction.
ACKNOWLEDGMENTS
We would like to extend special thanks to Henry Schneiderman and Takeo Kanade for
making their face recognition software available for this project. We would like to thank
everybody who has contributed to Weka, the Intel Computer Vision Library, and to
Sphinx. We would like to acknowledge all the members of our Situationally Appropriate
Computing research group. We thank Darren Gergle and Ryan Baker for cheerfully
answering our statistical questions, though any mistakes should not be blamed on them.
We also thank Sonya Allin and David Tolliver for sharing their experiences with the Intel
Computer Vision Library and with video processing. We would like to acknowledge our
video coders: Ben Davies, Rick Ebert, Rucha Humnabadkar, Becky Kaplan, Matt
Mowczko, and Long Pan. This work was funded in part by DARPA, by the National
Science Foundation under Grants IIS-01215603, IIS-0205219, IIS-9980013 and by the
first author’s NSF Graduate Research Fellowship.
38
REFERENCES
[Adam1995] ADAMS, M.J., TENNEY, Y.J, AND PEW, R.W. 1995. Situation awareness and the cognitive management of complex systems. Human Factors, 37(1), 85-104.
[Bark1968] BARKER, R.G. 1968. Ecological Psychology. Stanford University Press.
[Bell2001] BELLOTTI, V. AND EDWARDS, K. 2001. Intelligibility and accountability: Human considerations in context-aware systems. Journal of Human-Computer Interaction, 16, 193-212.
[Bego2002] BEGOLE, J.B., TANG, J.C., SMITH, R.B., YANKELOVICH, N. 2002. Work rhythms: Analyzing visualizations of awareness histories of distributed groups. In Proceedings of the 2002 ACM Conference on Computer Supported Cooperative Work.
[Burg1998] BURGES, C.J.C. 1998. A tutorial on support vector machines for pattern recognition. Data Mining and Knowledge Discovery, 2(2), 121-167.
[Cutr2001] CUTRELL, E., CZERWINSKI, M., AND HORVITZ, E. 2001. Notification, disruption, and memory: Effects of messaging interruptions on memory and performance. In Proceedings of INTERACT’01.
[Czer2000a] CZERWINKSI, M., CUTRELL, E. AND HORVITZ, E. 2000. Instant messaging and interruption: Influence of task type on performance. In Proceedings of OZCHI 2000.
[Czer2000b] CZERWINSKI, M., CUTRELL, E., AND HORVITZ, E. 2000. Instant messaging: Effects of relevance and time. In Proceedings of HCI 2000.
[Dahl1993] DAHLBÄCK, N., JÖNSSON, A., AND AHRENBERG, L. 1993. Wizard of Oz Studies – Why and How. In Proceedings of Intelligent User Interfaces 1993.
[Duda1973] DUDA, R.O. AND HART, P.E. 1973. Pattern Classification and Scene Analysis. John Wiley and Sons.
[Eric2000] ERICKSON, T. AND KELLOGG, W.A. 2000. Social translucence: An approach to designing systems that mesh with social processes. Transactions of Computer-Human Interaction, 7(1), 59-83.
[Feld2001] FELDMAN-BARRETT, L. AND BARRETT, D.J. 2001. Computerized experience-sampling: How technology facilitates the study of conscious experience. Social Science Computer Review, 19, 175-185.
[Foga2001] FOGARTY, J., FORLIZZI, J., AND HUDSON, S.E. Aesthetic information collages: Generating decorative displays that contain information. In Proceedings of the 2001 ACM Symposium on User Interface Software and Technology.
[Freu1997] FREUND, Y. AND SCHAPIRE, R. 1997. A decision-theoretic generalization of on-line learning and an application to boosting. Journal of Computer and System Sciences, 55(1), 119-139.
[Gill1989] GILLIE, T. AND BROADBENT, D. 1989. What makes interruptions disruptive? A study of length, similarity, and complexity. Psychological Research, 50, 243-250.
[Goff1982] GOFFMANN, E. 1982. On Facework. In E. Goffman, Interaction Ritual (pp. 5-45), New York: Random House.
[Hess1994] HESS, S.M. AND DETWEILER, M. 1994. Training to reduce the disruptive effects of interruptions. In Proceedings of the HFES 38th Annual Meeting, v2, 1173-1177.
[Hall2000] HALL, M.A. 2000. Correlation-based feature selection for discrete and numeric class machine learning. In Proceedings of the 17th International Conference on Machine Learning.
[Hatc1987] HATCH, M.J. 1987. Physical barriers, task characteristics, and interaction activity in research and development firms. Administrative Science Quarterly, 32, 387-399.
[Hein1999] HEINER, J.M., HUDSON, S.E., TANAKA, K. 1999. The information percolator: Ambient information display in a decorative object. In Proceedings of the 1999 ACM Symposium on User Interface Software and Technology.
[Horv1999a] HORVITZ, E. 1999. Principles of mixed-initiative user interaces. In Proceedings of the 1999 SIGCHI Conference on Human Factors in Computing Systems.
[Horv1999b] HORVITZ, E., JACOBS, A., AND HOVEL, D. 1999. Attention-sensitive alerting. In Proceedings of UAI’99, Conference on Uncertainty and Artificial Intelligence.

39
[Horv1998] HORVITZ, E., BREESE, J., HECKERMAN, D., HOVEL, D. AND ROMMELSE, K. 1998. The Lumiere project: Bayesian user modeling for inferring the goals and needs of software users. In Proceedings of the Fourteenth Conference on Uncertainty in Artificial Intelligence.
[Huds2002] HUDSON, J.M., CHRISTENSEN, J., KELLOGG, W.A., AND ERIKSON, T. 2002. I’d be overwhelmed, but it’s just one more thing to do: Availability and interruption in research management. In Proceedings of the 2002 SIGCHI Conference on Human Factors in Computing Systems.
[Huds2003] HUDSON, S.E., FOGARTY, J., ATKESON, C.G., AVRAHAMI, D., FORLIZZI, J., KIESLER, S., LEE, J.C., AND YANG, J. Predicting human interruptibility with sensors: A wizard of oz feasibility study. In Proceedings of the 2003 SIGCHI Conference on Human Factors in Computing Systems.
[Inte2003] Open Source Computer Vision Library. Web Page: http://www.intel.com/research/mrl/research/opencv/
[Koha1997] KOHAVI, R. AND JOHN, G.H. 1997. Wrappers for feature subset selection. Artificial Intelligence, 97, 273-324.
[Lang1994] LANGLEY, P. AND SAGE, S. 1994. Induction of selected Bayesian classifiers. In Proceedings of the Tenth Conference on Uncertainty in Artificial Intelligence.
[Lu2002] LU, L., ZHANG, H., AND JIANG, H. 2002. Content Analysis for Audio Classification and Segmentation. IEEE Transactions on Speech and Audio Processing, 10(7), 504-516.
[Maul1993] MAULSBY, D., GREENBERG, S., AND MANDER, R. 1993. Prototyping an Intelligent Agent Through Wizard of Oz. In Proceedings of the 1993 SIGCHI Conference on Human Factors in Computing Systems.
[McFa1999] MCFARLANE, D.C. 1999. Coordinating the interruption of people in human-computer interaction. In Proceedings of INTERACT’99.
[Mile2000] MILEWSKI, A.E AND SMITH, T.M. 2000. Providing presence cues to telephone users. In Proceedings of the 2000 ACM Conference on Computer Supported Cooperative Work.
[Mitc1997] MITCHELL, T.M. 1997. Machine Learning. McGraw-Hill.
[Oliv2002] OLIVER, N., HORVITZ, E., AND GARG, A. 2002. Layered representations for recognizing office activity. In Proceedings of the Fourth IEEE International Conference on Multimodal Interaction (ICMI 2002).
[Perl1999] PERLOW, L.A. 1999. The time famine: Toward a sociology of work time. Administrative Science Quarterly, 44(1), 57-81.
[Quin1993] QUINLAN, J.R. 1993. C4.5: Programs for Machine Learning. Morgan Kaufmann.
[Reds2000] REDSTRÖM, J., SKOG, T., AND HALLNÄS, L. 2000. Informative art: Using amplified artworks as information displays. In Proceedings of Designing Augmented Reality Environments.
[Schm2000] SCHMIDT, A., TAKALUOMA, A., AND MÄNTYJÄRVI, J. 2000. Context-Aware Telephony over WAP. Personal Technologies, 4(4), 225-229.
[Schn2000a] SCHNEIDERMAN, H. AND KANADE, T. 2000. A statistical approach to 3D object detection applied to faces and cars. Doctoral Dissertation, Robotics Institute, Carnegie Mellon University.
[Schn2000a] SCHNEIDERMAN, H. AND KANADE, T. 2000. A statistical approach to 3D object detection applied to faces and cars. In Proceedings of the IEEE Conference on Computer Vision and Pattern Recognition.
[Sesh2001] SESHADRI, S. AND SHAPIRA, Z. 2001. Managerial allocation of time and effort: The effects of interruptions. Management Science, 47, 647-662.
[Sphi2003] CMU Sphinx: Open Source Speech Recognition. Web Page: http://www.speech.cs.cmu.edu/sphinx/
[Void2002] VOIDA, A., NEWSTETTER, W.C., AND MYNATT, E.D. 2002. When conventions collide: The tensions of instant messaging attributed. In Proceedings of the 2002 SIGCHI Conference on Human Factors in Computing Systems.
[Witt1999] WITTEN, I.H. AND FRANK, E. 1999. Data Mining: Practical Machine Learning Tools and Techniques with Java Implementations, Morgan Kaufmann.
[Zeig1927] ZEIGNARIC, B. 1927. Das behalten erledigter und unerledigter handlungern. Psychologische Forschung, 9, 1-85.