Embed Size (px)
Citation preview
ORE Open Research Exeter
TITLE
Predicting honeybee colony failure: using the BEEHAVE model to simulate colony responses topesticides
AUTHORS
Rumkee, Jack C.O.; Becher, MA; Thorbek, P; et al.
JOURNAL
Environmental Science and Technology
DEPOSITED IN ORE
03 November 2015
This version available at
https://ore.exeter.ac.uk/repository
COPYRIGHT AND REUSE
Open Research Exeter makes this work available in accordance with publisher policies.
A NOTE ON VERSIONS
The version presented here may differ from the published version. If citing, you are advised to consult the published version for pagination, volume/issue and date ofpublication
Predicting Honeybee Colony Failure: Using the BEEHAVE Model toSimulate Colony Responses to PesticidesJack C. O. Rumkee,† Matthias A. Becher,† Pernille Thorbek,‡ Peter J. Kennedy,† and Juliet L. Osborne*,†
†Environment and Sustainability Institute, University of Exeter, Penryn Campus, Penryn, Cornwall TR10 9FE, United Kingdom‡Syngenta, Environmental Safety, Jealott’s Hill International Research Centre, Bracknell, Berkshire RG42 6EY, United Kingdom
*S Supporting Information
ABSTRACT: To simulate effects of pesticides on differenthoneybee (Apis mellifera L.) life stages, we used the BEEHAVEmodel to explore how increased mortalities of larvae, in-hiveworkers, and foragers, as well as reduced egg-laying rate, couldimpact colony dynamics over multiple years. Stresses wereapplied for 30 days, both as multiples of the modeled controlmortality and as set percentage daily mortalities to assess thesensitivity of the modeled colony both to small fluctuations inmortality and periods of low to very high daily mortality. Thesestresses simulate stylized exposure of the different life stages tonectar and pollen contaminated with pesticide for 30 days.Increasing adult bee mortality had a much greater impact oncolony survival than mortality of bee larvae or reduction in egglaying rate. Importantly, the seasonal timing of the imposed mortality affected the magnitude of the impact at colony level. In linewith the LD50, we propose a new index of “lethal imposed stress”: the LIS50 which indicates the level of stress on individuals thatresults in 50% colony mortality. This (or any LISx) is a comparative index for exploring the effects of different stressors at colonylevel in model simulations. While colony failure is not an acceptable protection goal, this index could be used to inform thesetting of future regulatory protection goals.
■ INTRODUCTION
A number of stressors have been implicated in honeybee lossesin many parts of the world1, including habitat loss;2 viraldiseases;3 parasites such as Varroa destructor,4,5 which can be adisease vector;6−8 and use of pesticides.9 Because thesestressors may interact, it is difficult to predict how they changethe colony dynamics separately and in combination. Moreover,because of the many feedback mechanisms in honeybeecolonies, understanding the relationship between the effectson individuals and the colony level effects is not straight-forward. Ecological modeling enables us to disentangle theseinteractions and explore them both separately and incombination, in fully controlled simulations. An innate difficultyin studying the effect of pesticides on honeybee colonies is thelevel of replication needed to capture low-level effects at thefield scale.10 The European Food Safety Authority (EFSA) hasdescribed specific protection goals for honeybee colonies,stating, “The magnitude of effects on colonies should notexceed 7% reduction in colony size”.11 To assess whether thislevel of impact is occurring a minimum of 60 pairs (control andtreatment) of colonies and fields are needed for each study.11 Ifmultiple stressors are to be studied even higher numbers wouldbe needed. Ecological models can help in designing andtargeting empirical studies, generating specific hypotheses thatlater may be tested experimentally, and can be used to assessthe risk of environmental chemicals to honeybees.11
There have been many laboratory, semifield, and field studiesshowing both acute and chronic effects of pesticides on adulthoneybees12−19 and bee larvae.20 For example, pesticides havebeen shown to affect foraging via acute mortality,21 oralternatively from sublethal effects.22,18 Other effects, such asreduced learning acquisition,23 decreased rate of learning fromolfactory cues,24 and reduced communication for recruitmentto foraging25 have also been shown to occur, but the realism ofthese exposures is unclear.12 In this study, we will concentratemainly on hypothetical direct lethal effects on different lifestages and reduced egg laying rate that could result fromsublethal effects on the queen.26 This does not capture thecomplexity of real exposure events, but it is important tocompare the sensitivity of the colony to mortality of differentcohorts at different times of the year in a controlled way.As pesticides can affect individuals in a number of ways,
determining the colony level impact of an individual effect isdifficult. Feedback loops may compensate for moderate stresses(e.g., earlier onset of foraging if food stores are low27) orexacerbate other processes; for instance, less comprehensivecare of brood as a result of high in-hive worker mortalities. The
Received: July 28, 2015Revised: October 6, 2015Accepted: October 7, 2015Published: October 7, 2015
Article
pubs.acs.org/est
© 2015 American Chemical Society 12879 DOI: 10.1021/acs.est.5b03593Environ. Sci. Technol. 2015, 49, 12879−12887
This is an open access article published under a Creative Commons Attribution (CC-BY)License, which permits unrestricted use, distribution and reproduction in any medium,provided the author and source are cited.
BEEHAVE model28 is a suitable tool to investigate thiscomplexity because it integrates in-hive processes and foragingactivities to simulate interactions between colony and environ-ment. The model consists of four modules:28 (1) a landscapemodule, allowing the user to define a landscape of nectar andpollen in food patches; (2) a colony module, an age-basedcohort model including processes such as nursing and care ofbrood; (3) a foraging module, an individual-based model29
calculating the foraging activities on a particular day and thequantity of both nectar and pollen brought back into the hive;and (4) a Varroa and virus module simulating the populationdynamics of the varroa mite and the transmission of viruses.The large number of procedures and feedback loops allow acomprehensive view of the impacts of stressors on thehoneybee colony.30 Here, we report simulations using theBEEHAVE model28 to explore the colony-level impact ofaltering the mortality of a number of honeybee life-stages andreducing the egg-laying rate of the queen at different times ofthe year.Because such simulations enable the user to examine a whole
variety of stressors on individual bees, and the effects on thecolony, finding a standard way of comparing the responses ofthe colony would be useful in risk assessment. For environ-mental chemicals the LD50 is the standard index used todescribe the median lethal dose of a toxin i.e. that resulting in50% subject mortality.31 Here, we present an index to comparethe impact of different imposed stresses on colony survival, theLIS50, describing the “lethal imposed stress” level resulting in a50% colony mortality as predicted using the BEEHAVE model.We also present the LIS10, which predicts 10% colony failurefrom an imposed stress. We argue that these indices will beuseful for comparing the impact of imposed stressors at colonylevel and could also inform the setting of pesticide protectiongoals in the future, once the indices have been applied to awider variety of stressors and their variability has beenquantified.
■ METHODSModel Parametrization. The BEEHAVE model28 (BEE-
HAVE-Model Version 2014-03-04, free to download at www.beehave-model.net) was modified to increase the dailymortality of different life stages of bees in the colony from adefined day for a defined period to simulate potential effects ofan exposure event (where exposure is defined as the periodwhen toxic effects are imposed). We used the default setting asdescribed in Becher et al.,28 altering the landscape as explainedbelow. Modifications to the model for the treatments below areoutlined in the Supporting Information (Appendix 2).The simulations started from first January with 10 000
worker bees in a colony and ran for 3 years, and each year hadan identical annual weather cycle (based on maximal temper-ature and hours of sunlight at Rothamsted Research,Hertfordshire, U.K. in 2009). The colony was free from varroaand disease, as the purpose of the simulations was to look ateffects of singular events increasing mortality in isolation. Onthe last day of each year, if fewer than 4000 adult bees werepresent, the colony is assumed to die due to winter mortality.28
At the end of each three-year simulation the number of beesalive in the colony, or alternatively whether the colony hadfailed, was recorded.Landscape. BEEHAVE allows users to define a dynamic
landscape, giving values for the distance of each food patch tothe colony, and the nectar quantity (L), nectar quality (sucrose
concentration (mol/L)) and pollen quantity (kg) for each foodpatch on each day of the year. The simulations were set up in avery simplified and stylized modeled landscape: a single foodpatch was 1 km away from the hive offering 20 L of nectar and1 kg of pollen each day of the year (although not representingthe complexity of real landscapes, this enables tests of potential“exposure” in each month of the year in a controlled manner).
Imposed Stress. We ran simulations to contrast the effectsof five different imposed stresses: reduced egg laying rate(ELR) of the queen, increased daily larval mortality, increaseddaily in-hive worker mortality, and increased forager mortality,applied daily or applied on each foraging trip. In reality, anexposure event may affect a combination of life stages overvarying timeframes via different routes (nectar, pollen, honey,wax), but to specifically examine the sensitivity of different lifestages, we chose a simplified set of simulations: examiningincreased mortality of individual life stages, during singleexposure periods, when that exposure is assumed to be directvia consumption of nectar and pollen. We also ran thesimulations for one combination of daily life stage mortalities(larvae, in-hive workers, foragers). Pupal mortality was nottested, as the pupae are in capped cells and do not receive foodand therefore are unlikely to be exposed directly via nectar andpollen. In each simulation, a single stressor was applied for acontinuous 30 day period each year. Duration of bloom ofdifferent crops differ widely as do persistence of differentpesticides, but we here chose a 30 day exposure period astypical. Timing-dependent effects were investigated by runningscenarios with the 30 day exposure period beginning on thefirst day of each month of the year. Imposed mortalities wereapplied as both multiples of the control value in the model andas set percent daily mortalities, while reduced egg-laying ratewas only applied as a percent reduction. Testing a multiple ofthe control reflects the typical procedure of pesticide riskassessments.11 We also ran simulations with set percent dailymortalities to determine the actual percentage of increasedmortality that the colony could withstand.
Egg-Laying Rate. The daily egg-laying rate varies seasonallydepending on the day of the year (for distribution, see Becheret al.28), and eggs are lost at a rate of ∼3% per day by default.28
For the simulations, the egg laying rate (number of eggsproduced on a particular day) was reduced by 25, 50, 75, and90% for a period of 30 days with zero reduction applied as acontrol.
Stage-Specific Daily Mortalities. The daily mortalities of thelarvae, in-hive workers, and foragers were altered in two ways:(1) Control daily background mortality was multiplied by afactor of 1, 1.5, 2, or 3. (2) Daily background mortality was setto a set percentage during the treatment period: one of 1, 5, 10,25, and 50% each day.The control daily background mortality is typically low:
∼0.4% for the in-hive workers28 and foragers and ∼1% for thelarvae.28 For the larvae, this mortality does not include thechance of dying from lack of food or brood care.
Forager Mortality During A Foraging Trip. Increasedforaging trip mortality was simulated in two ways, similar tothe stage-specific daily mortality simulations: (1) control valuewas multiplied by 1 (control), 1.5, 2 or 3; and (2) set values of1, 2.5, 5, 7.5, and 10% mortality per trip. Lower values than forthe daily mortalities were used because foragers take multipletrips on a single day, so the majority of foragers may die if aforager had a 25 or 50% chance of dying on each trip, reducingthe impact of higher mortalities as each bee can only die once.
Environmental Science & Technology Article
DOI: 10.1021/acs.est.5b03593Environ. Sci. Technol. 2015, 49, 12879−12887
12880
These settings were used to simulate pesticide exposure atlevels high enough to cause death in the foragers through eitherimmediate acute mortality, gradual weakening during the returnflight, or through behavioral changes leading to impairedorientation and consequent homing failure.18 Foraging mortal-ity in the model depends on the duration of a foraging trip andis applied before an individual forager returns to the colony. Forthe single food patch present in the simulations, the mortality is∼1.5% for nectar foragers and ∼0.9% for pollen foragers undercontrol conditions (values taken from BEEHAVE model duringcontrol simulations). Although these values can vary during aday (as handling time of a food patch is increased when thepatch is depleted), enough nectar and pollen are provided atthe patch that this variation is negligible.Simultaneous Daily Mortality of Larvae, In-Hive Workers
and Foragers. To simulate an event in which several life stagesare affected, the mortality of each of the larvae, in-hive workers,and foragers were all modified simultaneously in two ways: (1)Control daily background mortalities of larvae, in-hive bees andforagers were multiplied by a factor of 1, 1.5, 2, or 3. (2) Dailybackground mortalities of larvae, in-hive bees, and foragerswere set to a set percentage during the treatment period: one of1, 5, 10, 25, and 50% each day.While it is unrealistic that different life stages are affected
with identical effect levels, this scenario demonstrated thecolony’s sensitivity to multiple effect types.
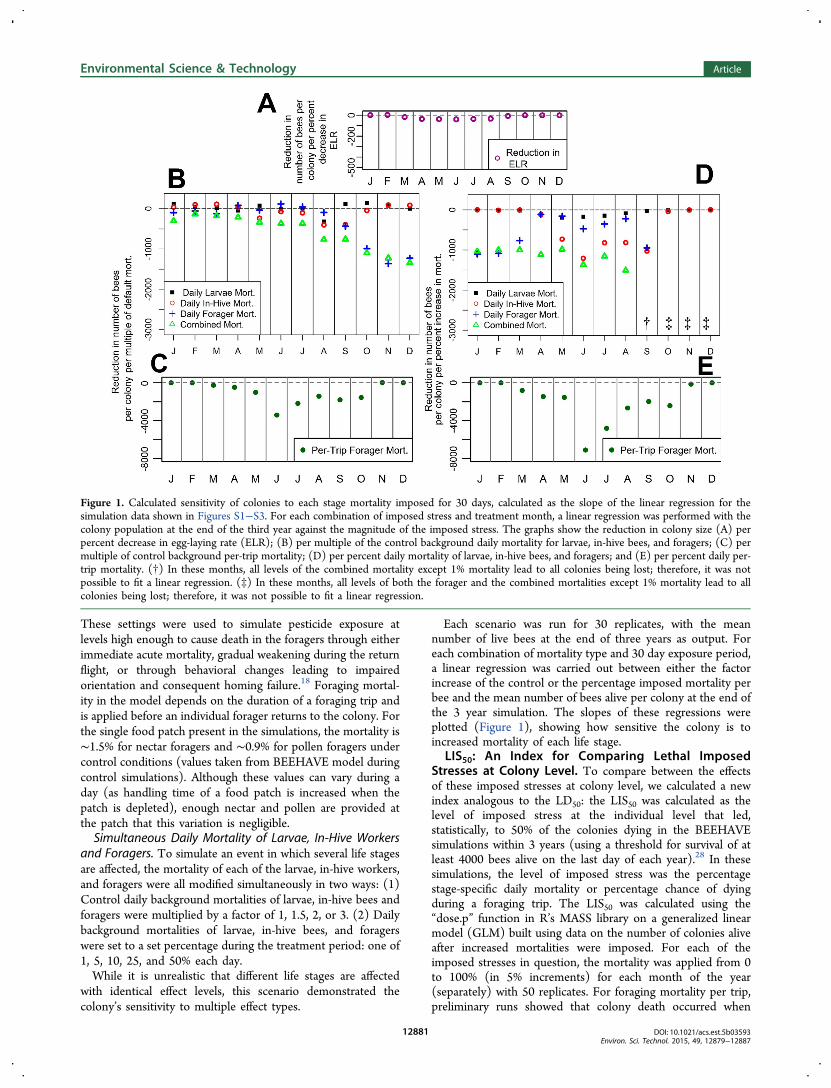
Each scenario was run for 30 replicates, with the meannumber of live bees at the end of three years as output. Foreach combination of mortality type and 30 day exposure period,a linear regression was carried out between either the factorincrease of the control or the percentage imposed mortality perbee and the mean number of bees alive per colony at the end ofthe 3 year simulation. The slopes of these regressions wereplotted (Figure 1), showing how sensitive the colony is toincreased mortality of each life stage.
LIS50: An Index for Comparing Lethal ImposedStresses at Colony Level. To compare between the effectsof these imposed stresses at colony level, we calculated a newindex analogous to the LD50: the LIS50 was calculated as thelevel of imposed stress at the individual level that led,statistically, to 50% of the colonies dying in the BEEHAVEsimulations within 3 years (using a threshold for survival of atleast 4000 bees alive on the last day of each year).28 In thesesimulations, the level of imposed stress was the percentagestage-specific daily mortality or percentage chance of dyingduring a foraging trip. The LIS50 was calculated using the“dose.p” function in R’s MASS library on a generalized linearmodel (GLM) built using data on the number of colonies aliveafter increased mortalities were imposed. For each of theimposed stresses in question, the mortality was applied from 0to 100% (in 5% increments) for each month of the year(separately) with 50 replicates. For foraging mortality per trip,preliminary runs showed that colony death occurred when
Figure 1. Calculated sensitivity of colonies to each stage mortality imposed for 30 days, calculated as the slope of the linear regression for thesimulation data shown in Figures S1−S3. For each combination of imposed stress and treatment month, a linear regression was performed with thecolony population at the end of the third year against the magnitude of the imposed stress. The graphs show the reduction in colony size (A) perpercent decrease in egg-laying rate (ELR); (B) per multiple of the control background daily mortality for larvae, in-hive bees, and foragers; (C) permultiple of control background per-trip mortality; (D) per percent daily mortality of larvae, in-hive bees, and foragers; and (E) per percent daily per-trip mortality. (†) In these months, all levels of the combined mortality except 1% mortality lead to all colonies being lost; therefore, it was notpossible to fit a linear regression. (‡) In these months, all levels of both the forager and the combined mortalities except 1% mortality lead to allcolonies being lost; therefore, it was not possible to fit a linear regression.
Environmental Science & Technology Article
DOI: 10.1021/acs.est.5b03593Environ. Sci. Technol. 2015, 49, 12879−12887
12881
foraging mortality was 40% for all tested months, so highermortalities were not tested.The LIS50 was chosen for its theoretical parallel to the LD50,
but a LISx could be calculated for any percentage of colonyfailure (x) that is of interest, for example, LIS10 figures are alsopresented, predicting the level of stress resulting in 10% colonydeaths.
■ RESULTSReducing Egg-Laying Rate (ELR). Reducing the ELR for
30 days had only a moderate impact with none of the coloniesdying in any of the simulations (Figure S1). A reduction of thedaily egg laying rate by 90% (i.e., to 10% of the control) in Juneled to the average colony size at the end of three years beingreduced by 35% of the initial population (Figure S1). BetweenApril and August, each percent reduction in ELR led to only 50fewer bees per colony after three years (Figure 1A).Nevertheless, colony dynamics were affected to varying degreesdepending on the season and the reduction in the egg layingrate (Figure S1).Effect of Increasing Mortality As Multiple of the
Control. The colony was not highly sensitive to an increase indaily mortality of the larvae or the in-hive workers within thetested range (Figure 1B; Figure S2A,B). For the larvae, thecontrol background mortality was already low (∼1%) and themajority of larvae that died in the control simulations did sofrom a lack of resources (food or brood care). Therefore, smalllarval losses from increased background mortality could becompensated in the model by allowing resources to be spreadamong remaining larvae, reducing mortality from a lack of theseresources. As with background larval mortality, the controlvalue of daily in-hive worker mortality in the model is small(∼0.4%), such that trebling it equates to 1.2% daily mortalityand does not result in large losses over the course of the month.The impact of increasing the control daily forager mortality waslow when imposed in January to August, but the colony wassensitive to increased mortality imposed in September toDecember (Figure 1B; Figure S2C). The critical threshold forcolony survival in the BEEHAVE model was applied on the lastday of December; therefore the colony had the whole year torecover from increased individual mortality applied in January,before winter survival was calculated. When the increasedforaging mortality was applied to foragers at the food patch oneach successful foraging trip, the impact on the colony wasmuch larger (colony reduced down to almost 4,000 bees inJune) (Figure 1C; Figure S2 D), as the mortality was appliedmany times per day and background mortality is higher than forin-hive life stages. This impact on the colony was likely due tothe decreased food stores in the colony. These effects wereparticularly strong if the stress was imposed during the summermonths when foragers were making the most foraging trips. Forsimulations multiplying the stage specific control mortalities,per-trip foraging mortality was the only single imposed stress tolead to colony failure with 3x mortality in June leading to 77%colony survival. When the mortality of larvae, in-hive workersand foragers were applied simultaneously as a multiple of thecontrol mortalities, the impact on the colony was similar to theworst case equivalent single mortality (Figure 1B, Figure S4),the single life-stage daily mortality to which the colony is mostsensitive when applied as a multiple of default.Effect of Increasing Mortality by Set Percentage. The
largest impact on the colony from larval mortality came whenthe effect was applied in one of the months between April and
August (Figure 1D,E; Figure S3A). During this period, thecolony has a lot of larvae as it is building to peak numbers, andincreased mortality reduced or delayed this peak (Figure S5).Very high larval mortality in May and June led to the colonypopulation being reduced to between 2000 and 3000individuals, and winter mortality was high (Figure S3A).When larval mortality was increased (illustrated in Figure S5 fora level of 25% daily mortality), the resulting loss of larvalnumbers had the effect of reducing deaths due to lack of foodor care during the treatment period, as these became morereadily available for the surviving larvae. This feedback allowedthe colony to compensate for moderate increases in larvalmortality. However, high larval mortalities during summer ledto a reduction in the worker population, which in turn led to afurther peak in larval mortality 1 week after the end of thetreatment period (Figure S5).The modeled colony was sensitive to losses of adult bees in
most months (Figure 1D,E; Figures S3B−D, S6, and S7). Withrespect to daily mortalities, the colony was more sensitive tolosses of the younger in-hive workers than to the older foragers.During the period of April−September, the same period inwhich brood mortalities had a noticeable impact (Figure 1D;Figure S3), a daily in-hive worker mortality of over 25% led toall colonies being lost between May and July (Table S2) and a5% daily mortality led to up to 40 000 more in-hive workerdeaths over the course of the month (Figure S7). Loss of in-hive bees led to a large increase in brood loss from lack of careor food over the rest of the year (Figure S6C) and reduced thehoney stores in the hive (Figure S6E). This combined stresswas very damaging to the colony. Outside spring and summer,high daily forager mortality was devastating to the colony(Figure 1D; Figure S3C). This is because during the autumnand winter only few eggs are laid, so, the colony consistsprimarily of older bees still termed “foragers” (even thoughthey rarely exited the colony).The results of these simulations also highlighted the potential
sensitivity of the colony to patch-specific forager mortalities,experienced on each foraging trip (Figure 1E). There was littleeffect at the very beginning or end of the year due to the lack offoraging activity at these times. Between May and October,there was a large impact on the colony from increasing thisforaging mortality (June was the most sensitive month, as therewas more time to forage in June than other months). A 5%mortality at the food patch applied in June led to an averagecolony size of ∼1000 bees at the end of the 3rd year (FigureS3D) with only 5 of 30 replicate colonies surviving (17% TableS2).When the mortalities were applied as a set percent to several
life stages simultaneously, this had a consistently higher impactthan the worst case individual daily life stage mortality in eachparticular month (forager mortality in winter and in-hivemortality in summer) (Figure 1D). When colonies weresubjected to combined daily mortalities of over 10% at any timeof the year, then no colonies survived (Table S2).
LIS50: An Index for Comparing the Lethality ofDifferent Stressors on Colonies. The LIS50 values representthe statistical likelihood that a certain imposed stress will leadto 50% colony failure for the specific control conditions used inthe model (in this case calculated after 3 years). Withagreement on appropriate control settings, the LIS50 could bestandardized for use over any number of months or years,depending on the sensitivity required.
Environmental Science & Technology Article
DOI: 10.1021/acs.est.5b03593Environ. Sci. Technol. 2015, 49, 12879−12887
12882
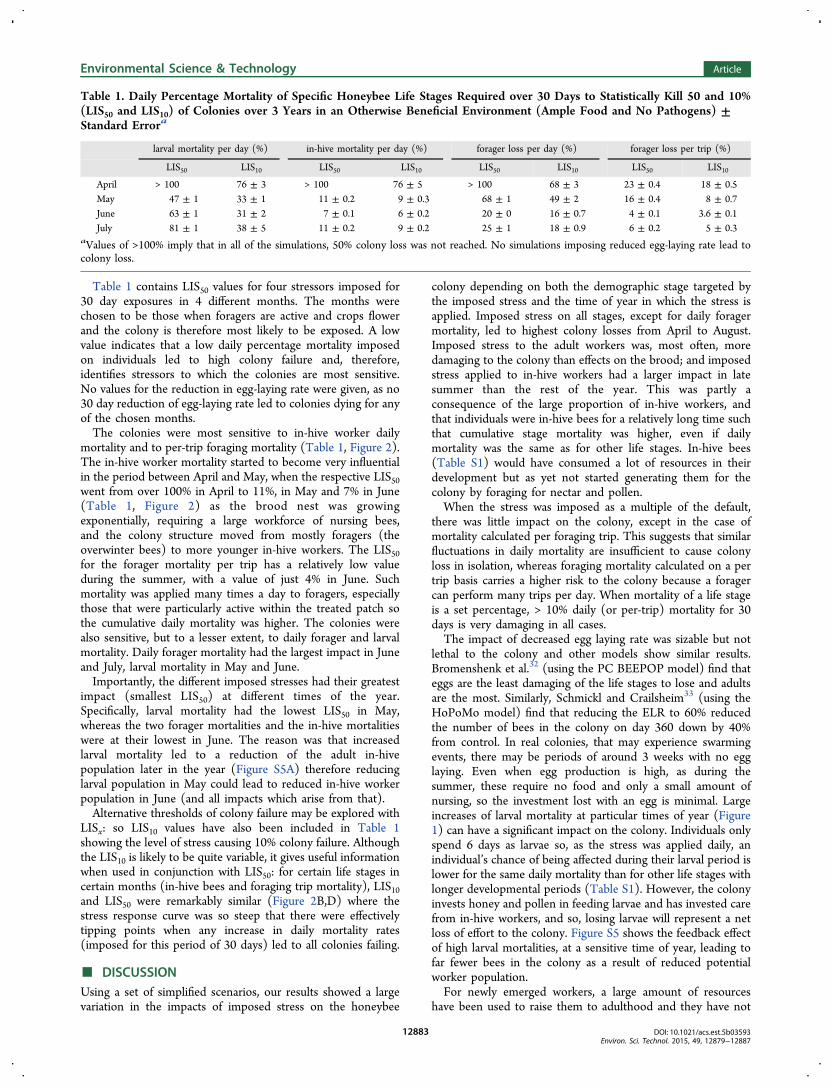
Table 1 contains LIS50 values for four stressors imposed for30 day exposures in 4 different months. The months werechosen to be those when foragers are active and crops flowerand the colony is therefore most likely to be exposed. A lowvalue indicates that a low daily percentage mortality imposedon individuals led to high colony failure and, therefore,identifies stressors to which the colonies are most sensitive.No values for the reduction in egg-laying rate were given, as no30 day reduction of egg-laying rate led to colonies dying for anyof the chosen months.The colonies were most sensitive to in-hive worker daily
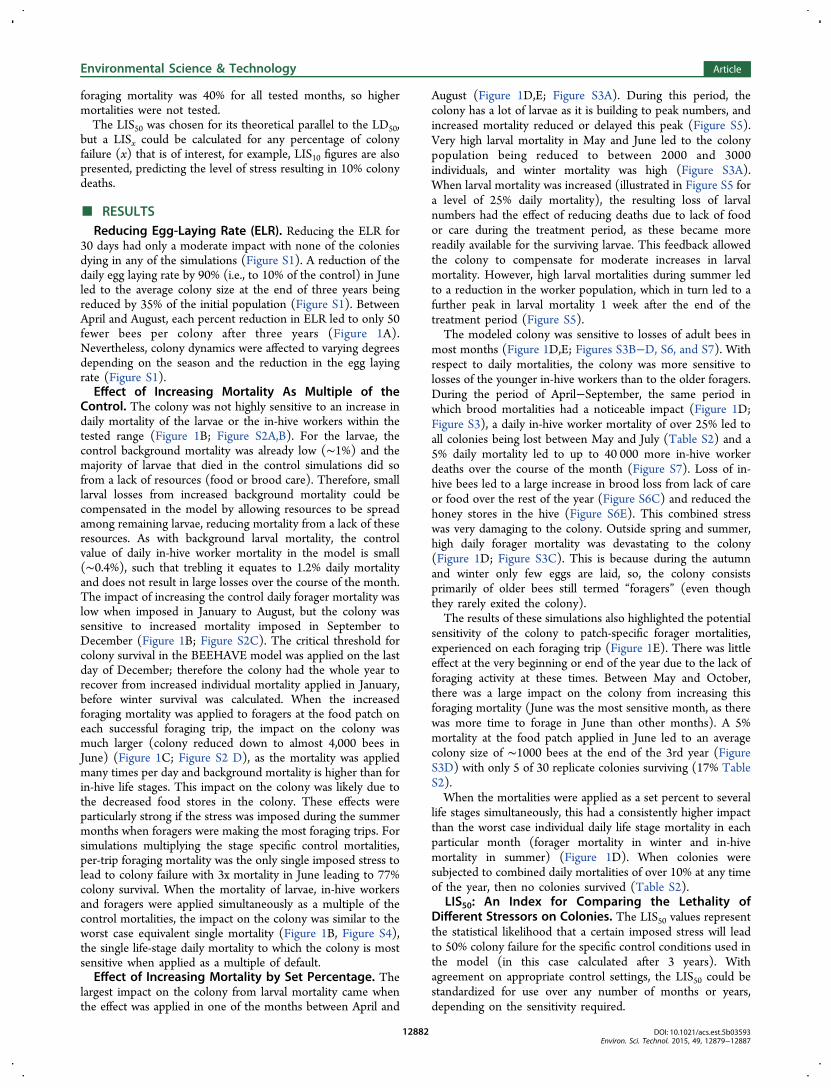
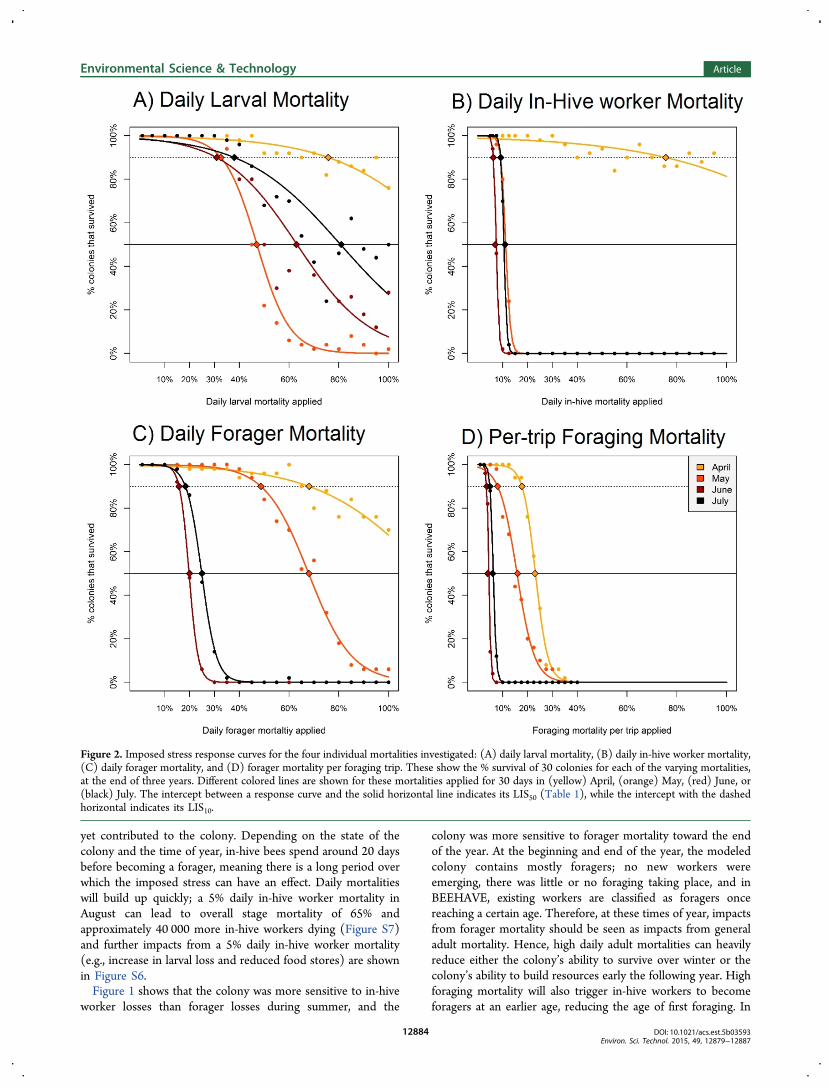
mortality and to per-trip foraging mortality (Table 1, Figure 2).The in-hive worker mortality started to become very influentialin the period between April and May, when the respective LIS50went from over 100% in April to 11%, in May and 7% in June(Table 1, Figure 2) as the brood nest was growingexponentially, requiring a large workforce of nursing bees,and the colony structure moved from mostly foragers (theoverwinter bees) to more younger in-hive workers. The LIS50for the forager mortality per trip has a relatively low valueduring the summer, with a value of just 4% in June. Suchmortality was applied many times a day to foragers, especiallythose that were particularly active within the treated patch sothe cumulative daily mortality was higher. The colonies werealso sensitive, but to a lesser extent, to daily forager and larvalmortality. Daily forager mortality had the largest impact in Juneand July, larval mortality in May and June.Importantly, the different imposed stresses had their greatest
impact (smallest LIS50) at different times of the year.Specifically, larval mortality had the lowest LIS50 in May,whereas the two forager mortalities and the in-hive mortalitieswere at their lowest in June. The reason was that increasedlarval mortality led to a reduction of the adult in-hivepopulation later in the year (Figure S5A) therefore reducinglarval population in May could lead to reduced in-hive workerpopulation in June (and all impacts which arise from that).Alternative thresholds of colony failure may be explored with
LISx: so LIS10 values have also been included in Table 1showing the level of stress causing 10% colony failure. Althoughthe LIS10 is likely to be quite variable, it gives useful informationwhen used in conjunction with LIS50: for certain life stages incertain months (in-hive bees and foraging trip mortality), LIS10and LIS50 were remarkably similar (Figure 2B,D) where thestress response curve was so steep that there were effectivelytipping points when any increase in daily mortality rates(imposed for this period of 30 days) led to all colonies failing.
■ DISCUSSIONUsing a set of simplified scenarios, our results showed a largevariation in the impacts of imposed stress on the honeybee
colony depending on both the demographic stage targeted bythe imposed stress and the time of year in which the stress isapplied. Imposed stress on all stages, except for daily foragermortality, led to highest colony losses from April to August.Imposed stress to the adult workers was, most often, moredamaging to the colony than effects on the brood; and imposedstress applied to in-hive workers had a larger impact in latesummer than the rest of the year. This was partly aconsequence of the large proportion of in-hive workers, andthat individuals were in-hive bees for a relatively long time suchthat cumulative stage mortality was higher, even if dailymortality was the same as for other life stages. In-hive bees(Table S1) would have consumed a lot of resources in theirdevelopment but as yet not started generating them for thecolony by foraging for nectar and pollen.When the stress was imposed as a multiple of the default,
there was little impact on the colony, except in the case ofmortality calculated per foraging trip. This suggests that similarfluctuations in daily mortality are insufficient to cause colonyloss in isolation, whereas foraging mortality calculated on a pertrip basis carries a higher risk to the colony because a foragercan perform many trips per day. When mortality of a life stageis a set percentage, > 10% daily (or per-trip) mortality for 30days is very damaging in all cases.The impact of decreased egg laying rate was sizable but not
lethal to the colony and other models show similar results.Bromenshenk et al.32 (using the PC BEEPOP model) find thateggs are the least damaging of the life stages to lose and adultsare the most. Similarly, Schmickl and Crailsheim33 (using theHoPoMo model) find that reducing the ELR to 60% reducedthe number of bees in the colony on day 360 down by 40%from control. In real colonies, that may experience swarmingevents, there may be periods of around 3 weeks with no egglaying. Even when egg production is high, as during thesummer, these require no food and only a small amount ofnursing, so the investment lost with an egg is minimal. Largeincreases of larval mortality at particular times of year (Figure1) can have a significant impact on the colony. Individuals onlyspend 6 days as larvae so, as the stress was applied daily, anindividual’s chance of being affected during their larval period islower for the same daily mortality than for other life stages withlonger developmental periods (Table S1). However, the colonyinvests honey and pollen in feeding larvae and has invested carefrom in-hive workers, and so, losing larvae will represent a netloss of effort to the colony. Figure S5 shows the feedback effectof high larval mortalities, at a sensitive time of year, leading tofar fewer bees in the colony as a result of reduced potentialworker population.For newly emerged workers, a large amount of resources
have been used to raise them to adulthood and they have not
Table 1. Daily Percentage Mortality of Specific Honeybee Life Stages Required over 30 Days to Statistically Kill 50 and 10%(LIS50 and LIS10) of Colonies over 3 Years in an Otherwise Beneficial Environment (Ample Food and No Pathogens) ±Standard Errora
larval mortality per day (%) in-hive mortality per day (%) forager loss per day (%) forager loss per trip (%)
LIS50 LIS10 LIS50 LIS10 LIS50 LIS10 LIS50 LIS10
April > 100 76 ± 3 > 100 76 ± 5 > 100 68 ± 3 23 ± 0.4 18 ± 0.5May 47 ± 1 33 ± 1 11 ± 0.2 9 ± 0.3 68 ± 1 49 ± 2 16 ± 0.4 8 ± 0.7June 63 ± 1 31 ± 2 7 ± 0.1 6 ± 0.2 20 ± 0 16 ± 0.7 4 ± 0.1 3.6 ± 0.1July 81 ± 1 38 ± 5 11 ± 0.2 9 ± 0.2 25 ± 1 18 ± 0.9 6 ± 0.2 5 ± 0.3
aValues of >100% imply that in all of the simulations, 50% colony loss was not reached. No simulations imposing reduced egg-laying rate lead tocolony loss.
Environmental Science & Technology Article
DOI: 10.1021/acs.est.5b03593Environ. Sci. Technol. 2015, 49, 12879−12887
12883
yet contributed to the colony. Depending on the state of thecolony and the time of year, in-hive bees spend around 20 daysbefore becoming a forager, meaning there is a long period overwhich the imposed stress can have an effect. Daily mortalitieswill build up quickly; a 5% daily in-hive worker mortality inAugust can lead to overall stage mortality of 65% andapproximately 40 000 more in-hive workers dying (Figure S7)and further impacts from a 5% daily in-hive worker mortality(e.g., increase in larval loss and reduced food stores) are shownin Figure S6.Figure 1 shows that the colony was more sensitive to in-hive
worker losses than forager losses during summer, and the
colony was more sensitive to forager mortality toward the endof the year. At the beginning and end of the year, the modeledcolony contains mostly foragers; no new workers wereemerging, there was little or no foraging taking place, and inBEEHAVE, existing workers are classified as foragers oncereaching a certain age. Therefore, at these times of year, impactsfrom forager mortality should be seen as impacts from generaladult mortality. Hence, high daily adult mortalities can heavilyreduce either the colony’s ability to survive over winter or thecolony’s ability to build resources early the following year. Highforaging mortality will also trigger in-hive workers to becomeforagers at an earlier age, reducing the age of first foraging. In
Figure 2. Imposed stress response curves for the four individual mortalities investigated: (A) daily larval mortality, (B) daily in-hive worker mortality,(C) daily forager mortality, and (D) forager mortality per foraging trip. These show the % survival of 30 colonies for each of the varying mortalities,at the end of three years. Different colored lines are shown for these mortalities applied for 30 days in (yellow) April, (orange) May, (red) June, or(black) July. The intercept between a response curve and the solid horizontal line indicates its LIS50 (Table 1), while the intercept with the dashedhorizontal indicates its LIS10.
Environmental Science & Technology Article
DOI: 10.1021/acs.est.5b03593Environ. Sci. Technol. 2015, 49, 12879−12887
12884
reality, such precocious foragers may not be as successful asolder foragers, resulting in further stress to the colony.36
The colony is very sensitive to high percentages of thiscombined mortality throughout the year (Figure 1D) but, inmany months, not much more sensitive than the worst-casedaily life-stage mortality at any one time period. An explanationcould be that the loss of certain life stages can lead to the loss ofother life stages, and hence, removing, for example, both in-hivebees and larvae will not necessarily cause more damage thanonly removing in-hive bees, as the larvae would have diedanyway due to a lack of brood care. At many time points in theyear, there is one life stage in the model that the colony ishighly sensitive to losing, but at other times, the colony is moresensitive to losing multiple life stages (e.g., April andSeptember), and these dynamics need further investigation.Setting the BEEHAVE Simulations in the Context of
Empirical Evidence. The set of simulations described hereuse a precisely defined exposure period, effects on single lifestages, and a stylized landscape. In reality, the heterogeneity ofthe cropped landscape over time and space and the relativetoxicity and persistence of different pesticides in the landscape,and in the hive, may lead to a diverse range of sublethal andlethal impacts on individual bees at different life stages. Thenext steps in using BEEHAVE to examine more realisticscenarios will involve using detailed empirical evidence tocapture those exposure routes and timeframes, for specificchemicals in precise locations, and a specific module for this isin development. There are many empirical studies showing howstressors affect individuals or, in some cases, the colony in theshort term. Long-term, multiyear studies are available,19,34 yetuncommon,17 so the impact of imposed stresses over multipleyears is not fully understood.17 Sandrock et al.14 find that 1.5month exposure to two neonicotinoid insecticides throughpollen patties starting in May leads to a 28% reduction inworker population in the following April, along with effects onbrood size and food stores. Dively et al.19 also find effects oncolony strength and overwintering success after 12 weeks(May−August) exposure to diet patties with high (20−100ppb) levels of imidacloprid. In contrast, three studies ofhoneybee colony growth and survival in the field, when exposedvia natural foraging on flowering crops treated withneonicotinoids, have shown no significant impact of thepesticide exposure on the colonies (for clothianidin16,35 andfor thiamethoxam34). Carreck and Ratnieks12 suggest that thelevels of pesticide encountered by foraging honeybees are lowerin the field than used in many lab experiments. In large-scalefield studies, in which the bees are placed near treated crops toforage16,34,35 the bees may have lower and more variablepesticide exposure than in studies where bees are fed with anartificial feed, with pesticide added at “field realistic”levels14,18,19 and this may explain why the former studiesoften find less damaging effects. In addition field studiesoffering the colony a known amount of pesticide (such asSandrock et al.14 and Dively et al.19) find that the impact uponthe hive from the pesticide can appear sometime after exposure.The simulations presented here show how this can occur withinthe model: Figure S5B shows how the number of larvae in thecolony is affected by a 25% larval mortality in June. It is clearthat there is an additional delayed impact likely due to areduction in workers providing brood care.These contrasts also highlight the difficulties of scaling from
individual level effects to those at the colony level. TheBEEHAVE model contains a large number of feedback loops,
allowing in-depth investigation into how multiple stressors candisturb the colony dynamics in terms of mechanism, and whichparticular stresses are more damaging to the homeostasis of thecolony. For example, with high forager mortality, worker beesbecome foragers earlier to compensate; this in turn may reducethe nursing force, increasing larval mortality.36 A small increasein larval mortality can reduce the mortality of the survivinglarvae from other causes such as lack of food or brood care, andreduces further losses, i.e. show a compensatory effect (FigureS6).
How do BEEHAVE Simulations Compare to Those ofOther Models? The BEEHAVE model is a useful tool in therisk assessment of stressors to bees as many potential stressorscan be assessed simultaneously, and testable hypotheses can bedeveloped. Indeed EFSA have recently published a review tosuggest, with further development, BEEHAVE could be themodel of choice for regulatory pesticide risk assessment.37
Several models32,38,39 have been used to explore the impact ofpesticides on bee colonies. However, the models of Khoury etal.38 and Bryden et al.39 focus on limited portions of colonydynamics, and lack key processes required to accurately predicthow a bee colony reacts to numerous stressors. One majorfeature lacking in these models is seasonality. We have shownthat the time at which a stress is applied greatly affects thecolonies’ response. A stress imposed in April has little effect,while the same stress imposed in June will devastate the colony.PCBEEPOP32 is a model that includes colony dynamics similarto BEEHAVE; although, BEEHAVE also includes a number offactors, such as the landscape and foraging dynamics (includingthe flow of energy in the form of honey stores) integrated withthe colony module, which may be key to understanding howpesticides can impact the colony.30 The BEEHAVE model isthe only tool to date that also includes a dynamic landscapemodule and weather providing the potential for climate orlocation-specific simulations, as well as integration with theforaging and varroa and virus modules, to apply many stressorsto the colony at any one time, as would be happening to realcolonies in the field. Further development of BEEHAVE, with a“pesticide module”, to ensure correct implementation ofexposure routes from flower, via forager, into the colony isunderway.
Can Such Simulations Be Used in Future RiskAssessment? To quantify the impact of a pesticide on ahive, the EFSA guidance11 classifies the magnitude of an effectby the % change in colony size. EFSA considers a changebetween 3.5 and 7% negligible; and a change larger than 35% tobe large. EFSA use the Khoury et al. 2011 model to estimatewhat forager loss would be permissible for “negligible” changeand find that forager losses of 1.5 × control for 6 days; or 2 ×control for 3 days or 3 × control for 2 days would bepermissible. We have shown that effects on fecundity or broodmortality are not as impactful on the colony as adult loss, soworker loss is a conservative measure of the damage possiblefrom a pesticide to the colony. The modeled colony has acertain capacity for compensation, which varies with the lifestage affected and time of year and durations, but once thecompensation threshold is exceeded the colony is likely to fail.Levels of “background” mortality in the absence of pesticideexposure, depending on weather, forage quality and otherstressors present, are likely to influence compensation capacity.Due to this compensation capacity and how it may vary withthe health of the colony, a percent reduction of bees in thecolony could have highly variable results on the health of the
Environmental Science & Technology Article
DOI: 10.1021/acs.est.5b03593Environ. Sci. Technol. 2015, 49, 12879−12887
12885
colony. Modeling, such as with BEEHAVE, could, therefore,help supplement the risk assessment procedure by teasing apartsuch dynamics.LIS50 and LIS10 provide a tool to compare the effects of a
variety of imposed stresses on the colony using BEEHAVE,treating the colony as an individual “super” organism by usingthe percent chance of colony mortality as a measure ofsensitivity to imposed stress. Colony failure as a result of anintroduced chemical is not an acceptable end point, but theseindices (calculated from simulations) could be used to providetheoretical comparisons of the effects of different stressors onthe colony, which may be informative in discussions of futureregulatory risk assessment procedures, and protection goals.This study was designed with impacts of pesticides in mind, butimpacts on the colony driven by Varroa destructor, relateddiseases, Nosema sp. or lack of forage sources could also becompared with LISx. Also, comparing LIS10 and LIS50 provideshypothetical evidence of which stressors, at which levels, maylead to colony tipping points, with the caveat that the tippingpoint will depend on the control scenario (e.g., forageavailability and weather will all affect the colony’s capacity forcompensation). The BEEHAVE model, together with the useof LIS50, allows consistent investigation into the impact ofmultiple stressors on the honeybee colony, and could be key forfuture risk evaluation.
■ ASSOCIATED CONTENT*S Supporting InformationThe Supporting Information is available free of charge on theACS Publications website at DOI: 10.1021/acs.est.5b03593.
Appendix 1 contains tables and figures showing theresults of the simulations for each imposed stress, aspercentage of colonies that survived and average numberof bees alive per colony. Appendix 2 documentsalterations made to the BEEHAVE model to run thesesimulations. (PDF)
■ AUTHOR INFORMATIONCorresponding Author*E-mail: [email protected]. Phone: +44 1326 259474.NotesThe authors declare the following competing financialinterest(s): Pernille Thorbek is employed by Syngenta, andthis work is part of a PhD Studentship at the University ofExeter funded jointly by the BBSRC and Syngenta.
■ ACKNOWLEDGMENTSJ.R. was funded to do this work on an Industrial CASE PhDstudentship funded by the Biology and Biotechnology SciencesResearch Council of the UK (BBSRC), and Syngenta. J.O.,M.B., and P.K. were supported on BBSRC project BB/K014463/1
■ REFERENCES(1) van Engelsdorp, D.; Meixner, M. D. A historical reveiw ofmanaged honey bee populations in Europe and the United States andthe factors that may affect them. J. Invertebr. Pathol. 2010, 103, S80−S95.(2) Naug, D. Nutritional stress due to habitat loss may explain recenthoneybee colony collapses. Biol. Conserv 2009, 142 (10), 2369−2372.(3) Cox-Foster, D. L.; Conlan, S.; Holmes, E. C.; Palacios, G.; Evans,J. D.; Moran, N. A.; Quan, P.-L.; Briese, T.; Hornig, M.; Geiser, D. M.;
Martinson, V.; vanEngelsdorp, D.; Kalkstein, A. L.; Drysdale, A.; Hui,J.; Zhai, J.; Cui, L.; Hutchison, S. K.; Simons, J. F.; Egholm, M.; Pettis,J. S.; Lipkin, W. I. A Metagenomic Survey of Microbes in Honey BeeColony Collapse Disorder. Science 2007, 318 (5848), 283−287.(4) Rosenkranz, P.; Aumeier, P.; Ziegelmann, B. Biology and controlof Varroa destructor. J. Invertebr. Pathol. 2010, 103, S96−S119.(5) Annoscia, D.; Del Piccolo, F.; Nazzi, F. How does the miteVarroa destructor kill the honeybee Apis mellifera? Alteration ofcuticular hydrocarbons and water loss in infested honeybees. J. InsectPhysiol. 2012, 58 (12), 1548−1555.(6) Nordstrom, S. Distribution of deformed wing virus within honeybee (Apis mellifera) brood cells infested with the ectoparasitic miteVarroa destructor. Exp. Appl. Acarol. 2003, 29 (3−4), 293−302.(7) Di Prisco, G.; Pennacchio, F.; Caprio, E.; Boncristiani, H. F.;Evans, J. D.; Chen, Y. P. Varroa destructor is an effective vector ofIsraeli acute paralysis virus in the honeybee, Apis mellifera. J. Gen.Virol. 2011, 92, 151−155.(8) Bowen-Walker, P. L.; Martin, S. J.; Gunn, A. The transmission ofdeformed wing virus between honeybees (Apis mellifera L.) by theectoparasitic mite Varroa jacobsoni Oud. J. Invertebr. Pathol. 1999, 73(1), 101−106.(9) Johnson, R. M. Honey Bee Toxicology. Annu. Rev. Entomol. 2015,60, 415−434.(10) Cresswell, J. E. A meta-analysis of experiments testing the effectsof a neonicotinoid insecticide (imidacloprid) on honey bees.Ecotoxicology 2011, 20 (1), 149−157.(11) European Food Safety Authority. Guidance on the riskassessment of plant protection products on bees (Apis mellifera,Bombus spp. and solitary bees). EFSA Journal 2013, 11, 3295.(12) Carreck, N. L.; Ratnieks, F. L. The dose makes the poison: have“field realistic” rates of exposure of bees to neonicotinoid insecticidesbeen overestimated in laboratory studies? J. Apicult Res. 2014, 53 (5),607−614.(13) Iwasa, T.; Motoyama, N.; Ambrose, J. T.; Roe, R. M.Mechanism for the differential toxicity of neonicotinoid insecticidesin the honey bee, Apis mellifera. Crop Prot. 2004, 23 (5), 371−378.(14) Sandrock, C.; Tanadini, M.; Tanadini, L. G.; Fauser-Misslin, A.;Potts, S. G.; Neumann, P. Impact of Chronic Neonicotinoid Exposureon Honeybee Colony Performance and Queen Supersedure. PLoS One2014, 9, 8; e10359210.1371/journal.pone.0103592(15) Decourtye, A.; Devillers, J. Ecotoxicity of NeonicotinoidInsecticides to Bees. Adv. Exp. Med. Biol. 2010, 683, 85−95.(16) Cutler, G. C.; Scott-Dupree, C. D.; Sultan, M.; McFarlane, A.D.; Brewer, L. A large-scale field study examining effects of exposure toclothianidin seed-treated canola on honey bee colony health,development, and overwintering success. PeerJ 2014 , 2;e65210.7717/peerj.652(17) Godfray, H. C. J.; Blacquiere, T.; Field, L. M.; Hails, R. S.;Petrokofsky, G.; Potts, S. G.; Raine, N. E.; Vanbergen, A. J.; McLean,A. R. A restatement of the natural science evidence base concerningneonicotinoid insecticides and insect pollinators. Proc. R. Soc. London,Ser. B 2014, 281, 1786; 2014055810.1098/rspb.2014.0558(18) Henry, M.; Beguin, M.; Requier, F.; Rollin, O.; Odoux, J. F.;Aupinel, P.; Aptel, J.; Tchamitchian, S.; Decourtye, A. A CommonPesticide Decreases Foraging Success and Survival in Honey Bees.Science 2012, 336 (6079), 348−350.(19) Dively, G. P.; Embrey, M. S.; Kamel, A.; Hawthorne, D. J.;Pettis, J. S. Assessment of Chronic Sublethal Effects of Imidacloprid onHoney Bee Colony Health. PLoS One 2015, 10 (3), e0118748.(20) Wilkins, S.; Jarratt, N.; Harkin, S.; Thompson, H.; Coulson, M.Effects of solvent on the toxicity of dimethoate in a honey bee in vitrolarval study. Pest Manage. Sci. 2013, 69 (4), 462−463.(21) Bailey, J.; Scott-Dupree, C.; Harris, R.; Tolman, J.; Harris, B.Contact and oral toxicity to honey bees (Apis mellifera) of agentsregistered for use for sweet corn insect control in Ontario, Canada.Apidologie 2005, 36 (4), 623−633.(22) Schneider, C. W.; Tautz, J.; Grunewald, B.; Fuchs, S. RFIDTracking of Sublethal Effects of Two Neonicotinoid Insecticides on
Environmental Science & Technology Article
DOI: 10.1021/acs.est.5b03593Environ. Sci. Technol. 2015, 49, 12879−12887
12886
the Foraging Behavior of Apis mellifera. PLoS One 2012, 7, 1;e3002310.1371/journal.pone.0030023(23) Tan, K.; Yang, S.; Wang, Z. W.; Menzel, R. Effect of Flumethrinon Survival and Olfactory Learning in Honeybees. PLoS One 2013, 8,6; e6629510.1371/journal.pone.0066295(24) Williamson, S. M.; Wright, G. A. Exposure to multiplecholinergic pesticides impairs olfactory learning and memory inhoneybees. J. Exp. Biol. 2013, 216 (10), 1799−1807.(25) Eiri, D. M.; Nieh, J. C. A nicotinic acetylcholine receptor agonistaffects honey bee sucrose responsiveness and decreases waggledancing. J. Exp. Biol. 2012, 215 (12), 2022−2029.(26) Dai, P. L.; Wang, Q.; Sun, J. H.; Liu, F.; Wang, X.; Wu, Y. Y.;Zhou, T. Effects of Sublethal Concentrations of Bifenthrin andDeltamethrin on Fecundity, Growth, and Development of theHoneybee Apis Mellifera Ligustica. Environ. Toxicol. Chem. 2010, 29(3), 644−649.(27) Huang, Z. Y.; Robinson, G. E. Regulation of honey bee divisionof labor by colony age demography. Behav Ecol Sociobiol 1996, 39 (3),147−158.(28) Becher, M. A.; Grimm, V.; Thorbek, P.; Horn, J.; Kennedy, P. J.;Osborne, J. L. BEEHAVE: a systems model of honeybee colonydynamics and foraging to explore multifactorial causes of colonyfailure. J. Appl. Ecol. 2014, 51 (2), 470−482.(29) Grimm, V.; Railsback, S. F. Individual-based Modeling andEcology (Princeton Series in Theoretical and Computational Biology)2005, DOI: 10.1515/9781400850624.(30) Becher, M. A.; Osborne, J. L.; Thorbek, P.; Kennedy, P. J.;Grimm, V. REVIEW: Towards a systems approach for understandinghoneybee decline: a stocktaking and synthesis of existing models. J.Appl. Ecol. 2013, 50 (4), 868−880.(31) Trevan, J. W. The error of determination of toxicity. Proc. R. Soc.London, Ser. B 1927, 101 (712), 483−514.(32) Bromenshenk, J. J.; Doskocil, J.; Olbu, G. J.; Degrandihoffman,G.; Roth, S. A. Pc Beepop, an Ecotoxicological Simulation-Model forHoney-Bee Populations. Environ. Toxicol. Chem. 1991, 10 (4), 547−558.(33) Schmickl, T.; Crailsheim, K. HoPoMo: A model of honeybeeintracolonial population dynamics and resource management. Ecol.Modell. 2007, 204 (1−2), 219−245.(34) Pilling, E.; Campbell, P.; Coulson, M.; Ruddle, N.; Tornier, I. A.Four-Year Field Program Investigating Long-Term Effects of RepeatedExposure of Honey Bee Colonies to Flowering Crops Treated withThiamethoxam. PLoS One 2013, 8, 10; e7719310.1371/journal.-pone.0077193(35) Rundlof, M.; Andersson, G. K. S.; Bommarco, R.; Fries, I.;Hederstrom, V.; Herbertsson, L.; Jonsson, O.; Klatt, B. K.; Pedersen,T. R.; Yourstone, J.; Smith, H. G. Seed coating with a neonicotinoidinsecticide negatively affects wild bees. Nature 2015, 521, 77−80,http://dx.doi.org/10.1038/nature14420,.(36) Perry, C. J.; Søvik, E.; Myerscough, M. R.; Barron, A. B. Rapidbehavioral maturation accelerates failure of stressed honey beecolonies. Proc. Natl. Acad. Sci. U. S. A. 2015, 112 (11), 3427−3432.(37) European Food Safety Authority. Statement on the suitability ofthe BEEHAVE model for its potential use in a regulatory context andfor the risk assessment of multiple stressors in honeybees at thelandscape level. EFSA Journal 2015 2015, 13 (6), 91.(38) Khoury, D. S.; Myerscough, M. R.; Barron, A. B. A QuantitativeModel of Honey Bee Colony Population Dynamics. PLoS One 2011, 6,4; e1849110.1371/journal.pone.0018491(39) Bryden, J.; Gill, R. J.; Mitton, R. A. A.; Raine, N. E.; Jansen, V. A.A. Chronic sublethal stress causes bee colony failure. Ecol Lett. 2013,16 (12), 1463−1469.
Environmental Science & Technology Article
DOI: 10.1021/acs.est.5b03593Environ. Sci. Technol. 2015, 49, 12879−12887
12887