Embed Size (px)
Citation preview
ii
PREDICTING FINANCIAL DISTRESS USING FINANCIAL
RATIOS IN COMPANIES LISTED IN NAIROBI STOCK
EXCHANGE (2003 -2011)
BY
ROBERT ODERO OTOM
UNITED STATES INTERNATIONAL UNIVERSITY- AFRICA
SPRING 2014
iii
PREDICTING FINANCIAL DISTRESS USING FINANCIAL
RATIOS IN COMPANIES LISTED IN NAIROBI STOCK
EXCHANGE (2003 -2011)
BY
ROBERT ODERO OTOM
A Project Report Submitted to the School of Business in Partial
Fulfillment of the Requirement for the Degree of Masters in
Business Administration
UNITED STATES INTERNATIONAL UNIVERSITY- AFRICA
SPRING 2014

iv
STUDENT’S DECLARATION
I, the undersigned, declare that this is my original work and has not been submitted to any
other college, institution or university other than the United States International University in
Nairobi for academic credit.
Signed: ________________________ Date: __________________
Robert Odero Otom (ID 619499)
This project has been presented for examination with my approval as the appointed
supervisor.
Signed: ________________________ Date: _____________________
Francis Mambo Gatumo
Signed: _______________________ Date: ____________________
Dean, Chandaria School of Business

v
COPYRIGHT
All rights reserved. No part of this report may be photocopied, recorded or otherwise
reproduced, stored in a retrieval system or transmitted in any electronic or mechanical means
without prior permission of the copyright owner.
Robert Odero Otom Copyright © 2014
vi
ABSTRACT
The purpose of this study was to confirm whether financial ratios can be used to predict
financial distress in the non-financial sector of Kenyan companies listed in the Nairobi Stock
Exchange. This study answers the following research questions: What variables reveal
conditions conducive to financial distress? How good are financial ratios in predicting
financial distress? Which ratios are most accurate in predicting financial distress?
This study is descriptive in nature. Secondary data was used and these were obtained through
review of literature including articles, journals and published financial reports and accounts.
The study examined some financial ratios in financial reports of groups of financially
distressed companies and actively sound companies in Kenya for the period 2003 to 2011
with the aim to determine the most significant and reliable ratios for predicting financial
distress. Companies were selected from the non-financial sector.
Like in some previous studies the companies were categorized into financially distressed and
non-distressed. Companies were categorized as distressed if (1) the company has suffered
losses for two straight years or (2) the audited report shows that the share holder‟s equity is
lower than the registered capital. This study applied ratios identified in previous studies. The
selected ratios were analyzed using the backward stepwise method to determine the ones that
are statistically significant. This study then used discriminant analysis method to estimate a
model that predicts financial distress. The analysis compared similar financial ratios for the
two groups of companies with the aim to explain the association between the explanatory
variables and financial distress. Statistical models were then used to test the predictive power
of the financial ratios.
The study confirmed that there are variables that reveal conditions which are conducive to
financial distress. The study found that the variables that reveal financial distress are those
related to profitability, leverage and operational efficiency. The study also confirms that
financial ratios can predict financial distress for non-financial sector Kenyan firms listed in
the Nairobi Stock Exchange. The study also determined which ratios are the best predictors.
Net Income to Total Assets, Total Liabilities to Total Equity, Total Liability to Total Assets
and Current Assets to Sales were found to be the best set or combination of ratios for
predicting financial distress.
vii
The study concluded that profitability, liquidity, leverage and operational efficiency are
crucial in determining financial health of a company. Financial ratios are good predictors of
financial distress with some ratios being more significant than others. Even though
profitability ratios are the most significant, a combination of ratios does better than a single
ratio in predicting financial distress. A combination of the ratios gives a more accurate model.
The research recommends the best ratios or combination of ratios that can be used to predict
financial distress. The study also recommends that more ratios, especially those related to
profitability, be provided in financial reports to make it easier for users to take informed
decisions especially in case of danger signs. This will enable timely corrective actions to br
taken when necessary thereby help reduce incidences of company failures. Investors will also
be able avoid putting their resources in financially distressed companies unknowingly.
viii
ACKNOWLEDGEMENT
Thanks to the Almighty God for the gift of knowledge and for the opportunity to continuously
advance the same. Am very grateful, to all those who supported me in completing this project.
I acknowledge and very much appreciate the guidance I got from my supervisor, Prof. Francis
Gatumo, Ms Maryanne Muchui for the assistance in data collection, the USIU fraternity for
all the facilitation and my beloved family for your continued support and prayers.

ix
DEDICATION
My time as a graduate student in USIU was so enjoyable and educative. I learnt a lot and
developed so much as a person. All this would not have been possible without the support of
the University lecturer, staff, fellow students, friends and family. I will forever remain
grateful for your support and understanding. This project is dedicated to my family and my
late dad.
x
TABLE OF CONTENT
STUDENT’S DECLARATION .............................................................................................. ii
COPYRIGHT ........................................................................................................................... v
ABSTRACT ............................................................................................................................ vi
ACKNOWLEDGEMENT ................................................................................................... viii
DEDICATION ........................................................................................................................ ix
TABLE OF CONTENT .......................................................................................................... x
LIST OF TABLES ................................................................................................................ xiii
CHAPTER ONE ...................................................................................................................... 1
1.0 INTRODUCTION ............................................................................................................. 1
1.1 Background to the study .......................................................................................................... 1
1.2 Statement of the problem ......................................................................................................... 6
1.3 Purpose of the study ................................................................................................................. 7
1.4 Research Questions .................................................................................................................. 7
1.5 Importance of the Study ........................................................................................................... 7
1.6 The Scope of the Study .......................................................................................................... 10
1.7 Definition of Terms ............................................................................................................... 10
1.8 Chapter Summary ........................................................................................................................ 12
CHAPTER TWO ................................................................................................................... 14
2.0 LITERATURE REVIEW ...................................................................................... 14
2.1 Introduction ............................................................................................................................ 14
2.2 Financial variables that reveal conditions conducive to financial distress ............................ 14
2.2.1 Forecasting the probability of failure ............................................................................. 14
2.2.2 Relationship between financial distress and insolvency ................................................ 15
2.2.3 Identifying financial distress indicators ......................................................................... 16
2.4 Financial ratios as predictors of financial distress ................................................................. 18
2.4.1 Ratio Analysis ....................................................................................................................... 18
xi
2.4.2 Limitations of financial ratios ........................................................................................ 19
2.4.3 Usefulness of financial ratios in predicting financial distress ........................................ 20
2.5 Accuracy of predictive models for financial distress ............................................................. 22
2.5.1 Financial characteristics that assess and predict corporate financial distress ....................... 22
2.5.2 Ratios as predictors of financial distress ........................................................................ 24
2.5.3 Financial ratios that one should use for analysis of a firm‟s financial status ................. 25
2.5.4 Predicting financial Distress using Rough Set Methodology ........................................ 27
2.5 Chapter Summary: ....................................................................................................................... 28
CHAPTER THREE ............................................................................................................... 29
3.0 RESEARCH METHODOLOGY .......................................................................... 29
3.1 Introduction.................................................................................................................................. 29
3.2 Research Design .......................................................................................................................... 29
3.3 Population and Sampling Design ........................................................................................... 31
3.3.1 Population ............................................................................................................................. 31
3.3.2 Sampling design ............................................................................................................. 31
3.4 Data Collection Methods ............................................................................................................. 33
3.5 Research Procedure ..................................................................................................................... 33
3.6 Data Analysis Methods ................................................................................................................ 35
3.7 Chapter Summary ........................................................................................................................ 35
CHAPTER FOUR ................................................................................................................. 36
4.0 RESULTS AND FINDINGS .................................................................................. 36
4.1 Introduction.................................................................................................................................. 36
4.2 General Information ..................................................................................................................... 36
4.2.1 Financial Statements ...................................................................................................... 36
4.2.2 Financial Ratios ............................................................................................................. 36
4.2.3 Grouping of Companies ................................................................................................. 37
4.2.4 Statistical Package for Social Sciences (SPSS) ............................................................. 39
4.3 Variables that reveal financial distress ........................................................................................ 40
xii
4.3 How good are financial ratios in predicting financial distress ..................................................... 43
4.4 Financial ratios that are most accurate in predicting financial distress ........................................ 44
4.4.1 Computation of the financial distress prediction model ................................................ 45
4.5 Summary ...................................................................................................................................... 48
CHARPTER FIVE ................................................................................................................ 49
5.0 SUMMARY, DISCUSSIONS, CONCLUSIONS AND RECOMMENDATIONS .... 49
5.1 Introduction.................................................................................................................................. 49
5.2 Summary ...................................................................................................................................... 49
5.3 Discussions ............................................................................................................................ 50
5.3.1 Conditions that reveal financial distress ............................................................................... 50
5.3.2 Financial rations as predictors of financial distress ....................................................... 51
5.3.3 Financial ratios are more accurate in predicting financial distress. ............................... 52
5.4 Conclusions.................................................................................................................................. 53
5.4.1 Factors that reveal financial distress .............................................................................. 53
5.4.2 Financial ratios as predictors of financial distress ......................................................... 54
5.4.3 Financial ratio that is most accurate in predicting financial distress ............................. 54
5.5 Recommendations .................................................................................................................. 55
5.5.1 Recommendation for improvements .............................................................................. 55
5.5.1.1 Factors that reveal financial distress .............................................................................. 55
5.5.1.2 Financial ratios as predictors of financial distress ......................................................... 55
5.5.1.2 Financial ratio that is most accurate in predicting financial distress ............................. 55
5.5.2 Recommendation for further studies .............................................................................. 56
REFERENCE ......................................................................................................................... 57
APPENDIX 1; CHECK LIST .............................................................................................. 61
APPENDIX 2; LIST OF COMPANIES .............................................................................. 62
xiii
LIST OF TABLES
Table 1.1: A Recent Dun &Bradstreet Compilation of Causes of Business failure ............................ 5
Table 2.1: Ratios ranked according to their popularity...................................................................... 26
Table 3.1: Generalized Scientific Guideline for Sample Size for a Given Population Size .............. 32
Table 3.2: Sample Size ...................................................................................................................... 33
Table 4.1: Financial Ratios used in the Study ................................................................................... 37
Table 4.2: Names of Companies in the analysis ................................................................................ 38
Table 4.3: Company No. as in Table 4.2, Indicating Group and corresponding Ratios .................. 39
Table 4.4: Classification Resultsa ...................................................................................................... 40
Table 4.5: Casewise Statistics ........................................................................................................... 41
Table 4.6: Structure Matrix ............................................................................................................... 42
Table 4.7: Tests of Equality of Group Means .................................................................................... 42
Table 4.8; ANOVAb .......................................................................................................................... 43
Table 4.9: Model Summary ............................................................................................................... 44
Table 4.10: Stepwise Statistics .......................................................................................................... 46
Table 4.11: Canonical Discriminant Function Coefficients .............................................................. 47
Table 4.12: Current Status of Companies categorized as Distressed, Group 2 ................................. 47

1
CHAPTER ONE
1.0 INTRODUCTION
1.1 Background to the study
One of the major objectives of financial analysis is to reduce the degree of risk, to which
creditors are exposed as a result of bankruptcies and defaulting on debts (Tamari, 1966). One
system often used to examine the financial position of a firm as reflected in its financial
statements is ratio analysis - comparison of various data in the balance sheet and profit and
loss statement. The ratio of current assets to current liabilities, for example, indicates the
firm's capacity to meet such liabilities; the ratio of net worth to total liabilities shows the
owners' share in the assets of the business; the ratio of net profit to net worth gives the return
on proprietary capital; and the ratio of net profit to the value of production gives some
indication of the enterprise's pricing policy. The exact choice of ratios will clearly depend on
the object in view and the information available (Tamari, 1966). Ratios are among the most
popular and widely used tools of financial analysis. Yet their function is often misunderstood
and, consequently, their significance often overrated. A ratio expresses a mathematical
relation between two quantities (Bersten & Wild, 1999).
Financial ratios are the most commonly used .in analyzing, understanding and interpreting
corporate financial statements and in evaluating and monitoring company‟s performance over
time. The ratios point out changes and identify irregularities, abnormalities and surprises that
would require further investigation to ascertain the current and future financial standing of the
company (Barry & Jamie Elliot, 2006). The ratios are based on the firm's past behavior and
are unaffected by any additional knowledge in the hands of the investigator on the future of
the branch, the business or social standing of the owner, Government policy, etc (Tamari,
1966).
Ratios may be used in several ways. Some analysts apply absolute standards, on the grounds
that a substandard ratio indicates a potential weakness that merits further analysis. Other
analysts compare a company‟s ratios with those of the “average” firm in the same industry in
order to detect differences that may need further consideration (Sharpe, Alexander, & Bailey,
1999).

2
Comparison of analytical data for a current period with similar computations for prior years
affords some basis of judging whether the condition of the business is improving or
worsening. This comparison of data over time is called horizontal or trend analysis. It is
distinguished from vertical or static analysis which refers to the review of the financial
information for only one accounting period (Meigs & Meigs, 1990).
To be meaningful, a ratio must refer to an economically important relation. Ratios are tools
providing us with clues and symptoms of underlying conditions. Analysis of a ratio reveals
important relations and bases of comparison in uncovering conditions and trends difficult to
detect by inspecting individual components comprising the ratios (Berstein & Wild, 1999).
Financial ratios can broadly be classified into six groups, namely liquidity ratio, capital
structure or leverage, profitability ratio, activity ratios, integrated ratios and growth ratios.
Liquidity ratios include (i) Current ratio, (ii) Acid test ratio and (iii) Super-quick ratio. Capital
structure or leverage ratios include; (i) Debt/Equity ratio, (ii) Debt to total capital ratio, (iii)
Debt to total assets ratio, (iv) Proprietary ratio, (v)Capital gearing ratio, (vi) Interest coverage
ratio, (vii) Dividend coverage ratio, (viii) Total coverage ratio, (ix) Cash flow coverage ratio
and (x) Debt service coverage ratio. The profitability ratios include; (i) Return on total assets,
(ii) Return on capital employed, (iii) Return on share holders‟ equity, (iv) Return on equity
funds, (v) Earnings per share, (vi) Dividends per share, (vii) Earnings yield and (viii) Price
earnings ratio. The activity ratios also known as efficiency or turnover ratio include; (i) Raw
material turnover ratio, (ii) Work-in-progress turnover, (iii) Finished goods turnover ratio, (iv)
Debtors turnover ratio, (v) Average collection period, (vi) Total assets turnover ratio, (vii)
Fixed assets turnover ratio, (viii) Current assets turnover ratio and (ix) Working capital
turnover ratio.
In general, ratios measuring profitability, liquidity and solvency prevailed as the most
significant indicators but the order of their importance is not clear since almost every study
cited a different ratio as being the most effective in indicating impending problems (Altman,
1968).
To add more meaning to the ratios, a benchmark is required when traditional ratio analysis
techniques are used in analyzing financial statements. Such benchmarks can be adjusted
depending on the economic conditions obtaining at the time or the changes in company
objectives. The most commonly used ratio analysis techniques are trend analysis and cross
3
sectional analysis. Trend analysis compares the company‟s performance over time; the
benchmark therefore could be the previous years‟ financial ratios, the budgeted financial
ratios, budgeted financial ratios for the same period or financial ratios for other profit centers
or cost centers (Barry & Jamie, 2006) . With cross sectional analysis, the benchmark is the
financial ratios of another company either in the same industry or in a different industry.
Ratio analysis, however, suffers from various limitations including difficulty in comparison,
impact of inflation and conceptual diversity. Difficulty in comparison may be due to use of
different accounting practices and policies for example in the basis of inventory valuation,
depreciation methods among others. When assets acquired in different periods are, in effect
shown at different prices in the balance sheet and are not adjusted for changes in the price
level, ratio analysis yield comparable and, therefore, dependable results. Another factor which
influences the usefulness of ratios is that there is difference of opinion regarding the various
concepts used to compute the ratios. There is always room for diversity of opinion as to what
constitutes shareholders‟ equity, debt, assets, profit and so on (Khan & Jain, 2004).
Financial economists have not reached a consensus on how financial distress affects corporate
performance. Traditionally, the financial economics literature has portrayed financial distress
as a costly event whose possibility is important in determining firms' optimal capital
structures. Financial distress is seen as costly because it creates a tendency for firms to do
things that are harmful to debt-holders and nonfinancial stakeholders (i.e., customers,
suppliers, and employees), impairing access to credit and raising costs of stakeholder
relationships. In addition, financial distress can be costly if a firm's weakened condition
induces an aggressive response by competitors seizing the opportunity to gain market share.
(Opler & Titman, 1994)
Financial distress is often a long-term process and has an impact on the capital structure,
investment policies, and perforemance of many firmseven after they emerge from debt
restructurings (Kahl, 2002).
The firms' increased demand for funds to meet payments on debts is typically met by an
increase in the outstanding amount of commercial loans. A crisis explodes when the
deterioration of the financial position of several firms and their reduced outlook for future
profitability cause creditors to reevaluate the amount of credit to be issued, to refuse to extend
additional credit and, in the extreme, to actively seek the liquidation of existing outstanding
4
loans. The inability of firms to refinance debt forces them to liquidate assets and induces a
multiplicative contraction in business profits. When this distress selling is widespread, asset
markets crash and bankruptcies ensue (Canova, 1994).
A company in financial distress will usually not be able to settle its obligations. According to
section 219 (e) of the Companies Act Cap 486, Laws of Kenya a company may be wound up
by the Courts if it is unable to pay its debts.
The Federal Bankruptcy Reform Act of 1978, in the United States is the latest of a series of
bankruptcy laws that allow those with excessive debts to discharge the same through a three
year repayment plan or through a plan for liquidating assets. Individuals choosing bankruptcy
have two alternatives. The first – called chapter 7 – is a liquidation in which the debtor‟s
assets are seized by the court and sold. Any funds remaining after court costs and legal fees
are paid are then prorated among the various creditors. The other bankruptcy alternative,
Chapter 13, also known as the wage earner plan, allows the debtor to establish a three year
payment plan. Debtors who choose chapter 13 are allowed to retain possession of their
property and to repay specified amounts to their creditors over a three year period (Boone,
Kurtz, & Hearth, 2006).
The Nairobi Stock Exchange (NSE) was constituted in 1954 as a voluntary association of
stockbrokers registered under the Societies Act and until after the attainment of independence
in 1963, the business of dealing in shares was confined to the resident European community.
Today it has expanded so much and is recognized by International Finance Corporation (IFC)
as one of the best performing Stock Exchange in the world
(http://en.wikipedia.org/wiki/Nairobi_Securities_Exchange; 2013). By December 2012 NSE
had 51 companies listed under it.
The detection of company operating under financial difficulties is a subject which has been
particularly susceptible to financial ratio analysis. Prior to the development of quantitative
measures of company performance, agencies were established to supply a qualitative type of
information assessing the credit worthiness of particular merchants.' Formal aggregate
studies concerned with portents of business failure were evident in the 1930's. A study at that
time" and several later ones concluded that failing firms exhibit significantly different ratio
measurements than continuing entities" (Altman, 1983).

5
In the United States business failure is widespread and a fairly large number of businesses fail
each year, although the failures in any one year are not a large percentage of the total business
population (Brigham & Daves, 2004). It is interesting to note that whereas the failure rate per
10,000 businesses fluctuates with the state of the economy, the average liability per failure
has tended to increase over time. This is due primarily to inflation, but it also reflects the fact
that some very large firms have failed in recent years. In 1950 -1959 the average number of
failures per year was 11,119 while average failure rate per 10,000 businesses was 42 with
average liability per failure being $ 41,082. In 1997, the average number of failures per year
was 83,384 while average failure rate per 10,000 businesses was 88 with average liability per
failure being $448,970 (Brigham & Daves, 2004).
Although bankruptcy is more frequent in small firms, large firms are not immune. However,
some firms might be too big or too important to be allowed to fail and mergers or
governmental intervention are often used as an alternative to outright failure and liquidation.
The decision to give federal aid to Chrysler (now a part of DaimlerChrysler AG) in the 1980s
is an excellent example (Brigham & Daves, 2004).
U.S. bankruptcy laws were first enacted in 1898. They were then modified substantially in
1938, then they were changed substantially again in 1978, and some fine-tuning was done in
1986. The primary purpose of the law is to avoid having firms that are worth more as ongoing
concerns are put out of business by individual creditors who could force liquidation without
regard to the effects on others (Brigham & Daves, 2004).
Financial distress may be caused by several factors. A recent Dun & Bradstreet compilation
assigned percentage values to business failure causes, as shown in Table 1.1 below:.
Table 1.1: A Recent Dun &Bradstreet Compilation of Causes of Business failure
Cause of Failure Percentage of Total
Economic factors 37.1%
Financial factors 47.3
Neglect, Disaster, and fraud 14.0
Other factors 1.6
100.0%

6
The importance of the different factors varies over time, depending on such things as the state
of the economy and the level of interest rates. Also most business failures occur because a
number of factors combine to make the business unsustainable. Further, case studies show
that financial difficulties are usually the result of a series of errors, misjudgments, and
interrelated weaknesses that can be attributed directly or indirectly to management (Brigham
& Daves, 2004).
It is usually the abnormal risks that are taken long before bankruptcy is apparent that are the
fundamental causes of failure-not what occurs as the market perceives the bankruptcy risk
more clearly (Altman, 1983).
1.2 Statement of the problem
Although causes of financial difficulty are numerous, many failures are attributable either
directly or indirectly to management. Usually, non-financial problems lead to losses, which in
turn lead to financial strain and eventual failure. Very seldom is one bad decision the cause of
difficulty; usually the cause is a series of errors, and the distress evolves gradually (Van
Horne, 1991). Yet financial distress will usually precede corporate failure. The question then
is whether financial distress can be predicted so that corrective action may be taken in good
time.
Business failure identification and early warnings of impending financial crisis are important
not only to analysts and practitioners in the US but to countries throughout the world.
Developing countries and smaller economies, as well as larger industrialized nations of the
world are vitally concerned with avoiding financial crisis in the private and public sectors.
Some policy makers in smaller nations are particularly concerned with financial panics
resulting from failures of individual entities (Choi, 2003).
The existing bankruptcy models are of course very useful in understanding and predicting
companies that are likely to face some financial difficulties. However, it is important to note
that financial ratios are numerous and no two previous bankruptcy studies or models have
made use of exactly the same set of financial ratios (Horrigan, 1965).
In other words, each researcher in his/her study deduces a set of significant financial ratios for
predicting bankruptcy. This suggests two things; that the choice of financial ratios used by an
individual research is based on the researcher‟s objective thinking (subjectivity). Secondly,
7
that each financial ratio has a unique property making it more relevant or irrelevant than the
others. Similarly, researchers hold the view that the most important and fundamental
statistical nature of financial ratios is colinearity. This means some financial ratios tend to
move in the same direction as others and therefore have a high degree of correlation with each
other (Horrigan, 1965).
Therefore account users will need only a small number of financial ratios to make crucial
decisions about a company‟s state of affairs. Hence, it will be costly and waste of resources
for corporate stakeholders to focus on the numerous financial ratios in order to make critical
business decisions. There is also the risk of focusing on less important, ambiguous or the
wrong type of ratios. There is need to determine which ratios are more statistically significant
than others in predicting financial distress. The ratios in themselves may not be as useful
when applied individually. It is therefore necessary to combine several ratios. The problem
then is to determine which ratios are more significant in such decision making process. It
would not be viable for analysts, creditors investors to apply all the over 50 financial ratios.
According to Polemis et al (2012) vast changing environment and the financial crisis highlight
the need for future research on the world trade implications, as well as individual
macroeconomic variables of each country. This study looks at the Kenyan companies listed in
the Nairobi Stock Exchange.
1.3 Purpose of the study
The study sought to determine whether there are certain characteristics in financial ratios that
pre-dominate financially distressed companies and whether these characteristics can be
identified and used for prediction purposes.
1.4 Research Questions
1.4.1 What financial variables reveal conditions conducive to financial distress?
1.4.2 How good are financial ratios in predicting financial distress?
1.4.3 Which financial ratios are most accurate in predicting financial distress?
1.5 Importance of the Study
There is a lot of turbulence in the business environment these days. Stakeholders are
increasingly interested in knowing the healthy or the distressed firms. Even though the adage
that the higher the risk the higher the returns holds to a large extent, investors would want to
8
avoid investing in a company which is destined to fail. It is also necessary that the investors
maximize their returns by investing more in companies with a brighter future and investing
less in companies with a bleak future. In this regard researchers have come up with models
that can help determine whether a firm is healthy or it is financially distressed. Regulatory
bodies have also come up with criteria and policies to guide classification of firms as either
healthy or financially distressed.
Signs of potential financial distress are generally evident in a ratio analysis long before the
firm actually fails, and researchers use ratio analysis to predict the probability that a given
firm will go bankrupt (Brigham & Daves, 2004).
According to International Financial Reporting Standards (IFRS) 2013, the objective of
financial statements is to provide information about the financial position, financial
performance and cash flows of an entity that is useful to a wide range of users in making
decisions. The information on assets, liabilities, equity, income and expenses, contributions
by and distributions to owners and cash flow along with other information in the notes, assists
users of financial statements in predicting the entity‟s future cash flows, in particular their
timing and certainty.
A common use of financial statements analysis is in identifying areas needing further
investigation and analysis. One of these applications is in predicting financial distress.
Research has made substantial advances in suggesting various ratios as predictors of distress.
The research is valuable in providing us additional tools of analyzing long term solvency
(Bersten & Wild, 1999).
There are over 50 financial ratios and it would be very difficult and confusing to use all of
them in analyzing a given financial statement. This study helps in narrowing down the
number of ratios to be used by identifying the most significant ratios in predicting financial
distress.
Models for predicting financial distress, commonly referred to as bankruptcy models, examine
the trend and behavior of selected ratios. Characteristics of these ratios are used in identifying
the likelihood of future financial distress. Models presume evidence of distress appears in the
financial ratios and we can detect it sufficiently early for us to take action to avoid risk of loss
or to capitalize on this information (Bersten & Wild, 1999). Models for predicting financial
distress have over time moved from the traditional ratio analysis in the 1930s to single ratio
9
predictors developed from univariate to today‟s multivariate predictive models. Thus the
models for predicting financial distress using financial ratios fall into two categories;
univariate and multivariate models.
Different studies in the field of economics and finance, credit risk management and
accounting have established models for predicting bankruptcy. Most of these studies are
multivariate in the sense that they incorporated different financial ratios in a single equation in
order to predict corporate failure. However, other studies especially the work of Beaver
(1966) was a cornerstone for most multivariate models. This study explores the behavior of
different financial ratios on financially distressed companies and financially healthy firms.
This research study like that of Beaver is univariate since it independently examines the
impact of financial ratios on financial distress probability with the objective of indicating a set
of most significant ratios for predicting business failure. This is important because it would
enable remedial action to be taken in good time.
Different models and ratios or combination of ratios work best in different countries
(Rahman, Tan, Hew, & Tan, 2004). Even though previous studies have been done to
determine the best models or ratios or combination of ratios in predicting financial distress,
the findings may not be applicable in Kenya. It is therefore important to verify which ratios or
combination of ratios work best in Kenya, which is what this study does. Even though the
study is similar to that by Polemis et al (2012). The model is expected to be more relevant to
Kenya since the variables and weights will be based on the financial statements of Kenyan
companies.
In general terms, this study sought to determine the most significant financial ratios for
predicting corporate failure. Unlike in previous bankruptcy studies which compromised
generalization by using small sample sizes (Grice and Dugan, 2001), this study uses large
sample.
Business entities and even individuals often need to invest in a project or enter into some
credit or debt arrangement. All those who invest their funds do so in the hope of making
gains. Those who lend do so in the hope of getting profits in the form of interest. In both cases
it is important that such hope be based on some verifiable factors. Hence the need to look at
performance indicators which include profitability and earnings ability among others.
However there is a further need to be able to forecast and tell, with some degree of accuracy,

10
how long a given trend, say profitability, will be sustained. This will enable one to take any
necessary action in good time. Predictive models come in handy in enabling such forecasts.
This study looks at how financial ratios can be used to predict financial distress in Kenya.
1.6 The Scope of the Study
The research is based on companies listed in the Nairobi Stock Exchange in the non-financial
sector during the period under study, that is, 2003 to 2011. These companies are all based in
Nairobi.
The study has the following limitations:
Not all financial ratios are considered and so the results obtained are based on the financial
ratios considered.
1.7 Definition of Terms
1.7.1 Bankruptcy
This is the state of being unable to pay debts, thus the ownership of the firm‟s asset is
transferred from the stockholders to the bondholders (Ross, Westerfield, & Jaffe, Corporate
Finance, 2001). It is a legal procedure by which an individual, house hold, or business that
cannot meet its financial obligation is relieved of these obligations by having the court divide
its assets and/or income among creditors.
1.7.2 Financial distress
These are events preceding and including bankruptcy, such as violation of loan contracts (Ray
and Mahavidyalaya 2011).It is a condition when a company cannot meet (or has difficulties
paying off) its financial obligations to its creditors. Operating cash flows are not sufficient to
satisfy current obligations and the firm is forced to take corrective actions
1.7.3 Ratio Analysis
This is an examination of the relationship between two numbers or sets of numbers on
financial reports (Slater, 2007). It is the systematic use of ratios to interpret the financial
statements so that the strengths and weaknesses of the firm, as well as its historical
performance and current condition, can be determined.
11
1.7.4 Profitability ratios
These are those that measure the ability of the firm to earn an adequate return on sales, total
assets and invested capital (Hirt & Block, 2003).
1.7.5 Liquidity ratios
These are ratios that show the relationship of a firm‟s cash and other current assets to its
current liabilities (Brigham & Daves, 2004). It measures the ability of the firm to meet its
short-term obligations and reflect the short-term financial strength/solvency of a firm.
1.7.6 Capital structure or leverage ratios
Capital structure or leverage ratios are financial ratios which throw light on the long term
solvency of a firm as reflected in its ability to assure the long-term lenders
1.7.7 Activity ratios
These are a group of ratios that measure the speed at which the firm is turning over or
utilizing its assets (Block, Hirt, & Danielson, 2009) It is also called efficiency ratios or asset
utilization ratios are concerned with measuring the efficiency in asset management.
1.7.8 Current ratio
This is calculated by dividing current assets by current liabilities; it indicates the extent to
which current liabilities are covered by those assets expected to be converted to cash in the
near future (Brigham & Houston, Fundamentals of Financial Management, 2004).
1.7.9 Acid test ratio
Also known as quick ratio, it is the ratio between those assets that are most easily converted to
cash are divided by current liabilities to indicate the ability to pay-off short-term debts (Slater,
2007).
1.7.10 Capital structure or leverage ratios
These are financial ratios which throw light on the long-term solvency of a firm as reflected in
its ability to assure the long-term lenders regard to periodic payment of interest during the
12
period of the loan and the repayment of the principal on maturity or in the predetermined
installments at due dates (Block, Hirt, & Danielson, 2009).
1.7.11 Debt/Equity ratio
Provides an indication of how well the share holder‟s investment in the company protects the
creditor‟s debt. It measures how much the shareholders have at risk versus how much the
creditors have at risk. And thus, the strength of the company‟s capital structure (McKinley,
Johnson, Downey, Zimmerman, & Bloom, 1988)
1.7.12 Average collection period
This is the average amount of time that the accounts receivables are held in the books. It is
computed by dividing accounts receivables by average daily credit sales (Block, Hirt, &
Danielson, 2009)
1.7.13 Debtors turnover ratio
Measures how rapidly receivables are collected. It is determined by dividing the credit sales
by receivables outstanding during the year (Block, Hirt, & Danielson, 2009).
1.7.14 Assets turnover ratio
This indicates how efficiently a company uses its assets to generate sales and thus helps to
measure the overall efficiency of the company (Slater, 2007).
1.8 Chapter Summary
The chapter details the methodology of the study, the objectives (general and specific), the
justification and the scope of the study. It looks at the use of financial ratios in predicting
financial distress in companies listed in the Nairobi Stock Exchange in the non-financial
sector. By identifying characteristics that distinguish healthy companies from financially
distressed companies, ratios help in showing the performance of a company, both current and
into the future.
The next chapter will look at literature review on the topic. This includes relevant theories,
outcomes, suggestions and recommendations from previous studies. Chapter 3 presents the
research organization and methodology applied by the study in examining the usefulness of

13
financial ratios in predicting financial distress. Chapter 4 includes the results and findings of
the study while chapter 5 comprises of the conclusions and recommendations.
14
CHAPTER TWO
2.0 LITERATURE REVIEW
2.1 Introduction
This chapter looks at the overview of the basic concepts relating to financial distress or
failure. The chapter contains previous literature on financial distress and bankruptcy and the
various predictive models used in previous studies. The literature on predicting financial
distress using financial ratios will be looked at by way of research questions. Section 2.2
looks at variables that reveal conditions that are conducive to financial distress. Section 2.3
looks at how good financial ratios are in predicting financial distress. Section 2.4 looks at the
ratios that are most accurate in predicting financial distress. Section 2.5 is the chapter
summary which summarizes the literature review of this study.
2.2 Financial variables that reveal conditions conducive to financial distress
2.2.1 Forecasting the probability of failure
In their study; forecasting the probability of failure of Thailand financial companies in the
Asian financial crisis, Stephen Reynolds et al (2002) examined the financial capital structure
of major financial companies in Thailand over the period 1993-98. They used both probit and
logistic binomial regression analysis and were in addition also able to estimate the probability
of a firm surviving to and operating in 1998. This estimation required the use of a multinomial
ordinal logistic model.
The sample studied included 91 major financial companies with the methodology consisting
of postulating a relationship between the probability of a financial company surviving to 1997
and certain key economic determinants; firm size in terms of assets, total assets, net profit, net
income and borrowing and lending structures. The researchers used three comparative risk-
response models namely probit, logistic and cumulative logistic regression.
The model used by Stephen Reynolds et al (2002) differs from the traditional methodology
used in accounting and auditing research in that the traditional approach is concerned with
using financial ratios to predict firm failure per se and not the probability of failure. The
15
central hypothesis of the study was that as a firm size (assets) increases, the probability of
survival decreases. The reasoning behind this hypothesis involves the nature of financial
intermidiaries, the market of risky borrowers and moral hazard.
The findings of the study was that the firm size (measured in total assets) is inversely related
to the probability of survival (or odds of survival), indicating that large companies have less
of a chance of surviving to 1997 than relatively smaller companies. They also found that time-
variable coefficient is positive, indicating that, as time goes on, the probability of survival
increases. This was a surprise. It may have been because of the implicit bias in the "survival
of the fittest" approach to identifying the more risky firms. Positively, it could indicate that
the less risky firms became more healthy financially over time and that is why they were
selected (by the market, in effect) to survive.
Stephen Reynolds et al concluded that Companies with relatively more short-term debt and
more non-performing loans appear more likely to survive and, by implication, are more
cautious about their lending practices. These results are not consistent with the moral hazard
conjecture. It appears, then, that the large financial companies with relatively less (not more)
short-term debt and nonperforming loans are more apt to practice "moral hazard." In terms of
public policy implications, the results of the research suggest that smaller rather than larger
financial intermediaries should be encouraged.
However the study cannot be conclusive enough since it fails to consider long-term debts and
other determinants such as liquidity.
2.2.2 Relationship between financial distress and insolvency
The definition of financial distress can be expanded somewhat by linking it to insolvency
(Ross, westerfield, & Jaffe, 2005). Insolvency is defined in Black‟s Law Dictionary as the
inability to pay one‟s debts; lack of means of paying one‟s debts. Such a condition of a
woman‟s (or man‟s) assets and liability that the former made immediately available would be
insufficient to discharge the later.
This definition has two general themes, stock and cash flows. The stock based insolvency
occurs when firm has negative net worth, and so the value of assets is less than the value of its
debts. While flow–based insolvency occurs when operating cash flow is insufficient to meet
16
current obligations (Ross, westerfield, & Jaffe, 2005). Flow-based insolvency thus refers to
the inability to pay one‟s debts.
According to Ross et al, 2005 firms deal with financial distress in several ways, such as
selling major assets, merging with another firm, reducing capital spending and research and
development, issuing new securities, negotiating with banks and other creditors, exchanging
debts for equity and filing for bankruptcy.
Financial distress can serve as a firm‟s „early warning‟ system for trouble. Firms with more
debts will experience financial distress earlier than firms with less debt. However firms that
experience financial distress earlier have more time for private workouts and reorganization.
Firms with low leverage experience financial distress later, and in many instances, are forced
to liquidate (Ross, westerfield, & Jaffe, 2005).
2.2.3 Identifying financial distress indicators
In their study Rahman et al (2004) examined the indicators that led to the problems suffered
by banks in South Asian countries in 1997. The countries in study included Indonasia, South
Korea and Thailand. The banks in this countries were found to be ideal for the study since
they enjoyed profitability during the pre-crisis period and were the most severely affected by
the financial crisis of 1997.
The onset of the Asian economic and financial crisis shocked the world, because it occurred
in those countries that were the most successful in achieving their economic objectives during
the past thirty years (Rahman, Tan, Hew, & Tan, 2004). One of the main reasons often cited
was that the financial sectors were not properly supervised and regulated.
Bankers, economists, and regulators generally accept that banks are special and that bank runs
or failures are costly to the economy. Therefore banking stability is afforded the urtmost
importance (Rahman, Tan, Hew, & Tan, 2004). There is therefore an urgent need to identify
banks that are more prone to financial distress, before the effects of its financial instability can
be felt in the economy. The aim of the study by Rahman et al (2004) was to construct an
imperical model that identify banks experiencing financial distress in Indonasia, South Korea
and Thailand, as a function of financial ratios obtained from balance sheet and income
statement.
17
Rahman et al (2004) used logistic regression model to investigate banks‟ financial distress
indicators. This model is appropriate when the independent variable can be grouped into
discrete states. To sequentially add the best variable to the model, forward stepwise selection
procedure in logistic regression was used. Forward stepwise selection method is based on the
principle that repressors‟ are added one at a time until there are no remaining regressors that
would significantly affect improve the regression.
The population under study included financial statements of banks in the three countries
Indonesia, South Korea and Thailand for the period from 1995 to 1997.
The sample data consisted of financial statements of banks from Indonesia, South Korea and
Thailand with the data being collected from the electronic database. The sample consisted of
banks whose data for the period 1995 to 1997 were available. The banks in the three countries
were categorized as „problem‟ and „non-problem‟ banks.
The data included explanatory variables on capital adequacy, interest income/interest expense,
Liquidity, loan quality, loan volume, management efficiency, operating efficiency, profit
margin, ROA, ROE and source of revenue.
The findings of the study was that capital adequacy, interest income/interest expense and
operating efficiency are three common financial indicators found to be able to identify
problem banks in all the three countries. Capital adequacy indicates whether a bank has
sufficient reserves at its disposal. Interest income/interest expense measures the number of
times interest expense is covered by the interest income. Interest rates are positively related to
profitability. Operating efficiency measures the effects of inefficient bank operations on
profitability. In their study Rahman et al found that Asset Quality did not appear to be able to
indicate financial distress of the banks.
They concluded that for each country, separate identification models should be developed for
individual and overall time periods. The financial indicators represent measures of capital
adequacy, loan management and operation efficiency and are essential to the financial health
of banks in Asia.
18
Rahman et al recommended research extension using the Cox proportional hazards model in
financial distress applications. The greatest usefulness of the Cox model in such financial
distress application is its ability to provide information regarding the expected time to failure.
This information is not available from traditional classification techniques such as logistic
regression and MDA.
2.4 Financial ratios as predictors of financial distress
2.4.1 Ratio Analysis
A ratio expresses the mathematical relationship between one quantity and another. The
relationship is expressed in terms of either a percentage, a rate, or a simple proportion
(Kimmel, Weygandt, & Kieso, 2000). Apart from being expressed as a percentage or as a
simple proportion, a ratio can also be expressed in terms of some other scalar values such as
number of days or months (Ryan, 2004)
Ratio analysis expresses the relationship among selected items of financial statement data.
Ratios can provide clues to underlying conditions that may not be apparent from inspection of
the individual components of a particular ratio. However a single ratio by itself is not very
meaningful (Kimmel, Weygandt, & Kieso, 2000).
Ratios give more information when compared either for the same company over time, Intra-
company Comparisons, or with a competitor in the same industry, Intercompany Comparison,
or based on average for particular industry, Industry Average Comparison (Kimmel,
Weygandt, & Kieso, 2000).
When constructing financial ratios the numerator will always be a financial value drawn from
one or other of the principal statement of account. The denominator may be a financial value
or it may be some other physical measure such as the number of passenger flights, the number
of employees or the square meters of floor space (Ryan, 2004).
Financial ratios are traditionally grouped into five categories or pillars (Ross, Westerfield, &
Jordan, 2008). These include Short-term solvency, or liquidity ratios, Long-term solvency, or
financial leverage, ratios, Asset management, or turnover, ratios, Profitability ratios. and
Market value ratios.
19
2.4.2 Limitations of financial ratios
Ratios like any other financial technique need to be interpreted with care. There will be a
number of potential biases and inaccuracies in the underlying data, as well as alternative
methods for calculating the ratios themselves that can cause difficulty (Ryan, 2004). Some of
the pitfalls include the following:
2.4.2.1 Underlying accounting principles;
Any ratio is necessarily dependent on the accuracy of the financial data on which it is based
but also on the fairness with which the financial data represent the underlying economic
reality. The journey from fundamental transaction of a business to the final audited accounts
involves collecting, categorizing and manipulating figures, and each stage involves the
applications of both rules and judgment as various accounting principles are applied (Ryan,
2004).
2.4.2.2 Timing problems;
Many businesses are subject to heavy seasonality in their pattern of sales (Ryan, 2004). So a
company with heavy sales towards its year-end may show low levels of stock, high cash
balances and increased debtors. It is thus worth enquiring, for any particular company,
whether the nature or seasonality of its trade may have a distorting effect on the accounts it
publishes and, therefore any ratios that you may produce.
2.4.2.3 Fraudulent manipulation and window dressing;
High-profile cases such as Eron and WorldCom have led many to question the underlying
truthfulness of accounting numbers (Ryan, 2004). Distortion may arise from the fraudulent
misappropriation of company funds or assets and use of creative accounting practices to
present financial reports that favour the view that management is trying to put across.
2.4.2.4 The impact of price changes;
If the balance sheet has been maintained at historic cost rather than fair value then any
balance sheet components within a ratio are likely to be understated because of the impact of
price changes on the business (Ryan, 2004). Even though it is possible to correct the figures
20
by adjusting the values in the balance sheet to reflect changing prices, such adjustments will
only be approximations at best.
2.4.3 Usefulness of financial ratios in predicting financial distress
In their study of Financial Distress Prediction in China; Chen, Marshal, Zhang and Ganesh
(2006) examined the usefulness of financial ratios in predicting business failure in China. The
study was based on China‟s stock market which was noted to be assuming more importance in
the global financial system yet relatively very little is known about its stock price behavior.
They applied a cross-validation procedure which involved using repeated random partitioning
where an estimating sample set is divided into training and validation set. The training subset
is used for preliminary model fitting and the validation set is used to test and tune the mode
weights during estimation.
The study by Chen et al (2006) also examined several models used in the prediction of
financial distress. These included the Linear Discriminant Analysis (LDA), Logistic
Regression Model (LRM), Decision Trees (DTs) and Neural Network (NN). The models were
analyzed for their respective accuracies.
The population under study was the companies listed in the Chinese Stock Exchange.
According to the Chinese Securities Regulatory Commission (CSRC) regulations, listed
corporations are given the label of “ST” (short for Special Treatment), if any of the following
four criteria has been met: (1) the external auditors express negative opinions or clearly state
that they are unable to express opinions on a firm‟s annual report; (2) the firm‟s financial
conditions are considered to be abnormal by the stock exchange or the China Security
Regulator Commission (CSRC); (3) a firm shows that the company has suffered losses for two
straight years or (4) the audited report shows that the shareholder‟s equity is lower than
registered capital. Criteria (3) and (4) are the most common reasons for a firm being
designated ST (Chen, Marshal, Zhang, & Ganesh, 2006). The study took ST as distressed
firms and NON-ST as healthy firms.
Chen et al collected financial information for publicly traded corporations from China‟s stock
Market and Accounting Research Database and Data Stream. The information was for the
period December 1999 to June 2003 and involved 1029 firms; 89 of them ST while 940 were
NON-ST. Ratios of firms in 1999 were used to predict ST announcements in 2001 in the
21
Estimation Sample. The sample was further divided into two parts; the training portion, used
to generate parameters and the validation portion used to confirm the accuracy of the
parameters. Tests were then conducted on the ability of ratios in 2001 to predict business
failure in 2003.
Based on extensive literature review, Chen et al computed 34 ratios which were classified in
seven broad categories: Liquidity, Asset Utilization, Long-Term Solvency, Profitability, Cash
Flow, Market Valuation, and Size.
The research found that the number of ratios selected by each model were significantly
different with the Decision Tree model and Logistic Regression Model having the minimum
number of predictors, only two variables. LDA model had ten ratios while the Neural
Network (NN) model had twenty ratios.
The study found that the predictor which was common to all the models was the Earnings Per
Share (EPS). It was also found that the ratios selected by each technique lacked consistency.
The study concluded that the five most significant financial ratio predictors are Earning Before
Interest to Total Asset (EBITTA), Earning Per Share (EPS), Total Debt to Total Asset
(TDTA), Price to Book ratio (PB) and Current Ratio (CR). The selected predictors propose
that firms with illiquidity, low operating efficiency and high financial leverage could have
high probability of business failure.
The study emphasizes the importance of looking at financial distress in its various stages of
financial distress including cash shortage, financial insolvency and total insolvency.
The study also concluded that the four models Linear Discriminant Analysis (LDA), Logistic
Regression Model (LRM), Decision Trees (DTs) and Neural Network (NN) achieved a
prediction accuracy ranging from 78% to 93% of correct classification of all failed firms for
two years prior to ST announcement date. The results also indicated that Logistic Regression
and Neural Network models were the optimal prediction models.
22
2.5 Accuracy of predictive models for financial distress
2.5.1 Financial characteristics that assess and predict corporate financial distress
A study, Prediction of Distress and identification of Potential M & As Targets in UK, by
Polemis and Gounopoulos (2012) sought to identify financial characteristics that assess and
predict financial distress in publicly traded firms quoted in the london Stock Exchange.
Their model had two stages; the first stage discriminates financially healthy or distressed
firms utilizing binary logit regression. The second stage made use of univeriate analysis. The
firms were further categorised into four possible outcomes: financially healthy, potentially
healthy targets and financially distressed and potentially distressed acquisition targets.
Polemis and Gounopoulos (2012) argued that influencial moral hazard models were more
appropriatete than single period (static) models such as Altman‟s Z-score model for predicting
bankruptcy. Hazard models are preferred due to three reasons: the first is when the sample
period is long, it is important to realize that some companies file for bankruptcy after many
years of being at risk. Secondly hazard models encompass explanatory variables that change
with time. Lastly they generate more efficient out of sample forecasts by employing
additional data.
The population covered by the study was companies in the United Kingdom (UK) as
contained in the WorldScope European Disclosure database and were mainly those from
manufacturing and retailing.
The analysis in the first stage of the model concentrates on the financial condition of firms
(healthy or distressed) and based on a set of 76 distressed/non-survived and continuing UK
companies between 1998 and 2003. Distressed companies and healthy companies were pair-
matched in accordance with the fiscal year, industry and size measured from their total assets
five years prior to liquidation, de-listing and so on. The sample of 76 firms chosen had 38 of
them being either bankrupt or distressed in the period of study while 38 were continuing
firms.
A stepwise discriminant analysis and a backward discriminant analysis was conducted on the
two years data for every firm in the sample from a list of 10 potential significant variables.
Only five variables were found to be statistically significant. These are:
23
1. working capital to market value plus total debt; a negative value for this ratio signals
that the firm might encounter problems in meeting its short-term obligations because
there are not enough current assets to cover them.
2. Total debt to market value plus total debt; this ratio measures the extent to which
borrowed funds have been used to finance the company‟s operatitions.
3. Pre-tax earnings to market value plus total debt;
4. Earnings before inerest and tax to market value plus total debt; a high value of this
ratio can provide a sign of solid operational performance.
5. Log of market value plus total debt (LGMVTD); this is a measure of total assets.
Correlation analysis was then done and the explanatory variables 3. and 4. Were found to be
highly correlated. Since the financial ratio 3. was more statistically significant that financial
ratio 4. The later was discarded with minimum loss of prediction accuracy. Thus the binary
logit model by Polemis and Gounopoulos (2012) uses four significant explanatory variables
and five years data from every sample. Variable MVTD (market value plus total debt) was
transformed into a logarithm because it provided a better fit for the model. They then came up
with the estimated model‟s variables and weights as follows:
Z= -2.8*Constant + 1.29*R1 – 1.34R2 + 1.68R3 + 0.65LGMVTD.
The multivariate techniques employed in this study are principal component analysis,
factor analysis, discriminant analysis and cluster analysis.
They found that financial distress could be identified as early as three years prior to the event.
The model attained an accuracy rate of 79 per cent one year prior to distress, 70 per cent two
years prior to distress and 60 per cent three years prior to distress.
The richness and importance of the subjcect of prediction of financial confirmed by the
uncertainty created by the continually changing business environment.More research should
be aimed at overcoming the limitations of dichotomous classifications. The study also
recommended that the inclusion of macroeconomic variables as well as non-financial ratios to
improve the predictive abilities of the modelks.
24
2.5.2 Ratios as predictors of financial distress
Mbanwie and Ngam (2009) in their study, financial ratios as bankruptcy indicators examined
some financial ratios using financial reports of groups of Swedish bankrupt and active
companies for the period 1996 to 2003 with the aim of determining the most significant and
reliable ratios for predicting bankruptcy.
The study involved the use of cross sectional analysis to compare similar financial ratios for
the two groups of companies with the aim explain the association between the explanatory
variables and business failure. Statistical models were then used to test the predictive power
of the financial ratios. Data from both groups were collected at a single point in time, at a
particular bankruptcy year, in order to minimize the externality effects which arise with
changes in time.
The ratios indicated that on average the healthy firms were more likely to repay their short
term obligations using cash or near cash assets than firms that are likely to go bankrupt. For
bankrupt firms the expenses were in excess of revenue while the active firms managed to
generate revenue in excess of costs.
The mean of CSTS ratio for bankrupt and active firms are 50.175 and 43.513 respectively.
These values indicate that on average, financially distressed firms take approximately 50 days
to recover cash from credit sales as supposed to 44 days for healthy firms. The values for both
groups of firms are fairly high. The lower value for group 2 firms also showed that their risk
associated with bad debts is lower and therefore benefits from cash flow than group 1 firms.
Lower CSTS may also be implied that group 2 firms have better debt control measures than
group 1 firms.
The mean of TSTA ratio of bankrupt firms (2.601) is lower than that of active firms (2.284).
This signifies that group 2 firms are more profitable than group 1 firms. It also indicates that
smaller investments are needed for group 2 firms than in group 1 firms to generate sales from
its total assets.
Financial ratios are useful and will provide valuable decision making information about a
business if used intelligently and with good judgment. The study reveals that profitability
ratios, liquidity ratios and financial leverage ratios are the most significant ratios for
predicting the probability of bankruptcy. The significant financial ratios are ranked based on
25
their predictive ability with the ratios of net profit to total assets ranked first, operating profit
to turnover second, liquid assets to current liabilities (quick ratio) third, long term debt to total
equity, current assets to current liabilities and total debts to total equity ranked fourth, fifth
and sixth respectively.
These results are consistent with those of previous studies that explained business failure
using financial ratios. Prior studies indicate that companies are more likely to go bankrupt if it
suffers depleting profitability, high leverage, and liquidity problems.
Findings also showed that debtors‟ collection period (CSTS) and sales-total assets (TSTA)
ratios are not related to bankruptcy. Therefore high debtors‟ collection period does not
necessarily mean a company is inefficient or that it has potential bad debts. Increasing CSTS
might mean that a company has adopted a strategy for attracting new customers (by allowing
longer collection period. More so, the claim that companies with low or decreasing sales to
total assets (TSTA) ratio are more likely to go bankrupt is rejected. Increase in TSTA does not
necessarily mean a company has credible performance. The increase might be caused by
decrease in total assets as a result of written down obsolete inventories which is a loss to the
company.
Mbanwie and Ngam (2009) observed further investigations may be required to determine why
certain ratios fluctuate. Secondly, the predictive ability of financial ratios is discriminative;
some financial ratios are more powerful indicators of bankruptcy than others irrespective of
their categorization. Thirdly, univariate statistical test is crucial in generating most significant
single bankruptcy ratios. The financial ratios are related to each other and a combination of
financial ratios will do a better job than a single predictive bankruptcy ratio.
2.5.3 Financial ratios that one should use for analysis of a firm’s financial status
Ratios are many and it is rarely possible or practical to use all of them when analyzing a
firm‟s financial statement. This is more so because some of them are complex and it would be
take a longer time to compute and apply them. The statistical value of each ratio as a predictor
is also different. It is therefore necessary to know which ratios to use.
Hossari and Rahman, (2005) in their paper, A Comprehensive Formal Ranking of the
Popularity of Financial Ratios in Multivariate Modeling of Corporate collapse, identified and
analyzed 48 financial ratios and ranked them according to their usefulness as portrayed in 53
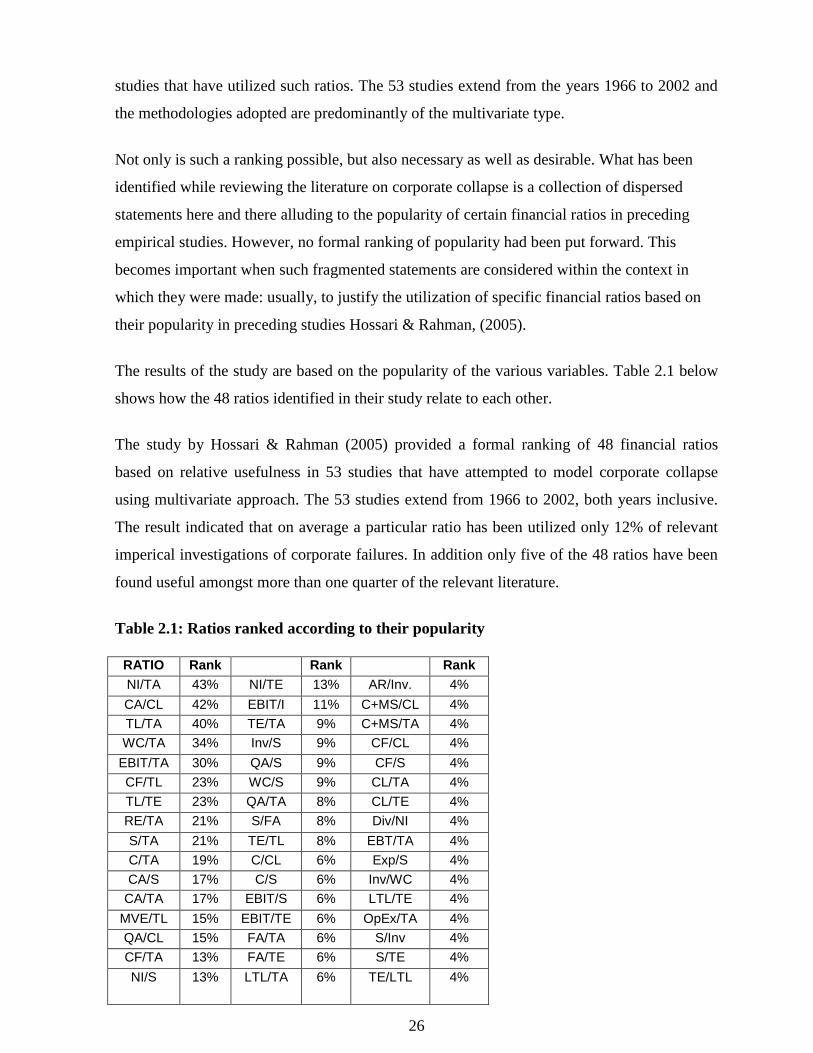
26
studies that have utilized such ratios. The 53 studies extend from the years 1966 to 2002 and
the methodologies adopted are predominantly of the multivariate type.
Not only is such a ranking possible, but also necessary as well as desirable. What has been
identified while reviewing the literature on corporate collapse is a collection of dispersed
statements here and there alluding to the popularity of certain financial ratios in preceding
empirical studies. However, no formal ranking of popularity had been put forward. This
becomes important when such fragmented statements are considered within the context in
which they were made: usually, to justify the utilization of specific financial ratios based on
their popularity in preceding studies Hossari & Rahman, (2005).
The results of the study are based on the popularity of the various variables. Table 2.1 below
shows how the 48 ratios identified in their study relate to each other.
The study by Hossari & Rahman (2005) provided a formal ranking of 48 financial ratios
based on relative usefulness in 53 studies that have attempted to model corporate collapse
using multivariate approach. The 53 studies extend from 1966 to 2002, both years inclusive.
The result indicated that on average a particular ratio has been utilized only 12% of relevant
imperical investigations of corporate failures. In addition only five of the 48 ratios have been
found useful amongst more than one quarter of the relevant literature.
Table 2.1: Ratios ranked according to their popularity
RATIO Rank Rank Rank
NI/TA 43% NI/TE 13% AR/Inv. 4%
CA/CL 42% EBIT/I 11% C+MS/CL 4%
TL/TA 40% TE/TA 9% C+MS/TA 4%
WC/TA 34% Inv/S 9% CF/CL 4%
EBIT/TA 30% QA/S 9% CF/S 4%
CF/TL 23% WC/S 9% CL/TA 4%
TL/TE 23% QA/TA 8% CL/TE 4%
RE/TA 21% S/FA 8% Div/NI 4%
S/TA 21% TE/TL 8% EBT/TA 4%
C/TA 19% C/CL 6% Exp/S 4%
CA/S 17% C/S 6% Inv/WC 4%
CA/TA 17% EBIT/S 6% LTL/TE 4%
MVE/TL 15% EBIT/TE 6% OpEx/TA 4%
QA/CL 15% FA/TA 6% S/Inv 4%
CF/TA 13% FA/TE 6% S/TE 4%
NI/S 13% LTL/TA 6% TE/LTL
4%

27
The comprehencive ranking of the usefulness of financial ratios in multivariate modeling of
corporate failiure provides a common ground for researchers to refer to in selecting financial
ratios in future imperical investigations of corporate failures particularly with respect to
model building using multivariate approach. The common ground will also make comparative
analysis more affordable in future.
2.5.4 Predicting financial Distress using Rough Set Methodology
Zongjun et al (2007) did a study to empirically estimate a Rough set model in financial
distress prediction of Chinese listed companies. The study also assessed model‟s classification
accuracy.
The methodology used by Zongjun et al, rough set method, is a mathematical tool used to
analyze data which is generally indiscernible based on existing information. Vague
information causes indiscernibility of objects due to the nature of data available. This prevents
their precise assignment to particular set or class. A rough set is thus considered as a
collection of objects that, in general, cannot be precisely characterized in terms of value of the
set of attributes. The collection of objects cannot be precisely characterized in terms of the
value of the set attributes but a lower and upper approximation can be.
A decision table which contain condition and decision attributes specifies what decision
(actions) should be undertaken when some conditions are satisfied. The researchers then
performed a rough set analysis using ROSE software provided by the institute of Computing
Science of Pognan university of Technology.
The population under study included the companies listed in the Chinese stock exchange
which numbered 1.365 in the period 2005 for Shanghai stock exchange (SHSE), 829, and
Shenzhen Stock Exchange (SZSE), 536.
The study employed samples consisting of companies experiencing financial distress in the
years 1998 through 2005 in the combination with their matching companies which are non-
distressed. The matching was done based on the first two digits of the principle four-digit SIC
code and the average total assets of the last three years prior to finance distress.
28
The final sample consisted of 212 financial distressed companies together with 212 matching,
referred to as, ST, Serial Treatment, while healthy companies being referred to as non- ST.
The data was derived from CCER (China Centre for Economic Research database. The
analysis used data one year prior to failure to obtain decision rules. Thus if a financially
distressed firm is ST in the year 2005 then data collected is that for year 2004 and the
matching company is dealt with the same way.
The study found that the growth ratio per share of equity, net return on assets, earnings per
share , interest coverage, ownership concentration coefficient , net profit margin, pledge,
retained earnings ratio and total asset turn-over have a strong classification power in financial
distress prediction of Chinese listed companies. Prediction models that combine both financial
and non-financial ratios outperform the ones just containing financial ratios. The prediction
accuracy of the model was 88.9 percent with an error factor of 11.1 percent.
In conclusion Zongjun el al study is one of the first efforts to explore the prediction of
financial distressed firms in China using rough set. So it adds to the growing financial distress
prediction literature and add new dimension to the asset business failure literature. The study
is of interest, firstly because China‟s stock market has experienced rapid expansion. Secondly
Chinese market is independent of US stock market and so provided valuable out of sample
test of the current literature which has focused mainly on that market.
The study recommends that it is important to consider all assets of the firm, not just financial
information but non financial characteristics as well. Non-financial variables including
ownership concentration coefficient, affiliated debt, pledge (ownership reformation) are
powerful to some extent. In particular, ownership structure and governance have great
influence in the company‟s situation.
2.5 Chapter Summary:
This chapter looked at previous studies on financial ratios and their ability to predict financial
distress. Various predictive models are reviewed and compared in the chapter. The next
chapter details the research methodology that the study will apply. This includes the research
design, population and sample design, data collection methods, research procedure and data
analysis.
29
CHAPTER THREE
3.0 RESEARCH METHODOLOGY
3.1 Introduction
This chapter details the research design and the methodology, followed by a description of the
population and sample design. Thereafter the chapter provides the sample size, data collection
method and the research procedures. The last sub section provides the procedure applied in
the analysis of the data.
3.2 Research Design
A research design is the arrangement of conditions for collection and analysis of data in a
manner that aims to combine relevance to the research purpose with economy in procedure.
The research design is the conceptual structure within which is conducted; it constitutes the
blueprint for the collection, measurement and analysis of data (Kothari & Garg, 2014)
If we can provide a plausible explanation for an event which has occurred, it is desirable to be
able to predict when and in what situations the event will occur. A predictive study is as
rooted in theory as in explanation (Cooper & Schindler, 2000).
The research design is the blueprint for fulfilling objectives and answering questions.
Selecting a design may be complicated by the availability of a large variety of methods,
techniques, procedures, protocols and sampling plans (Cooper & Schindler, 2000).
The techniques employed in data collection, sample and variable selection must be carefully
thought-out. If the technique is not well planned, it is very likely that we collect data that is
not in-line with our research interest thus, rendering analysis and results faulty.
A descriptive study is concerned with specific predictions, narration of facts and
characteristics of variables under study (Kothari & Garg, 2014). This research sought to
firstly, find the variables that reveal conditions conducive to financial distress. Secondly, the
study sought to find how good financial ratios are in predicting financial distress and finally
which financial ratios are most accurate in predicting financial distress. This study is
predictive in nature and so it is a descriptive study.

30
This study used regression analysis and discriminant function analysis. This type of research
design is used to model dichotomous outcome variables. The aim of the regression analysis is
to assess the significance of the model as composed by the variables under study. The primary
goals of discriminant function analysis are to find the dimension or dimensions along which
groups differ and to find classification functions to predict group membership (Tabachnick &
Fidell, 1996). The outcome is modeled as a combination of the predictor variables.
Discriminant function analysis allows one to predict a discrete outcome such as group
membership from a set of variables that may be continuous, discrete, dichotomous, or a mix
(Tabachnick & Fidell, 1996). The goal of the analysis is to correctly predict category of
outcome for individual cases.
Once a relationship between the outcome and the set of predictors is established the next step
is to simplify the model by eliminating some predictors while still maintaining strong
prediction. Stepwise discriminant analysis will be used to assign some predictors higher
priority than others. This will enable selecting the best variables for forming the discriminant
function.
In this study we are interested in finding out how variables such as financial ratios
(independent variables) affect the categorization of a firm in to financially distressed or non-
distressed (dependent variables). The outcome variable is binary (1,2); healthy firms or
distressed firms. The independent variables also referred to as predictor variables are the
financial ratios which can number over 50 but this study will involve only the first 12 of them,
as presented in Table 4.1 and as ranked by Hossari and Rahman, (2005) in their paper, A
Comprehensive Formal Ranking of the Popularity of Financial Ratios in Multivariate
Modeling of Corporate collapse The data to be used is continuous over a period of 5 years
from the year 2002 to 2006.
This study uses longitudinal design to ensure a satisfactory level of validity and reliability.
This type of research design is used for studies that drawing of phenomena at vertical and
horizontal levels of analysis and the interconnections between those levels through time with
the purpose to detect and explain correlation between the explanatory variables and the
condition under investigation (Bryman & Bell, 2007). The study examines financial ratios on
more than one case study (financially distressed and non-distressed) because the interest is in
variation. Since financial ratios are quantitative, variation between the two groups could
31
easily be gauged. Data from both groups was collected for the period under study with a view
to establish association of variables and to minimize ambiguity in conclusions.
3.3 Population and Sampling Design
3.3.1 Population
The sample is drawn from the companies listed in the Nairobi Stock Exchange in the non-
financial sector between the years 2002 to 2006. The total number of these companies is 41
and they are specified in APPENDIX 3.
3.3.2 Sampling design
Sampling is defined as the selection of some part of an aggregate or totality on the basis of
which a judgment or inference about the aggregate or totality is made. It is the process of
obtaining information about an entire population by examining only a part of it (Kothari &
Garg, 2014). A sample design is a definite plan for obtaining a sample from a given
population. It refers to the technique or the procedure the researcher would adopt in selecting
items for the sample.
If the comparison of distressed and non-distressed firms is to be meaningful, the sample of
non-distressed firms should be drawn from the same population as that of the distressed firms.
All the companies are taken from the non financial sector.
Financially healthy firms were listed alongside the financially distressed firms on the other
hand but marked or grouped as „1‟ and „2‟ respectively. The sample design offers a sampling
technique for selecting non-distressed firms from a relevant population, because it draws non-
distressed firms only from the same industry class or where distress has actually occurred.
The sample design is not the only acceptable approach but is a convenient one, in view of the
earlier study (Beaver, 1966).
3.3.2.1 Sample Frame
A decision has to be taken concerning a sample unit before selecting the sample. The list of
sampling units is the sample frame. Sample frame contains all items of a universe (Kothari &
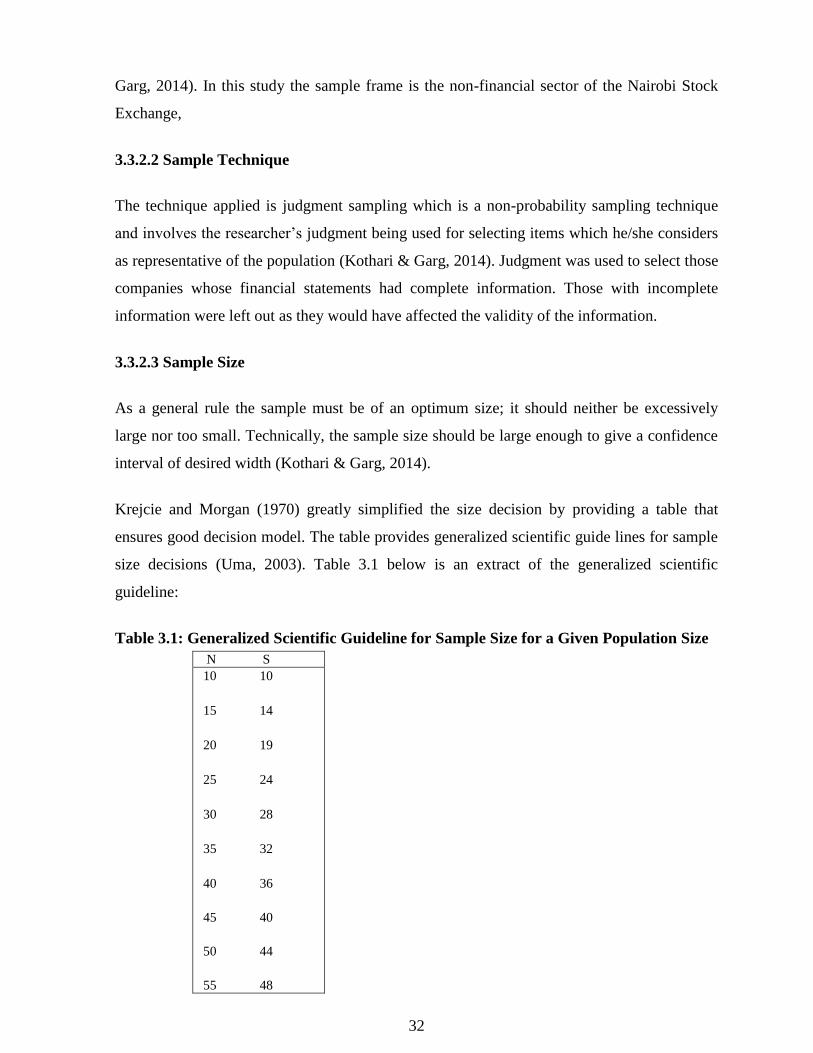
32
Garg, 2014). In this study the sample frame is the non-financial sector of the Nairobi Stock
Exchange,
3.3.2.2 Sample Technique
The technique applied is judgment sampling which is a non-probability sampling technique
and involves the researcher‟s judgment being used for selecting items which he/she considers
as representative of the population (Kothari & Garg, 2014). Judgment was used to select those
companies whose financial statements had complete information. Those with incomplete
information were left out as they would have affected the validity of the information.
3.3.2.3 Sample Size
As a general rule the sample must be of an optimum size; it should neither be excessively
large nor too small. Technically, the sample size should be large enough to give a confidence
interval of desired width (Kothari & Garg, 2014).
Krejcie and Morgan (1970) greatly simplified the size decision by providing a table that
ensures good decision model. The table provides generalized scientific guide lines for sample
size decisions (Uma, 2003). Table 3.1 below is an extract of the generalized scientific
guideline:
Table 3.1: Generalized Scientific Guideline for Sample Size for a Given Population Size
N S
10 10
15 14
20 19
25 24
30 28
35 32
40 36
45 40
50 44
55 48

33
Where: N is the population
S is the appropriate sample size
Table 3.2: Sample Size
Company Group Total
Number
% of
Population
Sample Size
Non-Financially
Distressed
33 80.5 26
Financially Distressed 8 19.5 7
Total 41 100 33
All the companies whose financial statements were found complete for the period under study
were considered in the study. The sample is thus a good representation of the population.
3.4 Data Collection Methods
The study used secondary data. This included the financial statements of the various
companies listed in the Nairobi Stock Exchange in the non-financial sector. The study used
the financial statements as contained in the Nairobi Stock Exchage Handbooks for the years
2005, 2007 and 2012. From the list of companies the study considered only those in the non-
financial sector. Some ratios are provided in the financial statements. However those ratios
not provided and the averages were computed using excel spreadsheets. It is the averages that
formed the data to for analysis.
3.5 Research Procedure
Financial statements of companies listed in the Nairobi Stock Exchange and in the non
financial sector were taken. Twelve financial ratios were computed for each company. The 12
ratios listed as the most popular by previous studies. The means of each ratio over the period
understudy are then computed for each company. The mean is important as it summarizes the
data and is a central tendency.
34
The companies are listed with the means of the various ratios. The companies are then
grouped into financially healthy indicated as „1‟ and financially distressed indicated as „2‟.
The criteria to distinguish the financially distress is those companies that made losses for two
(2) straight years or where the share holders equity is lower than the registered capital.
The study then carried out discriminant function analysis on the data and came up with a
predictive model. One method of including variables in multiple regression is the stepwise
method. This is used when there are a large number of possible independent variables that are
to be explored so as to find a smaller set of these variables to use in predicting the dependent
variable, eliminating other variables that add only insignificant or trivial amount of explained
variation in the dependent variable beyond the smaller set (Allen, 2010).
The stepwise discriminant analysis can either be forward stepwise method or backward
elimination method. In forward stepwise method the analysis starts without any variables and
successively adds and deletes variables until a pre-specified stopping criterion is satisfied. The
stopping criterion is usually based on the p value of the F statistic associated with a test of
determining if including or deleting the next variable adds significantly to explaining the
group separation, beyond the contribution of those variables that are already present in the
model (Grimm & Yarnold, 1994)
Stepwise backward elimination methods starts the analysis with all the variables included in
the model and successively eliminating the least important variables from the model, until
only significant variables remain (Grimm & Yarnold, 1994).
Situations arise when a number of potential discriminator variables are known, but there is no
indication as to which would be the best set of variables for forming the discriminant
function. Stepwise discriminant analysis is a useful technique for selecting the best set of
discriminating variables to form the discriminant function (Sharma, 1996).
The study will use backward stepwise method where by all the variables will be entered in
the equation then the variable with the lowest partial correlation is removed from the batch
and the equation computed again. This identifies the next variable to be eliminated based on
the partial correlation. The process is repeated until the only remaining variable left in the
equation are those that add significant or meaningful amount of explained variation in the
dependent variable.
35
3.6 Data Analysis Methods
The study computed the selected financial ratios for each of the companies in the sample. The
study then computed the average for each ratio for each company in the sample over the
period under study. The data was summarized in a table form with the columns including
company number, group and the twelve ratios in the other columns. The data was then fed
into computer statistical software, (Statistical Package for Social Sciences) for analysis. SPSS
helped to measure central tendencies; relationship between variables and determine to what
extent independent variables affected the dependent variable. The analyzed data was then
presented in table form to facilitate ease of interpretation.
3.7 Chapter Summary
This chapter focused on the methodology that was used in conducting the study. The research
design that was applied was descriptive. The population, the sample frame, the
Sample size and the sampling technique used have been specified. Secondary data will be
used. Data will be analyzed using SPSS and summarized for presentation in tables and
figures. The next chapter presents the research findings as guided by the research questions.

36
CHAPTER FOUR
4.0 RESULTS AND FINDINGS
4.1 Introduction
This chapter gives the results and findings of the study by presenting and explaining the data.
The study intended to find out whether there are financial variables that reveal financial
distress, how good financial ratios are in predicting financial distress and which financial
ratios are most accurate in predicting financial distress.
The study is based on secondary data which was obtained from financial statements in the
Nairobi Stock Exchange (NSE) year books for the years 2005, 2007 and 2012. The population
included financial ratios computed from the financial statements companies listed in the NSE
which are in the non financial sector.
The chapter has two parts; the first part gives an analysis of the general information as
observed in the statements and tables. The second part analyses and explores the observations
in relation to the research questions which the study set out to answer.
4.2 General Information
4.2.1 Financial Statements
The study looks at financial statements for non financial sector companies listed in Nairobi
stock Exchange (NSE) for the period 2002 to 2011. For purposes of the research questions the
study considered the statements for the five years from 2002 to 2006. The financial statements
under study are for 33 companies out of a total of 44 as some companies were left out due to
lack of complete data. A list of the companies is given in Appendix III.
4.2.2 Financial Ratios
From the financial statements twelve (12) ratios were computed for each of the companies.
The 12 ratios are listed and explained in Table 4.1 below. The ratios were considered for a
period of five years from 2002 to 2006. The means of each of the ratios for the same period
was computed.
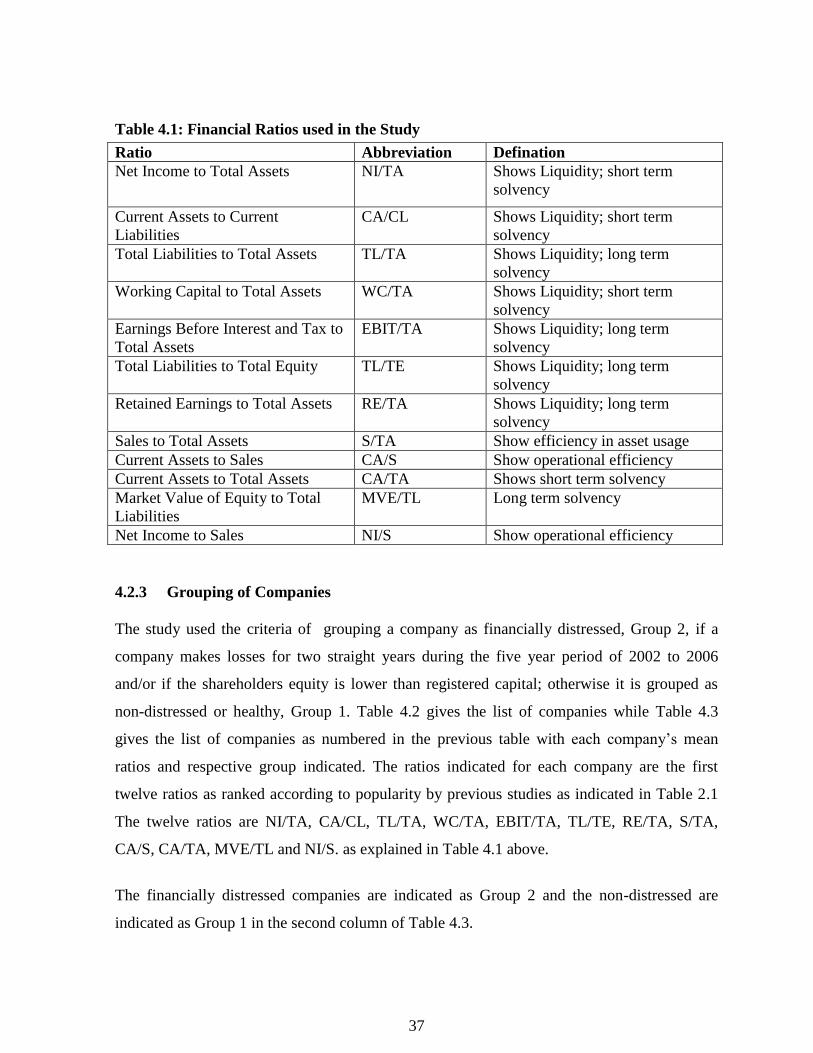
37
Table 4.1: Financial Ratios used in the Study
Ratio Abbreviation Defination
Net Income to Total Assets NI/TA Shows Liquidity; short term
solvency
Current Assets to Current
Liabilities
CA/CL Shows Liquidity; short term
solvency
Total Liabilities to Total Assets TL/TA Shows Liquidity; long term
solvency
Working Capital to Total Assets WC/TA Shows Liquidity; short term
solvency
Earnings Before Interest and Tax to
Total Assets
EBIT/TA Shows Liquidity; long term
solvency
Total Liabilities to Total Equity TL/TE Shows Liquidity; long term
solvency
Retained Earnings to Total Assets RE/TA Shows Liquidity; long term
solvency
Sales to Total Assets S/TA Show efficiency in asset usage
Current Assets to Sales CA/S Show operational efficiency
Current Assets to Total Assets CA/TA Shows short term solvency
Market Value of Equity to Total
Liabilities
MVE/TL Long term solvency
Net Income to Sales NI/S Show operational efficiency
4.2.3 Grouping of Companies
The study used the criteria of grouping a company as financially distressed, Group 2, if a
company makes losses for two straight years during the five year period of 2002 to 2006
and/or if the shareholders equity is lower than registered capital; otherwise it is grouped as
non-distressed or healthy, Group 1. Table 4.2 gives the list of companies while Table 4.3
gives the list of companies as numbered in the previous table with each company‟s mean
ratios and respective group indicated. The ratios indicated for each company are the first
twelve ratios as ranked according to popularity by previous studies as indicated in Table 2.1
The twelve ratios are NI/TA, CA/CL, TL/TA, WC/TA, EBIT/TA, TL/TE, RE/TA, S/TA,
CA/S, CA/TA, MVE/TL and NI/S. as explained in Table 4.1 above.
The financially distressed companies are indicated as Group 2 and the non-distressed are
indicated as Group 1 in the second column of Table 4.3.

38
Table 4.2: Names of Companies in the analysis
1 A. Bauman
2 Athi-River Mining Limited
3 Bamburi Cement Company Limited
4 Boc Kenya Limited
5 British American Tobacco Kenya Limited
6 Car And General (Kenya) Limied
7 City Trust
8 Cmc Holdings Limited
9 Crown-Berger Kenya Limited
10 Eaagads Limited
11 East African Breweries Limited
12 East African Cables Limited
13 East African Portland Cement Company
14 Express Kenya Limited
15 Kakuzi Limited
16 Kapchorua Tea Company Limited
17 Kenya Airways Limited
18 Kenya Oil Company Limited
19 Limuru Tea Company Limited
20 Marshalls (Ea) Ltd
21 Mumias Sugar Company Ltd
22 Nation Media Group Limited
23 Olympia Capital Holdings Limited
24 Rea Vipingo Plantations Ltd
25 Sameer Africa Limited
26 Sasini Tea And Coffee Limited
27 Standard Group LimitedTable of Content
28 The Kenya Power & Lighting Co. Ltd
29 Total Kenya Ltd
30 TPS Eastern Africa Limited (Serena Hotels)
31 Unga Group Limited
32 Unilever Tea
33 Williamson Tea Kenya Limited
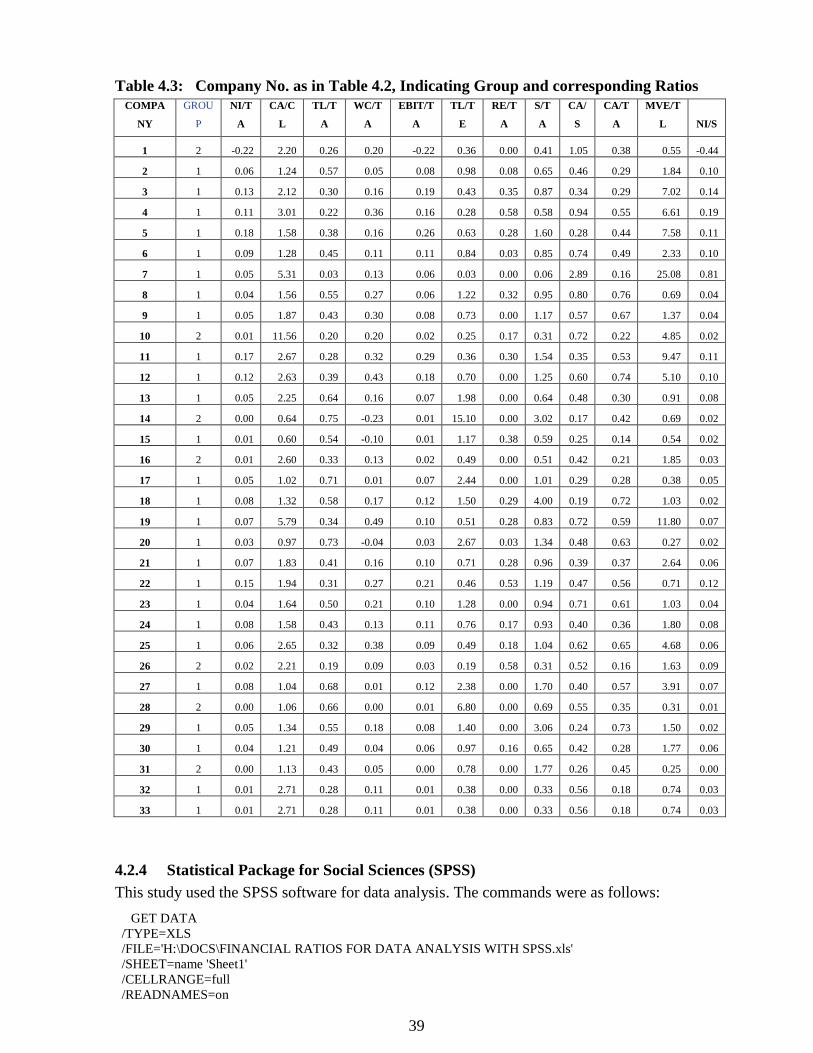
39
Table 4.3: Company No. as in Table 4.2, Indicating Group and corresponding Ratios
COMPA
NY
GROU
P
NI/T
A
CA/C
L
TL/T
A
WC/T
A
EBIT/T
A
TL/T
E
RE/T
A
S/T
A
CA/
S
CA/T
A
MVE/T
L NI/S
1 2 -0.22 2.20 0.26 0.20 -0.22 0.36 0.00 0.41 1.05 0.38 0.55 -0.44
2 1 0.06 1.24 0.57 0.05 0.08 0.98 0.08 0.65 0.46 0.29 1.84 0.10
3 1 0.13 2.12 0.30 0.16 0.19 0.43 0.35 0.87 0.34 0.29 7.02 0.14
4 1 0.11 3.01 0.22 0.36 0.16 0.28 0.58 0.58 0.94 0.55 6.61 0.19
5 1 0.18 1.58 0.38 0.16 0.26 0.63 0.28 1.60 0.28 0.44 7.58 0.11
6 1 0.09 1.28 0.45 0.11 0.11 0.84 0.03 0.85 0.74 0.49 2.33 0.10
7 1 0.05 5.31 0.03 0.13 0.06 0.03 0.00 0.06 2.89 0.16 25.08 0.81
8 1 0.04 1.56 0.55 0.27 0.06 1.22 0.32 0.95 0.80 0.76 0.69 0.04
9 1 0.05 1.87 0.43 0.30 0.08 0.73 0.00 1.17 0.57 0.67 1.37 0.04
10 2 0.01 11.56 0.20 0.20 0.02 0.25 0.17 0.31 0.72 0.22 4.85 0.02
11 1 0.17 2.67 0.28 0.32 0.29 0.36 0.30 1.54 0.35 0.53 9.47 0.11
12 1 0.12 2.63 0.39 0.43 0.18 0.70 0.00 1.25 0.60 0.74 5.10 0.10
13 1 0.05 2.25 0.64 0.16 0.07 1.98 0.00 0.64 0.48 0.30 0.91 0.08
14 2 0.00 0.64 0.75 -0.23 0.01 15.10 0.00 3.02 0.17 0.42 0.69 0.02
15 1 0.01 0.60 0.54 -0.10 0.01 1.17 0.38 0.59 0.25 0.14 0.54 0.02
16 2 0.01 2.60 0.33 0.13 0.02 0.49 0.00 0.51 0.42 0.21 1.85 0.03
17 1 0.05 1.02 0.71 0.01 0.07 2.44 0.00 1.01 0.29 0.28 0.38 0.05
18 1 0.08 1.32 0.58 0.17 0.12 1.50 0.29 4.00 0.19 0.72 1.03 0.02
19 1 0.07 5.79 0.34 0.49 0.10 0.51 0.28 0.83 0.72 0.59 11.80 0.07
20 1 0.03 0.97 0.73 -0.04 0.03 2.67 0.03 1.34 0.48 0.63 0.27 0.02
21 1 0.07 1.83 0.41 0.16 0.10 0.71 0.28 0.96 0.39 0.37 2.64 0.06
22 1 0.15 1.94 0.31 0.27 0.21 0.46 0.53 1.19 0.47 0.56 0.71 0.12
23 1 0.04 1.64 0.50 0.21 0.10 1.28 0.00 0.94 0.71 0.61 1.03 0.04
24 1 0.08 1.58 0.43 0.13 0.11 0.76 0.17 0.93 0.40 0.36 1.80 0.08
25 1 0.06 2.65 0.32 0.38 0.09 0.49 0.18 1.04 0.62 0.65 4.68 0.06
26 2 0.02 2.21 0.19 0.09 0.03 0.19 0.58 0.31 0.52 0.16 1.63 0.09
27 1 0.08 1.04 0.68 0.01 0.12 2.38 0.00 1.70 0.40 0.57 3.91 0.07
28 2 0.00 1.06 0.66 0.00 0.01 6.80 0.00 0.69 0.55 0.35 0.31 0.01
29 1 0.05 1.34 0.55 0.18 0.08 1.40 0.00 3.06 0.24 0.73 1.50 0.02
30 1 0.04 1.21 0.49 0.04 0.06 0.97 0.16 0.65 0.42 0.28 1.77 0.06
31 2 0.00 1.13 0.43 0.05 0.00 0.78 0.00 1.77 0.26 0.45 0.25 0.00
32 1 0.01 2.71 0.28 0.11 0.01 0.38 0.00 0.33 0.56 0.18 0.74 0.03
33 1 0.01 2.71 0.28 0.11 0.01 0.38 0.00 0.33 0.56 0.18 0.74 0.03
4.2.4 Statistical Package for Social Sciences (SPSS)
This study used the SPSS software for data analysis. The commands were as follows:
GET DATA
/TYPE=XLS
/FILE='H:\DOCS\FINANCIAL RATIOS FOR DATA ANALYSIS WITH SPSS.xls'
/SHEET=name 'Sheet1'
/CELLRANGE=full
/READNAMES=on
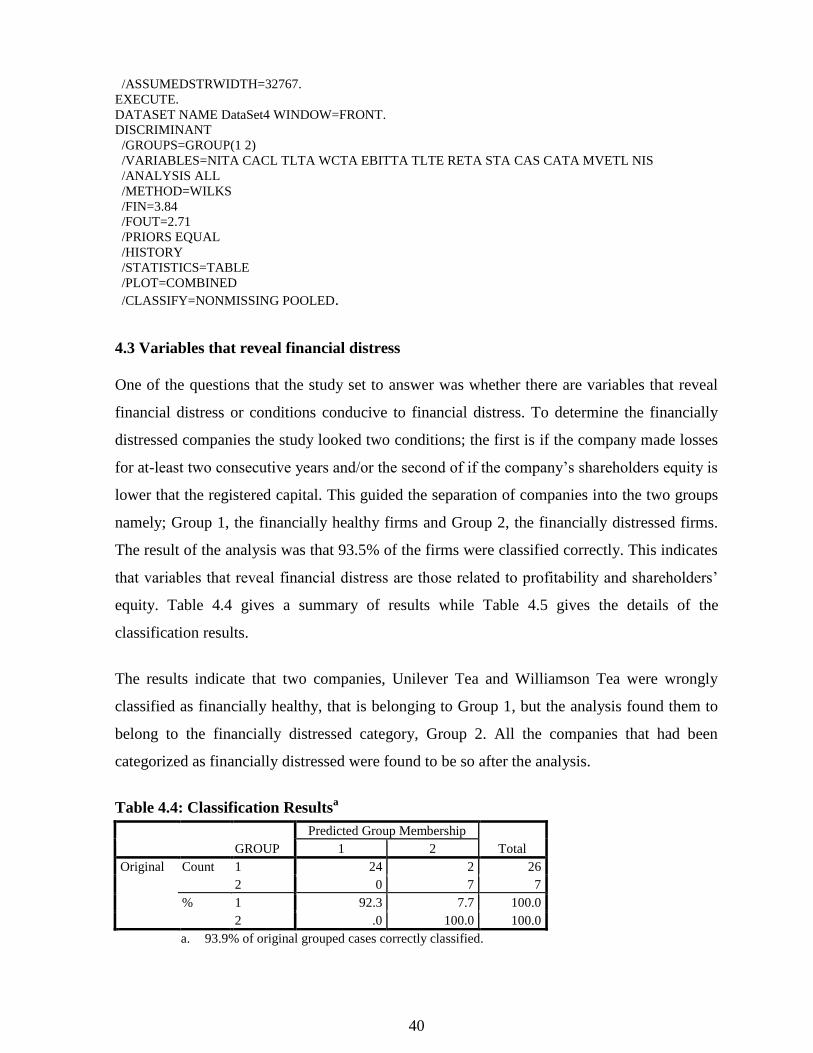
40
/ASSUMEDSTRWIDTH=32767.
EXECUTE.
DATASET NAME DataSet4 WINDOW=FRONT.
DISCRIMINANT
/GROUPS=GROUP(1 2)
/VARIABLES=NITA CACL TLTA WCTA EBITTA TLTE RETA STA CAS CATA MVETL NIS
/ANALYSIS ALL
/METHOD=WILKS
/FIN=3.84
/FOUT=2.71
/PRIORS EQUAL
/HISTORY
/STATISTICS=TABLE
/PLOT=COMBINED
/CLASSIFY=NONMISSING POOLED.
4.3 Variables that reveal financial distress
One of the questions that the study set to answer was whether there are variables that reveal
financial distress or conditions conducive to financial distress. To determine the financially
distressed companies the study looked two conditions; the first is if the company made losses
for at-least two consecutive years and/or the second of if the company‟s shareholders equity is
lower that the registered capital. This guided the separation of companies into the two groups
namely; Group 1, the financially healthy firms and Group 2, the financially distressed firms.
The result of the analysis was that 93.5% of the firms were classified correctly. This indicates
that variables that reveal financial distress are those related to profitability and shareholders‟
equity. Table 4.4 gives a summary of results while Table 4.5 gives the details of the
classification results.
The results indicate that two companies, Unilever Tea and Williamson Tea were wrongly
classified as financially healthy, that is belonging to Group 1, but the analysis found them to
belong to the financially distressed category, Group 2. All the companies that had been
categorized as financially distressed were found to be so after the analysis.
Table 4.4: Classification Resultsa
GROUP
Predicted Group Membership
Total 1 2
Original Count 1 24 2 26
2 0 7 7
% 1 92.3 7.7 100.0
2 .0 100.0 100.0
a. 93.9% of original grouped cases correctly classified.
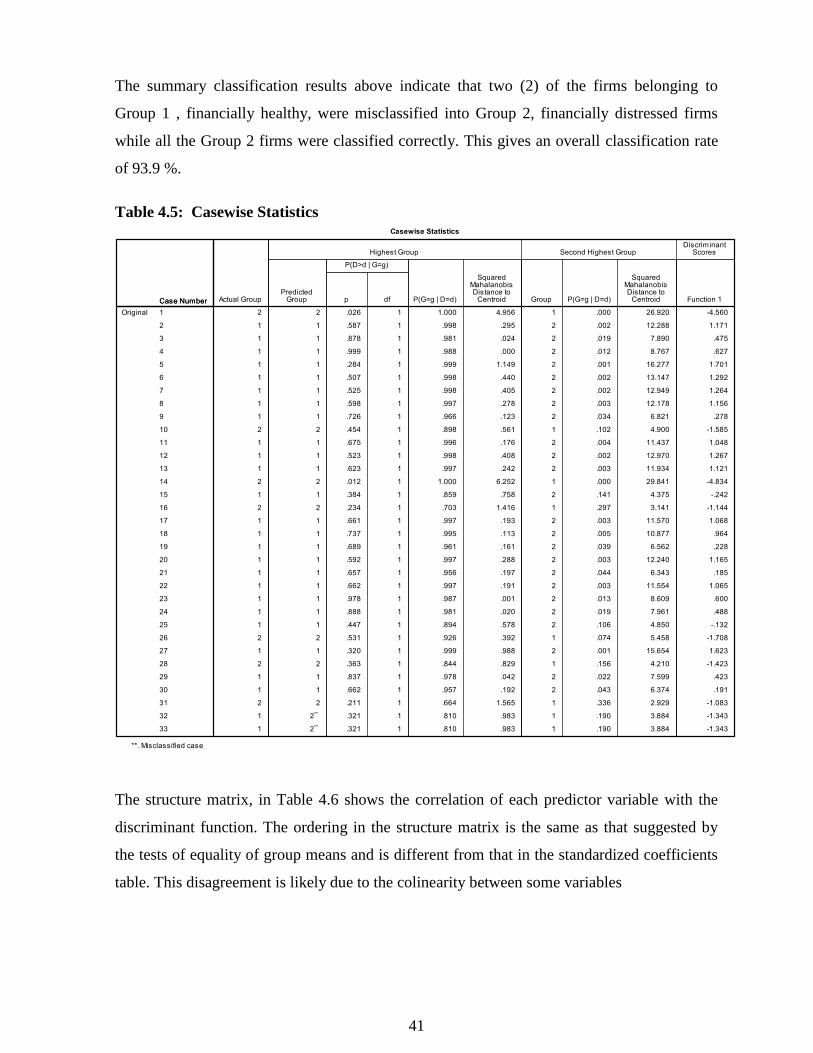
41
The summary classification results above indicate that two (2) of the firms belonging to
Group 1 , financially healthy, were misclassified into Group 2, financially distressed firms
while all the Group 2 firms were classified correctly. This gives an overall classification rate
of 93.9 %.
Table 4.5: Casewise Statistics
The structure matrix, in Table 4.6 shows the correlation of each predictor variable with the
discriminant function. The ordering in the structure matrix is the same as that suggested by
the tests of equality of group means and is different from that in the standardized coefficients
table. This disagreement is likely due to the colinearity between some variables
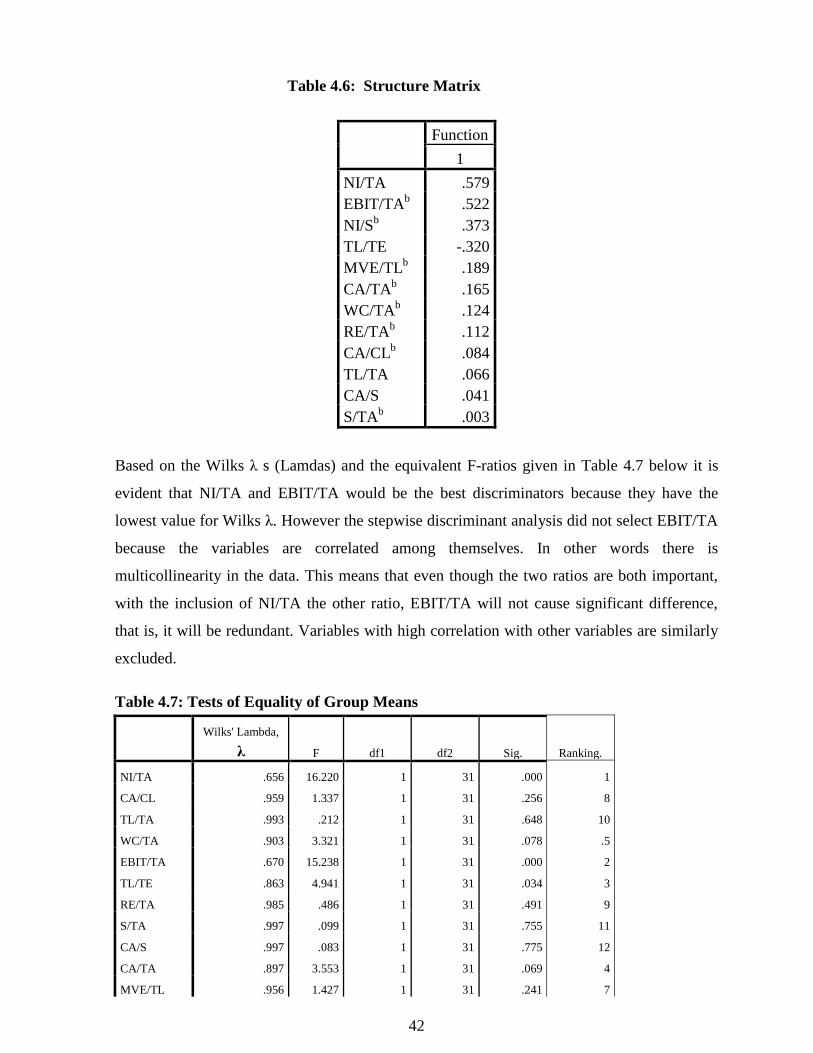
42
Table 4.6: Structure Matrix
Function
1
NI/TA .579
EBIT/TAb .522
NI/Sb .373
TL/TE -.320
MVE/TLb .189
CA/TAb .165
WC/TAb .124
RE/TAb .112
CA/CLb .084
TL/TA .066
CA/S .041
S/TAb .003
Based on the Wilks λ s (Lamdas) and the equivalent F-ratios given in Table 4.7 below it is
evident that NI/TA and EBIT/TA would be the best discriminators because they have the
lowest value for Wilks λ. However the stepwise discriminant analysis did not select EBIT/TA
because the variables are correlated among themselves. In other words there is
multicollinearity in the data. This means that even though the two ratios are both important,
with the inclusion of NI/TA the other ratio, EBIT/TA will not cause significant difference,
that is, it will be redundant. Variables with high correlation with other variables are similarly
excluded.
Table 4.7: Tests of Equality of Group Means
Wilks' Lambda,
λ F df1 df2 Sig. Ranking.
NI/TA .656 16.220 1 31 .000 1
CA/CL .959 1.337 1 31 .256 8
TL/TA .993 .212 1 31 .648 10
WC/TA .903 3.321 1 31 .078 .5
EBIT/TA .670 15.238 1 31 .000 2
TL/TE .863 4.941 1 31 .034 3
RE/TA .985 .486 1 31 .491 9
S/TA .997 .099 1 31 .755 11
CA/S .997 .083 1 31 .775 12
CA/TA .897 3.553 1 31 .069 4
MVE/TL .956 1.427 1 31 .241 7
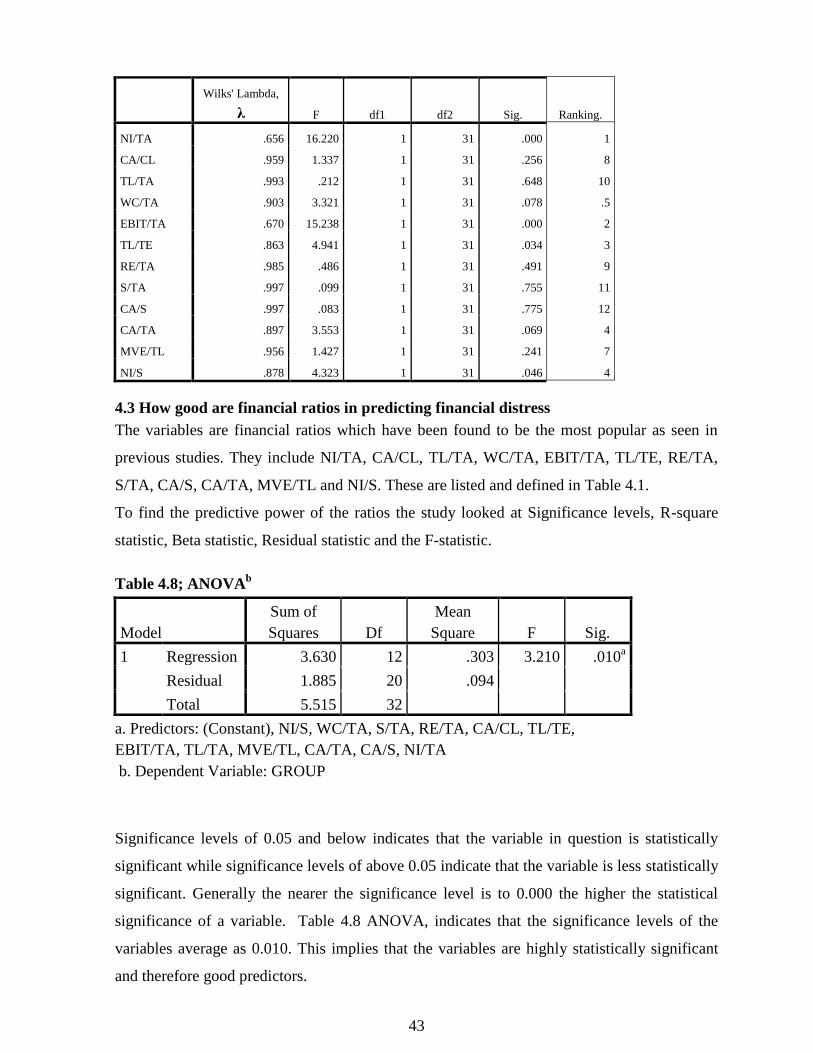
43
Wilks' Lambda,
λ F df1 df2 Sig. Ranking.
NI/TA .656 16.220 1 31 .000 1
CA/CL .959 1.337 1 31 .256 8
TL/TA .993 .212 1 31 .648 10
WC/TA .903 3.321 1 31 .078 .5
EBIT/TA .670 15.238 1 31 .000 2
TL/TE .863 4.941 1 31 .034 3
RE/TA .985 .486 1 31 .491 9
S/TA .997 .099 1 31 .755 11
CA/S .997 .083 1 31 .775 12
CA/TA .897 3.553 1 31 .069 4
MVE/TL .956 1.427 1 31 .241 7
NI/S .878 4.323 1 31 .046 4
4.3 How good are financial ratios in predicting financial distress
The variables are financial ratios which have been found to be the most popular as seen in
previous studies. They include NI/TA, CA/CL, TL/TA, WC/TA, EBIT/TA, TL/TE, RE/TA,
S/TA, CA/S, CA/TA, MVE/TL and NI/S. These are listed and defined in Table 4.1.
To find the predictive power of the ratios the study looked at Significance levels, R-square
statistic, Beta statistic, Residual statistic and the F-statistic.
Table 4.8; ANOVAb
Model
Sum of
Squares Df
Mean
Square F Sig.
1 Regression 3.630 12 .303 3.210 .010a
Residual 1.885 20 .094
Total 5.515 32
a. Predictors: (Constant), NI/S, WC/TA, S/TA, RE/TA, CA/CL, TL/TE,
EBIT/TA, TL/TA, MVE/TL, CA/TA, CA/S, NI/TA
b. Dependent Variable: GROUP
Significance levels of 0.05 and below indicates that the variable in question is statistically
significant while significance levels of above 0.05 indicate that the variable is less statistically
significant. Generally the nearer the significance level is to 0.000 the higher the statistical
significance of a variable. Table 4.8 ANOVA, indicates that the significance levels of the
variables average as 0.010. This implies that the variables are highly statistically significant
and therefore good predictors.
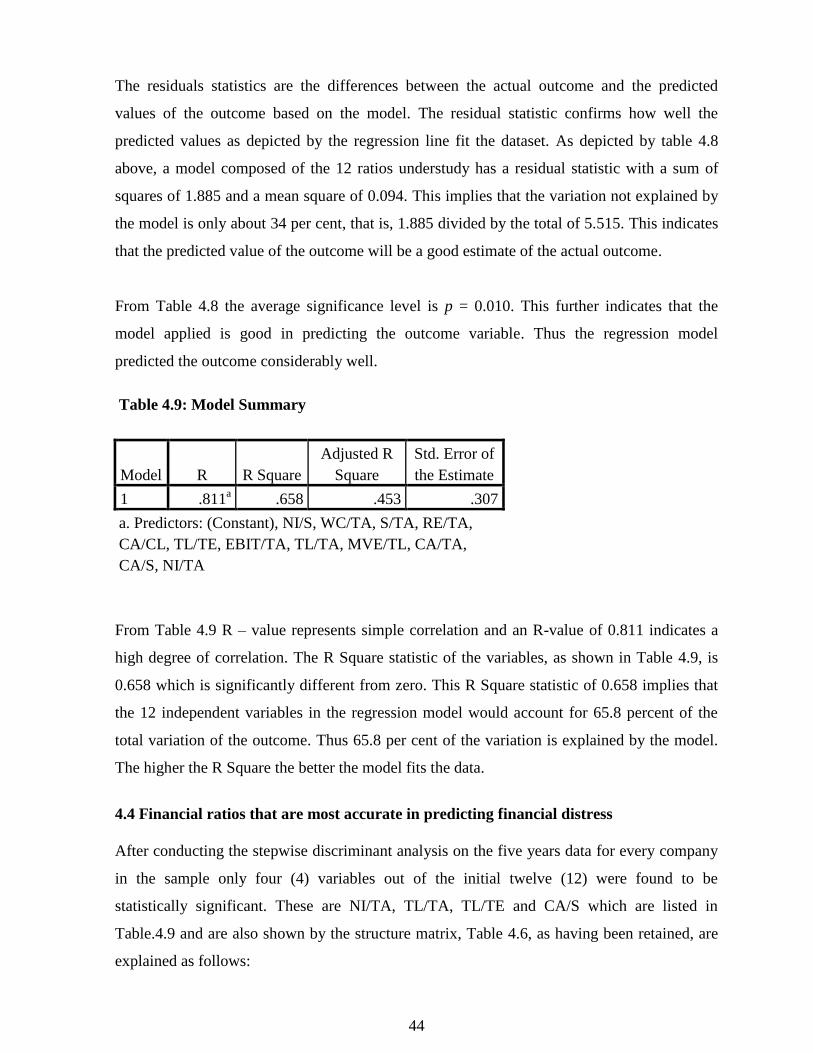
44
The residuals statistics are the differences between the actual outcome and the predicted
values of the outcome based on the model. The residual statistic confirms how well the
predicted values as depicted by the regression line fit the dataset. As depicted by table 4.8
above, a model composed of the 12 ratios understudy has a residual statistic with a sum of
squares of 1.885 and a mean square of 0.094. This implies that the variation not explained by
the model is only about 34 per cent, that is, 1.885 divided by the total of 5.515. This indicates
that the predicted value of the outcome will be a good estimate of the actual outcome.
From Table 4.8 the average significance level is p = 0.010. This further indicates that the
model applied is good in predicting the outcome variable. Thus the regression model
predicted the outcome considerably well.
Table 4.9: Model Summary
Model R R Square
Adjusted R
Square
Std. Error of
the Estimate
1 .811a .658 .453 .307
a. Predictors: (Constant), NI/S, WC/TA, S/TA, RE/TA,
CA/CL, TL/TE, EBIT/TA, TL/TA, MVE/TL, CA/TA,
CA/S, NI/TA
From Table 4.9 R – value represents simple correlation and an R-value of 0.811 indicates a
high degree of correlation. The R Square statistic of the variables, as shown in Table 4.9, is
0.658 which is significantly different from zero. This R Square statistic of 0.658 implies that
the 12 independent variables in the regression model would account for 65.8 percent of the
total variation of the outcome. Thus 65.8 per cent of the variation is explained by the model.
The higher the R Square the better the model fits the data.
4.4 Financial ratios that are most accurate in predicting financial distress
After conducting the stepwise discriminant analysis on the five years data for every company
in the sample only four (4) variables out of the initial twelve (12) were found to be
statistically significant. These are NI/TA, TL/TA, TL/TE and CA/S which are listed in
Table.4.9 and are also shown by the structure matrix, Table 4.6, as having been retained, are
explained as follows:
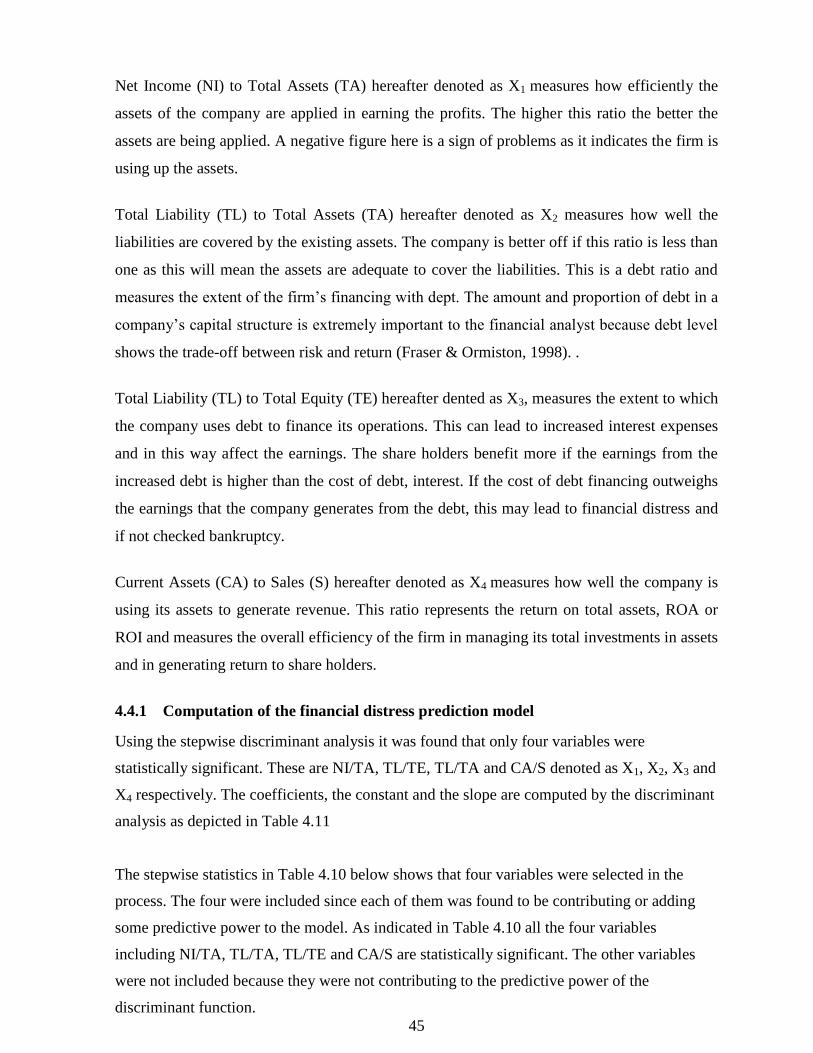
45
Net Income (NI) to Total Assets (TA) hereafter denoted as X1 measures how efficiently the
assets of the company are applied in earning the profits. The higher this ratio the better the
assets are being applied. A negative figure here is a sign of problems as it indicates the firm is
using up the assets.
Total Liability (TL) to Total Assets (TA) hereafter denoted as X2 measures how well the
liabilities are covered by the existing assets. The company is better off if this ratio is less than
one as this will mean the assets are adequate to cover the liabilities. This is a debt ratio and
measures the extent of the firm‟s financing with dept. The amount and proportion of debt in a
company‟s capital structure is extremely important to the financial analyst because debt level
shows the trade-off between risk and return (Fraser & Ormiston, 1998). .
Total Liability (TL) to Total Equity (TE) hereafter dented as X3, measures the extent to which
the company uses debt to finance its operations. This can lead to increased interest expenses
and in this way affect the earnings. The share holders benefit more if the earnings from the
increased debt is higher than the cost of debt, interest. If the cost of debt financing outweighs
the earnings that the company generates from the debt, this may lead to financial distress and
if not checked bankruptcy.
Current Assets (CA) to Sales (S) hereafter denoted as X4 measures how well the company is
using its assets to generate revenue. This ratio represents the return on total assets, ROA or
ROI and measures the overall efficiency of the firm in managing its total investments in assets
and in generating return to share holders.
4.4.1 Computation of the financial distress prediction model
Using the stepwise discriminant analysis it was found that only four variables were
statistically significant. These are NI/TA, TL/TE, TL/TA and CA/S denoted as X1, X2, X3 and
X4 respectively. The coefficients, the constant and the slope are computed by the discriminant
analysis as depicted in Table 4.11
The stepwise statistics in Table 4.10 below shows that four variables were selected in the
process. The four were included since each of them was found to be contributing or adding
some predictive power to the model. As indicated in Table 4.10 all the four variables
including NI/TA, TL/TA, TL/TE and CA/S are statistically significant. The other variables
were not included because they were not contributing to the predictive power of the
discriminant function.
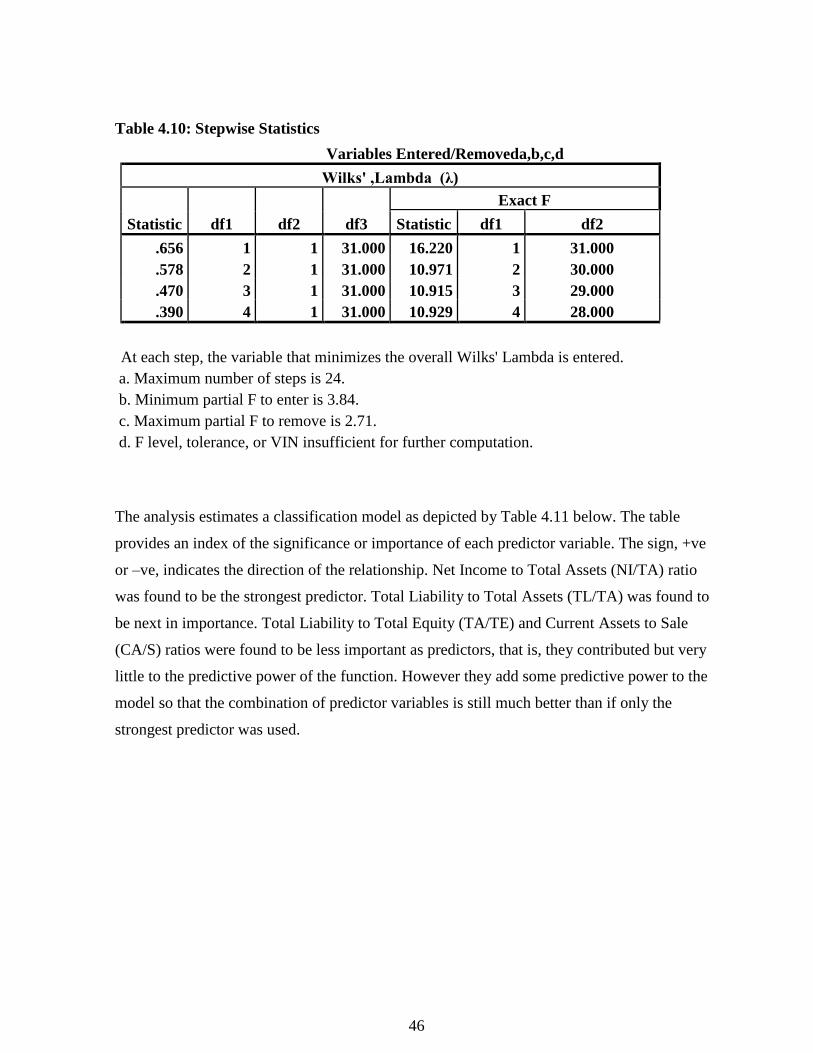
46
Table 4.10: Stepwise Statistics
Variables Entered/Removeda,b,c,d
Wilks' ,Lambda (λ)
Statistic df1 df2 df3
Exact F
Statistic df1 df2
.656 1 1 31.000 16.220 1 31.000
.578 2 1 31.000 10.971 2 30.000
.470 3 1 31.000 10.915 3 29.000
.390 4 1 31.000 10.929 4 28.000
At each step, the variable that minimizes the overall Wilks' Lambda is entered.
a. Maximum number of steps is 24.
b. Minimum partial F to enter is 3.84.
c. Maximum partial F to remove is 2.71.
d. F level, tolerance, or VIN insufficient for further computation.
The analysis estimates a classification model as depicted by Table 4.11 below. The table
provides an index of the significance or importance of each predictor variable. The sign, +ve
or –ve, indicates the direction of the relationship. Net Income to Total Assets (NI/TA) ratio
was found to be the strongest predictor. Total Liability to Total Assets (TL/TA) was found to
be next in importance. Total Liability to Total Equity (TA/TE) and Current Assets to Sale
(CA/S) ratios were found to be less important as predictors, that is, they contributed but very
little to the predictive power of the function. However they add some predictive power to the
model so that the combination of predictor variables is still much better than if only the
strongest predictor was used.
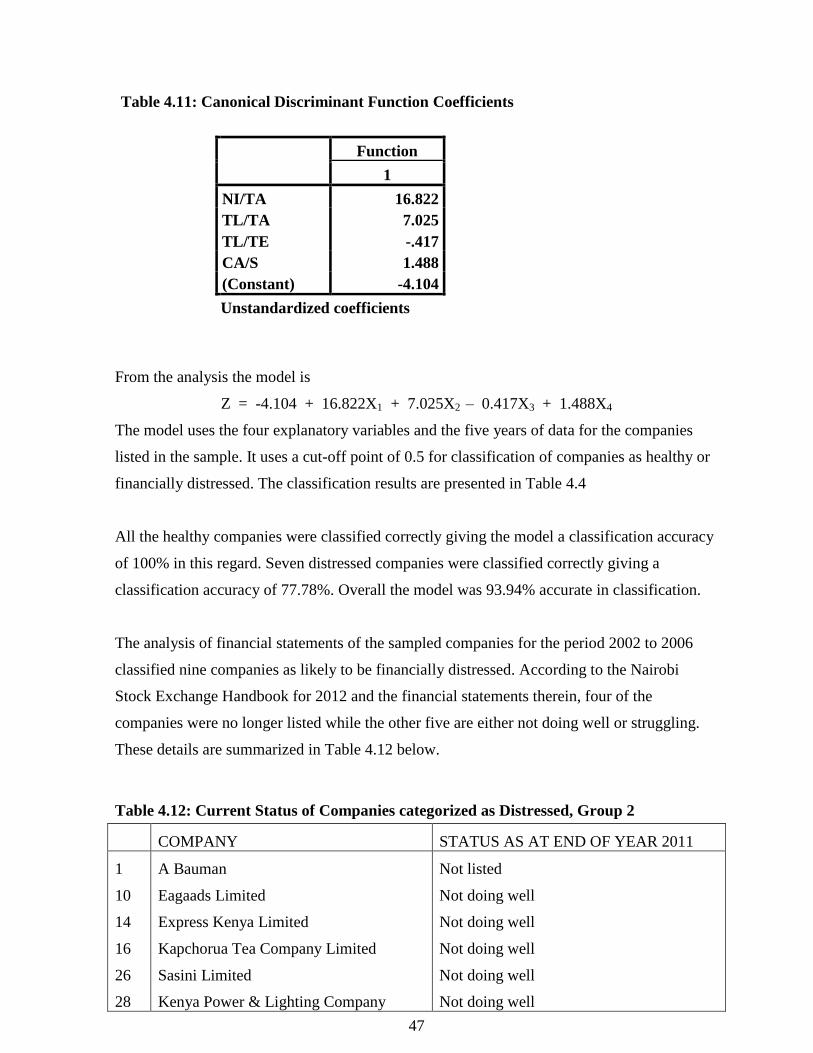
47
Table 4.11: Canonical Discriminant Function Coefficients
Function
1
NI/TA 16.822
TL/TA 7.025
TL/TE -.417
CA/S 1.488
(Constant) -4.104
Unstandardized coefficients
From the analysis the model is
Z = -4.104 + 16.822X1 + 7.025X2 – 0.417X3 + 1.488X4
The model uses the four explanatory variables and the five years of data for the companies
listed in the sample. It uses a cut-off point of 0.5 for classification of companies as healthy or
financially distressed. The classification results are presented in Table 4.4
All the healthy companies were classified correctly giving the model a classification accuracy
of 100% in this regard. Seven distressed companies were classified correctly giving a
classification accuracy of 77.78%. Overall the model was 93.94% accurate in classification.
The analysis of financial statements of the sampled companies for the period 2002 to 2006
classified nine companies as likely to be financially distressed. According to the Nairobi
Stock Exchange Handbook for 2012 and the financial statements therein, four of the
companies were no longer listed while the other five are either not doing well or struggling.
These details are summarized in Table 4.12 below.
Table 4.12: Current Status of Companies categorized as Distressed, Group 2
COMPANY STATUS AS AT END OF YEAR 2011
1
10
14
16
26
28
A Bauman
Eagaads Limited
Express Kenya Limited
Kapchorua Tea Company Limited
Sasini Limited
Kenya Power & Lighting Company
Not listed
Not doing well
Not doing well
Not doing well
Not doing well
Not doing well
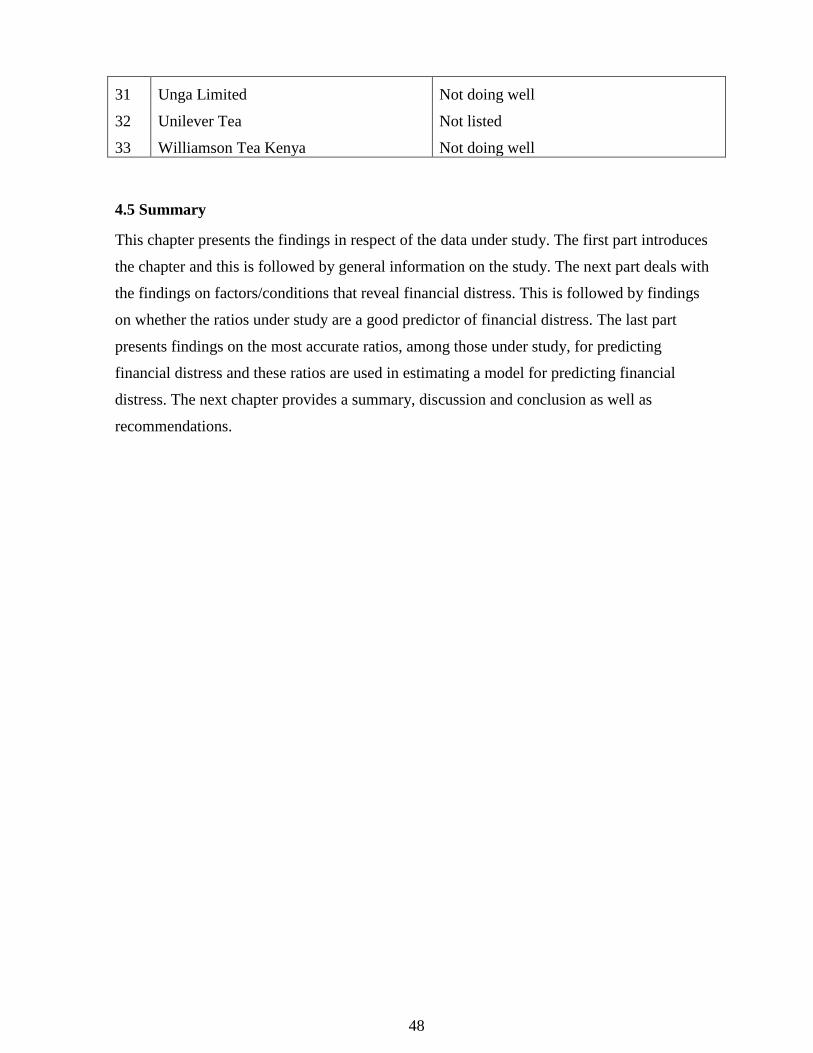
48
31
32
33
Unga Limited
Unilever Tea
Williamson Tea Kenya
Not doing well
Not listed
Not doing well
4.5 Summary
This chapter presents the findings in respect of the data under study. The first part introduces
the chapter and this is followed by general information on the study. The next part deals with
the findings on factors/conditions that reveal financial distress. This is followed by findings
on whether the ratios under study are a good predictor of financial distress. The last part
presents findings on the most accurate ratios, among those under study, for predicting
financial distress and these ratios are used in estimating a model for predicting financial
distress. The next chapter provides a summary, discussion and conclusion as well as
recommendations.
49
CHARPTER FIVE
5.0 SUMMARY, DISCUSSIONS, CONCLUSIONS AND RECOMMENDATIONS
5.1 Introduction
This chapter consists of four sections which include summary, discussion, conclusion and
recommendation. The summary includes the important aspects of the study which includes the
purpose of the study, research questions, or specific objectives, research methodology and
findings. The next part discusses the findings which respect to the research questions. This is
followed by a discussion on the conclusion based on the specific objective as per the findings
and results. The chapter then ends with recommendation for practice or for improvement and
suggestions for future studies.
5.2 Summary
The objective of the study was generally to explore and explain whether ratios can predict
financial distress. The purpose of the research was to determine which financial ratios are the
best predictors. The study was guided by three objectives to: find out what reveal financial
distress, how good are financial ratios in predicting financial distress and which financial
ratios or set of ratios are most accurate in predicting financial distress and use the set to
estimate a model for predicting financial distress.
The study applied a predictive research design and involved secondary data. The sample
frame was obtained from the list of non financial sectors companies listed in the Nairobi stock
exchange. The population was comprised of financial ratios obtained from financial statement
of companies listed in the Nairobi Stock exchange. To determine the sample size a purposive
sampling method was used to select the companies. Specifically judgment sampling was used
to select companies from the non financial sector and to involve only those companies which
had complete information.
The study computed 12 financial ratios of each of the selected companies. The 12 ratios
included NI/TA, CA/CL, TL/TA, WC/TA, EBIT/TA, TL/TE, RE/TA, S/TA, CA/S, CA/TA,
MVE/TL and NI/S. These are listed and defined in Table 4.1. These ratios were selected from
a list of most popular financial ratios as determined for previous studies. The means of each
ratio was computed for each of the company to form the data for analysis.
50
The companies were categorized in to two groups, healthy firms and financially distressed
firms, using profitability and share holders‟ equity as compared with registered capital as a
separation criteria. SPSS was then used to explore data and to generate descriptive statistics
including mean, standard deviation, Wilks Lambda, Covariance, Eigenvalue, Chi-square,
among others. The results are presented in tables.
The study found that variables that reveal the financial health of a company include those
ratios under profitability, leverage, liquidity and operational efficiency. Liquidity is closely
linked profitability. When a company is profitable, it unlikely to have liquidity problems.
Operational efficiency is also important as it indicates how well the company is utilizing
resources. The extent to which the company is financed by borrowed funds indicates how the
company is exposed to solvency risks. The higher the proportion of debts the higher the risk.
The study also found that ratios are good predictors. The predictive model composed of the
ratios was found to be statistically significant indicating that ratios have predictive powers and
this was indicated by all the statistics in the analysis; including significance levels, R-square,
Residual statistic and F-statistic.
The study found that the strongest predictor was Net Income to Total Assets ratio. It was
followed by Total Liability to Total Assets ratio. The ratios of Total Liability to Total Equity
and Current Assets to Sales were also found to be useful though to a lesser extent. However it
is important to note that a combination of ratios gave a better predictive model compared to a
single ratio.
5.3 Discussions
5.3.1 Conditions that reveal financial distress
The study mainly used profitability to group the companies to healthy ones and those with
financial distress. The analysis found that the classification was 93.5 % correct. This shows
that profitability is a major factor in revealing financial distress and should be watched
constantly. This result is in agreement with the separation criteria given by Chen et al (2006)
in their study of Financial Distress Prediction in China, separation of financially distressed
companies from the non-distressed. The separation criteria looked at profitability and
leverage. Profitability applies such that a company which made losses or negative profits for
two straight years was categorized as financially distressed.
51
In the study it was found that variables related to profitability including NI/TA,EBIT/TA and
N/S were of highest statistical significance. The findings are consistent with the study by
Rahman et al (2004) who found that financial indicators such as capital adequacy, loan
management and operation efficiency are essential to financial health.
The extent to which borrowed funds were used to finance companies operations was also
found to be a significant indicator of health or otherwise of a company. Working Capital to
Total Asset (WC/TA) was also found to be a significant indicator. This is consistent with the
findings of Polenis et al ( 2012) that a negative ratio in a working capital to Market Value plus
total debt signals that the firm may encounter problems in meeting its short term obligations.
The extent to which borrowed funds are used to finance operations is also an indicator. The
more the borrowed funds the more the company is at risk of financial distress.
One must be careful when using ratios in assessing the financial health or otherwise of a
company. Assurance on the accuracy of the financial information is very important. There is
possibility of errors and in some cases fraudulent manipulation of the statements to make it
look attractive.
5.3.2 Financial rations as predictors of financial distress
Results for the study indicate that the variables, the financial ratios, are good predictors of
financial distress. All the ratios were found to be statistically significant with average
significant level of 0.10 yet the nearer the significance level is to 0.0000 the higher the
statistical significance in their Study Chan et al (2006) examined the usefulness of financial
ratios in predicting business failure. Their study concluded that the five most significant
financial ratio predictors are Earnings before interest in total assets (EBIT/TA)
Earnings per share (EPS) Total Debt to Total Assets (TD/TA) Price to book ratio (PB) and
Current Ratio (CR). Three of these ratios EBIT/TA,TD/TA and CR have been used in this
study and were found to be very significant statistically which is in line with the findings of
Chen et al (2006).They emphasized looking at financial distress in its various stages including
cash shortages, financial insolvency and total insolvency.
Mbanwie and Ngam ( 2006) found that financial ratios are very useful and will provide
valuable decisions making information. Their study revealed that profit ratios, liquidity ratios,
and financial leverage ratios are the most significant ratios for predicting financial distress and
52
bankruptcy. From their study Mbanwie et al (2009) ranked the significant financial ratios
according to their predictive ability as follows: Net profit to total assets, operating profit to
turnover, liquid asset to current liabilities (quick ratio), long term debt to total equity ,current
assets to current liabilities, and total debts to total equity. Five of the above ratios are included
among the 12 ratios under this study and 4 of them ranked top with Net income to Total assets
being the top while Earnings before interest and tax to Total assets being second and net
income over being 4th .As seen in past study Mbanwie et al (2006) found that financial ratios
are related to each other and a combination of them will do a better job than a single
predictive ratio.
5.3.3 Financial ratios are more accurate in predicting financial distress.
The study analyzed 12 most popular ratios and ranked them according to their statistical
significance. They were found to fall in the following order; NI/TA, EBIT/TA, TL/TE, NI/S ,
CA/TA, WC/TA, MVE/TL, CA/CL, RE/TA, TL/TA, S/TA and CA/S. The most significant
is thus NI/TA and this is consistent with most studies including; Mbamwe et al (2009),
Hossari et al (2005).
Ratios are related to each other and a combination of financial ratios gives a better outcome
than a single ratio. When the ratios are considered together as in this study the set of ratios
found to be most significant and contributing more to the outcome were NI/TA, TL/TA,
TL/TE and CA/S. This was the result of a stepwise discriminant analysis. This is in line with
the study by Hossari et al (2005) which however had not considered the correlation of the
variables.
The set of ratios were then applied to estimate a model which was able to correctly classify
companies into the healthy and the financially distressed with an accuracy of 93.94%. The
model is different from those of previous studies by Altman ( 1966) and Polemis et al (2012).
This is probably because a different model applies in different countries since prevailing
conditions are different. This finding is in line with that by Rahman et al (2004) whose study
found that for each country separate models should be developed for individual and overall
time periods.
53
5.4 Conclusions
The purpose of this study was to determine whether there are variables that reveal financial
distress or conditions conducive to financial distress and to find out how good financial ratios
are in predicting financial distress. The study was then to determine which financial ratios are
most accurate in predicting financial distress.
5.4.1 Factors that reveal financial distress
Profitability, liquidity, leverage and operational efficiency are crucial in determining the
financial health of a company. Profitability is mainly seen through financial ratios including
Net income to Total assets, Earnings before interest and tax to Total assets and Net Income to
Sales. Liquidity is seen through ratios Working capital to Total assets and Current assets to
Total assets. Leverage is seen through the ratio of Total liability to Total equity. While
operational efficiency is seen through the ratios of Sales to Total assets and Current assets to
Sales.
Net income to Total assets and Earnings before interest and tax to Total assets are both
indicators of how profitable the assets of the company are. They determine how well the
company is utilizing its assets to generate profits. They are thus performance indicators and
therefore important areas of intervention in case a company is found to be doing poorly or is
facing financial distress. Net Income over sales shows the company‟s net returns on sales. It
measures how much of profit the company is able to earn for every shilling of sales.
Liquidity ratios show the company‟s ability to settle its short term debts obligations as they
fall due. The higher this value the better the company is able to cover its short term debts.
Lower liquidity ratio will indicate a company is experiencing financial distress.
Operating efficiency ratios measure how efficiently the company is generating sales given its
investments in assets. The higher the ratio the better the efficiency of the company in
generating revenue.
All these ratios should constantly be monitored since they are good indicators of financial
performance of a company. They can provide early warning signs to whenever a company is
not performing well.
54
5.4.2 Financial ratios as predictors of financial distress
Financial ratios are good predictors of financial distress. The study found all the 12 financial
ratios statistically significant with an average significance level of 0.10. However some ratios
are more significant than others and so one should be careful to select appropriately. Some
ratios are highly correlated. This leads to some ratios being redundant when you include those
other ratios to which they are correlated. The only ratios retained are those which contribute
to the predictive power of the model. For instance the ratio EBIT/TA is a strong predictor but
it is left out of the study because it becomes redundant once NI/TA is included in the model.
Profitability ratios were the most significant. However a combination of ratios will do better
than a single ratio in predicting financial distress. The sum of the contributions of each of the
predictors to the predictive power of the model is much more than the contribution of one
ratio. Furthermore, a combination of ratios reduces the percentage error of classification.
Financial ratios also give an indication of the risk levels posed by a given investment
decision. Ratios thus give the basis of measuring the risk of financial distress for a company.
An interested investor may therefore choose to avoid investing in a company with high risk of
financial distress or chose to invest but at a higher interest.
Whereas one may use the model to asses a company‟s prospects at a point in time, the
assessment of a company‟s performance over a period of time give a better picture. Looking
at financial data over a period of time takes care of any differences that may have been
brought about by differences in application of accounting policies.
5.4.3 Financial ratio that is most accurate in predicting financial distress
Net income to Total assets (NI/TA), Total liabilities to Total assets (TL/TA), Total liabilities
to Total equity (TL/TE) and Current assets to Sales (CA/S) were found to be the ratios that
contributed most to the outcome. The predictive model estimated from these four ratios was
found to be 93.94% accurate.
Profitability is very essential to the company. No company can survive for long and
accomplish its other goals if it is not profitable. However, when assessing the prospects of a
company it is important to consider the quality of earnings and not just the amounts. The
quality of earnings is seen when you look at the profitability against total assets, sales and
55
against owner‟s equity. Earnings viewed against total assets reflect the efficiency in use of
resources to generate the profits.
A company must be able to pay off its liabilities. This is clearly seen when liabilities are
compared with the assets. A situation where liabilities are more that assets is never desirable.
The companies with large amounts of debt are often vulnerable to liquidity problems due to
high interests.
5.5 Recommendations
5.5.1 Recommendation for improvements
5.5.1.1 Factors that reveal financial distress
Financial ratios are very important in guiding decision making. This may be related to
expansion, of already existing investments or in entering new investments. It is important to
have an idea of the future outlook of the investment one is in or is getting into. To do this it is
necessary to look at ratios. Ratios indicate a lot of underlying information which is not clearly
seen in the financial statements. Ratios are able to give an idea of the efficiency in utilization
of resources and efficiency in operations. This is important in that it not only shows when a
company is performing poorly but also points at areas that may need to be improved
5.5.1.2 Financial ratios as predictors of financial distress
Ratios may indicate danger signals and so prompt corrective action in good time. This may
help save ailing companies. A company may need to improve its profitability and debt levels
to survive. Such corrective actions will help reduce incidences of company failures and or
help investors in identifying failing companies and taking appropriate action. It is important to
note that unfavourable ratios may not expressly mean a given company will fail. It only serves
to warn that things are not going on well and some intervention is necessary before it is late.
5.5.1.2 Financial ratio that is most accurate in predicting financial distress
The Nairobi Stock Exchange should provide more information on the listed companies. They
should provide more ratios especially those related to profitability, liquidity and leverage.
Many users and potential users of the financial statements may not be keen to compute the
ratios. Others may not even understand how they are computed. The correct interpretation
may also be a problem. Providing the ratios and relevant bench marks or industry averages

56
can certainly help users in making the right choices. This will help stakeholders make
informed decisions.
5.5.2 Recommendation for further studies
This study only covered listed companies in the non-financial sector. Further studies should
be done in the financial sector. The sectors can also be compared to see if they respond
differently or similarly.
Further studies should also be done using more financial ratios. This study only considered 12
ratios from among the most popular ratios. There could be other ratios which, though not
popular, could be better predictors.
57
REFERENCE
Allen, R. (2010). Statistics for Evidence Based Practice and Evaluation. Belmont:
Brooks/Cole.
Altman, E. I. (1968). Financial Ratios, Discriminant Analysis and The Prediction of Corporate
Bankruptcy. The Journal of Finance , 589, 591.
Altman, E. I. (1983). The Behavior of Firms in Financial Distress: Discussion. The Journal of
Finance , 517-522.
Attorney General's Office. (2009). Laws of Kenya.Companies Act Cap 486. Nairobi: National
Council for Law Reporting.
Barry, E., & Jamie, E. (2006). Financial Accounting, Reporting and Analysis. Harlow:
Pearson Education Limited.
Beaver, W. (1966). Financial Ratios As Predictors of Failure. Journal of Accounting Research
, 71-111.
Berstein, L. A., & Wild, J. (1999). Analysis of Financial Statements. New York: McGrawHill
Education.
Boone, L. E., Kurtz, D. L., & Hearth, D. (2006). Planning Your financial future. Mason:
Thomson South-Western.
Brigham, E. F., & Daves, P. R. (2004). Intermediate Financial Management: Study Guide.
New Jersey: Thompson.
Bryman, A., & Bell, E. (2007). Business Research Methods. New York: Oxford University
Press.
Canova, F. (1994). Were Financial Crises Predictable. Journal of Money, Credit and Banking
, 102-124.
Chen, J., Marshal, B. R., Zhang, J., & Ganesh, S. (2006). Financial Distress Prediction in
Chiona. Review of Pacific Basin Financial Markets and Policies , 317 - 336.
Choi, F. D. (2003). International Finance and Accounting Handbook. New Jersey: John
Wiley & Sons.
Cooper, D. R., & Schindler, P. S. (2000). Business Research Methods. New York: McGraw-
Hill Irwin.

58
Fraser, L. M., & Ormiston, A. (1998). Understanding Financial Statements. New Jersey:
Prentice Hall Inc.
Gamesalingam, S., & Kumar, K. (2001). Detection of Financial Distress via multivariate
statistical analysis. Managerail Finance , 45-55.
Horrigan, J. O. (1965). The Determination of Long-term Credit Standing With Financial
Ratios. Journal of Accounting Research , 44-62.
Hossari, G., & Rahman, S. (2005). A Comprehensive Formal Ranking of the Popularity
Financial Ratios in Multyvariate Modeling of Corporate Collapse. The Journal of
American Academy of Business, Cambridge , 321-327.
http://en.wikipedia.org/wiki/Nairobi_Securities_Exchange; . (2013). Retrieved November 14,
2013, from www.wikipedia.org: http://en.wikipedia.org
Kahl, M. (2002). Economic Distress, Financial Distress, and Dynamic Liquidation. The
Journal of Finance , 135-168.
Khan, M. Y., & K, J. P. (2005). Financial Management Text, Problems and Cases. New
Delhi: Tata McGraw-Hill.
Kimmel, P. D., Weygandt, J. E., & Kieso, D. E. (2000). Accounting and Finannce for
Managerial Use and Analysis. New York: John Wiley & Sons, Inc.
Lieu, P.-T., Lin, C.-W., & Yu, H.-F. (2008). Financial Early Warning Models on Cross-
Holding Groups. Industrial Management & data Sysytems , 1060-1080.
Mbanwei, G., & Ngam, E. N. (2009). Financial Rations as Bankruptcy Indicators:
Gothenburg, Sweden.
Meigs, R. F., & Meigs, W. B. (1990). Accounting:The Basics for Business Decisions.
Singapore: McGraw-Hill Inc.
Mudida, R., & Ngene, G. (2010). Financial management. Nairobi: Focus Publishers Ltd.
Muller, G., Steyn-Bruwer, B., & Hamman, W. (2009). Predicting Financial Distress of
Companies Listed on the JSE - A Comparison of Techniques. South Africa Journal
Business Management , 21-45.
Nairobi Stock Exchange Limited. (2012). Nairobi Stock Exhange Handbook . Nairobi:
Nairobi Stock exchange.
Ong, S.-W., Yap, V. C., & Khong, R. W. (2011). Emerald. Retrieved September 19, 2012,

59
from Emerald: http://dx.doi.org/10.1108/03074351111134745
Opler, T. C., & Titman, S. (1994). Financial Distress and Corporate Performance. The Journal
of Finance , 1015-1040.
Polemis, D., & Gounopoulos, D. (2012, May 01). Prediction of distress and idntification of
potential M&As targets in UK. Retrieved September 19, 2012, from
www.emeraldinsight.com: http://dx.doi.org/10.1108/03074351211266801
Rahman, S., Tan, L. H., Hew, O. L., & Tan, Y. S. (2004). Identifying Financial Distress
Indicators of Selected Banks in Asia. Asian Economic Journal , 45-57.
Rees, D. G. (1995). Essential Statistics. London: Chapman & Hall.
Reynolds, S., Fowles, R., Gander, J., Kunaporntham, W., & Ratanakomut, S. (2002).
Forecasting the Probability of Failure of Thailand's Financial Companies in the Asian
Financial. Economic Development and Cultural Change , 237-246.
Ross, S. A., westerfield, R. W., & Jaffe, J. (2005). Corporate Finance. New York: McGraw-
Hill/Irwin.
Ross, S. A., Westerfield, R. W., & Jordan, B. D. (2003). Fundamentals of Corporate Finance.
New York: McGraw-Hill.
Ross, s. A., Westerfield, R. W., & Jordan, B. D. (2008). Fundumentals of Corporate Finance.
New York: McGraw-Hill Companies.
Ryan, B. (2004). Finance and accounting for business. London: Thomson Learning.
Sharma, S. (1996). Applied Multivariate Techniques. Toronto: John Wiley & Sons, Inc.
Sharpe, W., Alexander, G. J., & Bailey, J. V. (1999). Investments. New Jersey: Prentice Hall.
Tabachnick, B. G., & Fidell, L. (1996). Using Multivariate Statistics. New York:
HarperCollins college Publishers Inc.
Tamari, M. (1966). Financial Ratios as a Means of Forecasting Bankruptcy. Management
International Review , 15-21.
Van Horne, J. C. (1991). Financial Management and Policy. New Delhi: Prentice-Hall of
India.
Zaki, E., Bah, R., & Rao, A. (2011). Assessing Probabilities of Financial Distress of Banks in
UAE. International Journal of Managerial Finance , 304-320.

60
Zongjun, W., & Hongxia, L. (2007). Financial Distress Prediction of Chinese Listed
Companies: A Rough Set Methodology. Chinese Management Studies , 93-110.
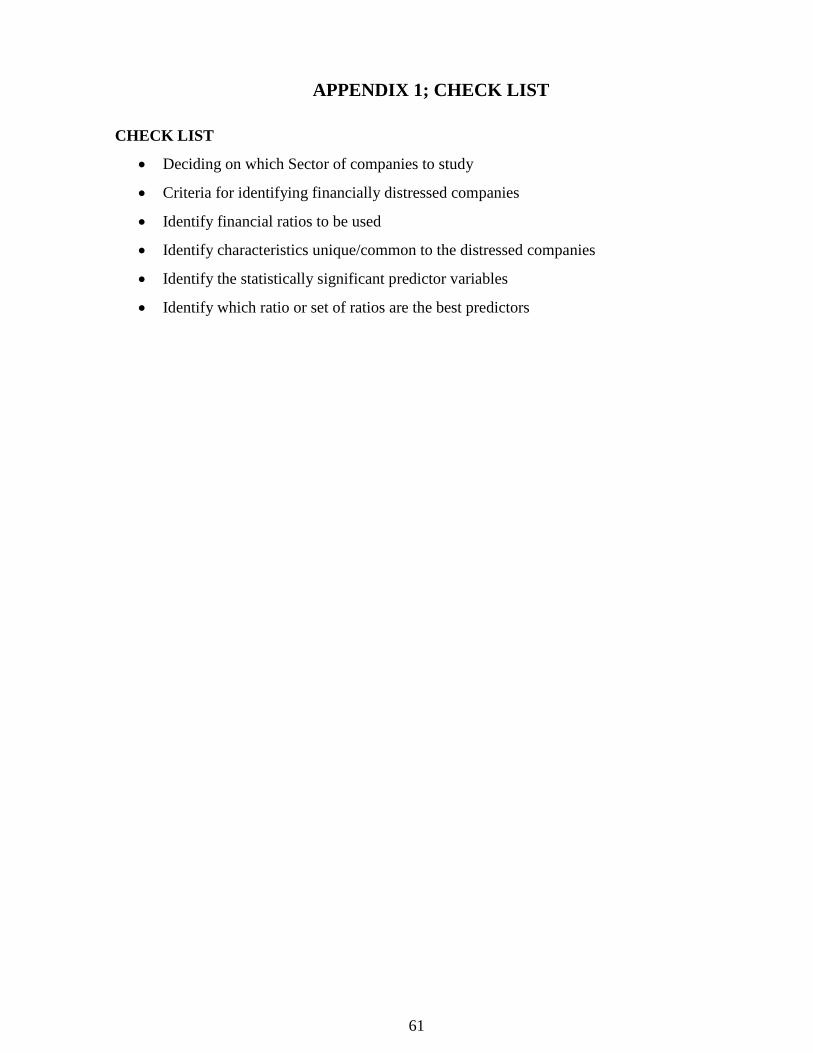
61
APPENDIX 1; CHECK LIST
CHECK LIST
Deciding on which Sector of companies to study
Criteria for identifying financially distressed companies
Identify financial ratios to be used
Identify characteristics unique/common to the distressed companies
Identify the statistically significant predictor variables
Identify which ratio or set of ratios are the best predictors
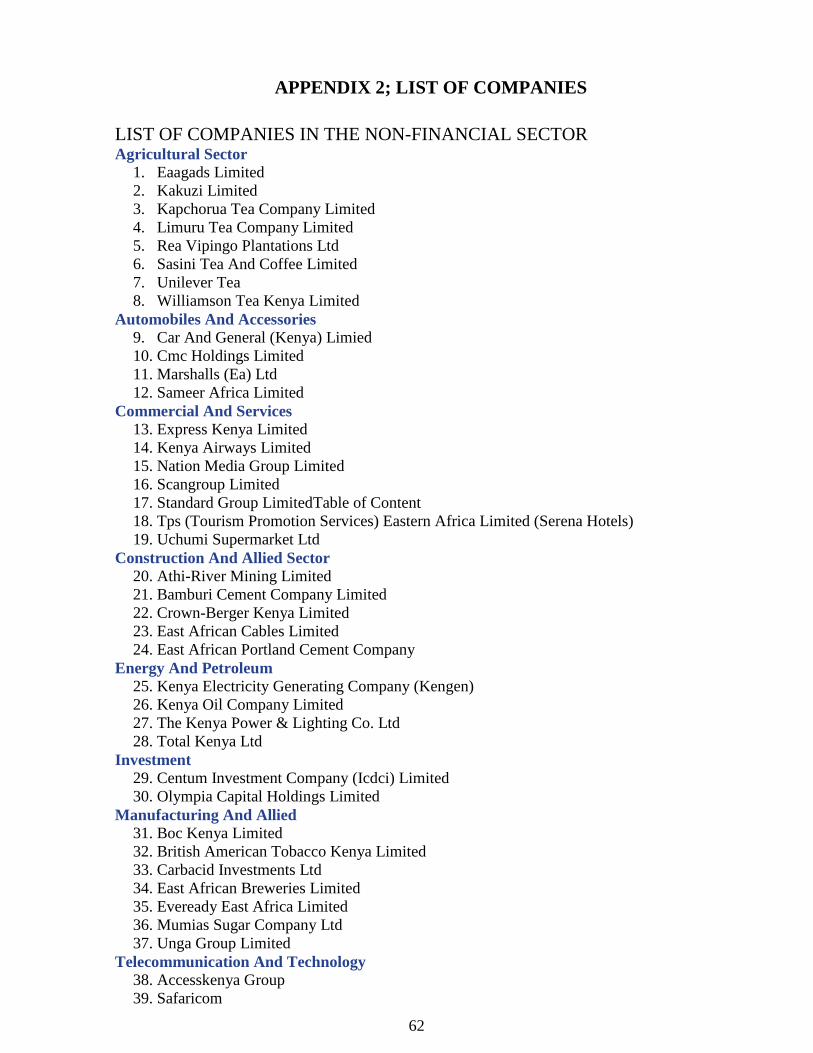
62
APPENDIX 2; LIST OF COMPANIES
LIST OF COMPANIES IN THE NON-FINANCIAL SECTOR Agricultural Sector
1. Eaagads Limited
2. Kakuzi Limited
3. Kapchorua Tea Company Limited
4. Limuru Tea Company Limited
5. Rea Vipingo Plantations Ltd
6. Sasini Tea And Coffee Limited
7. Unilever Tea
8. Williamson Tea Kenya Limited
Automobiles And Accessories
9. Car And General (Kenya) Limied
10. Cmc Holdings Limited
11. Marshalls (Ea) Ltd
12. Sameer Africa Limited
Commercial And Services
13. Express Kenya Limited
14. Kenya Airways Limited
15. Nation Media Group Limited
16. Scangroup Limited
17. Standard Group LimitedTable of Content
18. Tps (Tourism Promotion Services) Eastern Africa Limited (Serena Hotels)
19. Uchumi Supermarket Ltd
Construction And Allied Sector
20. Athi-River Mining Limited
21. Bamburi Cement Company Limited
22. Crown-Berger Kenya Limited
23. East African Cables Limited
24. East African Portland Cement Company
Energy And Petroleum
25. Kenya Electricity Generating Company (Kengen)
26. Kenya Oil Company Limited
27. The Kenya Power & Lighting Co. Ltd
28. Total Kenya Ltd
Investment
29. Centum Investment Company (Icdci) Limited
30. Olympia Capital Holdings Limited
Manufacturing And Allied
31. Boc Kenya Limited
32. British American Tobacco Kenya Limited
33. Carbacid Investments Ltd
34. East African Breweries Limited
35. Eveready East Africa Limited
36. Mumias Sugar Company Ltd
37. Unga Group Limited
Telecommunication And Technology
38. Accesskenya Group
39. Safaricom

63
Alternative Investments
40. A. Bauman & Company Limited
41. City Trust
Source: (Nairobi Stock Exchange Limited, 2012)