Embed Size (px)
Citation preview

Predicting earthquakes by anomalies in theionosphere
Daria ChaplyginaSaint Petersburg State University
Saint Petersburg, [email protected]
Natalia Grafeeva1,2
1Saint Petersburg State University2ITMO University
Saint Petersburg, [email protected]
Abstract—Since earthquakes are a global-scale problem, hu-manity has been attempting to predict them for a long time.Earlier [1], it was shown that machine learning can be usedto predict earthquakes. Nevertheless, a sufficiently accurate andcomplete predictive model could not be obtained, which may bedue to an insufficient number of features.
In this paper, anomalies in the ionosphere preceding seismicactivity are considered as earthquake precursors. Two existingapproaches to detecting ionosphere anomalies were considered;a third one was proposed, using readings of several ionosondeslocated in the neighborhood of the earthquake area or ina ring around such neighborhood. To test these approaches,a collection of ionosphere characteristics data, obtained fromground ionosondes, was gathered and processed. In the future,discovered anomalies are planned to be used as features formachine learning models.
Index Terms—earthquake prediction, data mining, time series,seismology, ionosphere anomalies
I. INTRODUCTION
Over the last 5 years (2014–2018), on average, 1,673earthquakes of magnitude 5 or higher are registered eachyear. Such earthquakes are considered strong (ranked VI orhigher on the Mercalli scale [2]) and can potentially causedamage ranging from broken dishes to human casualties andsubsequent technological disasters. Timely prediction of earth-quakes could reduce the damage or even avoid it completely,which is why, for a long time, humanity has been attempt-ing to predict seismic activity. For this purpose, seismolo-gists study anomalies which precede earthquakes: foreshocks(small earthquakes occurring shortly before stronger ones),electromagnetic anomalies, radon emissions, unusual animalbehavior, and so on. But the use of such precursors has anumber of problems: lack of specificity (anomalies might notappear before an earthquake or might appear independentlyfrom one) and difficulty of detection (insufficient number ofmeasuring devices and/or their insufficient accuracy).
In 2019, an attempt was made to unify all available knowl-edge and construct a predictive model of earthquakes [1]. Asa result of that work, it was shown that machine learningmethods are applicable to this problem, but a predictionalgorithm that would be simultaneously accurate and completecould not be obtained. As an area of further research, it wassuggested to use ionosphere parameters as an indicator ofseismicity.
The goal of this work is to study anomalies in the ionosphereas a precursor to earthquakes. For this purpose, a collection ofdata containing readings of ground ionosondes was obtained;studies describing ionosphere changes before an earthquakewere examined; and three approaches to detecting ionosphereanomalies were considered.
II. IONOSPHERE
The ionosphere is the upper part of Earth’s atmosphere,heavily ionized under the influence of solar radiation. Thestate of the ionosphere can significantly vary depending ontime: it’s affected by the cycle of solar activity, season of theyear, and time of day; and also on geographical location: thereare polar regions, auroral zones, mid-latitudes, and equatorialregions.
The ionosphere is divided into three layers, D, E, and F,depending on the density of charged particles. In turn, theF layer can be subdivided into F1 and F2 layers, and the Elayer is considered to contain the sporadic E layer (Es). Asthe distance to the surface of Earth increases, so does the iondensity, from the D layer to the F layer.
To study the ionosphere, the vertical sounding method isused. An ionosonde generates a high-frequency vertical radioimpulse and records the height where it is reflected. Thereflection height, as a function of radio impulse frequency,is recorded in the form of an ionogram, an example of whichis shown in Fig. 1.
Fig. 1: An example of an ionogram. Color indicates the intensity ofreflection. This is the form in which an ionosonde initially receives the data;all other parameters are determined from this image.
All parameters describing the state of the ionosphere aresubsequently obtained from the processing of an ionogram.
Copyright© 2020 for this paper by its authors.Use permitted under Creative Commons License Attribution 4.0 International (CC BY 4.0).

The graph of the relationship between impulse frequency andreflection height can be used to calculate such characteristicsas, for example, virtual heights (h�E; h�F ; h�F2; etc.) orcritical frequencies (foE; foF1; foF2; etc.) of various levelsof the ionosphere.
III. REVIEW OF LITERATURE
A. Biryukov et al., 1996. One of the first papers thatshowed a connection between ionosphere variations and seis-mic activity was published in 1996 [3]. The authors of thatarticle studied experimental data obtained from satellites thatdetected effects of an upcoming earthquake on the ionosphere.It was shown that seismic waves cause such ionosphericeffects as: a glow of the night sky, a change of the propertiesof ionospheric plasma (its concentration, composition, andheating), and low-frequency magnetic oscillations. As a result,researchers concluded that, even though disturbances thatprecede earthquakes have low amplitudes and can be causedby other factors, existing diagnostic equipment could detectearthquake precursors from satellites.
S. A. Pulinets et al., 2003. In the paper by S. A. Pulinetset al. [4], the authors published the results of a ten-year studyof variations in the ionosphere in seismically active regionsshortly before an earthquake. The goal of the study was todetermine the main characteristics of ionospheric precursorsof an earthquake. In particular, an attempt was made to detectcharacteristics that could distinguish earthquake precursorsfrom variations that had other causes. As the study showed,before an earthquake, the foF2 parameter (critical frequencyof the F2 layer of the ionosphere) deviates from its monthlymedian. The authors reached the following conclusions:
• phenomena in the ionosphere that precede earthquakescan be observed between 5 days and a few hours beforethe earthquake;
• the deviation from the median can be either positive ornegative;
• these phenomena can be detected for earthquakes ofmagnitude 5 or higher.
The primary result was the conclusion that, given a fixed rela-tive position of the earthquake’s epicenter and the observationpoint (in our case, the ionosonde), ionospheric precursors willbe similar for all subsequent earthquakes with a close epicen-ter. In turn, the existence of consistent patterns of earthquakeprecursors can enable prediction of future catastrophes.
Chen et al., 2004. Conclusions about the changes of foF2were statistically confirmed in the study [5], whose authorsproposed and conducted two tests: the first checks that occur-rence of anomalies in foF2 is connected with a subsequentearthquake more often than it would be for a random event(coin toss); the second checks the effectiveness of foF2anomalies as an earthquake precursor compared to other indi-cators. The hypothesis of foF2 anomalies before earthquakesbeing random was rejected with p − value ≤ 0.0052. Theeffectiveness test also confirmed the possibility of constructinga predictive model for earthquakes based on foF2 deviations.
Thus, studies indicate that ionospheric precursors of earth-quakes exist and manifest themselves in the form of anomaliesof the values of the F2-layer critical frequency, or foF2. But itis also known [6], that the value of foF2 depends on the timeof day and the season, as well as on solar and geomagneticactivity, which in turn makes it non-trivial to detect anomalousvalues of foF2. The works described below suggested twoalgorithms for detecting non-typical variations of foF2.
S. A. Pulinets et al., 2002. The article [7] suggested the useof 24×6 matrices Aij , where the value in the i-th row and thej-th column indicates the deviation of foF2 from the medianvalue for the i-th hour of the j-th day. The study showed thatsuch matrices, when computed for a period of 6 days beforean earthquake, turn out to be similar for earthquakes occurringin identical regions. Thus, earthquake prediction becomes aproblem of comparing foF2 deviation matrices constructedfor earlier earthquakes with the current state matrix.
S. A. Pulinets, 2004. Another approach was demonstrated inthe article [8]. The method proposed by the authors assumestwo ionosondes: one in the earthquake preparation zone [9],the other outside that zone, but close to the first ionosonde(∼ 500–700 km). Data obtained from such ionosondes, in theabsence of seismic activity, will be highly correlated due totheir proximity, as all external factors will affect them equally.During earthquake preparation, however, one ionosonde fallsinto the zone of seismic activity, which reduces the correlationindicator. An advantage of this method compared to theprevious one is that there is no need to process historical data.
Xia et al., 2011, L. P. Korsunova and V. Hegai, 2018. Inlater years, attempts were made to use other characteristics ofthe ionosphere as earthquake precursors. Thus, for example,the study [10] demonstrates the existence of anomalies inTEC (total electron content). These anomalies were detectedby the authors a few (2–9) days before three earthquakes ofmagnitude ≥ 7.2. Another article [11] studied anomalies in theEs layer of the ionosphere, specifically, the virtual height of theEs layer (h�Es). Just like in the previous paper, a significantdeviation of this parameter from its typical value was detectedprior to an earthquake. Results like this indicate that foF2may not be the only earthquake precursor; however, there is aneed for statistical confirmation of observations that currentlyexist only for particular cases.
D. Davidenko and S. Pulinets, 2019. Recent works alsodeveloped the previously described method that uses foF2deviation matrices. The paper by D. Davidenko and S. Pulinets[12] subjected it to slight modifications: instead of 6 days, itconsidered 10 days before and 4 days after an earthquake,and the deviation was measured from the sliding average of15 previous values at the same moment in time. The articlestudied variations in the ionosphere that preceded earthquakesin regions of Greece and Italy. The consideration of a narrowregion was motivated by the idea (mentioned in the paper [4])that earthquake precursors have a pattern that repeats for aparticular region.
IV. DESCRIPTION OF DATA
A. Earthquake data
The earthquakes information was obtained from the websiteof United States Geological Survey (USGS) 1. Data wasdownloaded for all earthquakes over the period from 1970to 2019 with magnitudes ≥ 4.5. In total, 78,433 earthquakeswere downloaded.
B. Ionosonde data
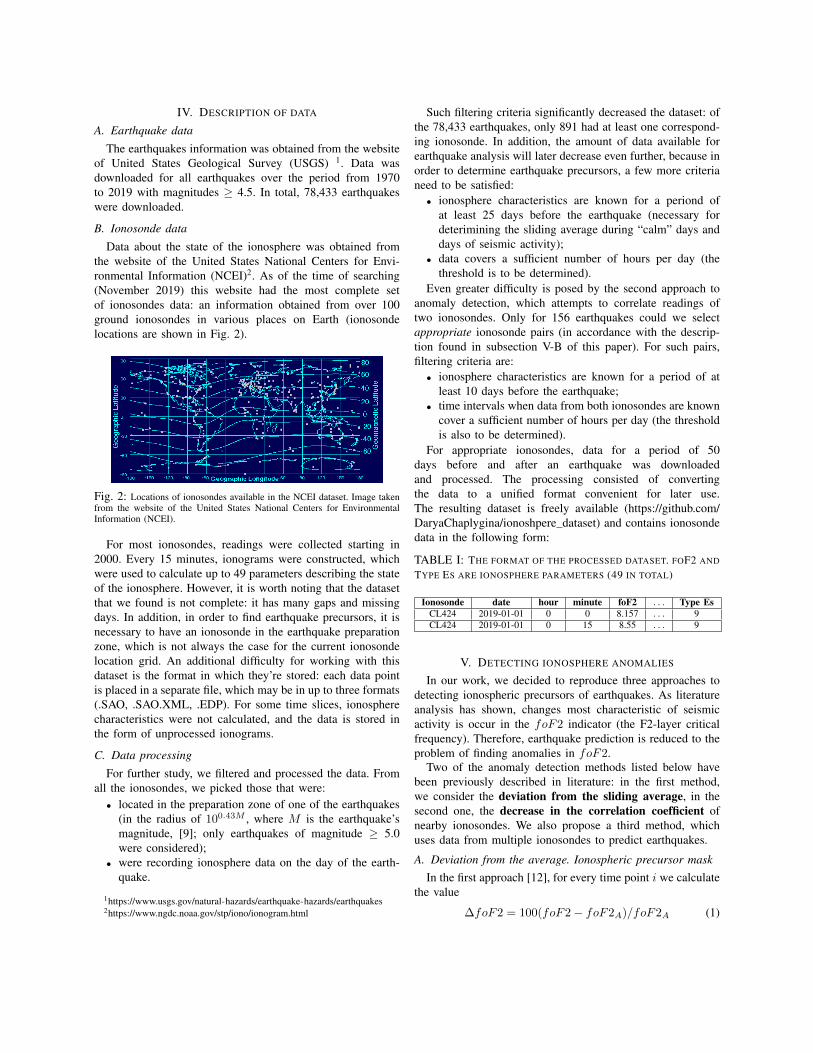
Data about the state of the ionosphere was obtained fromthe website of the United States National Centers for Envi-ronmental Information (NCEI)2. As of the time of searching(November 2019) this website had the most complete setof ionosondes data: an information obtained from over 100ground ionosondes in various places on Earth (ionosondelocations are shown in Fig. 2).
Fig. 2: Locations of ionosondes available in the NCEI dataset. Image takenfrom the website of the United States National Centers for EnvironmentalInformation (NCEI).
For most ionosondes, readings were collected starting in2000. Every 15 minutes, ionograms were constructed, whichwere used to calculate up to 49 parameters describing the stateof the ionosphere. However, it is worth noting that the datasetthat we found is not complete: it has many gaps and missingdays. In addition, in order to find earthquake precursors, it isnecessary to have an ionosonde in the earthquake preparationzone, which is not always the case for the current ionosondelocation grid. An additional difficulty for working with thisdataset is the format in which they’re stored: each data pointis placed in a separate file, which may be in up to three formats(.SAO, .SAO.XML, .EDP). For some time slices, ionospherecharacteristics were not calculated, and the data is stored inthe form of unprocessed ionograms.
C. Data processing
For further study, we filtered and processed the data. Fromall the ionosondes, we picked those that were:
• located in the preparation zone of one of the earthquakes(in the radius of 100.43M , where M is the earthquake’smagnitude, [9]; only earthquakes of magnitude ≥ 5.0were considered);
• were recording ionosphere data on the day of the earth-quake.
1https://www.usgs.gov/natural-hazards/earthquake-hazards/earthquakes2https://www.ngdc.noaa.gov/stp/iono/ionogram.html
Such filtering criteria significantly decreased the dataset: ofthe 78,433 earthquakes, only 891 had at least one correspond-ing ionosonde. In addition, the amount of data available forearthquake analysis will later decrease even further, because inorder to determine earthquake precursors, a few more criterianeed to be satisfied:
• ionosphere characteristics are known for a periond ofat least 25 days before the earthquake (necessary fordeterimining the sliding average during “calm” days anddays of seismic activity);
• data covers a sufficient number of hours per day (thethreshold is to be determined).
Even greater difficulty is posed by the second approach toanomaly detection, which attempts to correlate readings oftwo ionosondes. Only for 156 earthquakes could we selectappropriate ionosonde pairs (in accordance with the descrip-tion found in subsection V-B of this paper). For such pairs,filtering criteria are:
• ionosphere characteristics are known for a period of atleast 10 days before the earthquake;
• time intervals when data from both ionosondes are knowncover a sufficient number of hours per day (the thresholdis also to be determined).
For appropriate ionosondes, data for a period of 50days before and after an earthquake was downloadedand processed. The processing consisted of convertingthe data to a unified format convenient for later use.The resulting dataset is freely available (https://github.com/DaryaChaplygina/ionoshpere dataset) and contains ionosondedata in the following form:
TABLE I: THE FORMAT OF THE PROCESSED DATASET. FOF2 AND
TYPE ES ARE IONOSPHERE PARAMETERS (49 IN TOTAL)
Ionosonde date hour minute foF2 . . . Type EsCL424 2019-01-01 0 0 8.157 . . . 9CL424 2019-01-01 0 15 8.55 . . . 9
V. DETECTING IONOSPHERE ANOMALIES
In our work, we decided to reproduce three approaches todetecting ionospheric precursors of earthquakes. As literatureanalysis has shown, changes most characteristic of seismicactivity is occur in the foF2 indicator (the F2-layer criticalfrequency). Therefore, earthquake prediction is reduced to theproblem of finding anomalies in foF2.
Two of the anomaly detection methods listed below havebeen previously described in literature: in the first method,we consider the deviation from the sliding average, in thesecond one, the decrease in the correlation coefficient ofnearby ionosondes. We also propose a third method, whichuses data from multiple ionosondes to predict earthquakes.
A. Deviation from the average. Ionospheric precursor maskIn the first approach [12], for every time point i we calculate
the value
ΔfoF2 = 100(foF2 − foF2A)/foF2A (1)
Here foF2A is the average value of the foF2 indicator at thesame time i over the last 15 days.
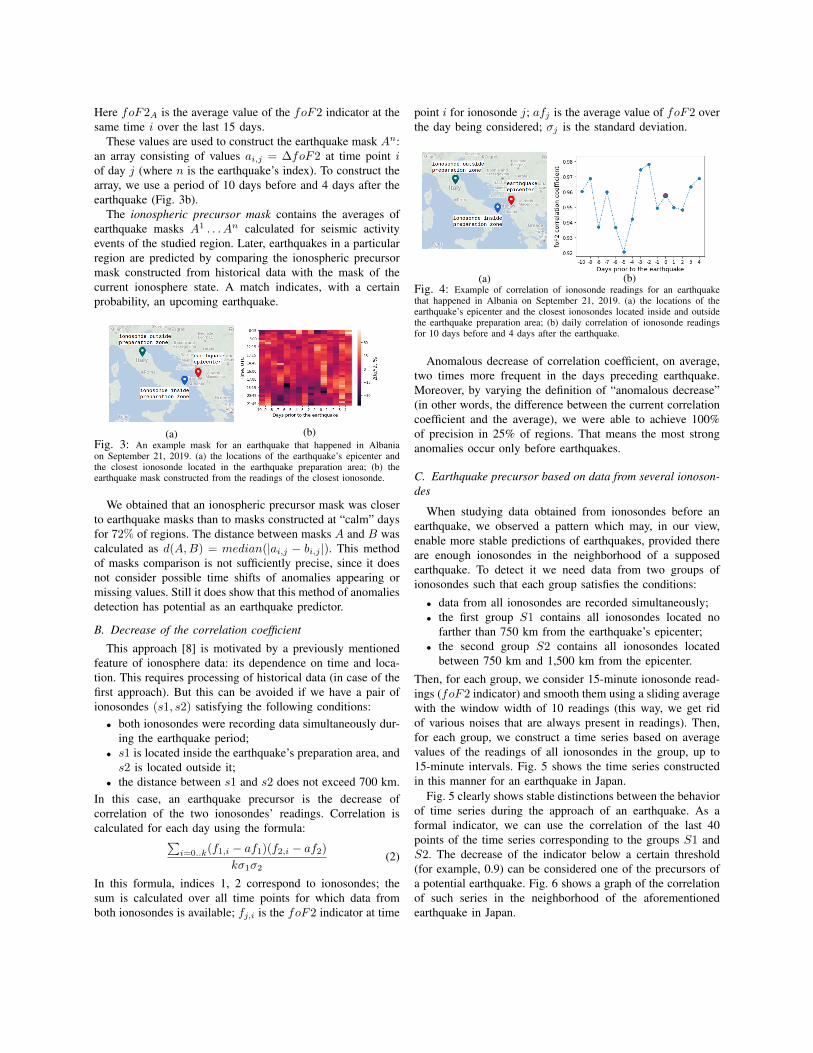
These values are used to construct the earthquake mask An:an array consisting of values ai,j = ΔfoF2 at time point iof day j (where n is the earthquake’s index). To construct thearray, we use a period of 10 days before and 4 days after theearthquake (Fig. 3b).
The ionospheric precursor mask contains the averages ofearthquake masks A1 . . . An calculated for seismic activityevents of the studied region. Later, earthquakes in a particularregion are predicted by comparing the ionospheric precursormask constructed from historical data with the mask of thecurrent ionosphere state. A match indicates, with a certainprobability, an upcoming earthquake.
(a) (b)Fig. 3: An example mask for an earthquake that happened in Albaniaon September 21, 2019. (a) the locations of the earthquake’s epicenter andthe closest ionosonde located in the earthquake preparation area; (b) theearthquake mask constructed from the readings of the closest ionosonde.
We obtained that an ionospheric precursor mask was closerto earthquake masks than to masks constructed at “calm” daysfor 72% of regions. The distance between masks A and B wascalculated as d(A, B) = median(|ai,j − bi,j |). This methodof masks comparison is not sufficiently precise, since it doesnot consider possible time shifts of anomalies appearing ormissing values. Still it does show that this method of anomaliesdetection has potential as an earthquake predictor.
B. Decrease of the correlation coefficient
This approach [8] is motivated by a previously mentionedfeature of ionosphere data: its dependence on time and loca-tion. This requires processing of historical data (in case of thefirst approach). But this can be avoided if we have a pair ofionosondes (s1, s2) satisfying the following conditions:
• both ionosondes were recording data simultaneously dur-ing the earthquake period;
• s1 is located inside the earthquake’s preparation area, ands2 is located outside it;
• the distance between s1 and s2 does not exceed 700 km.In this case, an earthquake precursor is the decrease ofcorrelation of the two ionosondes’ readings. Correlation iscalculated for each day using the formula:
�i=0..k(f1,i − af1)(f2,i − af2)
kσ1σ2(2)
In this formula, indices 1, 2 correspond to ionosondes; thesum is calculated over all time points for which data fromboth ionosondes is available; fj,i is the foF2 indicator at time
point i for ionosonde j; afj is the average value of foF2 overthe day being considered; σj is the standard deviation.
(a) (b)Fig. 4: Example of correlation of ionosonde readings for an earthquakethat happened in Albania on September 21, 2019. (a) the locations of theearthquake’s epicenter and the closest ionosondes located inside and outsidethe earthquake preparation area; (b) daily correlation of ionosonde readingsfor 10 days before and 4 days after the earthquake.
Anomalous decrease of correlation coefficient, on average,two times more frequent in the days preceding earthquake.Moreover, by varying the definition of “anomalous decrease”(in other words, the difference between the current correlationcoefficient and the average), we were able to achieve 100%of precision in 25% of regions. That means the most stronganomalies occur only before earthquakes.
C. Earthquake precursor based on data from several ionoson-des
When studying data obtained from ionosondes before anearthquake, we observed a pattern which may, in our view,enable more stable predictions of earthquakes, provided thereare enough ionosondes in the neighborhood of a supposedearthquake. To detect it we need data from two groups ofionosondes such that each group satisfies the conditions:
• data from all ionosondes are recorded simultaneously;• the first group S1 contains all ionosondes located no
farther than 750 km from the earthquake’s epicenter;• the second group S2 contains all ionosondes located
between 750 km and 1,500 km from the epicenter.
Then, for each group, we consider 15-minute ionosonde read-ings (foF2 indicator) and smooth them using a sliding averagewith the window width of 10 readings (this way, we get ridof various noises that are always present in readings). Then,for each group, we construct a time series based on averagevalues of the readings of all ionosondes in the group, up to15-minute intervals. Fig. 5 shows the time series constructedin this manner for an earthquake in Japan.
Fig. 5 clearly shows stable distinctions between the behaviorof time series during the approach of an earthquake. As aformal indicator, we can use the correlation of the last 40points of the time series corresponding to the groups S1 andS2. The decrease of the indicator below a certain threshold(for example, 0.9) can be considered one of the precursors ofa potential earthquake. Fig. 6 shows a graph of the correlationof such series in the neighborhood of the aforementionedearthquake in Japan.

(a) (b)Fig. 5: An example time series of ionosonde readings for an earthquake thatoccured in Japan on November 13, 2015. (a) locations of the earthquake’sepicenter and the closest ionosondes; (b) average ionosonde readings forgroups S1 and S2.
Fig. 6: Correlation of average readings of ionosondes from the two groupsfor the November 13, 2015 earthquake in Japan.
As in the previous case, anomalous decrease of correlationcoefficient begin to occur two times more frequent before mostof earthquakes. We could predict earthquakes even better usingabsolute difference between groups average values of foF2– its anomalous increase occurs from 2 to 20 times morefrequent in the days preceding earthquakes.
VI. CONCLUSION
In order to study ionospheric precursors of earthquakes,we gathered and processed a collection of data obtained byionosondes before an earthquake. This data was used to testionosphere anomaly detection methods described in section V.The future stages of the work are:
• constructing a predictive model of earthquakes based onthe described features;
• comparing the predictive capabilities of the three de-scribed precursors and determining their statistical sig-nificance (by analogy with paper [5]);
• combining ionospheric indicators with other earthquakeprecursors to increase the accuracy of predictions.
In conclusion, we would like to add that real-time earthquakeprediction requires a more regular network of ionosondes.Since our paper uses data collected from ground ionosondes,this condition is not met, as many earthquakes occur in placeswhere it is difficult to place equipment. The ability to obtainregular data from satellite-based ionosophere sounding wouldsignificantly increase the number of regions available for mon-itoring. As of the time of this article’s writing (February 2020),regular satellite-based sounding of the ionosphere is not beingconducted. However, satellite sounding of the ionosphere is
planned as part of the space complex ”Ionozond” [13] andthe ”Ionozond-TGK” experiment [14]. The measurements areslated to begin in 2021–2022. The ”Ionozond” complex willenable the collection of data from any point on Earth, and the”Ionozond-TGK” experiment, from the band between 51.63degrees northern latitude to 51.63 degrees southern latitude.We hope that by the time when ionosphere data is beingregularly obtained from satellites, we will have prepared andconfirmed a methodology for predicting earthquakes based ondata about the state of the ionosphere.
REFERENCES
[1] Alyona Galkina and Natalia Grafeeva. Machine learning methods forearthquake prediction: a survey. April 2019.
[2] C. F. Richter. Elementary Seismology. W. H. Freeman, 1958.[3] A. Biryukov, O. Grigoryan, S. Kuznetsov, V. Oraevsky, M. Panasyuk,
Sergey Pulinets, and V. Chmyrev. Space physics and ecology: Effectsfrom the earthquakes on the ionospheric heights (in russian). Inzhener-naya Ekologia (Engineering Ecology), pages 92–115, January 1996.
[4] S.A. Pulinets, A.D. Legen’ka, T.V. Gaivoronskaya, and V.Kh. Depuev.Main phenomenological features of ionospheric precursors of strongearthquakes. Journal of Atmospheric and Solar-Terrestrial Physics,65(16):1337 – 1347, 2003.
[5] Yuh-Ing Chen, J. Liu, Yi-Ben Tsai, and Chun-Shu Chen. Statisticaltests for preearthquake ionospheric anomaly. Terrestrial, Atmosphericand Oceanic Sciences, 15:385–396, October 2004.
[6] Stamatis.S. Kouris, Kostas Polimeris, Vincenzo Romano, Bruno Zolesi,and Ljiljana Cander. Within-the-hour variability: Levels and their prob-abilities. Annals of Geophysics, 49:945–959, August 2006.
[7] Sergey Pulinets, K. Boyarchuk, A. Lomonosov, Valery Hegai, andJ. Liu. Ionospheric precursors to earthquakes: A preliminary analysisof the fof2 critical frequencies at Chung-Li ground-based station forvertical sounding of the ionosphere (taiwan island). Geomagnetism andAeronomy, 42:508–513, July 2002.
[8] Sergey Pulinets. Ionospheric precursors of earthquakes; recent ad-vances in theory and practical applications. Terrestrial Atmospheric AndOceanic Sciences, 15:445–467, September 2004.
[9] Zubkov S. I. Miachkin V. I. Dobrovolsky, I. P. Estimation of thesize of earthquake preparation zones. Pure and Applied Geophysics,117(5):1025–1044, 1979.
[10] Chunliang Xia, Qi Wang, Tao Yu, Guirong Xu, and Shaomin Yang.Variations of ionospheric total electron content before three strongearthquakes in the qinghai-tibet region. Advances in Space Research,47(3):506 – 514, 2011.
[11] L.P. Korsunova and Valery Hegai. Possible short-term precursors ofstrong crustal earthquakes in japan based on data from the groundstations of vertical ionospheric sounding. Geomagnetism and Aeronomy,58:90–97, January 2018.
[12] Dmitry Davidenko and Sergey Pulinets. Deterministic variability ofthe ionosphere before strong (M ≥ 6) earthquakes in the regions ofGreece and Italy based on many years of observation (in russian).Geomagnetism and Aeronomy, 59:529–544, January 2019.
[13] Space complex ”Ionozond” (last accessed 4 February 2020).[Online] Available: http://www.vniiem.ru/ru/index.php?option=com content&view=article&id=469:-lr&catid=37:spaceprograms&Itemid=62
[14] ”Ionozond-TGK” experiment (last accessed 4 February2020). [Online] Available: http://www.tsniimash.ru/science/scientific-experiments-onboard-the-is-rs/cnts/experiments/ionozondtgk/

![Sub-auroral longitudinal anomalies in ionosphere ... · Protonosphere (GSM TIP) [9, 10]. Thermospheric and ionospheric parameters are calculated in the altitude range from 80 km up](https://img.pdfslide.us/doc/110x75/601845c9dfd99f1deb635236/sub-auroral-longitudinal-anomalies-in-ionosphere-protonosphere-gsm-tip-9.jpg)