Embed Size (px)
Citation preview


2
Predicting Driving Fitness in a Low Vision Clinic: Correlating Two Tasks
By
Katherine Johns B.A.
THESIS
In partial satisfaction of the requirements for the degree of
Master of Science
In
PHYSIOLOGICAL OPTICS
Presented to the
Graduate Faculty of the
College of Optometry University of Houston
May, 2017 Approved:
Harold Bedell, Ph.D., (Co-Chair)
Swati Modi, O.D., F.A.A.O., (Co-Chair)
Scott Stevenson, Ph.D.
Ronald Harwerth, O.D., Ph.D.
Committee in Charge

3
Abstract:
Predicting Driving Fitness in a Low Vision Clinic: Correlating Two Tasks
Purpose: The Useful Field of View (UFOV) computer task is a visual processing assessment tool used to aid in predicting driving fitness in low vision patients. The Dynavision 2000 board tests visuomotor reaction time, and also has been investigated for training skills pertinent to driving. However, very few studies to date have investigated Dynavision scores with relation to criteria for determining driving fitness, and standard normative scores have not yet been established. This study investigated the correlation between performance on the UFOV and Dynavision tasks, as the tasks could be used interchangeably if the correlation were strong. Performance data on both tasks were gathered for normal-vision adults and low vision patients of driving age. The effect of age and gender on subject performance on each task also was analyzed. Methods: Fifty-one normal-vision adults and 17 low vision patients participated on the UFOV and the Dynavision Mode A tasks. Each subject completed one UFOV computer trial, which measures visual processing speed (ms) as flashed images must be identified and located on the screen, and three 60-s trials on Dynavision Mode A, which determines visuomotor reaction times as a random sequence of illuminated buttons are struck on a large wall-mounted board. The UFOV Selective Attention task (Task 3) was analyzed in isolation because most normal subjects achieved the optimal threshold for Task 1, Processing speed (100% normal vision vs. 59% low vision) and Task 2, Divided Attention (84% normal vision vs. 6% low vision). Results: UFOV and Dynavision scores correlated positively and significantly (p<0.05) in normal adult (r2 = 0.392) and low vision subjects (r2 = 0.479). Increasing age was associated with poorer scores on both the UFOV and Dynavision tasks in the normal adult and low vision cohorts. Gender effect on performance was significant only for Dynavision performance in normal vision subjects, as males performed with shorter reaction times. Gender did not significantly affect performance on UFOV or on Dynavision for low vision patients. Conclusion: Performance on the UFOV and Dynavision tasks correlate moderately in both low vision and normal vision adult subjects. The amount of variability on one task accounted for by the other (39% for normal-vision adults and 48% for low vision patients) is not enough to support the interchangeability of the two tasks clinically. Dynavision should be further and more specifically investigated for its individual cutoffs, sensitivity, and specificity for identifying driving candidates and correlating to crash risk. If found to be related to driving capability, the results of both UFOV and Dynavision tasks could be combined to improve the recommendations concerning driving by low vision patients.

4
TABLE OF CONTENTS: I. Introduction. ……………………………………………………….……5 II. Background and Review of Literature …………………………….…..11 III. Methods ……………………………………………………………....19 IV. Results …………………………………………………………….….32 V. Discussion ……………………………………………………………..54 VI. Appendices Appendix A: Characteristics of Low Vision Subjects ………….. 62 Appendix B: UFOV Categories and Conversions ……………… 62 Appendix C: Raw Data …………………………………………. 65 Appendix D: Pilot Study: Normal Vision Children …………….. 67 VII. Bibliography ……………………………………………………….... 69 LIST OF FIGURES: Figure 1: Presentation of UFOV first task: Processing Speed. ………………………………….23 Figure 2: Presentation of UFOV second task, Divided Attention………………………………. .23 Figure 3: Presentation of UFOV third task, Selective Attention ………………………………... 24 Figure 4: Image of the Dynavision 2000 board …………………………………………………. 28 Figure 5: UFOV vs. Dynavision correlation and linear regression for normal adult subjects …...32 Figure 6: UFOV vs. Dynavision correlation and linear regression for low vision subjects …….. 33 Figure 7: Age vs. UFOV correlation and linear regression for normal adult subjects ………….. 35 Figure 8: Age vs. UFOV correlation and linear regression for normal vision children ………… 36 Figure 9: Age vs. UFOV, correlation for normal vision adults and children …………………… 37 Figure 10: Age vs. UFOV correlation and linear regression for low vision subjects …………… 38 Figure 11:Age vs. Dynavision correlation and linear regression for normal vision adult subjects 39 Figure 12: Age vs. Dynavision correlation and linear regression for normal vision children ……40 Figure 13: Age vs. Dynavision average reaction time for all ages ……………………………….41 Figure 14: Age vs. Dynavision linear regression and correlation for low vision adults ………….42 Figure 15: Performance by gender on UFOV; Normal vision adults …………………………….43 Figure 16: Performance by gender on UFOV: Low vision adults ………………………………. 45 Figure 17: Performance by gender on Dynavision: Normal vision adults ………………………..46 Figure 18: Performance by gender on Dynavision: Low vision adults ………………………….. 47 Figure 19: Mean reaction times across the 3 Dynavision trials for normal vision adults ……….. 49 Figure 20: A Bland-Altman plot of Agreement on Dynavision Trials 2 vs. 3 in Normal Vision Subjects ………………………………………………………………………………………….. 50 Figure 21: Mean reaction times across the 3 Dynavision trials for low vision adults ……………51 Figure 22: Bland- Altman plot for Dynavision Trial 1 vs. Trial 2 for Low Vision Subjects ……. 52 Figure 23: Bland- Altman plot for Dynavision Trial 2 vs. Trial 3 for Low Vision Subjects ……..53

5
INTRODUCTION:
This study aimed to address the general problem of how a low vision clinic can
use easily conducted visual tests to predict aspects of visual performance, such as fitness
to drive, in low vision patients.
By definition, “low vision” occurs when chronic vision loss or impairment is not
correctable by traditional means such as conventional glasses, contact lenses, surgery, or
other medical treatments. An estimated 3.5 million Americans have low vision, and 80%
of these patients are over age 65. Leading causes for visual impairment include age-
related macular degeneration (AMD), diabetic retinopathy, glaucoma, and other
retinopathies and optic neuropathies [1]. Low vision is most commonly thought of as
reduced visual acuity, or an impaired ability to read small letters on the eye chart;
however, the definition of low vision or visual impairment also includes persons with
reduced ability to perceive contrast, and/or a reduced field of view or blind spots within
the field of vision [1]. As, by definition, low vision is not correctable or curable,
rehabilitation to assist with the patient’s daily needs and tasks is the only vision care
option. Low-vision rehabilitation assesses a patient’s remaining visual function and
implements training and/or the use of optical devices or assistive technology in order to
improve quality of life and independence.
One common concern for low vision individuals is the impact of visual
impairment on the ability to drive a vehicle. This is true both for younger low vision
patients wanting to learn to drive for the first time (i.e., those with congenital etiologies
of decreased vision) and for older low vision patients wanting to continue or return to
driving after becoming visually impaired. Thus, a method to predict a visually-impaired
person’s potential driving performance is a sought-after element in clinics that care for
low vision patients. The optometric low-vision clinician does not make a final legal
determination of driving eligibility, as patients with low vision have to meet state-

6
mandated standards for visual acuity during their licensure test. The state of Texas
Medical Advisory Board also has a minimum requirement for the visual field (140
degrees of continuous horizontal visual field), but DPS neither tests driver license
applicants for visual field, nor designates a testing method for clinics to use [2].
However, even though low vision practitioners do not issue or withhold driver licenses,
they can and should use DPS guidelines to give counseling and recommendations for or
against patients attempting to drive or continue driving. The clinician also needs to
advise the patient regarding attempting the driving test outright, investigating the
potential benefit in fitting a bioptic telescope for meeting the licensure requirements,
referring for occupational therapy assistance for training pre-driving skills, or referring to
driving rehabilitation specialists for on-road training and testing. Thus, it is important for
a low vision optometric practitioner to be knowledgeable in counseling the patient,
setting expectations, and being realistic with the patient’s time, money, and effort put
toward attempts at driving training and testing. To fill this role, the low vision clinician
needs to be able to obtain and analyze useful and reliable data about the patient’s visual
and motor capabilities, with respect to their ability to drive, during their examination.
When evaluating driving fitness in low vision patients, a clinic will assess a few
important aspects of visual function, such as visual acuity, visual fields, and the ability to
discern color/contrast. However, because driving is a complex task, these few measures
cannot paint the entire clinical picture for evaluating that patient’s fitness to drive.
Driving requires levels of visual processing and attentional speed to spot landmarks,
other vehicles or obstacles, and traffic signs and signals as they rapidly enter and transit
through a moving driver’s visual scene. Driving, as a physical task, also requires an
ability to scan the environment and the vehicle’s mirrors with the driver’s head and/or
eyes. In fact, The National Highway Traffic Safety Administration's National Motor
Vehicle Crash Causation Survey found that, among older drivers, inadequate surveillance
of the visual driving scene (i.e., for oncoming vehicles or pedestrians) caused 33% of the
7
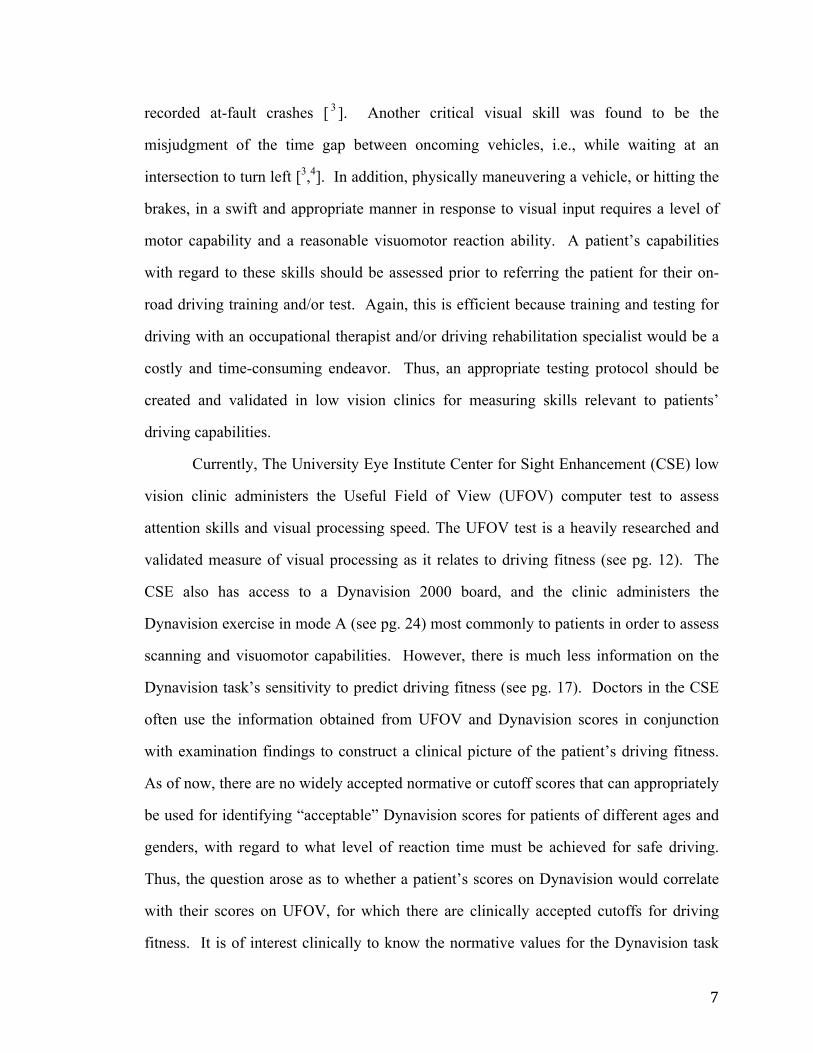
recorded at-fault crashes [ 3 ]. Another critical visual skill was found to be the
misjudgment of the time gap between oncoming vehicles, i.e., while waiting at an
intersection to turn left [3,4]. In addition, physically maneuvering a vehicle, or hitting the
brakes, in a swift and appropriate manner in response to visual input requires a level of
motor capability and a reasonable visuomotor reaction ability. A patient’s capabilities
with regard to these skills should be assessed prior to referring the patient for their on-
road driving training and/or test. Again, this is efficient because training and testing for
driving with an occupational therapist and/or driving rehabilitation specialist would be a
costly and time-consuming endeavor. Thus, an appropriate testing protocol should be
created and validated in low vision clinics for measuring skills relevant to patients’
driving capabilities.
Currently, The University Eye Institute Center for Sight Enhancement (CSE) low
vision clinic administers the Useful Field of View (UFOV) computer test to assess
attention skills and visual processing speed. The UFOV test is a heavily researched and
validated measure of visual processing as it relates to driving fitness (see pg. 12). The
CSE also has access to a Dynavision 2000 board, and the clinic administers the
Dynavision exercise in mode A (see pg. 24) most commonly to patients in order to assess
scanning and visuomotor capabilities. However, there is much less information on the
Dynavision task’s sensitivity to predict driving fitness (see pg. 17). Doctors in the CSE
often use the information obtained from UFOV and Dynavision scores in conjunction
with examination findings to construct a clinical picture of the patient’s driving fitness.
As of now, there are no widely accepted normative or cutoff scores that can appropriately
be used for identifying “acceptable” Dynavision scores for patients of different ages and
genders, with regard to what level of reaction time must be achieved for safe driving.
Thus, the question arose as to whether a patient’s scores on Dynavision would correlate
with their scores on UFOV, for which there are clinically accepted cutoffs for driving
fitness. It is of interest clinically to know the normative values for the Dynavision task

8
by age and gender so that the performance of low vision patients on the task can be
conceptualized by comparison to these norms. It is also of interest whether UFOV and
Dynavision scores are correlated, such that either task could be used interchangeably by
clinics possessing only one instrument or the other.
Two specific experimental questions were posed. (1) How do the scores for the
Selective Attention subtest of the Useful Field of View (UFOV) computer task relate to
the average score for the Dynavision 2000 board visuomotor 60-second task in Mode A,
as a function of age (from ages 8-100) and gender, both in the normal and low vision
populations? (2) How does the performance of age-and gender-matched patients with
various etiologies of low vision compare to the normative values on both tasks?
The specific purpose of this study was to gather normative data for adults on the
UFOV computer task and the Dynavision board, and to investigate the presence of a
correlation between UFOV and Dynavision scores in normally-sighted and low vision
adults. As mentioned above, the significance of a correlation between UFOV and
Dynavision scores lies in determining whether performance on one task is indicative of
performance on the other, for utility in better tailoring the administering of Dynavision as
an assessment tool for patients wishing to drive—a purpose for which UFOV is already
an accepted test with well-known cutoffs and indications [5]. A strong correlation
between the two would allow the tasks to be used interchangeably. Additionally, this
study analyzed the relationship between scores on the two tasks with regard to gender and
age, for subjects with normal vision and low vision. The presence and nature of a
relationship between these subject characteristics and UFOV and/or Dynavision scores
would allow for better clinical conceptualization and application of these scores in
different patient populations.
Additionally, both UFOV and Dynavision data were collected on normally-
sighted children in order to investigate normative data and age-matched expectations,
against which the University Eye Institute Center for Sight Enhancement (CSE) can

9
compare performance of low-vision children on the two tasks. The purpose of this
comparison and the testing of children is not so much for the assessment of their current
or future driving ability, but rather for to measure children’s current functional visual and
visuomotor processing and, thereby, better tailor their assistive and rehabilitative care.
While the clinical significance of obtaining an accurate predictor of driving
capability is easily appreciated, it also should be noted that a proper, thorough, and
reliable assessment of driving fitness can have a profound effect on each patient and the
community. Because UFOV and Dynavision can be used in conjunction with clinical
examination findings when recommending or withholding recommendation of on-road
driving training and tests, their capability to evaluate each patient’s driving fitness can
have significant repercussions for patient independence and lifestyle. This consideration
highlights the necessity of task-normative score cutoffs and conceptualizations that are
adjusted for factors like age and gender. A thorough evaluation of the UFOV and
Dynavision tests themselves is a necessary precursor to evaluating the patient with those
measures.
Anticipated results:
Based on clinical observation of patient performance, it was hypothesized by the
CSE clinicians that UFOV and Dynavision scores would positively correlate in normal-
vision adult and child, and low vision subject populations, such that subjects who
perform well on one test would generally perform well on the other, and those with more
average or poorer scores on one task will similarly score average or poorly on the other.
It was similarly hypothesized that, in the aggregate, low vision patients would perform
with significantly poorer scores (slower processing speeds and longer reaction times)
than adults with normal vision on both tasks.

10
Possible interpretations:
If, as hypothesized, a correlation between UFOV and Dynavision were found to
exist and each task’s score serves as a strong predictor of performance on the other, a low
vision clinic seeking to predict a patient’s driving potential could administer only one of
the tasks, either UFOV or Dynavision, to obtain an assessment of visual skills used in
driving. However, if the two tasks do not significantly or strongly correlate, or if there is
highly variable relationship between UFOV and Dynavision scores among subjects, then
further research is indicated for the Dynavision apparatus and the relationship between
Dynavision scores and crash risk/driving performance. The possibility of an independent
link between Dynavision and driving performance would indicate that both UFOV and
Dynavision could be administered to potential drivers to increase sensitivity and
specificity of the evaluation of potential driving candidacy. In that case, UFOV and
Dynavision would separately test visual processing and visuomotor abilities to get a more
holistic prediction of driving risk. If a significant change in performance on either task
occurs as subject age increases, then clinicians should consider age differences when
creating performance expectations for older patients. Similarly, if significant performance
differences exist for males versus females, or middle-aged versus older adults on these
tasks, then different clinical criteria may need to be implemented for these patient
subgroups.
To date there has not yet been any research comparing the scores on these two
tasks to determine their correlation, or for their possible interchangeability.

11
REVIEW OF LITERATURE:
On Low Vision Drivers:
Driving is a common topic of concern and discussion in low-vision assessment
and rehabilitation clinics. The determination of the most sensitive and specific predictors
of on-road driving capability is of paramount importance, as refusal to recommend a
patient for on-road driving due to a low score on one or more tasks that predicts driving
performance can be life-changing for the patient. Driving for many individuals is a
symbol of independence as well as a necessary means of transportation. Of the 3.5
million Americans with low vision, approximately 80% of those are over age 65; the
prevalence of low vision in our population is about 1% for people in their sixties and
increases to about 20% for people in their nineties. Thus, most low vision patients do not
become visually disabled until later in life [1]. Because many low vision patients are
elderly, driving ability holds particular importance because of its implications on the
patients’ ability to be independent, including care for themselves. Furthermore, the
unfortunate reality is that losing the ability to drive can be socially isolating, and limits
the patient’s access to healthcare and employment [6]. In fact, cessation of driving has
even been linked to increased depressive symptoms for the elderly population [6,7].
Due to the threat that low vision poses on the ability to safely operate a motor vehicle,
assessing crash risk is a common topic of research for low vision clinics. Many studies
have investigated correlations between characteristics of low vision drivers and their risk
of being involved in a motor vehicle crash. For instance, it has been shown that age and
visual impairment correlate positively with motor vehicle crash risk [8]. In fact, the
Overview of Injury in Texas and Role of EMS/Trauma Registry found that in 2004,
motor vehicle injuries were the leading cause of injury-related death in adults aged 65 to
74; motor vehicle crashes were the second leading cause of injury-related death (after
falls) in adults over 75 [9]. Additionally, in 2014, more than 5,700 older adults were
killed and more than 236,000 were treated in emergency departments for motor vehicle

12
crash injuries. This means approximately 16 older adults are killed and 648 are injured in
crashes on average every day [10,11]. Other studies, however, found that presence or
absence of previous driving experience, or increased numbers of miles driven, correlated
more with crash risk than increased age did for low vision drivers [12,13].
While many different characteristics of low vision drivers can factor into their
crash risk, potential drivers must first be assessed individually for their capabilities,
ideally with an objective measurement test, in the clinical setting or closed-road setting,
and in a manner that is most sensitive and specific at determining skill level for the task
in question: on-road driving.
2) On Useful Field of View (UFOV) (See pg.18 for information on UFOV subtests and
test administration).
One heavily researched and consistently described clinical test related to the
visual demands of driving is the Useful Field of View computer task (UFOV). Research
has shown that including UFOV in the pre-driving testing battery improves a vision
exam’s predictive power to appropriately assess driving performance [11]. As described
above, The University Eye Institute Center for Sight Enhancement (CSE) low vision
clinic administers the UFOV test to assess attention skills and visual processing speed.
Assessing visual attention and processing capabilities in drivers is important because
good visual acuity is not sufficient to ensure success with the complex visual components
of driving; in fact, Rubin et al. found that, while UFOV was a significant predictor of
crash involvement, visual acuity was not [13]. Thus, standard state driver licensing tests
of acuity may not be sufficient to identify at-risk drivers.
Attentional capacity and the ability to quickly perceive, identify, and locate
objects in the visual field are abilities tested by the UFOV program, and are crucial for
motor vehicle drivers for safe navigation, because the appropriate deployment of visual
attention allows a driver to extract relevant or salient information from a complex visual

13
scene very quickly, at a preattentive processing level [14]. For example, an unexpected
traffic light change or approaching vehicle can catch the driver’s attention, allowing them
to safely maneuver or stop in time. According to Owsley et al., “Because driving is a
complex visual/cognitive task, it is unlikely that the assessment of eye health and visual
function alone would be sufficient to predict accident frequency. Eye health and visual
function variables measure the quality of visual information available to the driver. Even
if the incoming visual information is not degraded, different drivers may attend to
different aspects of the scene as well as interpret the visual information in different ways.
Thus, any model that attempts to predict accidents on the basis of visual input must
include measures of information-processing skills. One such skill is visual attention” [14].
Tests of visual acuity and visual field alone fail to include such considerations, as
“…standard clinical visual field tests may not fully describe the difficulties that may be
encountered by people with visual impairment undertaking tasks in the cluttered
environments and multiple demands of everyday life” [15]. Explicitly, the driver must be
able to pay selective attention to salient information amidst a cluttered visual scene, at a
very quick, even preattentive, speed of processing. This is the basis of UFOV’s Task 3,
Selective Attention (see pg.18).
UFOV scores have been linked consistently to primary visual processing and
visual attention abilities [16]. A previous study by Ball et al. considered many aspects of
the human visual information-processing system, including health of the eyes and vision,
visual sensory function, visual attention including the Useful Field of View, and
cognitive skills by a battery of neurocognitive tests, and related these to the subject’s
crash frequency [17]. This study found that the strongest predictors of vehicle accidents
in the study were UFOV and mental status, which together accounted for 20% of accident
variance. While eye health and visual sensory function did contribute to UFOV
performance, these variables were not themselves found to be correlated to accidents [17].
Another study, by Owsley et al., found that tests of the Useful Field of View (including

14
processing speed, divided attention, and selective attention tasks) were the most
predictive measure of motor vehicle accidents involving the participants during the
previous five years [14]. In fact, another study by Goode et al. evaluated UFOV Tasks 1-
3 scores and neuropsychological and cognitive test scores in relation to state-recorded at-
fault crashes for the subjects; it was found that UFOV was the single most important
crash predictor, with sensitivity and specificity of 86.3% and 84.3% respectively [18].
Persons whose UFOV scores were reduced by 40% or greater from normal values on all
3 UFOV subtests when combined were six times more likely to have been at-fault for an
automobile crash in the previous 5 years, compared to persons with minimal or no
reduction in UFOV performance [17]. For reference, a 40% or greater reduction in UFOV
corresponds to a threshold value larger than or equal to 100ms on Task 2, and a threshold
value larger than or equal to 350ms on Task 3 [5]. This outcome was supported by Ball et
al., who reported that the UFOV had a sensitivity of 89% and a specificity of 81% in
predicting which drivers had a history of automobile crashes [18].
Another study that investigated visual and medical characteristics of older drivers
found that history of any falls and UFOV scores were most related to crash risk, finding
that patients whose UFOV was reduced by >30% had more overall crashes as well as
more at-fault crashes [19]. Rubin et al. reported that a reduction in overall score on a
composite of the 3 UFOV Tasks along with glare sensitivity and visual field loss were
significant predictors of automobile crash involvement, while visual acuity, contrast
sensitivity, and stereoacuity did not correlate with crashes [16]. However, it has also been
proposed that many drivers with low contrast sensitivity self-limit or even cease driving,
so crash risk alone may not be an appropriate indicator of driving impairment [20]. A
study by Owsley et al found that contrast sensitivity impairment, specifically in cataract
patients, was in fact associated with crash risk [21]. Even so, no state currently
administers tests of contrast sensitivity prior to motor vehicle licensure.

15
For UFOV test administration:
UFOV has been shown to have good reliability coefficients between the first test
and a retest; the correlation coefficient for the 3 composite UFOV subtests was shown to
be 0.88 in a group of 70 participants taking all 3 UFOV subtests approximately 2 weeks
apart [5]. Although some studies have shown that UFOV testing shows some learning
effect, with test-retest measures showing less processing time needed for subjects on their
second UFOV attempt (with scores remaining statistically constant after the second
attempt, [22] I deemed it impractical to rely on low vision patient and normal-vision
subject return for retest, and time constraints during the low vision exam are prohibitive
to repeating UFOV twice in one visit for a test-retest measure. Thus, I decided to
administer one UFOV trial, including all 3 subtests, to both the normal vision and low
vision cohorts for this study.
Anticipated Results for UFOV:
UFOV scores have been analyzed in relation to subject characteristics like age,
gender, race, visual acuity, education, mental status, etc. Increased age has been
consistently related to poorer baseline UFOV scores and a larger rate of decline in UFOV
performance over time, unrelated to the aforementioned covariant factors [23]. UFOV
scores (in this study, the sum total of the thresholds for all tasks) were found to follow a
curvilinear pattern, with threshold decreasing (scores improving) and then increasing
(scores declining) over a five-year period in control adults over age 65 [23]. The initial
improvement represents the learning effect seen with UFOV, and the subsequent
worsening is attributed to increasing age. Other studies have shown that UFOV
performance improves in children until about age 14, when adult levels are generally
reached [24 ]), and that performance in individuals above age 40 declines (longer
processing thresholds for UFOV in older adults [25, 26]. Thus, we hypothesized that we

16
also would see this age effect in UFOV testing. There was no expected gender difference
on the UFOV task.
3) ON DYNAVISION: (See methods pg. 24 for Dynavision task descriptions and test
administration).
There is much less evidence in the literature that explicitly correlates Dynavision
scores with assessments of driving performance or crash risk. Only one previous study
by Klavora et al, which investigated a small cohort of 10 post-stroke patients, found post-
hoc that a threshold score of 50 hits in 60 seconds on the Dynavision Mode A task was a
significant differentiator between subjects who passed and failed an on-road driving test
[27]. However, this score was achieved in these patients after a 6-week Dynavision
training program. Then, a single follow-up study, also by Klavora et al, found that this
50 hit threshold had a 66% accuracy for predicting pass/fail outcomes on an on-road
driving test in 56 participants [28]. No research explicitly links Dynavision scores with
crash record.
However, the the Dynavision 2000 board does test skills related to the complex
visual and physical requirements of operating a motor vehicle. Dynavision is “…an
apparatus designed to test and train visual scanning, peripheral visual awareness, visual
attention, and visuomotor reaction time across a broad, active visual field. Dynavision
also requires execution of visuomotor response sequences, basic cognitive skills (short-
term memory), and physical and mental endurance” [27]. Peripheral visual field
awareness and the ability to scan with the head and eyes for salient information in the
visual periphery (i.e., an illuminated light in the Dynavision task, versus vehicles,
obstacles, and pedestrians in a driving visual scene) are critical for safe driving [3].
Similarly, Dynavision has been shown to be a reliable indicator of a person’s visuomotor
reaction time [29], which is a skill necessary for driving, as drivers need to quickly
observe relevant changes in their surroundings and physically react to their visual
17
environment by rapid adjustments in controlling the vehicle, i.e. pressing the pedals or
turning the steering wheel. As the skills tested by Dynavision appear to be related to
those required in driving, it is plausible that Dynavision scores are related to on-road
driving capabilities, although that link should be explored further.
Dynavision has also been tested for its efficacy in training skills for driving, as
some small studies and case reports of post-stroke patients who received Dynavision
training improved their reaction time and concurrently had better overall on-road driving
test scores [27, 30]. Another study by Crotty et al., however, showed that the benefits of
Dynavision training are limited to the Dynavision task and do not significantly aid
persons in passing an on-road driving test [31].
On Administration of the Dynavision task:
The Dynavision task shows good repeatability, with a test-retest correlation
coefficient of 0.71 – 0.73 [32]. Another study by Klavora et al. showed an intraclass
reliability coefficient of .88 on multiple (five) trials for the subject-paced Mode A
Dynavision task*. Some of the variance among trials is accounted for by a learning
effect, as subjects’ performance improves with practice; however, scores appear to level
off after 2 trials, as all significant differences in scores were found to occur between trials
1 and 2 in this study [33].
For these reasons, I administered the Dynavision task 4 times, allowing the
subject to practice during the first trial, and averaged the subsequent 3 trials to obtain
their recorded score. Reaction time and visuomotor capabilities as measured by the
Dynavision apparatus also appear to depend upon a subject’s age and gender, with older
persons and females exhibiting longer reaction times than younger persons or males [34].
Thus, we recorded and analyzed age and gender with respect to performance on the tasks.
*The intraclass correlation coefficient describes the assessment of consistency of a measurement made multiple times; a value between 0.75 and 1.0 is considered to display excellent agreement. [Cicchetti, Domenic V. (1994). “Guidelines, criteria, and rules of thumb for evaluating normed and standardized assessment instruments in psychology”. Psychological Assessment. 6 (4): 284–290.].

18
Anticipated Results for Dynavision:
Although there exists no aggregate normative data for Dynavision performance, I
hypothesized that, like the UFOV, Dynavision scores would show a non-linear age effect;
specifically, an increase in successful hits per minute (decreasing reaction time) from
childhood until maturity is reached, and then a decline in performance (increase in
reaction time) for subjects beyond the age of approximately 40. It was hypothesized that
males would perform the visuomotor Dynavision task with shorter reaction times than
females, as indicated by previous literature [34]. It was similarly expected that low vision
patients would perform with longer reaction times on average than the control population,
across all ages and both genders.

19
METHODS AND SPECIFICATION OF EXPERIMENTAL SUBJECTS:
The goal of this project was to gather normative data for the Dynavision board for
men and women with a range of ages, and to compare each subject’s UFOV score to his
or her Dynavision score. Two principal populations were sampled: normal-vision adults
(subjects without any uncorrectable vision loss), and low vision adults.
Normal-Vision Subjects:
Normal-vision adult subjects for this study were recruited from available
University of Houston College of Optometry students, faculty, and staff, as well as the
friends and family of the aforementioned. Study recruitment flyers were posted in
meeting areas and on visible bulletin boards around the College. Additionally, much of
the recruiting was performed via word-of-mouth in the classroom and at the offices of
faculty and staff. Before the start of data collection, the experimental protocol and
recruiting procedures were reviewed and approved by the University of Houston
Committee for the Protection of Human Subjects.
Fifty-one (51) normally-sighted (non-low vision) adults (29 F, 22 M, average age
43.67+14.74, range 21-73) were recruited to participate in the UFOV computer task and
on the Dynavision 2000 board test. Inclusion of subjects for the normal adult cohort was
based on adult status (all over 18 years of age), and the verbal denial of any uncorrectable
visual impairment or physical impairment that would hinder the ability to complete the
tasks. No persons under the age of 18 or with any uncorrectable visual impairment or
any motion-limiting physical disability were included in the sample.
Normal-vision adult subjects attended one session, of approximately 30 minutes,
without any other follow-up. Subjects were given the informed consent document to
read, and the purpose and method of testing was described; all subjects were offered an

20
opportunity to ask questions, and each subject was required to sign and date the consent
document, and verbally deny visual or physical impairment in order to participate.
After granting informed consent, each subject was administered both the UFOV
and Dynavision tasks. Each subject completed one trial of the UFOV computer task,
including the Processing Speed, Divided Attention, and Selective Attention tasks (see pg.
20), and one practice trial and three recorded 60-second trials in Mode A of the
Dynavision 2000 board. A Microsoft Excel Random Number function, which generated
a random decimal between 0 and 1, designated which task each subject completed first: if
the number generated was below 0.5, the Dynavision trials were done first; if the
generated number was above 0.5, the UFOV trial was done first.
Low Vision Subjects:
Low vision population subjects consisted of patients seen for a low vision
examination by appointment at the University Eye Institute Center for Sight
Enhancement, and analysis included only those patients willing to participate and fill out
an informed consent document during their exam, to allow for the inclusion of their
scores. These patients participated on both UFOV and Dynavision tasks as part of their
clinical examination, and they were included in this study only if they had no physical
impairment that would hinder performance on the tasks.
Seventeen (17) low vision patients of driving age (9 F, 8 M, aged average
33.35+17.82, range 16-83) agreed to participate, and performed both UFOV and
Dynavision as part of their examination. These patients performed the study tasks during
their appointments of varying lengths, and the appointments may have included a variety
of other testing procedures before and/or after UFOV and Dynavision were administered.
In the Center for Sight Enhancement, low vision patients are administered UFOV and
Dynavision during their examination if the patient is currently driving or expresses
interest in learning to drive or returning to driving. Inclusion of low vision study subjects
21
was based upon driving-age status (16 or over) and denial of any physical impairment
that would hinder performance on the tasks.
Low vision patients were given (and as needed, aided through) a large-print copy
of the informed consent document, and were counseled on the purpose of the study and
allowed to ask questions. After providing informed consent, the UFOV and Dynavision
tasks were administered to the patients in a pseudo-random order, per preference of the
examining clinician. Like the subjects with normal vision, the patients completed one
trial of the UFOV computer task, including the Processing Speed, Divided Attention, and
Selective Attention tasks (see below), and one practice and three recorded 60-second
trials in Mode A on the Dynavision 2000 board. Scores for UFOV and Dynavision, as
well as the age, gender, and etiology of low vision were recorded for these subjects. A
table of these characteristics for the low vision subjects is seen in Appendix A.
Additionally, a pilot study was initiated to gather normative data for children on
the UFOV and Dynavision tasks. While there has been one investigation of normative
performance on the UFOV test in children, there exists no study to date that displays
expected or normative values for a child on any Dynavision task [12]. It was thought that
data obtained on children with normal vision would be helpful to the CSE clinic for
conceptualizing the visuomotor capabilities, peripheral visual awareness and scanning
capacity of children with low vision. Eight normal-vision children were recruited.
UFOV Task Details:
The Useful Field of View (UFOV) task is administered by a computer program,
and tests visual processing abilities of the subject. It has three subtests: Processing
Speed, Divided Attention, and Selective Attention.
The computer program was designed to present stimuli on a 17-inch computer
monitor, and our clinic’s newest version of the software was compatible with the
Windows 7 operating system. The refresh rate of the computer monitor must be

22
appropriate to display the targets with the appropriate presentation speed. We set the
refresh rate to 75 Hz to allow the fastest programmed flash presentation, 14.8
milliseconds, to display correctly. The output of a photocell with a rapid response time
was displayed on an oscilloscope to verify the duration of the stimulus presentation,
which was found to be accurate. Recommended viewing distance from the computer
monitor while performing the UFOV task is 18-24 inches, as indicated by the UFOV
User’s Guide [5]. At this viewing distance, each presented car and truck stimulus (i.e.,
the central car/truck target in each task, and each peripheral target for tasks 2 and 3) is
approximately 1 inch wide, corresponding to a visual angle of 2 to 3 degrees. The subject
views the computer screen binocularly, with his or her habitual vision correction if used
for that working distance. The UFOV User’s Guide indicates that best spectacle
correction is recommended, but small refractive inaccuracies should not interfere with
testing as even “…a substantial degree of blurred vision” does not degrade performance
on the three tasks [5]. The subject operated a computer mouse during each task and
responded by clicking on one of the answer choices presented on the screen.
The first task, Processing Speed, involves a central fixation box and a brief flash
of either a simple car shape or a simple truck shape, which is presented for a variable
number of milliseconds (Figure 1). After the brief presentation and a second of entire-
screen visual noise, the subject was asked to identify which vehicle (car or truck) flashed
in the fixation box by clicking on the appropriate icon on the computer screen.
Presentation time varies from 500 ms to 14.8 ms; two successive correct answers cause
the computer program to shorten the duration of the car or truck presentation on the next
trial, whereas an incorrect response lengthens the subsequent presentation time. This
program uses the staircase method to estimate the 71% correct threshold, to determine the
threshold processing speed for correct image identification [5].

23
Figure 1: Presentation of UFOV first task: Processing Speed.
The second UFOV task, Divided Attention, is similar to the first task, but with an
added level of difficulty: the flashed image still presents either the car or the truck shape
in the center fixation box, but now also simultaneously includes a car in the periphery
along one of 8 meridians (Figure 2). The subject must answer two questions for this task:
1) What was the image in the center box (car or truck)? And, 2) Along which one of the 8
meridians was the peripheral car located? The correct answers are selected by clicking on
the central object seen and then clicking on the meridian on which the peripheral object
was seen. Once again a two-down, one-up staircase method controls the duration of
successive presentations to find the subject’s threshold duration, at 71% correct, for the
divided attention task.
Figure 2. Presentation of UFOV second task, Divided Attention.

24
The third UFOV task, Selective Attention, is similar to the second task, in that
either a car or the truck flashes in the center fixation box, and a peripheral car
simultaneously flashes along one of 8 meridians; however, this task also features 47
distractor triangles arrayed around the fixation box to obscure the location of the
peripheral car (Figure 3). Subjects were asked the same two questions as in the Divided
Attention task: 1) What was the image in the center box (car or truck)? And, 2) Along
which one of the 8 meridians was the peripheral car located? The subject’s threshold is
again determined by varying the presentation duration, with every two correct answers
prompting the program to decrease the presentation time, and each incorrect answer
producing an increase in the presentation time.
Figure 3. Presentation of UFOV third task, Selective Attention
Subjects completed each of the three UFOV subtests once, in the order presented
above. After each subtest, the UFOV computer program displays the subject’s threshold,
in milliseconds, for the target duration corresponding 71% correct identification for each
task [5].
For scoring, the computer program calculates and displays the subject’s threshold
in milliseconds for each task; based on these results, the program classifies each subject
into one of 5 categories for driving crash risk based on the estimated values of visual
processing speed: Category 1 being Very Low Risk to Category 5 being Very High Risk

25
for a motor vehicle crash. See Appendix B for the table of cutoff threshold values for
each category [5].
Dynavision Task Details:
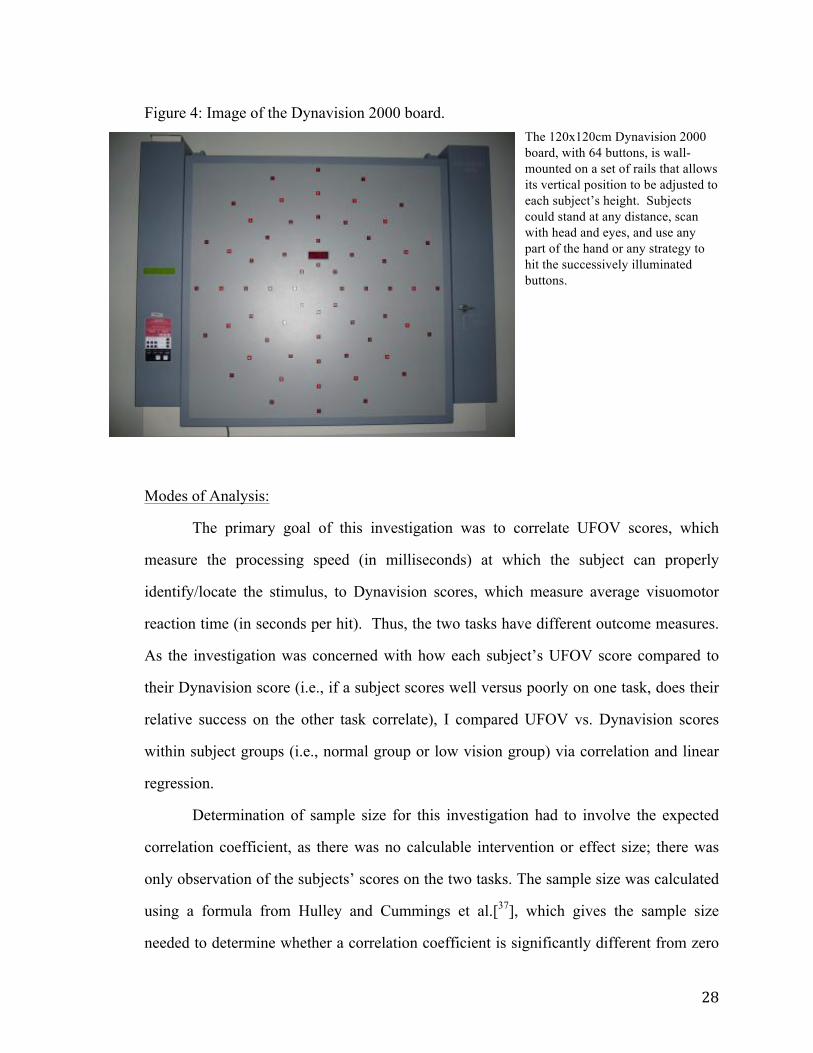
The Dynavision 2000 is a 120x120 cm square board with 64 square button lights
(each 2x2 cm) arranged in 5 concentric rings that are centered vertically and horizontally
on the board (Figure 4). Slightly above the geometric center of the board is a LED screen,
which is not illuminated in Mode A (although it can be used in other Dynavision tasks)
that can serve as a height landmark. In this study, the apparatus operated in the “subject-
timed” Mode A as follows: for 60 seconds, the board randomly illuminates single buttons
in succession; subjects were instructed to press each illuminated button one at a time, as
quickly as possible. Each time after a button is correctly struck, the apparatus advances
to illuminate a new randomly selected button, which the subject then has to find and
strike, and so on. The goal of the exercise is to obtain as many hits of the lit buttons as
possible in the 60-second time frame. Other, more complicated tasks on the Dynavision
board include the apparatus-paced mode, in which the buttons remain illuminated for a
set duration, such as 1 second, and will advance to light the next button whether or not
the subject makes a correct hit. Even more complicated tasks include numbers displayed
on the LED screen (from one to many digits, displayed from less than a second to longer
periods of time) that the subject has to recite while pursuing illuminated buttons in the
aforementioned manner. Again, for this study, the Dynavision task was performed on the
subject-timed Mode A only.
Subjects were encouraged to stand at arm’s length from the Dynavision board,
with the board adjusted on the wall so that the height of the LED screen, which is slightly
above the geometric center of the board, was approximately at eye level, and the
uppermost and lowermost buttons were all within reach. To locate the lit buttons,
subjects were permitted to scan all areas of the board by moving their head and eyes (i.e.,
the subjects did not have to fixate at the center and use only peripheral vision to hit the

26
peripheral buttons), and they could use any part of their hand or any strategy to hit the
buttons. Scanning is permitted because peripheral visual awareness leading to head and
eye scanning, along with the visuomotor reaction ability, are the tested skills that are
assumed to be most pertinent to driving ability. These testing conditions were applied as
outlined in the Dynavision’s manual [35].
Additionally, the Dynavision manual outlines testing conditions that call for dim
room illumination. Dim illumination is necessary because complete darkness in the
testing area allows each illuminated button to very quickly and saliently catch the
subject’s attention, with essentially no scanning required. A room that is too brightly lit,
on the other hand, causes the illuminated button to be distinguished from the unlit buttons
only with great difficulty. In our testing room, one set (half) of the overhead fluorescent
lights were turned off to decrease ambient room lighting and reduce glare on the board
itself. For reference, we used a photometer to assess the luminance of different regions
of the Dynavision board (the gray background upon which the lights are mounted) and
the lit red buttons themselves. As the partial room lighting cast slightly more light on the
lower half of the board, it was found that the upper gray of the board had a luminance
value of about 3.4 cd/m2, whereas that of the lower portion of the board was 9.4 cd/m2.
The lit buttons on all regions of the board had a luminance of approximately 30 cd/m2.
Although the Dynavision manual does not specify recommended luminances, or a
contrast value, for the background board and the lit buttons, the illumination in our
experimental condition was deemed to adhere appropriately to the manual’s
recommendations. The difference in luminance between the top and the bottom of the
background board was the same for all subjects and was deemed negligible, as the Weber
contrast of all the illuminated buttons was greater than 200%.
As mentioned above, we elected to administer 1 practice and 3 trials of the
Dynavision task in Mode A to assess, and potentially account for a learning effect.
Subjects completed the first 60-second practice trial and were offered an additional

27
practice trial, in case the subject did not grasp the premise of the task, before the three
recorded trials were completed. No subject elected to take the extra practice trial.
For scoring, the Dynavision apparatus tabulates the number of successful hits that
a subject acquires in the 60 second run time. There are then two ways that one can
calculate a reaction time. One way, performed by the Dynavision apparatus, is by
recording the amount of time that elapses between each hit (inter-hit interval), and then
averaging those across the 60 second trial. This average reaction time, in “seconds” (i.e.,
the number of seconds the subject requires, on average, to make a proper hit) is displayed
with the results after the trial is over. A second way to calculate the subject’s estimated
reaction time would be to take the inverse of the number of hits in 60 seconds; i.e., 120
hits in 60 seconds gives an estimated reaction time of 0.50 seconds per hit. These two
determinations of reaction time are not precisely equal, particularly if a subject exhibits
great variability in the elapsed time between successive hits. However, across subjects,
the (inverse) correlation between the number of hits in 60 seconds vs. the Dynavision-
calculated average inter-hit reaction time in seconds (per hit) has been shown to be nearly
perfect (r= - 0.997) [36]. For this study, I elected to analyze performance using the
apparatus-calculated average of the time in seconds for each hit, considering this to best
represent each subject’s average reaction time. After the initial practice trial, these
apparatus-provided reaction times for the subsequent 3 Dynavision trials were averaged
to give that subject’s score, and are reported below as average “reaction time,” in units of
seconds (per hit).
28
Figure 4: Image of the Dynavision 2000 board. The 120x120cm Dynavision 2000 board, with 64 buttons, is wall-mounted on a set of rails that allows its vertical position to be adjusted to each subject’s height. Subjects could stand at any distance, scan with head and eyes, and use any part of the hand or any strategy to hit the successively illuminated buttons.
Modes of Analysis:
The primary goal of this investigation was to correlate UFOV scores, which
measure the processing speed (in milliseconds) at which the subject can properly
identify/locate the stimulus, to Dynavision scores, which measure average visuomotor
reaction time (in seconds per hit). Thus, the two tasks have different outcome measures.
As the investigation was concerned with how each subject’s UFOV score compared to
their Dynavision score (i.e., if a subject scores well versus poorly on one task, does their
relative success on the other task correlate), I compared UFOV vs. Dynavision scores
within subject groups (i.e., normal group or low vision group) via correlation and linear
regression.
Determination of sample size for this investigation had to involve the expected
correlation coefficient, as there was no calculable intervention or effect size; there was
only observation of the subjects’ scores on the two tasks. The sample size was calculated
using a formula from Hulley and Cummings et al.[37], which gives the sample size
needed to determine whether a correlation coefficient is significantly different from zero

29
for the expected correlation†. The primary question of this investigation was the
correlation between UFOV vs. Dynavision scores, and there exists to date no prior
knowledge of an expected linear relationship, or correlation coefficient, between the two
tasks. Thus, I determined that a meaningful correlation coefficient would be r = 0.707,
such that r2 = 0.50 and 50% of the variance in scores on one task (UFOV or Dynavision)
would be accounted for by the other. However, for the “expected correlation coefficient”
in the sample size calculation, I chose a lower value of r = 0.5, so that the sample size
would be sufficiently large to find a correlation coefficient statistically significant from
zero, even if the coefficient of determination were found to be weak (r2 = 0.25). This is
because, the weaker the expected correlation coefficient, the larger the calculated
required sample size. The secondary questions for this investigation, such as the effect of
age on the scores for each task, were accounted for with the expectation that an
appropriate sample size for the UFOV vs. Dynavision correlation would allow for enough
confidence for the determination of a relationship between each task and age. The sample
size was calculated to be 29 subjects for each group: normal vision and low vision.
When correlating UFOV vs. Dynavision scores, only the scores on the third and
most difficult UFOV task, Selective Attention, were used. This is possible on the new
UFOV software, whereas the old iteration of the program often cited in the literature [10,
14, 15] gathered data on all 3 tasks and provided the score as a percent reduction in
performance from the minimum threshold performance. Conversion for scores from the
old to new scoring and iteration of the UFOV program is provided by the creators of the
program (The Visual Awareness Group) and is seen in Appendix B. I chose to analyze
Task 3, Selective Attention in isolation because, particularly for the normal subject
group, most subjects reached the ceiling of performance on the easier Tasks 1 and 2,
†For a two-tailed hypothesis and p = 0.05 significance level, the standard normal deviate for α = Zα =
1.960; for a power of 80% (β =0.20, the standard normal deviate for β = Zβ = 0.842; then, C = 0.5 * ln[(1+r)/(1-r)] = 0.549. Sample Size N calculated by: Total sample size = N = [(Zα+Zβ)/C]2 + 3 = 29

30
successfully identifying (in Task 1, Processing Speed) and identifying and locating (in
Task 2, Divided Attention) the stimuli at the fastest computer flash presentation of 14.8
ms. In fact, 100% of normal subjects hit this performance ceiling on Task 1, and 84.3%
(43 of 51) did for Task 2 [see Appendix C for raw data]. In the low vision cohort, 59%
(10 of 17) hit the performance ceiling for Task 1, and 6% (1 of 17) did for Task 2. Thus,
the most significantly differentiating indicator of performance was UFOV Task 3, for
which only 17.6% of normal subjects (9 of 51) and one low vision subject successfully
identified and located the stimuli at a duration of 14.8ms. The range of normal adult
subject processing speeds for Task 3 was 14.8 ms to 211.8 ms, while the range for low
vision subjects was 14.8 ms to 431.5 ms.
In addition to using correlation and linear regression to assess the relationship
between UFOV vs. Dynavision scores across normal subjects [Figure 5] and low vision
subjects [Figure 6], the relationship between age and performance on the UFOV and
Dynavision tasks also was analyzed using correlation and linear regression, to observe
how scores vary with subject age for the normal vision adults and children for UFOV
[Figs. 7-9] and for Dynavision [Figs. 11-13]. The effect of age on UFOV and Dynavision
scores was analyzed for the low vision population as well [Figs. 10, 14]. The role of
gender on scores was analyzed using independent t-tests for the means and standard
deviations of male versus female performance for normal and low vision cohorts [Figs.
15-18].
Also, it was of interest to investigate test-retest reliability of the Dynavision board
task. Because I expected a learning effect for the first few trials [32, 33], I compared the
outcome of repeated Dynavision attempts through a series of paired-sample t-tests,
comparing trial 1 vs. 2 and trial 2 vs. 3 to investigate a statistically significant difference
in scores as subjects advanced sequentially through their 3 attempts. A two-tailed paired
t-test was conducted with a Bonferroni correction for multiple (i.e., 2) tests. The
Bonferroni correction indicated that the critical p value for this analysis would be 0.05/2

31
= 0.025. The mean subject scores for each Dynavision trial and respective standard error
are shown below for the normal vision and low vision groups. Bland-Altman plots for
agreement are provided for those trials that did not display a significant difference [Fig.
19-23].
Additional analyses were performed on the data from the pilot study, which
obtained normative results for children on the UFOV and Dynavision tests. The raw data
for this sub-study are found in Appendix C, and the linear regression for UFOV vs.
Dynavision is discussed in Appendix D. The normative child data were also included in
the analyses that considered age vs. UFOV and age vs. Dynavision scores in Figures 8, 9,
12, and 13 below.

32
RESULTS: The correlation UFOV vs. Dynavision scores:
Fig. 5: UFOV vs. Dynavision correlation and linear regression for normal adult
subjects
As seen above, UFOV and Dynavision scores correlate positively in the normal
subject group, with a correlation coefficient r = 0.626, and coefficient of determination r2
= 0.392 such that approximately 39% of the variability on one task was accounted for by
the score on the other task. The significance level for this correlation was calculated with
a t-test (with N-2 df) = r / SQRT([1-r2]/ [N-2]). With a sample size N = 51 and using a 2-
tailed t test, t[df=49] = 5.62, p = 8.9 x 10⁻⁷. Thus, the correlation between UFOV and
Dynavision scores in normal adult subjects is found to be statistically significant.
However, the value of r2 does not meet my desired level of clinical significance, which
sought r2 = 0.5, or 50% of variability on one task accounted for by the score on the other
task. The 95% confidence interval for the correlation coefficient r = 0.626 gives an upper
limit r = 0.768 and lower limit r = 0.424, so with a two-tailed p-value of 0.155, the

33
correlation coefficient found is not statistically significantly different from the desired r =
0.707 [38].
Fig. 6: UFOV vs. Dynavision correlation and linear regression for low vision
subjects
UFOV and Dynavision scores correlate positively in the low vision patient subject
group with r2 = 0.479; thus, about 48% of variability on one task was accounted for by
the score on the other task. The significance level for this correlation was calculated with
a t-test (with N-2 df) = r / SQRT([1-r2]/ [N-2]). With a sample size N = 17 and using a 2-
tailed t test, t[df=15] = 3.716, p = 2.07 x 10⁻³. Thus, the correlation between UFOV and
Dynavision scores in low vision subjects is found also to be statistically significant. This
correlation is very close to my desired level of clinical significance of 50% of variability
on one task accounted for by score on the other task. The 95% confidence interval for this
correlation coefficient provides upper limit r = 0.813 and lower limit r = 0.515. With a

34
two-tailed p-value of 0.419, the found correlation coefficient 4 = 0.692 was not
statistically significantly different from the target r value 0.707 [38].
When correlating UFOV vs. Dynavision, it is of interest to compare whether the
linear regression and correlation data, including the best-fit lines, are similar between the
normal adult and low vision data for patients of driving age. This comparison addresses
the question of whether the low vision patient data conform to the same relationship as
that of the normal vision adults. Concerns include whether the y-intercepts are different
(i.e., shifted to higher values for UFOV threshold or Dynavision reaction time), and
whether the slopes are quantitatively different (i.e., different rate of change of scores).
When tested with multiple regression and interaction analysis, testing between the
interaction of the outcome variables (scores) and group designation (normal vision vs.
low vision) revealed that the slopes of the two regressions were not statistically
significantly different from each other, with a two-tailed p-value = 0.702. When testing
the intercepts, they were statistically significantly different with p = 0.019, showing that
low vision patients performed more poorly on both UFOV and Dynavision (had different
score intercept values), but the relationship between performance on the two tasks was
quantitatively similar between normal and low vision groups.
As discussed in the modes of analysis section above, only the Task 3 UFOV
threshold scores were analyzed for their correlation to the Dynavision task as well as with
regard to age and gender. While this is somewhat different from many previous studies in
which the scores on all 3 subtests were added or averaged to give the UFOV score,
analyzing Task 3 in isolation allows for better differentiation between subjects because
many subjects, even in the low vision cohort, achieved the threshold ceiling of 14.8 ms
on Task 1, whereas only one subject in the low vision cohort reached the ceiling
threshold on Task 3. Thus, Task 3, being the most difficult, had the largest range of
scores and the data differentiates performance among subjects most appropriately.
Additionally, although only one low vision subject reached the performance threshold on
35
Task 2 as well, the best comparison between low vision and normal vision adults is still
achieved by comparing Task 3 because of the fact that more than half of normal vision
adults reached the 14.8ms on Task 2. Of the 17 low vision subjects, 14 placed in UFOV
Category 1, two placed in Category 2, and one placed in Category 4. Thus, an analysis of
the Category results alone would not provide much ability to analyze threshold trends on
UFOV for this low vision cohort.
The effect of age:
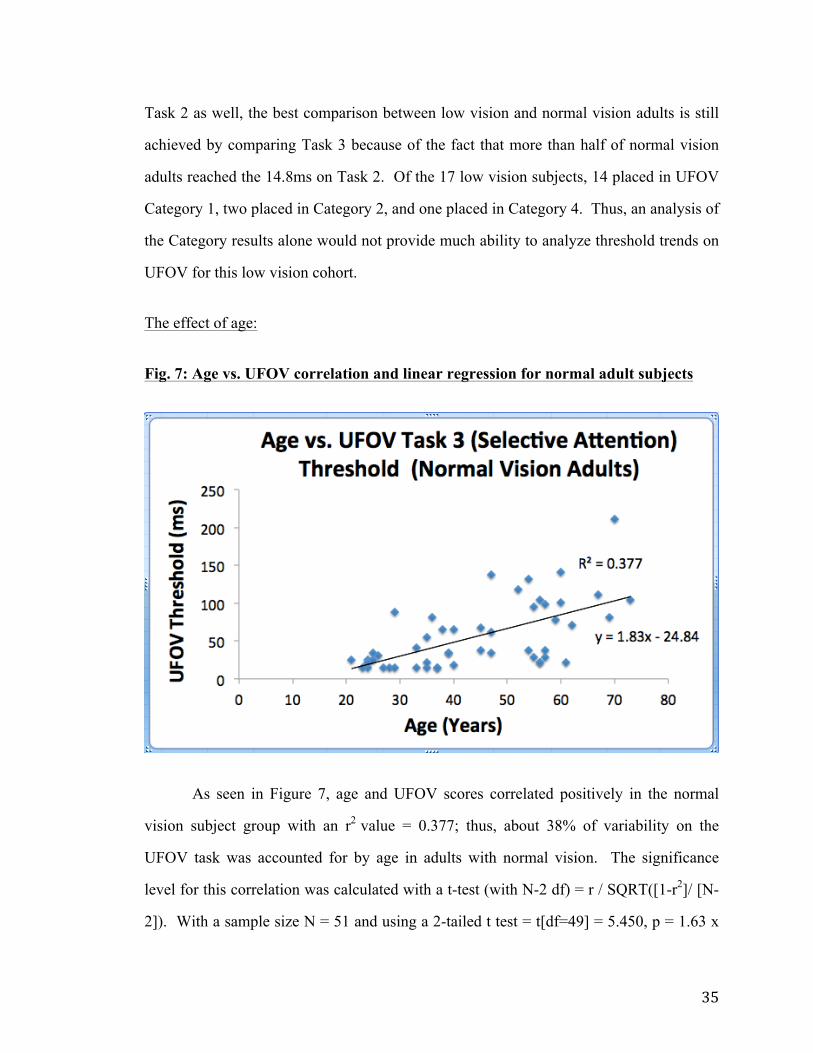
Fig. 7: Age vs. UFOV correlation and linear regression for normal adult subjects
As seen in Figure 7, age and UFOV scores correlated positively in the normal
vision subject group with an r2 value = 0.377; thus, about 38% of variability on the
UFOV task was accounted for by age in adults with normal vision. The significance
level for this correlation was calculated with a t-test (with N-2 df) = r / SQRT([1-r2]/ [N-
2]). With a sample size N = 51 and using a 2-tailed t test = t[df=49] = 5.450, p = 1.63 x

36
10-6. Thus, the correlation between age and UFOV in normal-vision adult subjects is
found to be statistically significant; with increasing age, performance on UFOV Task 3
declines, as evidenced by longer threshold durations.
Fig. 8: Age vs. UFOV correlation and linear regression for normal vision children
On the other hand, age and UFOV scores did not show a significant correlation in
the normal vision children, with an r2 value = 0.0176 (Figure 8). Thus, only about 2% of
the variability on the UFOV task was accounted for by age in children with normal
vision. The significance level for this correlation was calculated with a t-test (with N-2
df) = r / SQRT([1-r2]/ [N-2]). With a sample size N = 8 and using a 2-tailed t test, t[df=6]
= 0.328, p = 0.754. Thus, the correlation between age and UFOV in normal-vision child
subjects is not found to be statistically significant.

37
Fig. 9: Age vs. UFOV, correlation for normal vision adults and children
A combined plot of UFOV performance over the full range of ages in normal-
vision subjects is presented in Figure 9. As reported above, the data for children with
normal vision did not exhibit a significant correlation between age and UFOV threshold.
The data suggest that performance on the UFOV test becomes adult-like at approximately
age 21, the youngest in the adult sample, although there was not a strong enough
relationship in the children’s data to identify the intersection between the lines fit to the
children’s and adults’ performance with any confidence.

38
Fig. 10: Age vs. UFOV correlation and linear regression for low vision subjects
Figure 10 shows that age and UFOV scores correlated positively in the low vision
subject group with r2 = 0.407; thus, about 41% of variability on the UFOV task was
accounted for by age in the adults with low vision. The significance level for this
correlation was calculated with a t-test (with N-2 df) = r / SQRT([1-r2]/ [N-2]). With a
sample size N = 17 and using a 2-tailed t test = t[df=15] = 3.209, p = 5.85 x 10⁻³. Thus,
the correlation between age and UFOV in low vision adult subjects is found to be
statistically significant.
When analyzing the effect of age on UFOV scores, I was interested in comparing
whether the best-fit regression lines are similar for the normal adult and low vision adult
data. This addresses the question of whether the low vision patient data conform to the
same relationship as that of the normal vision adults. Concerns include whether the y-
intercept is different (i.e., shifted to higher UFOV thresholds in the low vision patients),
and whether the change in UFOV scores with age is quantitatively different (i.e., different
rates of change of scores with increasing subject age). When tested with multiple
regression and interaction analysis, testing the interaction of age and group designation

39
(normal vision vs. low vision) in relation to the outcome measure for UFOV revealed that
the slopes of the two regressions (age vs. UFOV for normal-vision and age vs. UFOV for
low vision cohorts) were statistically significantly different from each other, with a two-
tailed p-value = 0.004. When testing the intercepts, they were not statistically
significantly different with p = 0.681, showing that in relation to age, performance
deteriorates more with increasing age in low vision than in the normal vision subjects.
Intercept may not be relevant here because it corresponds to an age of 0 years, which is
not clinically relevant, and is extrapolated heavily from this adult data set. However,
solving the linear regression equations to calculate a predicted UFOV score for a patient
of adult age [age 18] provides a predicted threshold of 8.1ms for a normal vision subject,
and 81ms for a low vision subject. Again, interaction analyses did not find these
intercepts to be statistically significantly different.
Fig. 11: Age vs. Dynavision correlation and linear regression for normal vision adult
subjects.

40
Age and Dynavision scores correlate positively in the normal vision subject group
with an r2 value = 0.413; thus, about 41% of variability on the Dynavision task was
accounted for by age in adults with normal vision. The significance level for this
correlation was calculated with a t-test (with N-2 df) = r / SQRT([1-r2]/ [N-2]). With a
sample size N = 51 and using a 2-tailed t test = t[df=49] = 5.867, p = 3.74 x 10⁻⁷. Thus,
the correlation between age and Dynavision in normal-vision adult subjects is found to be
statistically significant; with increasing age, performance on Dynavision declines, as
evidenced by longer reaction times.
Fig. 12: Age vs. Dynavision correlation and linear regression for normal vision
children
On the other hand, age and Dynavision scores correlate negatively in the normal
vision child subject group with r2 coefficient = -0.768 (Figure 12). Thus, about 77% of
variability on the Dynavision task was accounted for by age in children with normal
vision. The significance level for this correlation was calculated with a t-test (with N-2
df) = r / SQRT([1-r2]/ [N-2]). With a sample size N = 8 and using a 2-tailed t test =

41
t[df=6] = 4.457, p = 4.3 x 10⁻³. Thus, the correlation between age and Dynavision in
normal vision child subjects was found to be statistically significant. The data show that,
through childhood, increasing age correlates with improved performance (faster reaction
times) on the Dynavision apparatus.
Fig. 13: Age vs. Dynavision average reaction time for all ages
Figure 13 presents a combined plot of Dynavision performance over the full range
of ages in normal-vision subjects. As seen above, the data for normal vision children
indicate a significant negative relationship between age and Dynavision reaction times,
whereas a positive correlation between age and Dynavision reaction times exists for the
normal adult population. Solving for the intersection of the linear regression lines fit to
the child and adult data (-0.12x + 2.88 = 0.012x + 0.503) suggests that the age at which
performance on the Dynavision task becomes adult-like, is approximately age 18.

42
Fig. 14: Age vs. Dynavision linear regression and correlation for low vision adults
As in the adults with normal vision, age and Dynavision scores correlate
positively in the low vision subject group with an r2 value = 0.236 (Figure 14). Thus,
about 24% of variability on the Dynavision task was accounted for by age in adults with
low vision. The significance level for this correlation was calculated with a t-test (with
N-2 df) = r / SQRT([1-r2]/ [N-2]). With a sample size N = 17 and using a 2-tailed t test =
t[df=15] = 2.153, p = 0.048. Thus, the correlation between age and Dynavision in low
vision adult subjects is found to be statistically significant.
When analyzing the effect of age on Dynavision scores, I was again interested in
comparing whether the linear regression fits are similar between the normal adult and low
vision subjects of driving age, to determine whether the low vision patient data conform
to the same relationship as that of the normal vision adults. Concerns include whether the
y-intercept is different (i.e., shifted to longer Dynavision reaction times in the low vision
patients), and whether the slopes are qualitatively different (i.e., whether reaction time
changes at different rates with increasing subject age). When tested with multiple
regression and interaction analysis, testing the interaction of age and group designation

43
(normal vision vs. low vision) in relation to the outcome measure for Dynavision
revealed that the slopes of the two regressions (age vs. Dynavision for normal-vision and
age vs. Dynavision for low vision cohorts) were statistically significantly different from
each other, with a two-tailed p-value = 0.015. When testing the intercepts, they were not
statistically significantly different with p = 0.709, showing that in relation to age,
performance deteriorates more with increasing age in low vision than in the normal
vision subjects. Intercept may not be relevant here because it corresponds to an age of 0
years, which is not clinically relevant, and is extrapolated heavily from this adult data set.
As seen above in Figures 11 and 14 and based on the best-fit values of slope and
intercept, it appears that only the slope of the regression line (but not the y-intercept for
Dynavision reaction times), differs quantitatively between the low vision patients (0.04
s/year) and the normal vision cohort (0.012 s/year). Thus, while Dynavision reaction
times are approximately the same in young adult low vision patients and normal adults,
the low vision patients’ performance deteriorates more rapidly with increasing age as
compared to normal vision subjects. This outcome differs from the effect of subject
group on both the slope and intercept of the lines fit to the UFOV data.
Fig. 15: Performance by gender on UFOV: Normal vision adults
44
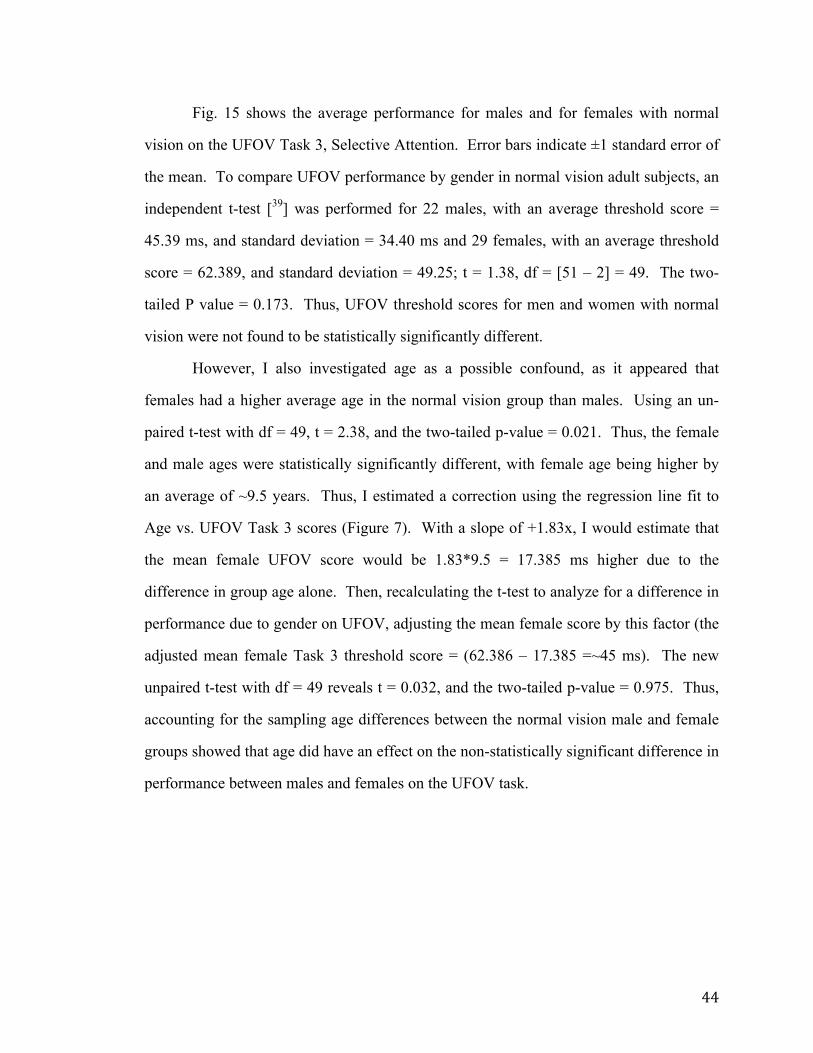
Fig. 15 shows the average performance for males and for females with normal
vision on the UFOV Task 3, Selective Attention. Error bars indicate ±1 standard error of
the mean. To compare UFOV performance by gender in normal vision adult subjects, an
independent t-test [39] was performed for 22 males, with an average threshold score =
45.39 ms, and standard deviation = 34.40 ms and 29 females, with an average threshold
score = 62.389, and standard deviation = 49.25; t = 1.38, df = [51 – 2] = 49. The two-
tailed P value = 0.173. Thus, UFOV threshold scores for men and women with normal
vision were not found to be statistically significantly different.
However, I also investigated age as a possible confound, as it appeared that
females had a higher average age in the normal vision group than males. Using an un-
paired t-test with df = 49, t = 2.38, and the two-tailed p-value = 0.021. Thus, the female
and male ages were statistically significantly different, with female age being higher by
an average of ~9.5 years. Thus, I estimated a correction using the regression line fit to
Age vs. UFOV Task 3 scores (Figure 7). With a slope of +1.83x, I would estimate that
the mean female UFOV score would be 1.83*9.5 = 17.385 ms higher due to the
difference in group age alone. Then, recalculating the t-test to analyze for a difference in
performance due to gender on UFOV, adjusting the mean female score by this factor (the
adjusted mean female Task 3 threshold score = (62.386 – 17.385 =~45 ms). The new
unpaired t-test with df = 49 reveals t = 0.032, and the two-tailed p-value = 0.975. Thus,
accounting for the sampling age differences between the normal vision male and female
groups showed that age did have an effect on the non-statistically significant difference in
performance between males and females on the UFOV task.
45
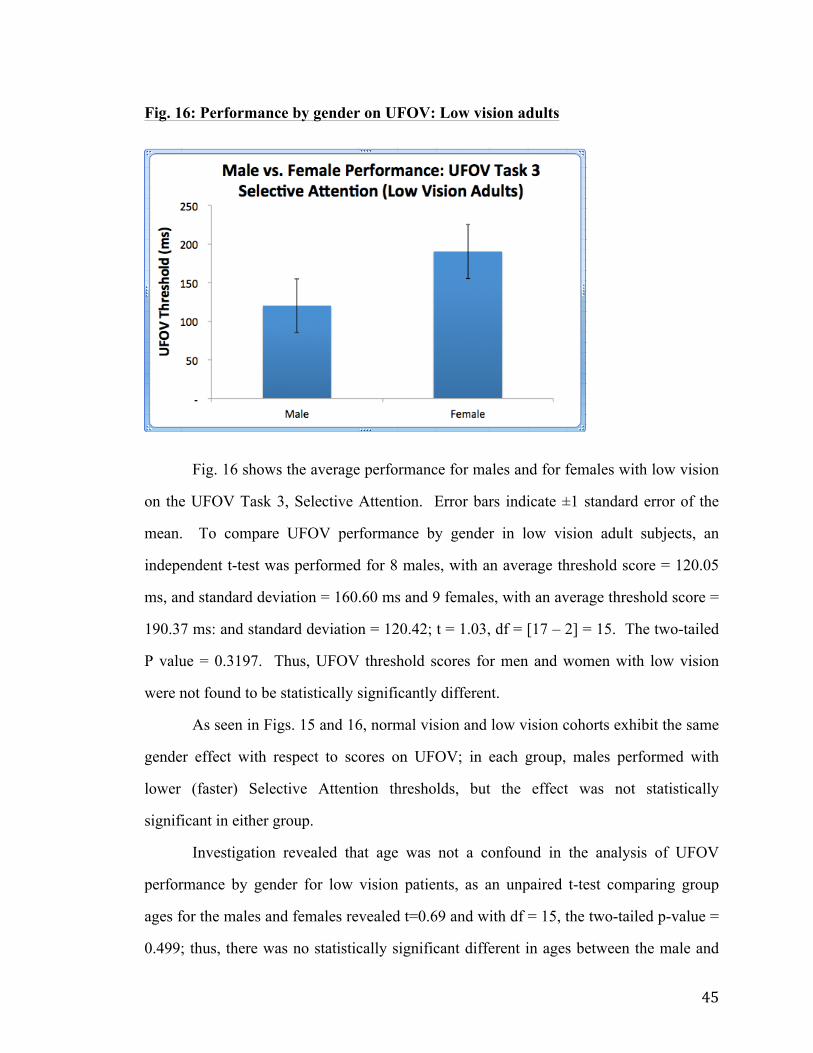
Fig. 16: Performance by gender on UFOV: Low vision adults
Fig. 16 shows the average performance for males and for females with low vision
on the UFOV Task 3, Selective Attention. Error bars indicate ±1 standard error of the
mean. To compare UFOV performance by gender in low vision adult subjects, an
independent t-test was performed for 8 males, with an average threshold score = 120.05
ms, and standard deviation = 160.60 ms and 9 females, with an average threshold score =
190.37 ms: and standard deviation = 120.42; t = 1.03, df = [17 – 2] = 15. The two-tailed
P value = 0.3197. Thus, UFOV threshold scores for men and women with low vision
were not found to be statistically significantly different.
As seen in Figs. 15 and 16, normal vision and low vision cohorts exhibit the same
gender effect with respect to scores on UFOV; in each group, males performed with
lower (faster) Selective Attention thresholds, but the effect was not statistically
significant in either group.
Investigation revealed that age was not a confound in the analysis of UFOV
performance by gender for low vision patients, as an unpaired t-test comparing group
ages for the males and females revealed t=0.69 and with df = 15, the two-tailed p-value =
0.499; thus, there was no statistically significant different in ages between the male and

46
female low vision groups. Therefore, age difference did not affect the relationship
between gender and performance for low vision patients.
Fig. 17: Performance by gender on Dynavision: Normal vision adults
Fig. 17 shows the average performance for males and for females with normal
vision on the Dynavision Mode A task. Error bars indicate ±1 standard error of the mean.
To compare UFOV performance by gender in normal vision adult subjects, an
independent unpaired t-test was performed for 22 males, with an average reaction time
score = 0.857 s, and standard deviation = 0.124; and 29 females, with an average reaction
time score = 1.127 s, and standard deviation = 0.288; t = 4.12, df = [51 – 2] = 49. The
two-tailed P value = 1.0 x 10 -4. Thus, Dynavision reaction times for men and women
were found to be statistically significantly different, with males performing with shorter
reaction times than females.
As with the analysis for the effect of gender on UFOV performance, I investigated
age as a possible confound when analyzing Dynavision performance by gender in normal
vision subjects, as females had a higher average age in the normal vision group than
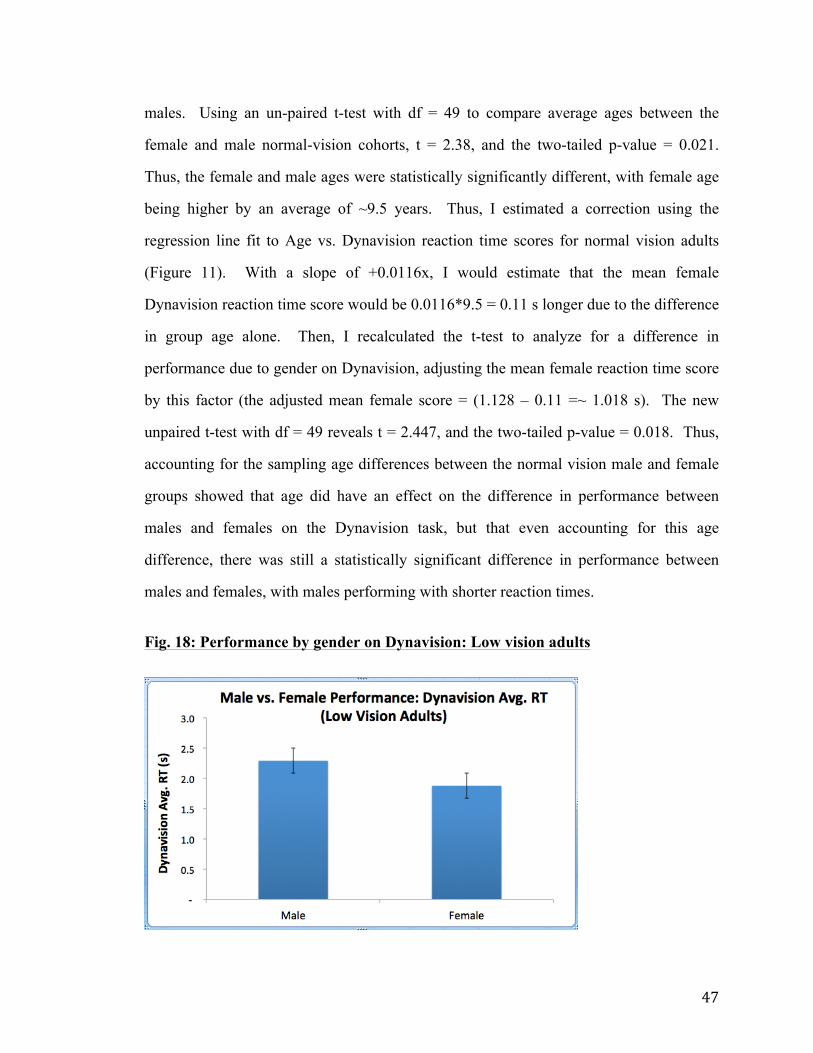
47
males. Using an un-paired t-test with df = 49 to compare average ages between the
female and male normal-vision cohorts, t = 2.38, and the two-tailed p-value = 0.021.
Thus, the female and male ages were statistically significantly different, with female age
being higher by an average of ~9.5 years. Thus, I estimated a correction using the
regression line fit to Age vs. Dynavision reaction time scores for normal vision adults
(Figure 11). With a slope of +0.0116x, I would estimate that the mean female
Dynavision reaction time score would be 0.0116*9.5 = 0.11 s longer due to the difference
in group age alone. Then, I recalculated the t-test to analyze for a difference in
performance due to gender on Dynavision, adjusting the mean female reaction time score
by this factor (the adjusted mean female score = (1.128 – 0.11 =~ 1.018 s). The new
unpaired t-test with df = 49 reveals t = 2.447, and the two-tailed p-value = 0.018. Thus,
accounting for the sampling age differences between the normal vision male and female
groups showed that age did have an effect on the difference in performance between
males and females on the Dynavision task, but that even accounting for this age
difference, there was still a statistically significant difference in performance between
males and females, with males performing with shorter reaction times.
Fig. 18: Performance by gender on Dynavision: Low vision adults

48
Fig. 18 shows the average performance for males and for females with low vision
on the Dynavision board Mode A task. Error bars indicate ±1 standard error of the mean.
When comparing Dynavision performance by gender in low vision adult subjects, an
independent t-test was performed for 8 males, with an average reaction time = 2.29 s, and
standard deviation = 1.91 and 9 females, with an average reaction time = 1.88 s, and
standard deviation = 0.98; t = 0.566, df = [17 – 2] = 15. The two-tailed P value = 0.579.
Thus, Dynavision reaction times for men and women with low vision were not found to
be statistically significantly different. As with low vision performance by gender on
UFOV, investigation revealed that age was not a confound in the analysis of Dynavision
performance by gender for low vision patients, as an unpaired t-test comparing ages in
the male and female groups revealed t=0.69 and with df = 15, the two-tailed p-value =
0.499; thus, there was no statistically significant different in ages between the male and
female low vision groups.
As seen in Figs. 17 and 18, normal vision and low vision cohorts did not exhibit
the same gender effect on Dynavision performance. Whereas the males perform
statistically significantly better in the normal vision cohort (lower reaction times and
faster performance), even when the effect of age is accounted for, the females perform
statistically insignificantly better in the low vision cohort.

49
Fig. 19: Mean reaction times across the 3 Dynavision trials for normal vision adults:
Figure 19 shows the mean reaction times for normal vision subjects on 3 attempts
at the Dynavision task. Error bars show ±1 standard error of the mean. The individual
trials for each subject were compared via paired t-tests [39], (Trial 1 vs. Trial 2 and Trial 2
vs. Trial 3), and a Bonferroni correction was applied for the 2 comparisons, such that an
alpha level of p ≤ 0.025 was applied. For the analysis of Trial 1 vs. Trial 2, t = 3.567, df
= [51 – 1] = 50. The two-tailed P value = 8.0 x 10 -4. Thus, performance on Trial 2 was
statistically significantly faster than on Trial 1. When comparing Trial 2 vs. Trial 3, t =
0.0147, df = [51 – 1] = 50. The two-tailed P value = 0.988, which is not statistically
significant.
Because Trial 2 and Trial 3 were not found to be statistically significantly
different, agreement between the Dynavision results on these two trials is represented
below on a Bland-Altman plot [40].

50
Figure 20: A Bland-Altman plot of Agreement on Dynavision Trials 2 vs. 3 in
Normal Vision Subjects
As seen in Figure 20, a Bland-Altman plot illustrates agreement between
Dynavision trials 2 and 3 in normal vision subjects, for which there was no statistically
significant difference in scores across subjects (Figure 19). In normal vision adult
subjects, Dynavision trial 2 and 3 upper and lower limits of agreement for the 95%
confidence interval were specified by Limit = Bias ± 1.96 * Standard Deviation, where
the bias is the mean of the differences between trial 2 and 3 scores for each subject, and
the standard deviation is calculated for the mean scores for trials 2 and 3. In this case,
the 95% confidence interval limits of agreement for Dynavision trials 2 and 3 were ±
0.186 seconds.

51
Fig. 21: Mean reaction times across the 3 Dynavision trials for low vision adults:
Figure 21 shows the mean reaction times for low vision subjects on 3 attempts at
the Dynavision task. Error bars show ±1 standard error of the mean. The individual
trials for each subject were compared via paired t-tests [39] (Trial 1 vs. Trial 2 and Trial 2
vs. Trial 3), and a Bonferroni correction was applied for the 2 comparisons, such that an
alpha level of p ≤ 0.025 was applied. For the analysis of Trial 1 vs. Trial 2, t = 1.07, df =
[17 – 1] = 16. The two-tailed P value = 0.299. Thus, performance on Trials 1 and 2 was
not statistically significantly different. When comparing Trial 2 vs. Trial 3, t = 1.05, df =
[17 – 1] = 16. The two-tailed P value = 0.307; thus, performance on Trials 2 and 3 also is
not found to be statistically significantly different.

52
Fig. 22: Bland- Altman plot for Dynavision Trial 1 vs. Trial 2 for Low Vision
Subjects
Here, a Bland-Altman plot [40] illustrates agreement between Dynavision trials 1
and 2 in low vision subjects, for which there was no statistically significant difference in
scores across subjects (Figure 21). In low vision subjects, Dynavision trial 1 and 2 upper
and lower limits of agreement with a 95% confidence interval were specified by Limit =
Bias ± 1.96 * Standard Deviation, where the bias is the mean of the differences between
trial 1 and 2 scores for each subject, and the standard deviation is calculated for the mean
scores for trials 1 and 2. Here, the 95% confidence limits of agreement were +3 and -2
seconds.

53
Fig. 23: Bland- Altman plot for Dynavision Trial 2 vs. Trial 3 for Low Vision
Subjects
In Figure 23, a Bland-Altman plot shows the agreement between Dynavision trials
2 and 3 in low vision subjects, for which there was no statistically significant difference
in scores across subjects (Figure 21). Dynavision trial 2 and 3 upper and lower limits of
agreement were specified as was done for trials 1 and 2 in Figure 22; in this case, the
upper and lower limits of agreement for the 95% confidence interval were +3 and -4
seconds, respectively.

54
DISCUSSION: This study sought to investigate the correlation between the Useful Field of View
(UFOV) and Dynavision 2000 tasks. If there were a clinically significant correlation
between the two tasks, the tasks could be interchangeable when clinically assessing the
visual driving fitness of low vision patients. It was decided that a clinically significant
correlation between the tasks would have at minimum a correlation coefficient r = 0.707,
such that r2 = 0.5 and 50% of the variability on one task would be accounted for by the
score on the other task. This investigation revealed that the correlation between UFOV
and Dynavision did not meet our desired level of clinical significance for either normal
vision or low vision patients.
In normal vision adult subjects, the correlation between the two tasks was
significantly different from zero, but as only about 39% of the variability on one task was
accounted for by the scores on the other, this does not support the clinical
interchangeability of the two tasks. Similarly, in the low vision cohort, there was a
statistically significant correlation, but with only approximately 48% of the variance on
one task accounted for by the scores on the other, I cannot confirm that the tasks could be
clinically interchangeable in the low vision cohort. However, the obtained value of r2 in
the low vision cohort is very close to the desired level of clinical significance. As more
low vision patients participate on both UFOV and Dynavision tasks in the CSE clinic as
part of their examination and as the sample size increases, a clinically significant
relationship may be achieved. The data are sufficient to support my hypothesis that
UFOV and Dynavision correlate in both normal and low vision subjects, but the notion of
interchangeability is not supported.
The sample size for this study was calculated based on the presumed or
anticipated correlation coefficient of r = 0.5, which gave a required sample size of 29
subjects for each group (normal vision and low vision). The data in fact show a
correlation coefficient stronger than r = 0.5 in each of the cohorts (normal vision and low

55
vision). Post-hoc, with the correlation coefficient for normal adult subjects found to be r
= 0.626, again using the formula by Hulley, Cummings et al [37], a sample size of 18
subjects would actually be required to show that a correlation for that r value is
statistically different from zero; this was more than met with the 51 normal vision
subjects enrolled in this study. For low vision subjects and an obtained r = 0.692, post-
hoc calculation provides that a sample size of 14 would be sufficient to support a
statistically significant correlation for this r value, which was met with our low vision
adult study sample size of 17 patients. However, as already noted above, although the
observed correlations in both groups are statistically significant, they did not support an
interchangeability between UFOV and Dynavision. Additionally, the low vision sample
size was sufficiently small that different characteristics of low vision subjects, such as
etiology of vision loss, could not be analyzed separately with large enough representative
subgroups. Thus, I cannot make distinctions for different types of low vision (i.e., central
vs. peripheral vision loss) or individual etiologies when comparing UFOV to Dynavision
scores, nor can I relate particular ocular diseases or low vision etiologies to scoring trends
on either task separately. Further data collection to increase the sample size would be
necessary to analyze the relationship between UFOV and Dynavision scores in subgroups
of low vision patients.
Subject traits such as age and sex were also analyzed for their effect on
performance. Previous literature indicated that UFOV scores should improve in young
children until about age 14, when adult levels would be reached [23]. In the pilot data I
gathered, I did not see a significant correlation, or even any trend, for a relationship
between age and UFOV score in subjects under 18 years of age. I propose that my
sample size of only 8 children was simply not sufficient to support the hypothesized age
effect, because the UFOV data were highly variable in the child subjects. For the adult
subjects, performance showed a significant linear trend toward poorer scores (longer
threshold time) with increasing age, beginning with better scores for the youngest adult

56
subjects enrolled in the study. This outcome does not necessarily support the previous
literature that suggested that UFOV performance begins to deteriorate after age 40 [24, 25].
The relationship I found instead is consistent with a gradual and continuous decline,
beginning earlier in adulthood. This trend was also present and amplified for low vision
subjects of driving age, whose UFOV performance showed an even stronger correlation
and steeper rate of change (deterioration) of performance (longer threshold times) with
increasing age. Thus, it appears that the normal-vision and low vision cohorts exhibited
similar relationships between age and UFOV, and that UFOV performance deteriorates
with age beginning in early adulthood.
On the Dynavision test, the normal-vision child subjects in the pilot study showed
a strong significant negative correlation between age and reaction time, indicating that
the youngest subjects perform more poorly on the task, and that performance improves in
children from age 8 to 17. Combining this linear regression line with that fit to the data
for normal adult subjects on Dynavision suggests that best performance (shortest reaction
time) occurs around age 18, after which the reaction time increases approximately
linearly (scores deteriorate) with increasing age. This relationship between age and
Dynavision performance found in normal adults was seen to be amplified in the low
vision adults, as Dynavision scores worsened with increasing age at a statistically
significantly faster rate than in subjects with normal vision. Thus, it can be stated that the
low vision patients exhibited exaggerated age effects as compared to the normative
cohort on both UFOV and Dynavision.
When gender was considered for its effect on UFOV and Dynavision scores, it
was found that men trend toward better scores on UFOV in both normal vision and low
vision driving-age adults, but neither of these trends are statistically significant. This
absence of a significant gender effect agreed with the expectation from previous literature
[22]. When investigating age as a potential confound in the analysis of scores by gender,
it was found that the female normal-vision cohort was statistically significantly older than

57
the normal-vision male group by an average of 9.5 years; this accounted for some of this
(statistically-insignificant) difference in gender performance. There was no age-gender
confound in the low vision group, as the mean ages of the male and female low vision
subjects did not statistically significantly differ. However, I had hypothesized, based on
previous studies [33, 34], that there would be a statistically significant difference between
male and female performance on Dynavision performance in adult subjects. This was
found to occur only for normal-vision subjects, and the effect was present and statistically
significant even when adjusting for the fact that the normal-vision females in this study
were older on average. However, female low vision subjects were found to have better
scores than males on the Dynavision task, although there is no statistically significant
difference. Hence, the low vision cohort does not exhibit the same relationship between
gender and performance on the Dynavision task that is observed in the normal-vision
adults’ data. A larger sample size for the low vision cohort might reveal more about the
relationship between Dynavision performance and gender.
During administration of the UFOV and Dynavision tasks to the subjects, I
became aware of other factors, which were not included in my analyses, which could
possibly affect subjects’ performance on the tasks. For instance, subject arm length (or
“wingspan”) is a trait that appeared to grant an advantage to taller and longer-armed
subjects when performing the Dynavision task. This is because these subjects’ arms,
when extended, could more easily and quickly reach outer buttons on the Dynavision
board that would require a longer transit time from a short-armed subject. Additionally,
longer-armed subjects were able to stand at a slightly further working distance than
shorter subjects and still be within arm’s reach of the board, allowing for a decreased
need for scanning the board for each illuminated button, as more of the board would fall
within the central visual field from a further distance. Subject height and arm length may
have, at least in part, contributed to the inverse correlation between age and Dynavision
scores for children ages 8 to 17, as the youngest children were much smaller, and this

58
could have factored into the child taking longer to reach the outer buttons. This same
effect could also have contributed to the finding that males performed with shorter
reaction times than females in the normal-vision adult group; as on average males are
taller than females, height as a characteristic could be a confound in the analysis of the
relationship between gender and reaction time on the Dynavision task. Another factor
that was not analyzed but may contribute to task performance is subject personality with
regard to competitive nature and motivation, particularly for the Dynavision task. While
some subjects appeared highly motivated to beat their previous score on each new trial,
or to perform their absolute best, others struck the buttons with less sense of urgency. By
my observation, there were subjects across age and gender who displayed the full
spectrum of motivation, from competitive to nonchalant. However, the most competitive
and highly motivated subjects appeared to be toward the younger end of the cohort, both
in the normal and low vision groups. Thus, level of motivation could possibly have
contributed in part to the age effect seen on the Dynavision task.
Conversely, fewer confounding or interfering subject characteristics seemed
relevant with regard to the UFOV task. Aside from the subject’s ability to direct
attention appropriately to the computer task (which is, in fact, a relevant part of the
UFOV assessment rather than a confounding factor), there did not appear to be any
factors related to a subject’s physical or personality traits that would affect UFOV scores.
For these reasons, I note that UFOV scores appear more representative and specific to the
intended assessment, and less likely to be affected by incidental subject characteristics
that may influence performance on the Dynavision task.
For each of the tasks, it should be noted that the different etiologies of low vision
could have contributed to differences and variability in performance on the tasks in the
low vision subject cohort. As all subjects with uncorrectable vision loss (“low vision”)
were included in the study regardless of whether the vision loss included decreased
acuity, loss of central or peripheral field, or some combination of the above, it is possible

59
that differences in capabilities for a given patient could lead to differences and variability
of performance on one task or the other, or both. This notion highlights that further
research would be necessary to analyze performance on these tasks for persons with
specific etiologies of low vision, to better estimate their driving potential on the basis of
these clinical scores.
Test-retest reliability was also of interest for the 3 Dynavision trials in this
investigation. I hypothesized based on previous literature that the Dynavision task would
display a learning effect for the first two trials, after which I expected performance to
level off [33]. My data support this hypothesis in the normal vision cohort, in which there
was a statistically significant improvement of performance between attempts 1 and 2 of
the Dynavision task, but not between attempts 2 and 3. However, low vision subjects did
not show any statistically significant difference between any of the 3 trials and, in fact, as
a group the cohort performed slightly worse on trial 2 than on trial 1 or 3. This outcome
might imply that the learning effect on this task is less pronounced in the low vision
group, compared to that of the normal vision cohort. However, it could instead be an
indication of the increased variability in the scores for low vision subjects. When
analyzing agreement between scores for trials 1, 2, and 3 of the Dynavision task, the
limits of agreement for the 95% confidence interval were considerably larger for the low
vision population (ranging from +3 to -2 and -4 seconds), than for the normal vision
population (approx. +0.2 seconds). The lack of a clear learning effect or significant
difference in scores between trials on the Dynavision task for low vision patients may
appear to preclude the need for averaging multiple trials. However, given the large size
of the limits of agreement for reaction time on multiple Dynavision trials for low vision
subjects, averaging results on 3 trials may still provide a more representative estimate of
performance compared to the results of a single trial because of the increased variability
in scores. Additionally, it was not recorded in the clinical records whether or not each
subject had attempted Dynavision during a previous low vision exam. Some low vision

60
subjects in this study were new to the Dynavision task and others were not; thus,
investigation into this variable may further explicate the learning effect for low vision
patients on the Dynavision Mode A task.
The trends seen above can be employed when considering low vision patients’
performance on the UFOV and Dynavision tasks as part of a pre-driving assessment
exam; i.e., these trends may help tailor the analysis of each individual patient’s case in
the context of their cohort. For instance, elderly patients may not be held to the same
expectations as young adults for the UFOV or Dynavision tasks, given the tasks’
significant correlations with age. That being said, all but two of the subjects in the
normal vision cohort landed within the UFOV Category 1: Very Low Risk. Thus, while
UFOV scores deteriorate approximately linearly with increasing age for patients with
normal vision within the sampled age range (age 21-73), subjects even toward the top of
this age range can be expected to score in Category 1. Additionally, the UFOV scores of
14 of 17 low vision subjects also fell within Category 1, so a level of functional
impairment corresponding to Categories 2 and above should be carefully analyzed as
potentially significant. Similarly for Dynavision testing, elderly patients and children
should not be expected to reach similar reaction time values as young adults of driving
age. Score adjustment or extra consideration is not necessary for assessing the effect of
gender on performance on UFOV and Dynavision, as low vision subjects did not show a
significant gender difference on either task. Characteristics such as subject height may
need to be taken into consideration when interpreting Dynavision scores.
Conclusions:
In summation, performance on the UFOV and Dynavision tasks correlate in both
normal and low vision adult subjects, but the observed correlation is not strong enough to
warrant interchangeability of the two tasks when assessing low vision patients for driving
fitness. It is possible that the skills tested individually in UFOV (visual processing speed
and attentional capacity) and Dynavision (visuomotor reaction time and scanning) are not
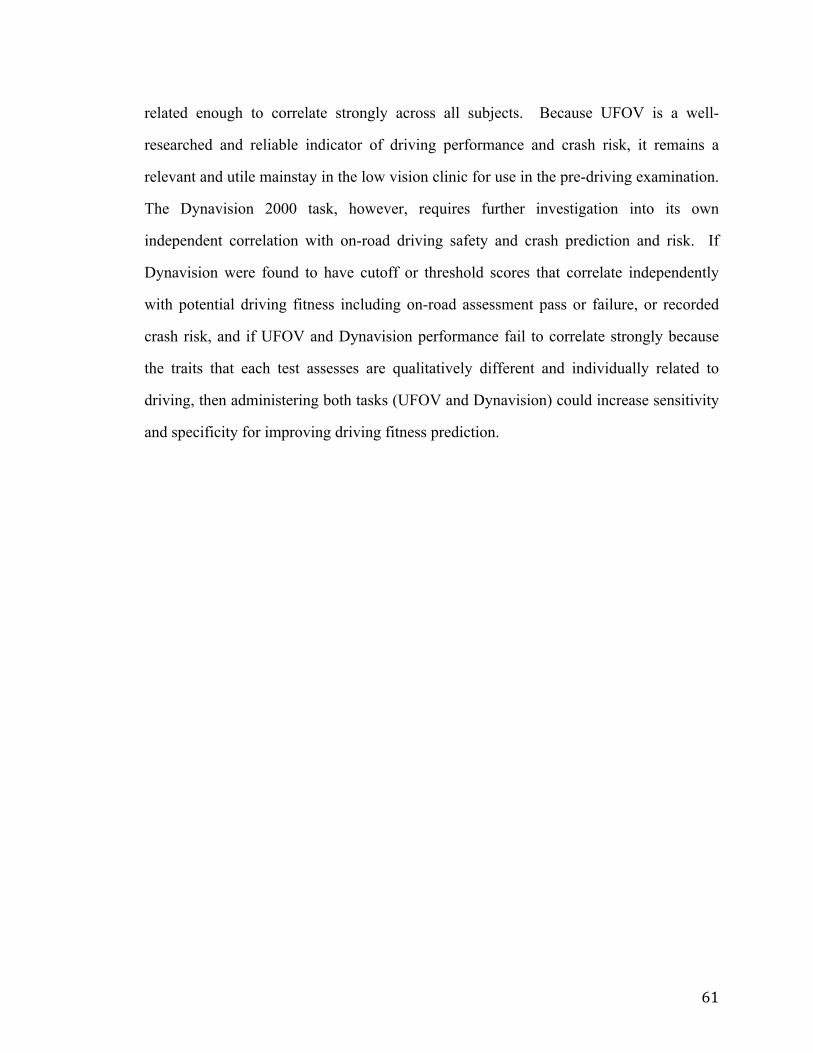
61
related enough to correlate strongly across all subjects. Because UFOV is a well-
researched and reliable indicator of driving performance and crash risk, it remains a
relevant and utile mainstay in the low vision clinic for use in the pre-driving examination.
The Dynavision 2000 task, however, requires further investigation into its own
independent correlation with on-road driving safety and crash prediction and risk. If
Dynavision were found to have cutoff or threshold scores that correlate independently
with potential driving fitness including on-road assessment pass or failure, or recorded
crash risk, and if UFOV and Dynavision performance fail to correlate strongly because
the traits that each test assesses are qualitatively different and individually related to
driving, then administering both tasks (UFOV and Dynavision) could increase sensitivity
and specificity for improving driving fitness prediction.

62
Appendices:
Appendix A:
Characteristics of low vision patients recruited as subjects for this study.
Age sex etiologyofLV16 M Lefthomonymoushemianopsia16 M ONHhypoplasia/Septo-opticdysplasia17 M Cone-roddystrophy18 M OculocutaneousAlbinism18 M OculocutaneousAlbinism19 F ROP;Cornealscarring29 F BilateralRDrepaired;CME30 F StargardtDisease30 M CongenitalNystagmus32 F OculocutaneousAlbinism32 F ONHswellingandCME(ODonly;novisionOS)34 F StargardtDisease42 F ParsPlanitis43 M Congenitalmaculardegeneration53 F Sturge-Weber;end-stageglaucoma55 F ProliferativeDiabeticRetinopathyOU83 M Age-relatedMacularDegeneration
Appendix B: Category cutoff scoring for the Useful Field of View task:
ScoresforSubtests1-3 CategoryLevel RiskStatementSubtest1>0but<=30,andSubtest2>0but<100,andSubtest3>0but<350
1 VeryLow
Subtest1>0but<=30,andSubtest2>0but<100,andSubtest3>=350but<=500
2 Low
Subtest1>0but<=30,andSubtest2>=100but<350,andSubtest3>0but<350
2 Low

63
Subtest1>0but<=30,andSubtest2>=100but<350,andSubtest3>=350but<=500
3 LowtoModerate
Subtest1>0but<=30,andSubtest2>=350but<=500,andSubtest3>=350but<=500
4 ModeratetoHigh
Subtest1>30but<=60,andSubtest2>0but<100,andSubtest3>0but<350
2 Low
Subtest1>30but<=60,andSubtest2>0but<100,andSubtest3>=350but<=500
3 LowtoModerate
Subtest1>30but<=60,andSubtest2>=100but<350,andSubtest3>0but<350
3 LowtoModerate
Subtest1>30but<=60,andSubtest2>=100but<350,andSubtest3>=350but<=500
4 ModeratetoHigh
Subtest1>30but<=60,andSubtest2>=350but<=500,andSubtest3>=350but<=500
5 High
Subtest1>60but<350,andSubtest2>=100but<350,andSubtest3>0but<350
3 LowtoModerate
Subtest1>60but<350,andSubtest2>=100but<350,andSubtest3>=350but<=500
4 ModeratetoHigh
Subtest1>60but<350,andSubtest2>=350but<=500,andSubtest3>=350but<=500
5 High
Subtest1>=350but<=500,andSubtest2>=350but<=500,andSubtest3>=350but<=500
5 VeryHigh

64
Comparison of new UFOV program scores, and the scoring (by percent decrease) previously cited in the literature:
Original UFOV (% Reduction) New PC UFOV (Speed in msec)
< 22.5 < 100 Task 2 and < 350 Task 3
23.0 - 39.5 Task 2 >= 100 or, Task 3 >= 350
40 - 60 >= 100 Task 2 and >= 350 Task 3
> 60 >500 Task 2 and >500 Task 3

65
Appendix C: Raw data for all subject groups Normal Vision Adults:
Age SexDyna1Hits
Dyna1RT
Dyna2Hits
Dyna2RT
Dyna3Hits
Dyna3RT
AvgDynaRT UFOV1 UFOV2 UFOV3 Category
24 F 70 0.86 71 0.82 65 0.92 0.87 14.80 14.80 24.80 124 F 77 0.78 78 0.77 82 0.73 0.76 14.70 14.70 14.80 124 F 81 0.74 83 0.72 89 0.67 0.71 14.80 14.80 21.40 124 F 82 0.72 82 0.73 88 0.68 0.71 14.70 14.70 21.40 125 F 41 1.44 47 1.26 45 1.32 1.34 14.80 14.80 34.80 126 F 70 0.84 67 0.89 59 1.00 0.91 14.80 14.80 31.40 137 F 55 1.09 56 1.06 59 1.01 1.05 14.80 14.80 14.80 137 F 59 1.01 68 0.88 62 0.95 0.95 14.70 14.80 14.80 140 F 60 1.00 63 0.94 67 0.89 0.94 14.80 14.80 64.80 145 F 54 1.10 49 1.19 49 1.22 1.17 14.70 14.80 38.10 145 F 41 1.42 56 1.04 56 1.07 1.18 14.80 14.80 68.10 147 F 40 1.46 48 1.25 50 1.20 1.30 14.80 14.80 34.80 147 F 61 0.96 61 0.96 70 0.83 0.92 14.80 14.80 138.20 147 F 41 1.41 41 1.46 41 1.45 1.44 14.80 14.80 61.40 154 F 56 1.04 65 0.92 65 0.92 0.96 14.80 14.80 38.10 154 F 43 1.37 45 1.33 34 1.72 1.47 14.80 131.50 131.50 255 F 53 1.13 62 0.96 62 0.96 1.02 14.80 18.10 28.10 155 F 51 1.17 56 1.07 57 1.05 1.10 14.80 28.10 94.80 156 F 56 1.05 53 1.10 52 1.15 1.10 14.80 14.80 21.40 156 F 65 0.92 60 0.98 61 0.96 0.95 14.80 104.80 104.80 257 F 67 0.89 66 0.89 75 0.80 0.86 14.80 14.80 28.10 157 F 38 1.55 42 1.40 47 1.28 1.41 14.80 14.80 38.10 160 F 57 1.03 52 1.13 57 1.05 1.07 14.80 14.80 101.50 160 F 39 1.49 43 1.36 50 1.19 1.35 14.80 141.50 141.50 161 F 58 1.03 56 1.06 48 1.23 1.11 14.80 14.80 21.40 162 F 39 1.51 42 1.43 45 1.33 1.42 14.80 18.10 71.50 167 F 45 1.33 50 1.19 49 1.21 1.24 14.80 14.80 111.50 169 F 50 1.19 43 1.39 44 1.34 1.31 14.80 14.80 81.50 170 F 28 2.07 30 1.98 27 2.19 2.08 14.80 31.50 211.80 121 M 85 0.70 85 0.70 87 0.69 0.70 14.80 14.80 24.80 123 M 72 0.83 79 0.75 76 0.79 0.79 14.80 14.80 14.80 125 M 92 0.65 81 0.74 91 0.65 0.68 14.80 14.80 24.80 127 M 73 0.82 71 0.84 81 0.73 0.80 14.80 14.80 14.80 128 M 73 0.82 78 0.77 76 0.79 0.79 14.80 14.80 14.80 129 M 65 0.91 78 0.76 74 0.81 0.83 14.80 14.80 14.80 129 M 70 0.83 64 0.93 62 0.96 0.91 14.80 14.80 88.10 133 M 72 0.83 77 0.78 78 0.77 0.79 14.80 14.80 14.80 133 M 68 0.87 73 0.82 69 0.87 0.85 14.80 14.80 41.40 135 M 86 0.70 85 0.70 89 0.67 0.69 14.80 14.80 14.80 135 M 74 0.81 76 0.79 73 0.82 0.81 14.80 14.80 21.40 1

66
35 M 54 1.11 57 1.05 62 0.96 1.04 14.70 14.70 54.80 136 M 67 0.89 67 0.90 75 0.80 0.86 14.80 14.80 81.50 138 M 61 0.97 67 0.90 61 0.98 0.95 14.80 14.90 64.80 139 M 66 0.91 71 0.84 68 0.87 0.87 14.80 14.80 34.80 139 M 72 0.83 78 0.77 79 0.76 0.79 14.70 14.70 34.80 140 M 70 0.85 69 0.86 75 0.80 0.84 14.80 14.80 18.10 152 M 66 0.91 72 0.83 80 0.72 0.82 14.80 94.80 118.10 156 M 61 0.98 76 0.78 75 0.80 0.85 14.70 14.70 21.40 157 M 46 1.30 61 0.98 60 0.99 1.09 14.80 14.80 98.10 159 M 61 0.97 65 0.92 66 0.90 0.93 14.80 14.80 78.10 173 M 48 1.24 55 1.09 48 1.22 1.18 14.80 18.10 104.80 1
Normal Vision Children:
Age SexDyna1Hits
Dyna1RT
Dyna2Hits
Dyna2RT
Dyna3Hits
Dyna3RT
AvgDynaRT UFOV1 UFOV2 UFOV3 Category
9 F 33 1.81 30 1.92 29 2.06 1.93 14.80 28.10 98.20 117 F 64 0.93 56 1.06 64 0.94 0.98 14.80 14.80 51.50 117 M 46 1.26 50 1.16 54 1.10 1.17 14.80 14.80 31.50 116 F 67 0.89 64 0.94 68 0.88 0.90 14.80 14.80 21.40 111 F 41 1.44 38 1.50 38 1.52 1.49 14.80 14.80 14.80 113 F 64 0.94 56 1.07 55 1.07 1.03 14.80 14.80 14.80 18 M 28 2.13 23 2.57 29 1.96 2.22 14.80 14.80 14.80 1
13 F 53 1.11 58 1.03 55 1.07 1.07 14.80 14.80 68.10 1
Low Vision Adults of driving age:
Age SexDyna1Hits
Dyna1RT
Dyna2Hits
Dyna2RT
Dyna3Hits
Dyna3RT
AvgDynaRT UFOV1 UFOV2 UFOV3 Category
30 F 46 1.30 48 1.25 53 1.13 1.23 21.50 74.80 114.80 142 F 58 1.02 54 1.11 60 0.99 1.04 14.70 34.80 178.10 132 F 51 1.18 57 1.05 61 0.98 1.07 14.70 14.70 41.40 132 F 46 1.30 44 1.34 40 1.48 1.37 14.80 18.10 188.20 119 F 21 2.75 22 2.65 26 2.30 2.57 18.10 18.10 224.80 129 F 58 1.03 56 1.07 52 1.15 1.08 14.80 38.10 54.80 155 F 21 2.76 29 1.91 21 2.70 2.46 178.20 178.20 431.50 453 F 20 2.91 17 3.49 11 5.13 3.84 25.80 151.50 291.50 234 F 41 1.43 51 1.16 58 1.02 1.20 24.80 48.10 188.20 118 M 76 0.78 77 0.78 76 0.79 0.78 16.70 16.70 16.70 130 M 74 0.81 86 0.69 78 0.76 0.75 14.80 14.80 54.80 116 M 47 1.26 44 1.34 54 1.10 1.23 14.80 44.80 44.80 143 M 9 5.28 5 9.99 13 3.82 6.36 14.80 21.40 34.80 183 M 21 2.67 10 5.27 20 2.92 3.62 41.40 19.50 408.20 218 M 49 1.21 45 1.31 49 1.21 1.24 14.80 14.80 14.80 116 M 30 1.98 40 1.50 35 1.66 1.71 14.80 78.10 324.80 117 M 20 2.98 22 2.64 27 2.17 2.60 14.80 14.80 61.50 1

67
Appendix D:
Pilot study for normal vision children.
i. Linear regression and correlation for UFOV vs. Dynavision in normal vision
children
As seen above, there was no trend in the relationship UFOV vs. Dynavision
results for the cohort of children ages 8 to 17. With an r2 value = 0.018, only about 2% of
variability on one task would be accounted for by score on the other task. The
significance level for this correlation was calculated with a t-test (with N-2 df) = r /
SQRT([1-r2]/ [N-2]). With a sample size N = 8 and using a 2-tailed t test, t[df=6] =
0.334, p = 0.75. Thus, the correlation between UFOV and Dynavision scores in normal
child subjects was not found to be statistically significant.
The effect of age on the UFOV task in this cohort of children is shown on pg. 35,
and there was no significant correlation between age and performance. The effect of age

68
on the Dynavision tasks for children in this pilot study is shown on pg. 39, and there was
found to be a statistically significant negative correlation between age and reaction times
on Dynavision, such that scores improved (lower reaction times) with increasing child
subject age.
As with the adult scores for both normal vision and low vision, a ceiling effect
was seen for child performance on the UFOV task. For Task 1, 100% (8 of 8) child
subjects reached the ceiling processing speed of 14.8 ms. For Task 2, 87.5% (7 of 8)
children reached the 14.8 ms threshold. For Task 3, only 3 of the 8 subjects (37.5%)
reached the 14.8 ms threshold score. Thus, as for adults and low vision patients, UFOV
task 3 data were used when comparing UFOV to Dynavision scores.
To compare UFOV performance by gender in normal vision child subjects, an
independent t-test was performed for the 2 males and 6 females; t = 0.431, df = [8 – 2] =
6. The two-tailed P value = 0.844. Thus, there was no significant gender difference in
performance on UFOV for normal vision children. This could be in part caused by the
very small sample size here, especially as there were only 2 males. Similarly for
Dynavision, a t-test was performed for the 2 males and 6 females; t = 1.218, df = [8 – 2]
= 6. The two-tailed P value = 0.269. Thus, there was no significant gender difference in
performance on Dynavision for normal vision children; again, a larger sample size would
allow more thorough investigation into this relationship.
Test-retest reliability for the Dynavision task in these children was performed; the
individual trials for each subject were compared via paired t-tests [33], (Trial 1 vs. Trial 2
and Trial 2 vs. Trial 3), and a Bonferroni correction was applied for the 2 comparisons,
such that an alpha level of p ≤ 0.025 was applied. For the analysis of Trial 1 vs. Trial 2, t
= 1.57, df = [8 – 1] = 7. The two-tailed P value = 0.159. Thus, performance on Trials 1
and 2 is not statistically significantly different. When comparing Trial 2 vs. Trial 3, t =
1.01, df = [8 – 1] = 7. The two-tailed P value = 0.346; thus, performance on Trials 2 and
3 also is not found to be statistically significantly different. Thus, there was no significant

69
learning effect shown for children when repeating trials on the Dynavision task.
However, this does not necessarily imply that an appropriate approximation of reaction
time can be made without repeating the task, because the children demonstrated a higher
variability in performance than, for instance, the normal vision adult cohort. This was
what led to the lack of statistical significance in improvement in scores between trials,
and this variability indicates that an average of 3 Dynavision trials may still provide the
best overall estimate of the subject’s reaction time.
Bibliography: 1 Massof, R. "Low Vision and Blindness: Changing Perspective and Increasing Success."
Convention. Braille Monitor. Web. 26 Jan. 2017. <https://nfb.org/images/nfb/publications/bm/bm06/bm0610/bm061005.htm>. 2 "Vision Test for Texas Drivers License." I Drive Safely. Texas DPS., n.d. Web. 05 Mar.
2017. <https://www.idrivesafely.com/dmv/texas/drivers-license/pass-texas-dps-eye-test/>.
3 Cicchino, J.B; McCartt, A.T.; Critical older driver errors in a national sample of serious
U.S. crashes. Accid Anal Prev. 2015 Jul;80:211-9. doi: 10.1016/j.aap.2015.04.015. Epub 2015 Apr 29.
4 Rusch, M.L; Schall, M.C.; Lee, J.D. et al. Time-to-contact estimation errors among
older drivers with useful field of view impairments. Accident Analysis & Prevention. Volume 95, Part A, October 2016, Pages 284–291.
http://dx.doi.org/10.1016/j.aap.2016.07.008 5 Visual Awareness Research Group, Inc. UFOV® User’s Guide® Version 7.1.0.
25161 Harborside Blvd. Punta Gorda, FL 33955. 6 Mezuk, B.; Rebok, G.W.; Social Integration and Social Support Among Older Adults
Following Driving Cessation. J Gerontol B Psychol Sci Soc Sci. 2008 Sep;63(5):S298-303

70
7 Peli, E. "Driving with Low Vision: Who, Where, When, and Why." Boston: Harvard U,
2007. N. pag. Print. 8 Wood, J. Age and visual impairment decrease driving performance as measured on a
closed-road circuit. Hum Factors. 2002 Fall;44(3):482-94. 9Jones, L., Johnson, K., Hellsten J. et al. Overview of Injury in Texas and Role of
EMS/Trauma Registry. November, 2004. 10 Centers for Disease Control and Prevention, National Center for Injury Prevention and
Control. Web-based Injury Statistics Query and Reporting System (WISQARS). Atlanta, GA: CDC; 2016 [cited 2016 Dec 21]. Available from
11National Highway Traffic Safety Administration, Department of Transportation (US).
Traffic Safety Facts 2014: Older Population. Washington (DC): NHTSA; May 2016 [cited 2016 Dec 21].
12 Dougherty, B.E.; Flom, R.E.; Bullimore, M.A., et al. Previous driving experience, but
not vision, is associated with motor vehicle collision rate in bioptic drivers. Invest Ophthalmol Vis Sci. 2015 Oct;56(11):6326-32. doi: 10.1167/iovs.15-16882.
13 Rubin, G.S.; Ng, E.S.W.; Bandeen-Roche, K., et al. “A Prospective, Population-Based
Study of the Role of Visual Impairment in Motor Vehicle Crashes among Older Drivers: The SEE Study”. Invest Ophthalmol Vis Sci. 2007 Apr;48(4):1483-91.
14 Owsley C., Ball K., Sloane M.E., Roenker D.L., Bruni J.R. Visual/cognitive
correlates of vehicle accidents in older drivers. Psychol Aging. 1991 Sep;6(3):403-15.
15 Leat, S.J., Lovie-Kitchin, J. Visual impairment and the useful field of vision. Ophthal
Physiol Opt. 2006 Jun;26: 392–403. doi:10.1111/j.1475-1313.2006.00383.x 16 Owsley C., Ball K., Keeton D.M.. Relationship between visual sensitivity and target
localization in older adults. Vision Res. 1995 Feb;35(4):579-87. 17 Ball, K., Owsley, C., Sloane, M.E., Roenker, D.L., & Bruni, J.R. Visual attention
problems as a predictor of vehicle crashes in older drivers. Invest Ophthalmol Vis Sci, 1993 34(11), 3110-3123.

71
18 Goode, K.T., Ball, K.K., Sloane, M., et al. Useful Field of View and other
neurocognitive indicators of crash risk in older adults. Journal of Clinical Psychology in Medical Settings, 1995 Vol. 5, 425.
19 Cross, J.M., McGwin, G., Rubin, G.S. et al. Visual and medical risk factors for motor
vehicle collision involvement among older drivers. Br J Ophthalmol. 2009 Mar;93(3):400-4. doi: 10.1136/bjo.2008.144584.
20 Owsley, C., McGwin Jr., G. Vision and Driving. Vision Res. 2010 Nov 23; 50(23):
2348–2361. Published online 2010 May 23. doi: 10.1016/j.visres.2010.05.021 21 Owsley, C., Stalvey B.T., Wells J. et al. Visual risk factors for crash involvement in
older drivers with cataract. Arch Ophthalmol. 2001;119:881–887. 22 Bentley, S.A.; LeBlanc, R.P.; Nicolela, M.T.; et al. Validity, Reliability, and
Repeatability of the Useful Field of View Test in Persons with Normal Vision and Patients with Glaucoma. Invest Ophthalmol Vis Sci, 2012, Oct 1;53(11):6763-9.
23 Lunsman, M., Edwards, J. D.; Andel, R. et al. What Predicts Changes in Useful Field of View Test Performance? Psychol Aging. 2008 Dec; 23(4): 917-927. Doi: 10.1037/a0013466.
24 Bennett, D.M.; Gordon, G.; Dutton, G.N. The Useful Field of View Test, Normative Data in Children of School Age. Optom Vis Sci: June 2009 - Volume 86 - Issue 6 - pp 717-721. doi: 10.1097/OPX.0b013e3181a7b3b9.
25 Ball K.K., Beard B.L., Roenker D.L., et al. Age and visual search: expanding the
useful field of view. J Opt Soc Am A. 1988 Dec;5(12):2210-9.
26 Ball K., Owsley C. The useful field of view test: a new technique for evaluating age-related declines in visual function. J Am Optom Assoc. 1993 Jan;64(1):71-9.
27 Klavora P., Gaskovski P., Martin K., etal.The effects of Dynavision rehabilitation on behind-the-wheel driving ability and selected psychomotor abilities of persons after stroke. Am J Occup Ther. 1995 Jun;49(6):534-42
28 Klavora, P., Heslegrave, R.J., Young, M. “Driving skills in elderly persons with stroke:
Comparison of two new assessment options”. Arch Phys Med Rehabil. 2000 Jun;81(6):701-5.

72
29 Wells A.J., Hoffman J.R., Beyer K.S., et al. Reliability of the dynavision™ d2 for
assessing reaction time performance. J Sports Sci Med. 2014 Jan 20;13(1):145-50. eCollection 2014.
30 Klavora, P.; Warren, M. Rehabilitation of visuomotor skills in poststroke patients
using the dynavision apparatus. Perceptual and Motor Skills, 1998, 86, 23-30. 31 Crotty, M. and George, S. Retraining visual processing skills to improve driving ability
after stroke. Arch Phys Med Rehabil. 2009 Dec;90(12):2096-102. doi: 10.1016/j.apmr.2009.08.143.
32 Klavora, P.; Gaskovski, P.; Forsyth, R.D. Test-retest reliability of the Dynavision apparatus. Perceptual and Motor Skills. Volume 79, Issue 1 (August 1994) pp. 448-450. doi: 10.2466/pms.1994.79.1.448
33 Klavora, P.; Gaskovski, P.; Forsyth, R.D. Test-retest reliability of three Dynavision
tasks. Perceptual and Motor Skills: Volume 80, pp. 607-610. (1995). doi: 10.2466/pms.1995.80.2.607
34 Klavora, P.; Esposito, J.G. Sex differences in performance on three novel continuous
response tasks. Perceptual and Motor Skills. Volume 95, Issue 1 (August 2002) pp. 49-56. doi: 10.2466/pms.2002.95.1.49
35 Dynavision 2000 Operator’s Manual. Dynavision International, Inc. 2008. 36 Lohasz, P. The Effect of Mental Preparation Strategies on the Performance of a Motor
Task. Diss. U of Toronto, 1988. Ontario: National Library of Canada, 1988. Print. 37 Hulley S.B., Cummings S.R., Browner W.S., et al. Designing clinical research : an
epidemiologic approach. 4th ed. Philadelphia, PA: Lippincott Williams & Wilkins; 2013. Appendix 6C, page 79. http://www.sample-size.net/correlation-sample-size/(1/26/2017)
38 Lowry, Richard. "The Confidence Interval of Rho." Confidence Interval of Rho.
Vassarstats, n.d. Web. 23 Mar. 2017. <http://vassarstats.net/rho.html>. 39 "GraphPad QuickCalcs: T Test Calculator." GraphPad QuickCalcs: T Test Calculator.
GraphPad Software, Inc., 2017. Web. 05 Mar. 2017. <https://www.graphpad.com/quickcalcs/ttest2/>.

73
40Bland J.M., Altman D.G. Statistical methods for assessing agreement between two
methods of clinical measurement. Lancet 1986 1(8476):307-310.