Embed Size (px)
Citation preview

Predicting Blown Film Residual Stress Levels Influence on Properties
Thomas I. Butler Blown Film Technology, LLC Lake Jackson, TX 77566 [email protected] ABSTRACT The blown film process extrudes polymer melt from the extruder through an annular die where the bubble is inflated and drawn in the machine and cross directions while being cooled by an air ring system. The extension and cooling play critical roles in this process, directly affecting the residual stress level developed. The residual stress can significantly influence film properties. A new extensional viscosity model was developed to predict the stress developed in the bubble. The bubble cooling effects and crystallization were characterized along the bubble. The results are correlated to changes measured in film properties. How the processing conditions can be modified to provide improved film properties will be discussed. Output rate The extruder size, screw design, screw speed, barrel zone temperatures, polymer design, and backpressure of the die (for smooth barrel extruders) all combine to determine the output rate of an extruder/screw. The output rate from a blown film die can be calculated using Equation (1). For a given polymer density (ρs) producing a specified bubble size (rf) and thickness (hf), then the haul-off velocity will increase linearly with increasing output rate. (1) Output rate from a blown film die. M = (2 * π * rf * hf * ρs) * Vf M/t The output rate of two blown film lines with different die diameters can be compared, using die specific output rate (DSO). There are different ways of expressing the DSO. Europe uses DSO expressed as kg/hr/mm of die diameter (Equation (3)). North America uses DSO expressed as pounds/hour/inch of die circumference (Equation (2)). The DSO is used to scale-up output rates for different die sizes, if a similar bubble cooling system is used. (2) DSO (North America)
M(D*π ) lb/hr/in-c M/t*L
(3) DSO (Europe)
MD kg/hr/mm-d M/t*L
The Deborah number (De) is defined in Equation (4). The Deborah is a dimensionless parameter used to relate the polymer extensional relaxation time to a characteristic process time. De is a critical parameter in predicting draw resonance bubble instability. (4) Deborah number
De = λε*VoFLH
The Aspect ratio (A) is defined in Equation (5). The Aspect ratio is a dimensionless number that relates the geometry of the bubble and die. De is also a parameter used in predicting bubble instability.

(5) Aspect Ratio
A = FLH
ro
Bubble Forming Figure - 1 shows the forces applied on the blown film process when air is used to inflate a trapped bubble to the desired layflat. The internal bubble pressure (ΔP) expands the molten polymer in the hoop direction or cross direction (CD). The final radius of the bubble is the result of the work done by the expanding force supplied by the ΔP (excluding the expansion from the Bernoulli Effect in the air ring cone). The internal bubble pressure typically ranges from 12 to 75 Pa (0.05 to 0.3 inch of H2O). The nip rolls supply the haul-off force (Fhaul-off) to deform the bubble in the MD. The haul-off force is more difficult to measure on a blown film line. The haul-off force varies from 2.2 to 45 N (0.5 to 10 lbf). The haul-of force is uniformly applied across the bubble cross sectional area up and down the bubble.
Figure - 1 Forces acting on the blown film bubble. The blown film process uses dimensionless ratios to describe to the forming of the bubble. The basic ratios of blown film are blow-up ratio (BUR) for the CD extension and draw-down ratio (DDR) for MD extension. The BUR as defined by Equation (6) is an indicator of the amount of expansion (strain) in the bubble in the cross direction (CD). BUR does not describe the total strain or the strain rate.
(6) BUR = rfro
The DDR as shown in Equation (7) is an indicator of the elongation (strain) that occurs in the MD. The definition is the ratio of velocity of the haul-off to the velocity at the die exit. DDR does not describe the total strain or the strain rate.
(7) DDR = VfVo
Air rings are designed to cool the melt and stabilize it. Air ring technology involves two important aerodynamic phenomenons: (1) The Bernoulli Effect (also known as Venturi effect) where a pressure drop is created when a fluid velocity (air) is accelerated due to a reduction in the flow cross sectional area.

(2) The Coanda Effect is a vortex flow field that forms when a free fluid flow attaches to a surface and flows along the surface. The Bernoulli Effect occurs in the air ring when a fluid (air) flows into a restricted area resulting in the increase of air velocity which creates a pressure drop in the flow area as shown in Figure -2.
Figure – 2 Bernoulli Effect occurs when air velocity is accelerated and causes the pressure to decrease. The Bernoulli Effect in blown film occurs when the lower pressure generated by a high velocity air flow is applied to the free surface of the bubble, causing the bubble to be pulled out, as shown in Figure – 3. Polymers with very high melt strength require higher air velocities to produce sufficient pressure drop to pull the bubble surface toward the cone surface. Polymers with low melt strength, such as LLDPE, greatly benefit from the Bernoulli Effect of dual lip air rings, because output rates of these polymers can be significantly increased.
Figure – 3 The Bernoulli Effect occurs in a dual lip air ring pulling the bubble close to the forming cone. Dual-orifice Air Rings
Linear low density polyethylene (LLDPE) can be drawn down to thin gauges while maintaining superior mechanical properties making these polymers well suited for blown film extrusion. However, because LLDPE polymers have relative low melt strength, dual-orifice (lip) air rings provide improved bubble stability leading to higher DSO with good gauge uniformity. The design concept of dual-lip air ring is to use a primary or lower lip near the die exit to provide a low volume (high velocity) stream of air and a secondary or upper lip having a diameter 1.2 – 2.5 times the die diameter to provide a large volume of air for cooling (see Figure - 3). The lower and upper lips are separated by a machined conical surface (forming cone), the geometry of the cone establishes the bubble shape and guides the air flow. The lower lip provides a small volume (high velocity) of air to lock in the bubble and it provides significant cooling of the melt as shown in the calculated heat transfer coefficients along the bubble surface (excluding the heat of crystallization) in Figure - 4. After the forming cone, the bubble is exposed to the upper lip and is cooled by a large volume of air (lower velocity) over a large bubble circumference. Cone angle and height will determine the diameter of the upper lip and thus the minimum blow-up-ratio. The air ring cone can induce significant bubble expansion provided by the force of the Bernoulli Effect. This expansion can significantly reduce residual stress (orientation) in the CD, because stress induced at high melt temperatures will usually relax before they are frozen-in, particularly in polymers with fast relaxation times such as LLDPE and m-LLDPE.

Figure – 4 Calculated heat transfer coefficients on bubble surface at various air ring pressures on a Future Design air ring. (Sidiropoulos and Vlachopoulos) The bubble surface temperature can be scanned using an IR sensor (3.4 μ wavelength) designed for measuring polyethylene temperature. A typical bubble temperature profile is shown in Figure - 5. The heat of crystallization of polyethylene is an exothermic reaction 9releasing heat as crystallization occurs); therefore the rate of change of temperature of the bubble surface will slow with the release of heat as crystallization continues. The melt temperature (Tm) is measured with a variable depth thermocouple immersed in the middle of the adapter flow. The bubble surface temperature at the exit of the air ring cone is (Tcone). The detection of the on-set of crystallization is measured by changing of the slope of the cooling curve, and is defined as the crystallization line height (CLH). The frost line height (FLH) is the position on the bubble where expansion ends. The end of the plateau is defined as the plateau line height (PLH). The end of primary crystallization in the bubble occurs at the freeze line height (FZH).
Figure – 5 Bubble temperature profile and crystallization. The heat transfer between any two points on the bubble surface is shown in Figure - 6.

Q = M cp (ΔT)Q = u A ΔTLM
x1 ,Tb1
x2 ‘ Tb2
Ta1
Ta2
Bubble Air
Figure – 6 Heat transfer on bubble surface. The Equation (8) defines the heat transfer from the bubble surface using an average heat transfer coefficient (U). (8) Q = M Cp ΔT = U As ΔTLMTD Both the bubble and air flow are free surfaces which interact with each other. The cooling air flow is difficult to measure because air is inducted from the environment and interacts with the quenching process. Figure -7 shows the average heat transfer coefficient determined for various regions (including the heat of crystallization) of a blown film bubble.
Average Heat Transfer Coefficient
0.00
10.00
20.00
30.00
40.00
50.00
60.00
70.00
Die to Cone Cone to CLH CLH to FLH FLH to PLH PLH to FZH FZH to Nip
Ave
rage
Hea
t Tra
nsfe
r Coe
ffici
ent (
U),
W/m
^2/C
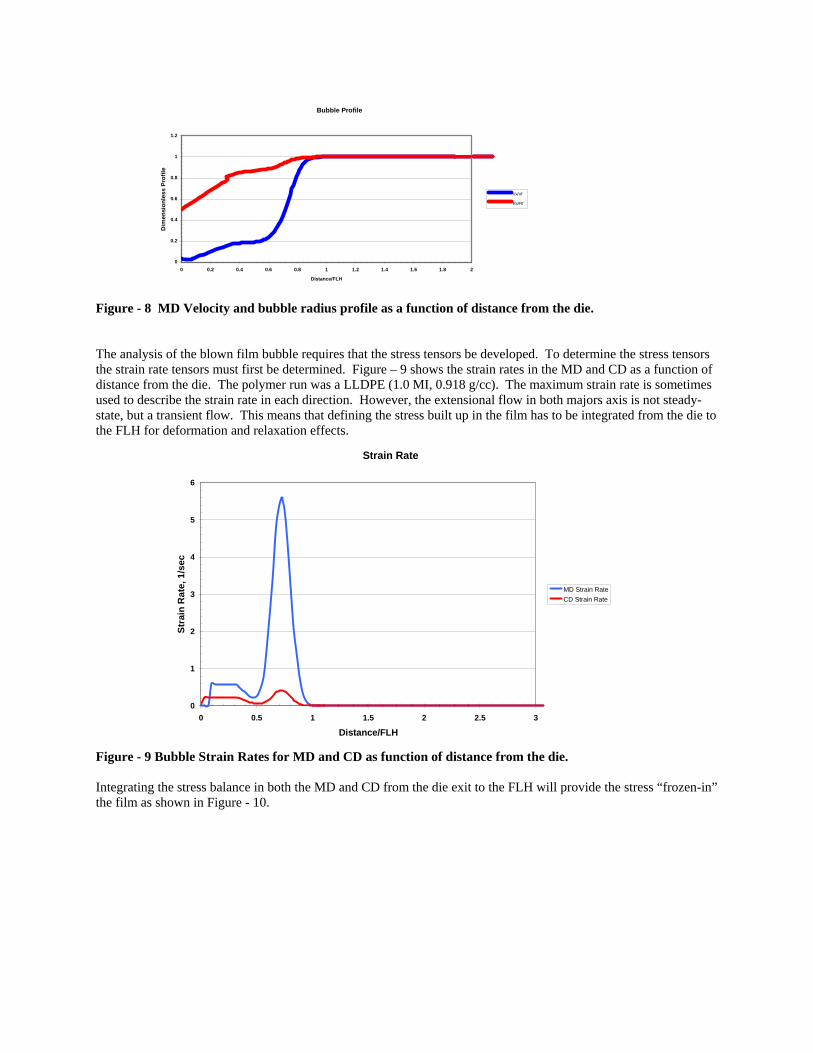
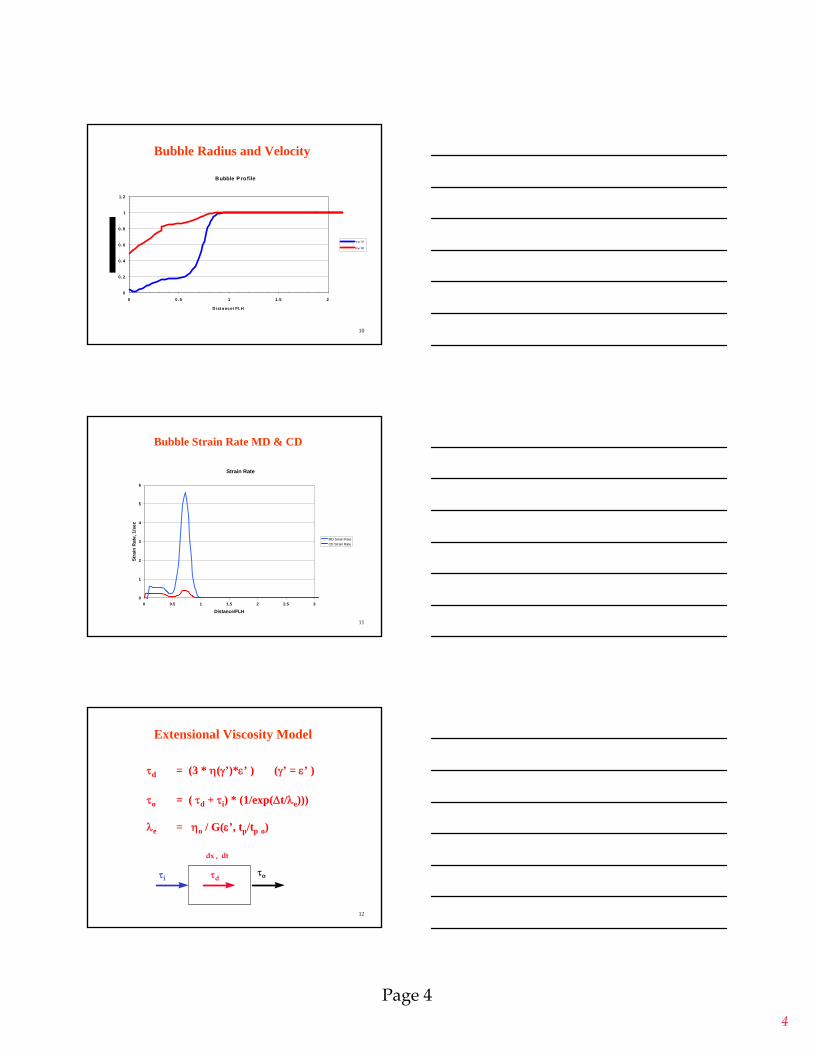
Figure - 7 Average heat transfer coefficient for various region of the bubble. The time that polymer takes to move from the exit of the die to the FLH (tp)depends on the design of the air ring used. For single lip air rings use Equation (9), and for dual lip air rings use Equation (10) can be used for estimates. (9) Single lip air rings. tp = [FLH /(Vf - Vo)] * Ln(Vf / Vo) t (10) Dual lip air rings. tp = [(Cone /(Vc – Vo)) * Ln( Vc / Vo)] + [(FLH-Cone) / (Vf – Vc )) * Ln (Vf / Vc)] t The shape of the bubble and the velocity (MD) profile must be determined to calculate the forces being applied to the bubble. Figure – 8 shows the dimensionless MD velocity and bubble radius profile for a blown film bubble.
Bubble Profile
0
0.2
0.4
0.6
0.8
1
1.2
0 0.2 0.4 0.6 0.8 1 1.2 1.4 1.6 1.8 2
Distance/FLH
Dim
ensi
onle
ss P
rofil
e
Vx/Vf
Rx/Rf
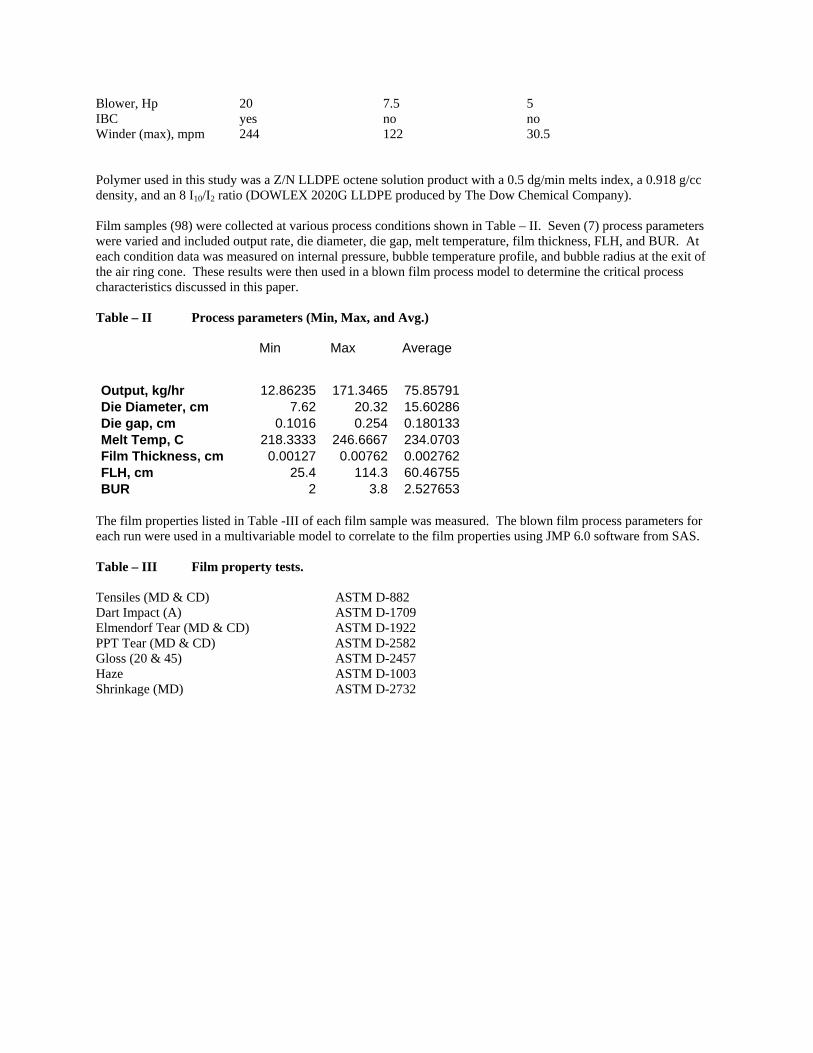
Figure - 8 MD Velocity and bubble radius profile as a function of distance from the die. The analysis of the blown film bubble requires that the stress tensors be developed. To determine the stress tensors the strain rate tensors must first be determined. Figure – 9 shows the strain rates in the MD and CD as a function of distance from the die. The polymer run was a LLDPE (1.0 MI, 0.918 g/cc). The maximum strain rate is sometimes used to describe the strain rate in each direction. However, the extensional flow in both majors axis is not steady-state, but a transient flow. This means that defining the stress built up in the film has to be integrated from the die to the FLH for deformation and relaxation effects.
Strain Rate
0
1
2
3
4
5
6
0 0.5 1 1.5 2 2.5 3
Distance/FLH
Stra
in R
ate,
1/s
ec
MD Strain RateCD Strain Rate
Figure - 9 Bubble Strain Rates for MD and CD as function of distance from the die. Integrating the stress balance in both the MD and CD from the die exit to the FLH will provide the stress “frozen-in” the film as shown in Figure - 10.

Residual Stress
0
0.1
0.2
0.3
0.4
0.5
0.6
0.7
0 0.5 1 1.5 2 2.5 3
Distance/FLH
Stre
ss, M
Pa
MpaMpa
Figure - 10 Development of MD and CD Residual Stress in Blown Film Orientation/Stress/Forces Orientation in a film occurs as the result of stress developed in deformation of the molten polymer fluid combined with stress relaxation until the film is frozen, locking the residual stress into the film's structure. The stress developed is related to the strain rate occurring as the bubble is formed. The calculated stress in the MD is a function of bubble radius and thickness and is calculated using Equation (11). At x = FLH:
(11) τmd
= F
(2*π *hf*rf) F/L2
The calculated stress in the circumferential direction (hoop stress) at the FLH is determined using Equation (12). At x = FLH:
(12) τcd
= ΔP rf
hf F/L2
Clearly if both the take-up force and internal bubble pressure can be determined, then these equations might be used to predict the forces induced into the film. Extensional Viscosity There is a significant difference between LLDPE and LDPE polymer flow in extension. Figure – 11 shows the reduced extensional viscosity of a LLDPE (1.0 MI, 0.920 g/cc) compared to a LDPE (1.5 MI, 0.919 g/cc) polymer as a function of zero shear viscosity times strain rate. The LCB of LDPE causes a significant increase in strain hardening in extensional flow which produces a strand rupture (break) at higher strain rates. LLDPE polymers

display a peak viscosity (maximum in the extension viscosity curve) after which draw resonance (DR) begins to occur.
0.1
1
10
1 10 100 1000 10000 100000 1000000 10000000
ε'*ηo, Pa
ηΕ
/(3 η
o)
LLDPELDPE
Figure – 11 Normalized steady-state elongational viscosities for LLDPE (1.0 MI, 0.920 g/cc) and LDPE (1.5 MI, 0.919 g/cc) polymers. Extensional viscosity curves have been difficult to develop relationships to actual processes. The problem is that extension is transient in most processes. This means that there is not a unique extensional stress for each strain rate. It is the path that is taken to reach a maximum strain rate that determines the extensional stress and that is unique for each process/polymer system. Another concern for extensional viscosity in blown film is that the extensional process is not iso-thermal. The cooling plays a critical role in the development of stress and in blown film processes. A method for measuring the apparent extensional viscosity is to continuously draw down a fiber and measure the stress and strain rate using equipment like the Gottfert Rheotens unit shown in Figure – 12.
Figure – 12 Rheotens melt strength measurement. (Credit: Gottfert) The melt strength data for various polymers is shown in Figure – 13. Melt strength is strongly influenced by Mw as shown with 1.0 MI LDPE vs. the 2.0MI LDPE. Melt strength increases as melt index decreases (Mw increases).

LCB also increases melt strength as shown by the 1.3 MI POP (w/ LCB) having a similar melt strength to a 1.0 MI LLDPE. .
LDPE 527I, MI=1.0, 0.923LDPE 529I, MI=2.0, 0.925
Melt Strength of ITP, LDPE andGoettfert Rheotens Data @ 190
POP, MI=1.3, I10/I2=13.5, 0.922Dowlex 2056A, MI=1.0, 0.92
0 50 100 150 200 250 300 3500
2
4
6
8
10
12
14
Velocity
Force
POP
Dowlex
LDPE
LDPE
Figure – 13 Melt strength data for various PE polymers. (Credit: The Dow Chemical Co.) The melt strength is determined by measuring the force at a given temperature obtained as the take-off speed is increased Figure – 14 shows the melt strength of a LLDPE (1.0 MI) polymer at 190 oC and vo = 50.8 mm/sec to be 4.2 cN. There are several methods of running and reporting the melt strength tests: 1. The test can be run at a constant output rate and temperature. 2. The can be run at constant stress on the die and a given temperature. 3. Melt strength can be reported as the maximum force measured as the strand is drawn down. 4. Melt strength is reported as the maximum force obtained with a stable strand. The method in Figure - 16 reports the maximum force achieved before the strand starts draw resonance running at constant output rate. With some polymers as shown for the LLDPE in Figure – 15, the maximum force can reach quite high values in the unstable region giving possibly misleading test results, if the maximum force is reported. Determining the critical DDR can also be defined as the point of rupture or at the point of on-set of DR. The values from the two results will be different. Using extensional data unless it is known how the values were determined and the conditions of the test could lead to misunderstanding the results as they are applied to other processes.

Figure – 14 Melt strength determination for a LLDPE (1.0 MI, 0.920 g/cc, Z/N C8) run at 190 oC and vo = 10 mm/sec. (Credit: The Dow Chemical Co.) The melt strength test (see Figure – 15) provides a controlled polymer flow (or stress) and temperature to a capillary die (typically 1.0 mm radius). An extruder or a capillary rheometer is used to supply the polymer flow to the die. The extrudate is pulled off the die by a set of either two or four wheels at a determined distance (typically H = 100 mm). The torque on the wheels is recorded as a function of the wheel speed.
H
V(min )- 1
Vo
Capillary RheometerPlunger Speed
Polymer Melt Temp.
Figure – 15 Geometry of the melt strength test. The melt strength data needs to be converted into extensional viscosity data to determine the stress generated in other processes. The strain rate for the melt strength test is determined using Equation (13) developed by Laun. The stress is calculated at the wheels using Equation (14). These equations assume: (1) isothermal conditions, (2) a constant density, (3) a logarithmic velocity function, and (4) a constant output rate. The only assumption that is close to true is the constant output rate. The extensional viscosity model should be non-isothermal, density should be determined as a function of temperature, and a model should be developed based on realistic velocity profiles.

These equations can be used for estimations, but when determining relaxation modulus, better equations need to be developed. (13)
ε’ = (Vf / H) * ln (Vf/Vo) 1/t (14)
τw = (Vf/Vo)*(F/πR2) F/L2 The melt strength of a LLDPE (0.5 MI, 0.918 g/cc, C8) is shown in Figure – 16. The melt strength of 8.0 cN is double the melt strength of the 1.0 MI in Figure – 14. Does higher melt strength mean higher output rates? Usually the higher melt strength allows higher cooling rates to be used, if bubble stability problems are not encountered.
Predicted Melt Strength Curve
0
1
2
3
4
5
6
7
8
9
0 5 10 15 20 25 30
DDR
Hau
l-off
Forc
e, c
N
Rheotens DataLLDPE C8 (0.5 MI, 0.918 g/cc)190 CVo = 10 mm/sec
Figure – 16 Melt strength for 0.5 MI LLDPE run at 190 oC and vo = 10 mm/sec. (Credit: The Dow Chemical Co.)
Figure - 17 Relaxation of an initial stress with time. The molecules in the bubble are constantly undergoing deformation as well as relaxation from the exit of the die until the FLH. The results of stress balance on a bubble are shown in Figure - 17. Each differential element of film (dx) has an initial stress (τi) applied to the polymer molecule from the previous element. Added to that is the deformation stress (τd) that occurs within the differential element during the time frame (dt). The stress remaining after the relaxation of stress that occurs within the time frame (dt) results in the residual stress (τo) that is passed to the next element as shown with a simple relaxation function in Equation (15).
τiτoτd
dx , dt
Figure - 17 Stress balance on a differential element of the polymer in the bubble.

(15) Relaxation function for predicting stress development.
τo = ((τd + τi) * (1/exp(Δt/λε))) t
The extensional relaxation time is not the same as the shear relaxation time as characterized by the Cross equation. The analysis of melt strength data revealed that there is not a single relaxation time. The extensional relaxation time (λε) for a polymer is a function of polymer zero shear viscosity, temperature, strain rate, and the ratio of the process time to the process time at the reference condition as show in Equation (16). (16) Extensional relaxation time.
λε = ηo / (G(ε’) * (tp/tp o)) t The deformational stress (τd) is the stress developed during the deformation of the differential element as show in Equation (17). (17) Deformational stress
td = (3 * ηe(γ’) * ε’)
Where: γ’ = ε’ The relaxation modulus for extension is dependent on the strain rate. Figure – 18 shows the relationship of the relaxation modulus (G) as a function of strain rate for LLDPE (0.5 MI, 0.917 g/cc) at 190 oC and a initial velocity vo = 10 mm/sec using the melt strength test.
y = -1305.9x2 + 16957x + 122211R2 = 0.9882
0.00
20000.00
40000.00
60000.00
80000.00
100000.00
120000.00
140000.00
160000.00
180000.00
200000.00
0 1 2 3 4 5 6 7
Strain Rate, 1/sec
Rel
axat
ion
Mod
ulus
, Pa
Figure – 18 Extensional relaxation modulus (G) for LLDPE (0.5 MI, 0.917 g/cc) at 190 oC as a function of maximum strain rate. (Measured using Rheotens test with a vo = 10 mm/sec.) The normalized extensional viscosity of a LLDPE (0.5 MI, 0.917 g/cc) at 190 oC is shown in Figure – 19 at the conditions run in the Rheotens test. The Trouton viscosity is the line (3ηo) = 1.0. This data is indicating that there is a small amount of strain hardening, but certainly not at the levels seen for LDPE. The data is run at 190 oC with a initial velocity of vo = 10 mm/sec.

0.1
1
10
0.1 1 10
Extensional Strain, 1/sec
Nor
mal
ized
Ext
ensi
onal
Vis
cosi
ty, η
e / (3
* ηo)
Figure – 19 Normalized Extensional viscosity for LLDPE (0.5 MI, 0.917 g/cc) at 190 oC and vo = 10 mm/sec. Orientation Orientation in a film occurs as the result of stress developed in deformation of the molten polymer fluid combined with stress relaxation until the film is frozen, locking the residual stress into the film's structure. The stress developed is related to the strain rate occurring as the bubble is formed. However, the shape of the bubble can be significantly altered, making these values difficult to predict. Typically a force balance on the bubble surface would be used to determine the residual stress in the MD, CD and ND. The calculated stress in the direction of flow as a function of bubble radius is calculated using Equation (18).
(18) σ11
= F
L
(2 π rfx hx)
Where: FL = take-off force, F The haul-off force at x = FLH equation (29) can be rewritten as shown in Equation (19).
(19) FL = σ11 * (2 π rflh hflh)
The calculated stress in the circumferential direction as a function of distance from the bubble is determined using Equation (20). (20) ΔP = h * [(σ
11/Rl) + (σ
33 / Rh)]
Where:
Rl = rf
cos ο radius of curvature factor in MD
Rh = -1
((d2r/dx2)cos3 ο) radius of curvature factor in CD

The CD or hoop stress at x = FLH, Equation (19) can be rewritten as Equation (21).
(21) σ33
= ΔP rf
hf
The CD force applied from the die to the FLH Equation (20) can be rewritten as shown in Equation (22).
(22) FCD = σ33 * (zflh havg)
The calculated stress in the normal direction is determined using Equation (23).
(23) σ22
= ΔP
The normal force applied from the die to the FLH Equation (22) can be rewritten as shown in Equation (24).
(24) FND = σ22 * (xflh 2 π ravg)
Clearly if the take-up force and internal bubble pressure are known, then these equations might be used to predict the forces applied onto the film. The internal bubble pressure is very easy to measure with a transducer. However, the take-off force is not easily measured on blown film lines. Orientation in each of the principal directions would be related to the resultant forces applied over the bubble surface in the three principal directions. The magnitude and direction of the resultant force is shown in Equations (25 - 28) and Figure - 20. (25) Ftotal = (FL
2 + FH2 + FN
2) 0.5
Figure - 20 Development of MD, CD and ND residual forces is directly related to orientation and crystallization of the film.
(26) MD force direction angle Cos (θ) = (FL / Ftotal)
β

(27) CD force direction angle Cos (φ) = (FH / Ftotal)
(28) ND force direction angle Cos (β) = (FN / Ftotal)
Figure - 21 shows the relaxation of an initial stress (0.2 MPa) with respect to time using a polymer with a slow extensional relaxation time (1.0 sec), a moderate relaxation time (0.32 sec), and a fast relaxation time (0.032 sec). When the time elements of the blown film process become small enough or the relaxation times become large enough to prevent the stress from relaxing, then increased residual stress will be frozen into the bubble film structure.
0
0.05
0.1
0.15
0.2
0.25
0 0.5 1 1.5 2 2.5 3 3.5 4 4.5 5
Time, sec
Stre
ss, M
Pa
λe = 1.0 sec
λe = 0.32 secλe = 0.032 sec
Figure – 21 Relaxation of 0.2 MPa stress using different relaxation times. Orientation and crystallization influences most film properties. The forces generated during the fabrication of the film will influence the orientation of both the crystalline domains and the tie molecules imbedded in the crystalline structures. These orientations developed have a relationship to the film properties measured on the film. There were three blown film lines used to collect film samples as shown in Table - I used to collect data. The first line is designated as Line 1. This was a line designed to run LLDPE at high output rates using IBC technology. Line 2 was a general purpose line set up to run LLDPE at moderate rates. Line 3 is a small research line running low rates. The three lines were selected to provide a wide range in process conditions and to include scale-up capability in the model. Table – I EXPERIMENTAL EQUIPMENT Line 1 Line 2 Line 3 Extruder Sterling Gloucester Egan Size, mm 88.9 63.5 50.8 L/D 32 30 24 Drive, Hp 200 100 20 Max. Speed, rpm 105 150 175 Screw Barr ET Barr ET Barrier Die Gloucester Sano Egan Die Size, mm 203.2 152.4 76.2 Air Ring: Saturn-II Saturn-II Saturn-II
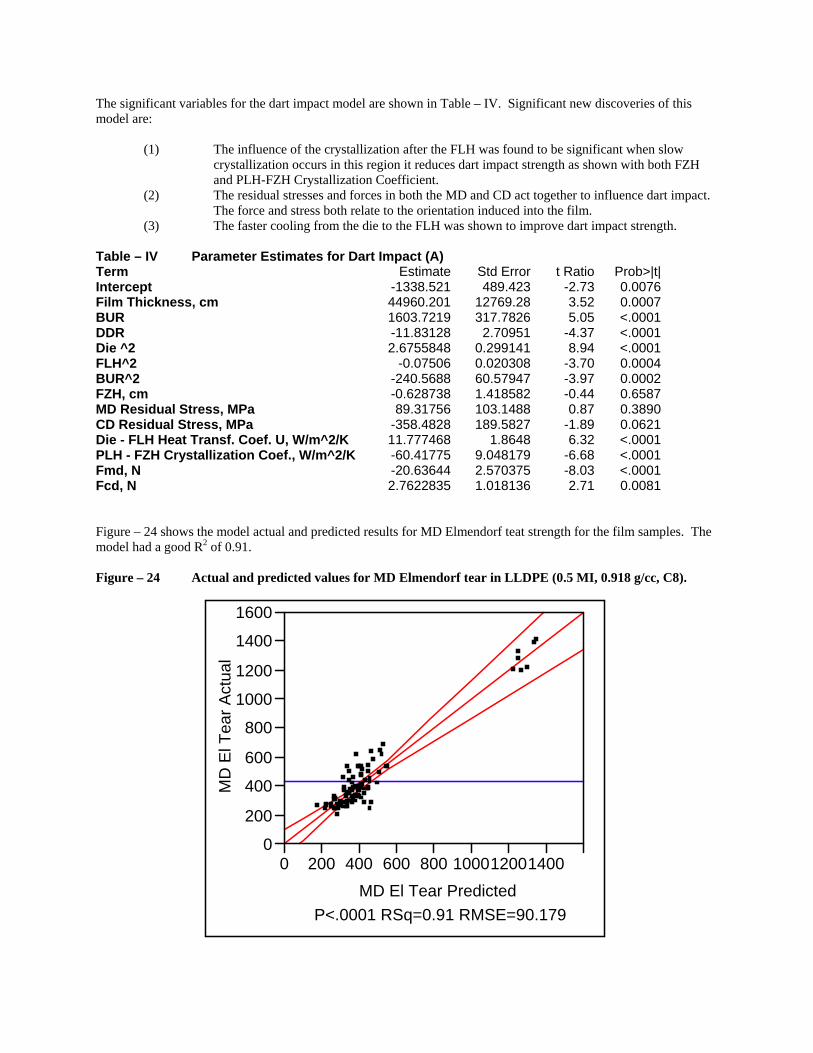
Blower, Hp 20 7.5 5 IBC yes no no Winder (max), mpm 244 122 30.5 Polymer used in this study was a Z/N LLDPE octene solution product with a 0.5 dg/min melts index, a 0.918 g/cc density, and an 8 I10/I2 ratio (DOWLEX 2020G LLDPE produced by The Dow Chemical Company). Film samples (98) were collected at various process conditions shown in Table – II. Seven (7) process parameters were varied and included output rate, die diameter, die gap, melt temperature, film thickness, FLH, and BUR. At each condition data was measured on internal pressure, bubble temperature profile, and bubble radius at the exit of the air ring cone. These results were then used in a blown film process model to determine the critical process characteristics discussed in this paper. Table – II Process parameters (Min, Max, and Avg.) Min Max Average
Output, kg/hr 12.86235 171.3465 75.85791Die Diameter, cm 7.62 20.32 15.60286Die gap, cm 0.1016 0.254 0.180133Melt Temp, C 218.3333 246.6667 234.0703Film Thickness, cm 0.00127 0.00762 0.002762FLH, cm 25.4 114.3 60.46755BUR 2 3.8 2.527653
The film properties listed in Table -III of each film sample was measured. The blown film process parameters for each run were used in a multivariable model to correlate to the film properties using JMP 6.0 software from SAS. Table – III Film property tests. Tensiles (MD & CD) ASTM D-882 Dart Impact (A) ASTM D-1709 Elmendorf Tear (MD & CD) ASTM D-1922 PPT Tear (MD & CD) ASTM D-2582 Gloss (20 & 45) ASTM D-2457 Haze ASTM D-1003 Shrinkage (MD) ASTM D-2732

0
20
40
60
80
100
120
140
160
0 20 40 60 80 100 120 140 160
Measured IBP, Pa
Pred
icte
d IB
P, P
a
Internal bubble pressure drop measured vs.predicted Based on new extensional viscosity modelLLDPE (0.5 MI, 0.918 g/cc, C8 Z/N)Run at various process conditions on threeblown film lines (98 runs)
Figure – 22 Measured and predicted internal bubble pressure for LLDPE (0.5 MI, 0.918 g/cc, C8 Z/N). This paper will discuss two film property models obtained with this data, dart impact and MD Elmendorf tear. The first property dart impact actual vs. predicted by the model is shown in Figure – 23. The film sample thickness ranged from 12.7 μ (0.5 mils) to 76.2 (3 mils). The model correlated fairly well obtaining a R2 of 0.89. The new extensional viscosity model was used in a blown film model to determine the stress levels developed in the bubble. The only stress level that is easily measured for the blown film process is the internal bubble pressure. Figure – 22 show the results of the measured and predicted internal bubble pressure are actually very similar over a wide range of line size and process conditions. Figure – 23 Actual and predicted values for dart impact in LLDPE (0.5 MI, 0.918 g/cc, C8).
200
400
600
800
1000
1200
1400
1600
Dar
t Im
pact
A A
ctua
l
200 400 600 800 1000 1200 1400 1600Dart Impact A Predicted
P<.0001 RSq=0.89 RMSE=111.54
The significant variables for the dart impact model are shown in Table – IV. Significant new discoveries of this model are:
(1) The influence of the crystallization after the FLH was found to be significant when slow crystallization occurs in this region it reduces dart impact strength as shown with both FZH and PLH-FZH Crystallization Coefficient.
(2) The residual stresses and forces in both the MD and CD act together to influence dart impact. The force and stress both relate to the orientation induced into the film.
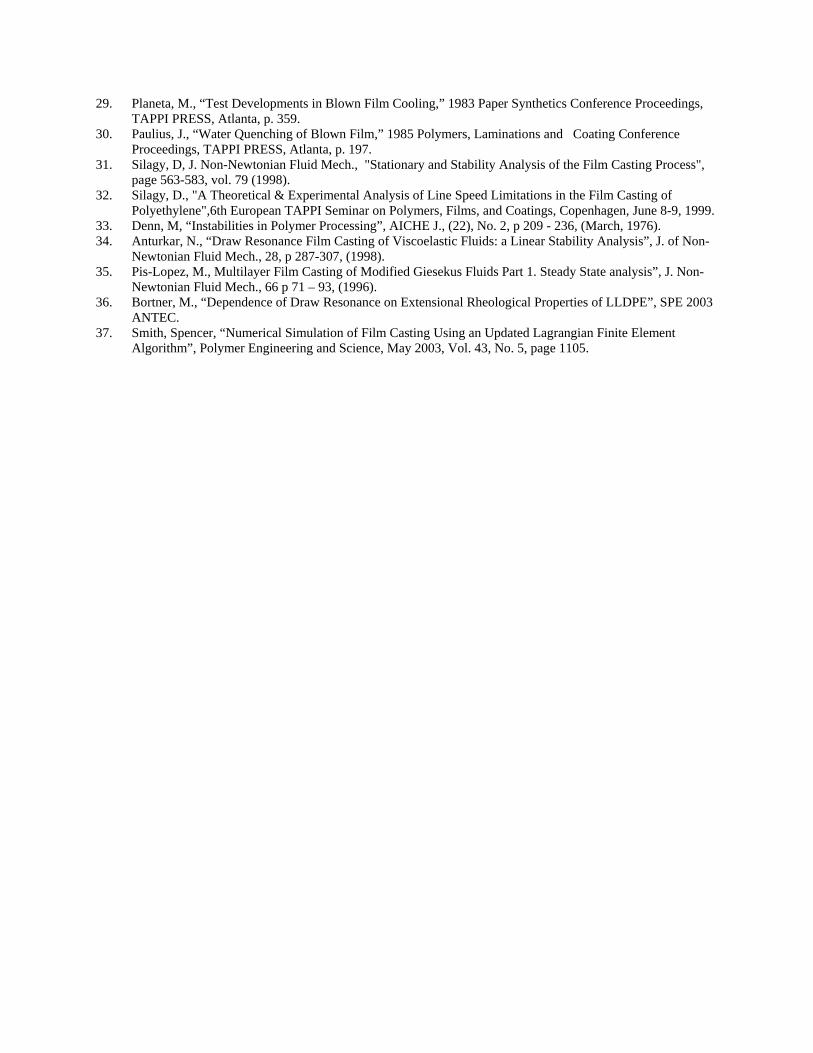
(3) The faster cooling from the die to the FLH was shown to improve dart impact strength. Table – IV Parameter Estimates for Dart Impact (A) Term Estimate Std Error t Ratio Prob>|t|Intercept -1338.521 489.423 -2.73 0.0076Film Thickness, cm 44960.201 12769.28 3.52 0.0007BUR 1603.7219 317.7826 5.05 <.0001DDR -11.83128 2.70951 -4.37 <.0001Die ^2 2.6755848 0.299141 8.94 <.0001FLH^2 -0.07506 0.020308 -3.70 0.0004BUR^2 -240.5688 60.57947 -3.97 0.0002FZH, cm -0.628738 1.418582 -0.44 0.6587MD Residual Stress, MPa 89.31756 103.1488 0.87 0.3890CD Residual Stress, MPa -358.4828 189.5827 -1.89 0.0621Die - FLH Heat Transf. Coef. U, W/m^2/K 11.777468 1.8648 6.32 <.0001PLH - FZH Crystallization Coef., W/m^2/K -60.41775 9.048179 -6.68 <.0001Fmd, N -20.63644 2.570375 -8.03 <.0001Fcd, N 2.7622835 1.018136 2.71 0.0081 Figure – 24 shows the model actual and predicted results for MD Elmendorf teat strength for the film samples. The model had a good R2 of 0.91. Figure – 24 Actual and predicted values for MD Elmendorf tear in LLDPE (0.5 MI, 0.918 g/cc, C8).
0
200
400
600
800
1000
1200
1400
1600
MD
El T
ear A
ctua
l
0 200 400 600 800 100012001400MD El Tear Predicted
P<.0001 RSq=0.91 RMSE=90.179

The significant variables for the MD Elmendorf tear model are shown in Table – V. Significant new discoveries of this model are:
(1) Faster cooling improves MD Tear as shown by FLH and die to FLH heat transfer coefficient and aspect ratio.
(2) CD orientation also improves MD tear as shown by CD force, MD direction angle and ND direction angle, and CD We number results.
(3) The complex nature of MD Elmendorf tear is also shown with interactions of die gap-BUR, die gap-DDR and die gap-output rate.
Table – V Parameter Estimates for MD Elmendorf Tear Term Estimate Std Error t Ratio Prob>|t|Intercept 1676.2098 721.1042 2.32 0.0228Output, kg/hr 9.0325842 3.911603 2.31 0.0237Die gap, cm 160.82236 555.6716 0.29 0.7731Melt Temp, C -4.239417 2.014232 -2.10 0.0387Film Thickness, cm 172963.71 16830.48 10.28 <.0001FLH, cm -12.55273 8.536955 -1.47 0.1456BUR 19.06761 83.57186 0.23 0.8201DDR 3.215412 2.504181 1.28 0.2031Out ^2 -0.026423 0.014672 -1.80 0.0757Die ^2 0.8650403 0.510484 1.69 0.0943FLH^2 0.0367404 0.044839 0.82 0.4152cone diameter, cm -8.417692 7.524361 -1.12 0.2668Aspect Ratio ( FLH / ro ) -4.870285 33.31222 -0.15 0.8842Nusselt (U D / k) -79442.6 37580.69 -2.11 0.0378Weissenberg CD ( λ * ε' ) -4.169396 261.8218 -0.02 0.9873Die - FLH Heat Transf. Coef. U, W/m^2/K 8.6506514 5.403724 1.60 0.1136Internal Bubble Pressure, Pa -4.219556 1.665719 -2.53 0.0134Fcd, N 3.6715164 1.905032 1.93 0.0577MD direction angle -1.346336 2.027445 -0.66 0.5087ND direction angle -5.924511 2.802269 -2.11 0.0378(Die gap, cm-0.18013)*(BUR-2.52765) -3054.883 1263.713 -2.42 0.0181(Die gap, cm-0.18013)*(DDR-24.5488) -132.5648 40.23502 -3.29 0.0015(Output, kg/hr-75.8579)*(Die gap, cm-0.18013) 0.502397 12.24316 0.04 0.9674 Summary The prediction of film properties based on polymer properties and processing conditions has been a goal for many years. There are several new developments discussed in this paper. The development of a new extensional viscosity model to allowed accurate prediction of the stress on the bubble surface. The new model is based on development on a novel relationship between strain rate and the polymer relaxation time. The new model is much more accurate in predicting the stresses based on polymer parameters and processing conditions without the need for any adjusting factors. The new model will also predict the different forces measured with different processing conditions using the melt strength test using the same polymer parameter. The determination of stresses on the bubble allows the calculation of the magnitude and direction of the resultant force vector. The model also calculates the cooling and crystallization kinetics. The determination of these critical process parameters were used to develop fairly simple multivariable regression models to predict very complex film properties such as dart impact strength and MD Elmendorf tear properties based on processing conditions. The results of the film property modeling have confirmed that there is a relation between orientation and quenching rates on film properties. Knowledge of the forces on the bubble and the rate of cooling were identified as having significant influence on film properties.

Terms used in this paper:
A = Aspect Ratio As = Surface area, L2 aT = Temperature shift factor
BUR = Blow Up Ratio Cone = Cone height, L Cp = Heat capacity, H/(M*T)
D = Diameter of die annulus L DDR = Draw Down Ratio De = Deborah number
Ea = Activation Energy F = Haul-off force F FLH = Frost Line Height, L
G = Extensional relaxation modulus F/L2 H = Distance between die and haul-off wheels L Hf = Heat of fusion, H/M
hf = Final film thickness L M = Mass flow rate M/t
n = Power law exponent Q = Heat transferred, H/t
R = Gas Constant rf = Final radius of bubble L
ro = Radius of die L T = Temperature, T
t = Time t To = Reference temperature (normally190 oC = 463.15 oK T tp = Characteristic process time, t U = Local heat transfer coefficient H/(t*L2*T)
V = Velocity L/t X = Fraction crystallinty, z = Distance from die on bubble surface, L
Δp = Internal bubble pressure F/L2 Δt = Time interval of element t ε' = Strain rate, 1/t
γ' = Shear rate, 1/t η = Shear viscosity, M/(L t ) ηe = Extensional viscosity, M/(Lt ) ηo = Zero shear viscosity, M/(Lt )
λs = Shear relaxation time, t λε = Extensional relaxation time, t
ρs = Density, solid M/L3 τ = Stress, F/L2
REFERENCES 1. Huck, N. D., and Clegg, P. L., "The Effect of Extrusion Variables on the
Fundamental Properties of Tubular Polyethylene Film", SPE ANTEC 1961, 18-2 pages 1-14. 2. J. Audureau, BB. Morese-Seguela, D. Constantin, and O. Gode, "Prediction and Improvement of Surface
Properties of Tubular Low Density Polyethylene Films", Journal of Plastic Film & Sheeting, Vol. 2, page 298, October, 1986.
3. N. Billon, P. Barq, and J. M. Haudin, "Modeling of the Cooling of Semi-crystalline Polymers during Their Processing", International Polymer Processing VI, Vol. 4, page 348, 1991.

4. T. I. Butler and R. Patel, "Blown Film Bubble Forming and Quenching Effects on Film Properties", TAPPI PL&C, page 409, 1992.
5. John Dealy and Kurt Wissbrun, "Melt Rheology and Its Role in Plastics Processing", Van Nostrand Reinhold, New York.
6. Robert Farber and John Dealy, "Strain History of the Melt in Film Blowing", Polymer Engineering and Science, Vol. 14, No. 6, page 435, June, 1974.
7. C. D. Han and T. H. Kwack, "Rheology-Processing-Property Relationships in Tubular Blown Film Extrusion. II. High Pressure Low-Density Polyethylene", Journal Of Applied Polymer Science, Vol. 28, page 3399, 1983.
8. T. A. Huang and G. A. Campbell, "Deformational History of LLDPE/LDPE Blends on Blown Film Equipment", Advances in Polymer Technology, Vol. 5, No. 3, page 181.
9. T. Kanai and J. L. White, "Kinematics, Dynamics and Stability of the Tubular Film Extrusion of Various Polyethylenes", Polymer and Textile Research Association, University of Tennessee, Knoxville, PATRA Report No. 203, April, 1983.
10. T. Nagasawa, T. Matsumura, S. Hoshino, and K. Kobayashi, "Film Forming Process of Crystalline Polymer. I. Factors Inducing A Molecular Orientation in Tubular Blown Film", Applied Polymer Symposium, No. 20 page 275, 1973.
11. G. Panagopoulos and L. G. Hazlitt, "Next Generation High Performance LLDPE Blown Film Resins: Superior Physical Properties and Processability", SPE Polyolefin ANTEC, page 266, 1993.
12. J. R. A. Pearson and C. J. S. Petrie, "The Flow of a Tubular Film. Part 1. Formal Mathematical Representation", Journal of Fluid Mechanics, Vol. 40, page 1, 1970.
13. J. R. A. Pearson and C. J. S. Petrie, "The Flow of a Tubular Film. Part 2. Interpretation of the Model and Discussion of Solutions", Journal of Fluid Mechanics, Vol. 42, page 609, 1970.
14. D. Simpson and I. Harrison, "The Use of Deformation Rates in the Scale-up of Polyethylene Blown Film Extrusion", Journal of Plastic Film & Sheeting, Vol. 8, page 192, July, 1992.
15. P. A. Sweeney, G. A. Campbell, and F. A. Feeney, "Real Time Video Techniques in the Analysis of Blown Film Instability", International Polymer Processing VII, Vol. 3, page 229, 1992.
16. T. Kanai, M. Kimura, and Y. Asano, "Studies on Scale-Up of Tubular Film Extrusion", SPE ANTEC, page 912, 1986.
17. S. M. Alaie and T. C. Papanastasiou, "Modeling of Non-isothermal Film Blowing with Integral Constitutive Equations", International Polymer Processing, Vol. VIII, Issue 1, page 51, March, 1993.
18. T. I. Butler, S. Y. Lai, and R. Patel, " Scale-up Factors Effecting Crystallization In Polyolefin Blown Film", TAPPI PL&C Conference, page 289, 1994.
19. Paul Tas, “Film Blowing- From Polymer to Product”, Phd. Thesis Technical University Eindhoven, October 28, 1994.
20. Knittel, R.R. and DeJonghe, R.J. Jr., “Blown Film Cooling Systems,” 1992 Film Extrusion Manual, TAPPI PRESS, Atlanta, p. 261.
21. Butler, T.I., “Blown Film Bubble Instability Induced by Fabrication Conditions,” 1999 Polymers, Laminations and Coating Conference Proceedings, TAPPI PRESS, Atlanta, p. 815.
22. Sidiropoulos, V and Vlachopoulos J., “An Investigation of Venturi And Coanda Effects In Blown Film Cooling” International Polymer Processing, in Press 1999.
23. Bode, W.W., “Current Developments in Equipment for Processing High Molecular Weight High Density Polyethylene Film,” 1989 Polymers, Laminations and Coating, A TAPPI PRESS Anthology of Published Papers 1986–1991, Ed., Bentley D.J. Jr., TAPPI PRESS Atlanta, p. 312.
24. Perdikoulias, J and Smith D., “Evaluation of the Performance of a New Tandem Air Ring System,” 1991 Polymers, Laminations and Coating, A TAPPI PRESS Anthology of Published Papers 1986 – 1991, Ed., Bentley D.J. Jr., TAPPI PRESS, Atlanta, p. 324.
25. Stobie, J., “Air Ring Considerations For Optimizing Blown Film Properties,” 1996 Polymers, Laminations and Coating Conference Proceedings, TAPPI PRESS, Atlanta, p. 231.
26. Jones, D.N., “USC-1 New Cooling System for LLDPE,” 1984 Polymers, Laminations and Coating Conference Proceedings, TAPPI PRESS, Atlanta, p. 105.
27. Gregory, R.B., “Internal Air Ring for Blown Film,” 1974 Paper Synthetics Conference Proceedings, TAPPI PRESS, Atlanta, p. 263.
28. DeJonghe, R.J. Jr., “Thermal Analysis of Blown Film Quenching,” 1986 Coextrusion Conference Proceedings, TAPPI PRESS, Atlanta, p. 67.
29. Planeta, M., “Test Developments in Blown Film Cooling,” 1983 Paper Synthetics Conference Proceedings, TAPPI PRESS, Atlanta, p. 359.
30. Paulius, J., “Water Quenching of Blown Film,” 1985 Polymers, Laminations and Coating Conference Proceedings, TAPPI PRESS, Atlanta, p. 197.
31. Silagy, D, J. Non-Newtonian Fluid Mech., "Stationary and Stability Analysis of the Film Casting Process", page 563-583, vol. 79 (1998).
32. Silagy, D., "A Theoretical & Experimental Analysis of Line Speed Limitations in the Film Casting of Polyethylene",6th European TAPPI Seminar on Polymers, Films, and Coatings, Copenhagen, June 8-9, 1999.
33. Denn, M, “Instabilities in Polymer Processing”, AICHE J., (22), No. 2, p 209 - 236, (March, 1976). 34. Anturkar, N., “Draw Resonance Film Casting of Viscoelastic Fluids: a Linear Stability Analysis”, J. of Non-
Newtonian Fluid Mech., 28, p 287-307, (1998). 35. Pis-Lopez, M., Multilayer Film Casting of Modified Giesekus Fluids Part 1. Steady State analysis”, J. Non-
Newtonian Fluid Mech., 66 p 71 – 93, (1996). 36. Bortner, M., “Dependence of Draw Resonance on Extensional Rheological Properties of LLDPE”, SPE 2003
ANTEC. 37. Smith, Spencer, “Numerical Simulation of Film Casting Using an Updated Lagrangian Finite Element
Algorithm”, Polymer Engineering and Science, May 2003, Vol. 43, No. 5, page 1105.

1
Page 1
1
2006 PLACE Conference
September 17-21 Cincinnati, Ohio
Predicting Blown Film Residual Stress Levels Influence on Properties
Presented by:Thomas I. ButlerOwnerBlown Film Technology, LLC
2
Introduction
Polyethylene film properties are strongly affected by polymer design and processing conditions.
Polymer design parameters that affect film properties include Density, Mwand MWD, branching and branching distribution.
– Extensional viscosity model developed to predict bubble stresses.
– Crystallization model developed to characterize quenching.
– Air ring design and operation was included in model.
– Film property differences are the result of processing conditions which produce changes in molecular orientation and crystallization.
3
Polymer – Process - Properties
PolymerRheology
ProcessConditions
ProcessMeasurements
ProcessVariables
OrientationCrystallinity
FilmProperties

2
Page 2
4
Blown Film Process Variables
Air
Flattened Tube
Δ P
1
2z
r
FLH
Cooling Airh(z)
R(z)
Rf
Nip rolls
z
θ
h = thicknessR = radiusT = temperatureρ = densityz = distance from diet = timeΔP = bubble pressureF = Haul-off forceQ = output rateV = velocityH = Heat loadU = overall heat transfer coeff.cp = heat capacityHf = heat of fusion
FL
Credit: Pearson and Petrie
* No air ring * No crystallization model
5
Characteristic Bubble Angle
Rd
Rf
α
Characteristic bubble angle (αb)
αb = atan ((Rf - Rd)/ xflh)
Rd = 4-inchRf = 10-inchBUR= 2.5xflh = 25-inch
αb = atan((10-4)/25)= 13.49 o
xflh
x
6
Air Ring Design
Rd
Rc
α
The upper lip (Rc) has a larger diameter than the lower lip (Rd).Rc / Rd = 1.2 - 2.0
The angle (αc) of the air ring coneαc = atan ((Rc – Rd)/xc)
= atan ((6.5-4)/9.5)= 14.75 o
The chimney angle (αchim) αchim = atan ((Rchim- Rd)/ xchim)
= atan((8-4)/14) = 15.94 o
Rc/Rd = 6.5/4= 1.625
Rchim
xc
xchim
x

3
Page 3
7
Bubble Cooling
Rd
Rc
Rf
α
Best cooling rates occur when:
αc = αchim = αb
Select the right FLH & BUR for the air ring geometry used for best cooling results.
Rchim
xc
xchim
xflh
x
8
Stresses - Forces on a Blown Film Bubbleτmd = Fhaul-off / (2 π rf hf)
τcd = ΔP (rf / hf) = Fhoop / (L havg)
τnd = ΔP = Fnormal / (L 2 π ravg)
9
Bubble Temperature Profile
LLDPE (1.0 MI, 0.920 g/cc)
IR sensor w/ 3.4 micron detector
4
Page 4
10
Bubble Radius and Velocity
Bubble P ro file
0
0.2
0 .4
0 .6
0 .8
1
1.2
0 0 .5 1 1.5 2
Dist ance/ FLH
Vx/ Vf
Rx/ Rf
11
Bubble Strain Rate MD & CD
Strain Rate
0
1
2
3
4
5
6
0 0.5 1 1.5 2 2.5 3
Distance/FLH
Stra
in R
ate,
1/s
ec
MD Strain RateCD Strain Rate
12
Extensional Viscosity Model
τo = ( τd + τi) * (1/exp(Δt/λe)))
λe = ηo / G(ε’, tp/tp o)
τd = (3 * η(γ’)*ε’ ) (γ’ = ε’ )
τiτoτd
dx , dt

5
Page 5
13
Residual Stress MD & CD
Residual Stress
0
0.1
0.2
0.3
0.4
0.5
0.6
0.7
0 0.5 1 1.5 2 2.5 3
Distance/FLH
Stre
ss, M
Pa
MpaMpa
MD
CD
14
Forces Vectors on Bubble
Forces acting on Bubble
– MD Force• Fhaul-off = τmd@FLH * (2* π* rf * hf)
– CD Force• Fhoop = ΔP * (rf / hf) * (havg * zflh)
– ND Force• Fnormal = ΔP * (2* π* ravg * xflh)
Force ≅ Degree of orientation≅ Degree of bubble stability
15
Force Vectors acting on Bubble
Ftotal = (MD2 = CD2 + ND2)0.5
MD direction angle θ = acos (MD / Ftotal)CD direction angle φ = acos (CD / Ftotal)ND direction angle β = acos (ND / Ftotal)
β

6
Page 6
16
Force Vectors
Fmd, Lbf (N) 3.62 16.08Fcd, Lbf (N) 0.42 1.87Fnd, Lbf (N) 3.44 15.30Force Vector. psi (N) 5.01 22.27Force Vector MD angle 6.62 6.62Force Vector CD angle 46.43 46.43Force Vector ND angle 83.05 83.05
LLDPE C8 (1.0 dg/min, 0.920)2.5 BUR, 28 inch FLH, 250 lb/hr8-inch die, 420 F
17
Prediction vs. Measured Stress
0
10
20
30
40
50
60
0 10 20 30 40 50 60
Distance from die, inch
Stre
ss, p
si MD stressCD Stresscal MD Stresscal CD stress
α = 0.1G = 180,000
B
B
LLDPE C8 (1.0 dg/min, 0.920)2.5 BUR, 28 inch FLH, 250 lb/hr8-inch die, 420 F
Doufas Model (constant G)Butler Model (G=f(ε’, tp))Measured Stress
18
Other Critical Process Parameters
Q = M Cp ΔT = U As ΔTLMTD
(Hf ρ 2 π rx hx Vz ΔX) /Dz = -C (Tx -Ta) 2 π rx
X’ = ΔX/ Δt
Nu = U D / k
De = λe * ( Vo / FLH)
A = FLH / ro
λe = ηo / G(ε’, tp/tp o)

7
Page 7
19
9 Primary Variables
BUR FLH* DDR*
Die Size Melt Temp* Output**
Air Ring* Thickness Die Gap
* Not Independent Variables* Output is only time sensitive variable
20
FLH Interactions
BUR Cooling Air Die Gap Thickness Melt Temp Output Air ring
FLH
Velocity Volume Rel. HumidityTemp
21
LLDPE Polymer
Melt Index 0.5 dg/min Density 0.918 g/cc LLDPE Z-N catalystProcess SolutionComonomer OcteneI10/I2 8.0Slip 900 ppmA/B 5000 ppmPPA 800 ppm

8
Page 8
22
Study: 3 - Blown Film Lines
Line 1 Line 2 Line 3 Extruder Sterling Gloucester Egan Size, mm 88.9 63.5 50.8 L/D 32 30 24 Drive, Hp 200 100 20 Max. Speed, rpm 105 150 175 Screw Barr ET Barr ET Barrier Die Gloucester Sano Egan Die Size, mm 203.2 152.4 76.2 Air Ring: Saturn-II Saturn-II Saturn-II Blower, Hp 20 7.5 5 IBC yes no no Winder (max), mpm 244 122 30.5
Credit: The Dow Chemical Company
23
(7) Process Parameters
Min Max Average
Output, kg/hr 12.86 171.34 75.85 Die Diameter, cm 7.62 20.32 15.60 Die gap, cm 0.1016 0.254 0.1801 Melt Temp, C 218.3 246.7 234.1 Film Thickness, cm 0.00127 0.00762 0.002762 FLH, cm 25.4 114.3 60.5 BUR 2 3.8 2.53
98 Film samples were fabricatedPolymer used: LLDPE Z/N C8 Solution1.0 MI, 0.918 g/cc, 8 I10/I2S, A/B, PPA, A/O (1st & 2nd)
24
(19) Input Parameters for New Model
154.44310Temp at cone, F (C)
175.2669.00FZH, in (cm)
84.3333.20PLH, in (cm)
55.8822.00CLH, in (cm)
35.5614Air ring upper cone diameter, inch (cm)
24.139.5Air ring, height, inch (cm)
110.00230.00Temp at CLH, F (C)
70.00158.00Temp at FZH, F (C)
609.60240.00Nip roll height, in (cm)
37.78100.00Temp at nip roll, F (C)
98.49209.29Xtal. Temp, F (C)
14946Air Ring Head Pressure, inch of H2O, (Pa)
2.502.5BUR
76.230FLH, in (cm)
0.002541Film Thickness, mil (cm)
232.22450Melt Temp, F (C)
0.254100Die gap, mils (cm)
20.328Die Diameter, inch (cm)
114250Output, lb/hr (kg/hr)
SIEng.

9
Page 9
25
Calculated Parameters
41.100.1629Die - FLH Heat Transf. Coef. U, Btu/hr/in^2/F (W/m^2/K)
0.15170.1517Weissenberg CD ( λ * ε' )
1.17791.1779Weissenberg MD ( λ * ε' )
0.00850.0085Nusselt (U D / k)
0.00680.0068Deborah ( λ * (Vo/FLH))
0.00180.0018Reynolds (ρ D Vo / η )
7.507.50Aspect Ratio ( FLH / ro )
0.19990.1999Polymer Extensional Relaxation Time at CLH, sec
0.25737.20CD Residual Stress, psi (MPa)
0.718104.07MD Residual Stress, psi (MPa)
0.13118.98Shear Stress, psi (MPa)
5.945.94Process Time to FLH, sec
0.760.76CD Strain rate, (sec-1)
5.895.89MD Strain rate, (sec-1)
0.748546.73Melt Density, lb/ft^3 (g/cc)
2.605.12Melt Velocity, fpm (cm/sec)
0.569.95Sp Output, lb/hr/in-c (kg/hr/mm-d)
6161Shear rate (sec-1)
32.6132.61DDR
26
Calculated Parameters (cont’d)
0.01001.45Stress at die, psi (MPa)
50.4450.44Force Vector ND angle
56.2856.28Force Vector CD angle
28.8728.87Force Vector MD angle
42.779.62Force Vector. Psi (N)
21.584.85Fnd, Lbf (N)
17.834.01Fcd, Lbf (N)
32.347.27Fmd, Lbf (N)
4.664.66Crystallization Rate, 1/sec
28.520.1145Internal Bubble Pressure, inch of H2O (Pa)
29.7329.73FTR (process/polymer)
0.240.24Time from CLH to FLH, sec
0.970.972Time from cone to CLH, sec
4.734.731Time from die to cone, sec
5.945.94Time from die to FLH, sec
6.300.0250PLH - FZH Crystallization Coef., Btu/hr/in^2/F (W/m^2/K)
33.960.1346FLH - PLH Crystallization Coef., Btu/hr/in^2/F (W/m^2/K)
2.900.0115CLH - FLH Crystallization Coef., Btu/hr/in^2/F (W/m^2/K)
27
Linear Regression Model
Relaxation time (λe) used was extensional relaxation timeResidual stresses calculated using (λe)Crystallization time was calculated using CLH – FZHBubble shape was calculated Bubble velocity was calculatedBubble temp profile was measuredBubble IBP was measuredResultant force were calculatedResultant force angles were calculated

10
Page 10
28
IBP: Measured vs. Predicted
0
20
40
60
80
100
120
140
160
0 20 40 60 80 100 120 140 160
Measured IBP, Pa
Pred
icte
d IB
P, P
a
Internal bubble pressure drop measured vs.predicted Based on new extensional viscosity modelLLDPE (0.5 MI, 0.918 g/cc, C8 Z/N)Run at various process conditions on threeblown film lines (98 runs)
29
Impact & Elmendorf Tear
Property Dart Impact MD Elmendorf Tear CD Elmendorf TearR2 0.8915 0.9072 0.9655
Intercept Intercept InterceptFilm Thickness Output Melt Temp
BUR Die gap Film ThicknessDDR Melt Temp BUR
Die ^2 Film Thickness Sp OutputFLH^2 FLH Nusselt BUR^2 BUR FTR
FZH DDR ND direction angleMD Residual Stress Out ^2CD Residual Stress Die ^2
Die - FLH U FLH^2PLH - FZH C cone diameter
Fmd Aspect RatioFcd Nusselt
Weissenberg CDDie - FLH U
Internal Bubble PressureFcd
MD direction angleND direction angle
(Die gap)*(BUR)(Die gap)*(DDR)
(Output)*(Die gap)
30
MD Tensiles and Shrink
Property MD 1% Sec Mod MD Elongation MD Shrink MD Ultimate Tensile MD YieldR2 0.7891 0.908 0.8737 0.8051 0.8196
Intercept Intercept Intercept Intercept InterceptMelt Temp Die gap Film Thickness Melt Temp BUR
BUR Film Thickness BUR Film Thickness DDRSp Output DDR DDR DDR Shear rate
Gap^2 Gap^2 Weissenberg CD DDR^2 MD Strain rateCD Strain rate PLH X' cone diameter MD Residual Stress
MD Residual Stress Temp at cone Fmd MD Strain rate Reynolds CD Residual Stress Melt Velocity (BUR)*(DDR) Process Time Nusselt
Weissenberg MD MD Residual Stress MD Residual Stress FTRFTR (Film Thickness)*(DDR) Weissenberg MD Force Vector
Internal Bubble Pressure Weissenberg CD (BUR)*(DDR)MD direction angle FLH - PLH CCD direction angle Internal Bubble PressureExt. Stress at die X'
Force VectorMD direction angleExt. Stress at die
(Film Thickness)*(DDR)

11
Page 11
31
CD Tensiles
Property CD 1% Sec Mod CD Elongation CD Ultimate Tensile CD YieldR2 0.849 0.605 0.8063 0.8438
Intercept Intercept Intercept InterceptDie gap Film Thickness Melt Temp Die Diameter
Film Thickness Shear Stress DDR DDRDDR Deborah cone diameter FLH^2
Sp Output PLH - FZH C Shear rate DDR^2DDR^2 Melt Velocity cone diameter
cone diameter Process Time Temp at coneMD Strain rate Nusselt Shear rateProcess Time Die - FLH U Melt Velocity
MD Residual Stress CLH - FLH C FTRCD Residual Stress Fcd Internal Bubble Pressure
Aspect Ratio Force Vector Fcd, NReynolds MD direction angle Force Vector
Weissenberg MD ND direction angle ND direction angleInternal Bubble Pressure
FmdMD direction angle
(Die gap)*(DDR )
32
Optical PropertiesProperty Haze 20 Gloss 45 Gloss Clarity
R2 0.787 0.895 0.8587 0.8119Intercept Intercept Intercept InterceptDie gap Melt Temp Melt Temp Die gap
Melt Temp FLH Film Thickness Melt TempFilm Thickness DDR BUR FLH
FLH Sp Output DDR BURBUR FLH^2 Sp Output DDRDDR PLH Die ^2 DDR^2
Gap^2 FZH Gap^2 MD Strain rateBUR^2 Temp at cone BUR^2 Process Time DDR^2 MD Residual Stress cone diameter Die - FLH U
cone diameter Weissenberg CD CLH FTRCLH Die - FLH U PLH Fcd, NFZH FLH - PLH C FZH Fnd
Temp at cone PLH - FZH C Temp at cone (Die gap)*(BUR)MD Residual Stress FTR CD Strain rate (FLH)*(DDR)CD Residual Stress Internal Bubble Pressure Process Time to FLH (BUR)*(DDR)
Deborah Crystallization Rate CD Residual StressWeissenberg CD Fmd Aspect Ratio
CLH - FLH C Ext. Stress at die Weissenberg CDFLH - PLH C (FLH)*(DDR) Die - FLH UPLH - FZH C FLH - PLH C
FTR PLH - FZH CX' X'
Fmd MD direction angleForce Vector ND direction angle
CD direction angle (BUR)*(DDR)(Die gap)*(FLH)(Die gap)*(BUR)
(BUR)*(DDR)
33
Dart Impact (A)
200
400
600
800
1000
1200
1400
1600
Dar
t Im
pact
A A
ctua
l
200 400 600 800 1000 1200 1400 1600Dart Impact A Predicted
P<.0001 RSq=0.89 RMSE=111.54

12
Page 12
34
MD Elmendorf Tear
0
200
400
600
800
1000
1200
1400
1600
MD
El T
ear A
ctua
l
0 200 400 600 800 100012001400MD El Tear Predicted
P<.0001 RSq=0.91 RMSE=90.179
35
Linear Model Summary
R2 values for all film properties are fair to goodR2 values for MD tear and impact are goodModel uses primary variables as inputModel calculates secondary variablesPrimary and secondary variables are used to predict film properties
36
Summary
P-P-P– Polymer – Intrinsic characteristics– Process - Fabrication variables– Properties - Orientation/ Relaxation & Crystallinity
Conventional variables do not describe processIdentified many key blown film process variablesCorrelation of these variables can be made to film properties.

13
Page 13
37
Thank You
PRESENTED BY
Thomas I. ButlerOwnerBlown Film Technology, [email protected]
Please remember to turn in your evaluation sheet...
![Predicting Residual Function in Hemodialysis and ...€¦ · dialysis guidelines [11,12] recommend the incorporation of RRF measurements into individualized patient prescriptions](https://img.pdfslide.us/doc/110x75/5f0e5db37e708231d43ee572/predicting-residual-function-in-hemodialysis-and-dialysis-guidelines-1112.jpg)