Embed Size (px)
Citation preview
Predictability of Consonant Perception Ability Through a Listening Comprehension Test: an Experimental Study on Japanese EFL Learners
SUGAI, Kosuke (Kinki University), YAMANE, Shigeru (Kansai University), KANZAKI, Kazuo (Osaka Electro-Communication University)
Email: [email protected]
3. Experiment
3.1 Purpose to examine learners’ perception abilities of syllable-initial consonants Hypothesis 1: A typical listening comprehension test, which is composed of multiple-choice comprehension questions, cannot predict learners’ English phoneme perception skills.
Hypothesis 2: Learners judged to have a similar level of listening comprehension actually differ in their overall and individual consonant perception skills.
3.2 Participants 22 Japanese EFL learners whose mean scores in the preliminary test ranging from 25 to 27 (out of 30) were selected (Their TOEIC score is around 550.) 3.3 Materials Seventeen minimal pairs were chosen based on the results in Sugai (2006).
Seventeen minimal pairs
- 34 consonants above were embedded in (/_ad/) syllable, making 34 stimuli -The test materials were synthetically created on a text-to-speech software called “Natural Reader ver.3.0.” 3.4 Procedure - stimulus sounds were presented through sound-isolating headsets - each target stimulus in the minimal pair was presented more than 10 times - The participants’ responses were recorded with “SuperLab 4.0” - In each session, two possible consonants were visually presented on the computer screen, while one-syllable sound was given to them aurally. The participants were asked to press a button (RB-830 response box) corresponding to the onset consonant they heard as quickly as possible. Their judgments and reaction time were recorded.
4. Result
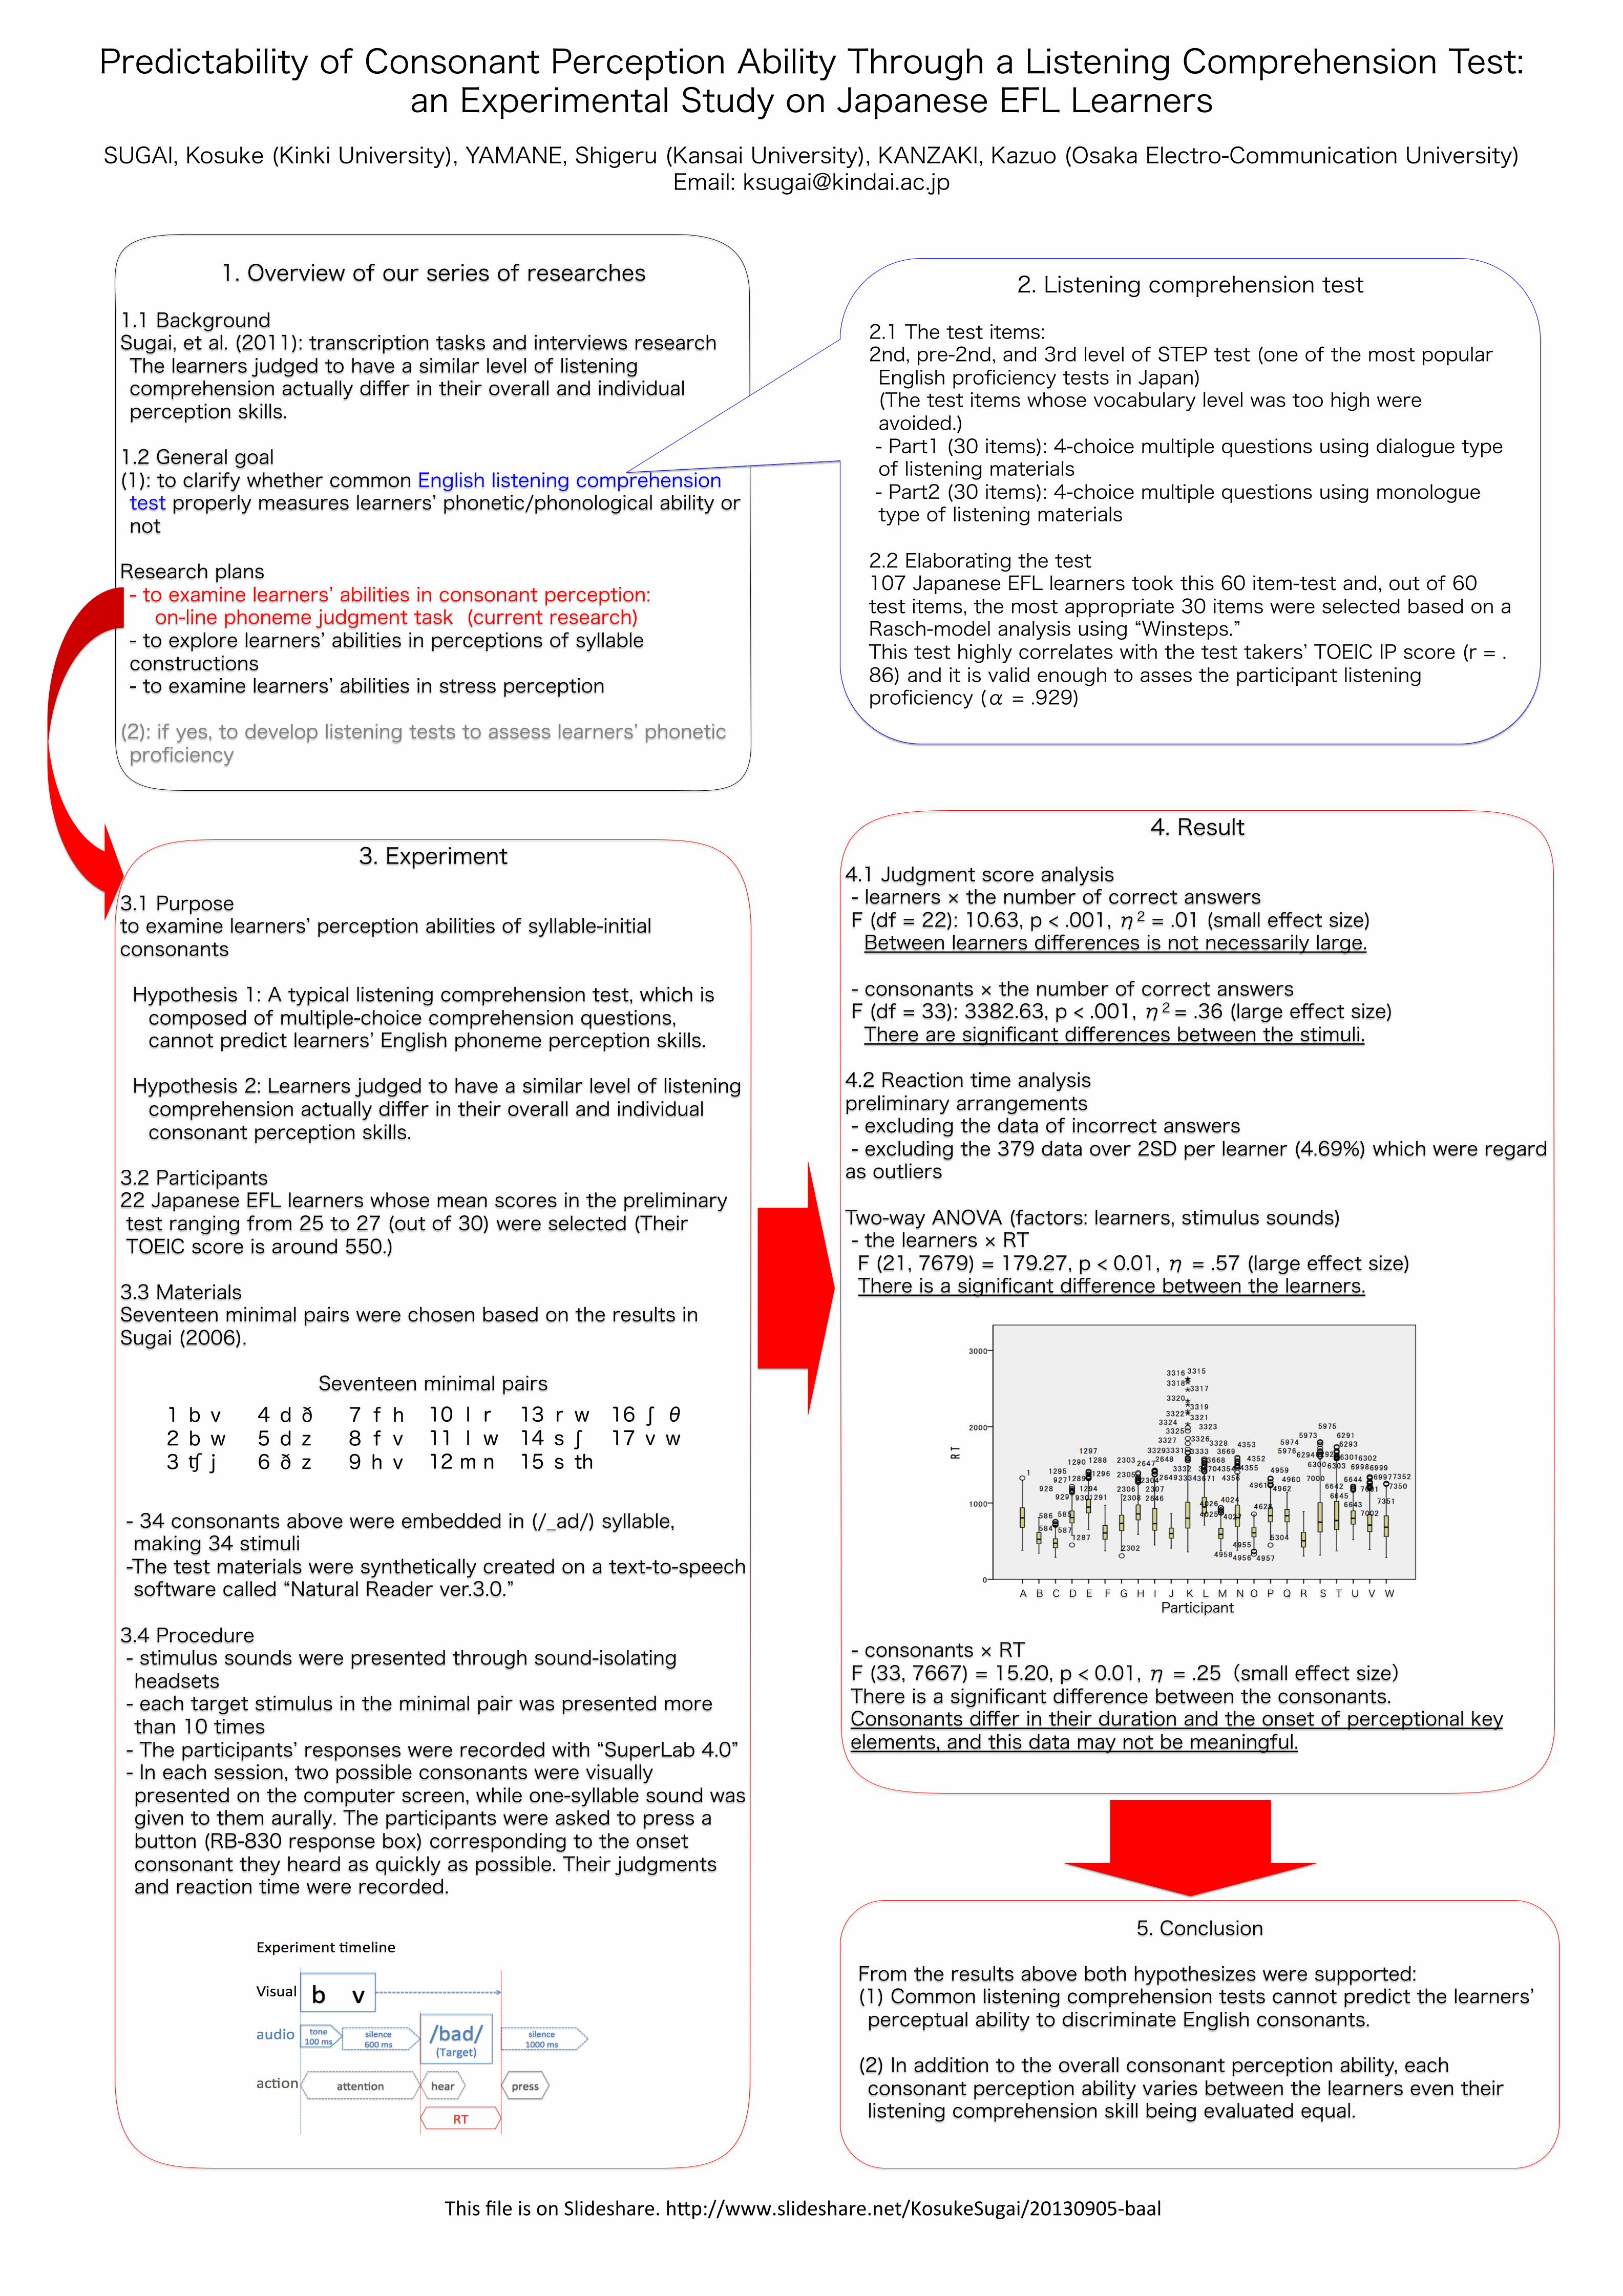
4.1 Judgment score analysis - learners × the number of correct answers F (df = 22): 10.63, p < .001, η2 = .01 (small effect size) Between learners differences is not necessarily large. - consonants × the number of correct answers F (df = 33): 3382.63, p < .001, η2 = .36 (large effect size) There are significant differences between the stimuli. 4.2 Reaction time analysis preliminary arrangements - excluding the data of incorrect answers - excluding the 379 data over 2SD per learner (4.69%) which were regard as outliers Two-way ANOVA (factors: learners, stimulus sounds) - the learners × RT F (21, 7679) = 179.27, p < 0.01, η = .57 (large effect size) There is a significant difference between the learners. A B C D E F G H I J K L M N O P Q R S T U V W
Participant - consonants × RT F (33, 7667) = 15.20, p < 0.01, η = .25(small effect size) There is a significant difference between the consonants. Consonants differ in their duration and the onset of perceptional key elements, and this data may not be meaningful.
5. Conclusion
From the results above both hypothesizes were supported: (1) Common listening comprehension tests cannot predict the learners’ perceptual ability to discriminate English consonants.
(2) In addition to the overall consonant perception ability, each consonant perception ability varies between the learners even their listening comprehension skill being evaluated equal.
1 b v 4 d ð 7 f h 10 l r 13 r w 16 ʃ θ 2 b w 5 d z 8 f v 11 l w 14 s ʃ 17 v w 3 ʧ j 6 ð z 9 h v 12 m n 15 s th
1. Overview of our series of researches
1.1 Background Sugai, et al. (2011): transcription tasks and interviews research The learners judged to have a similar level of listening comprehension actually differ in their overall and individual perception skills. 1.2 General goal (1): to clarify whether common English listening comprehension test properly measures learners’ phonetic/phonological ability or not Research plans - to examine learners’ abilities in consonant perception: on-line phoneme judgment task (current research) - to explore learners’ abilities in perceptions of syllable constructions - to examine learners’ abilities in stress perception (2): if yes, to develop listening tests to assess learners’ phonetic proficiency
2. Listening comprehension test
2.1 The test items: 2nd, pre-2nd, and 3rd level of STEP test (one of the most popular English proficiency tests in Japan) (The test items whose vocabulary level was too high were avoided.) - Part1 (30 items): 4-choice multiple questions using dialogue type of listening materials - Part2 (30 items): 4-choice multiple questions using monologue type of listening materials 2.2 Elaborating the test 107 Japanese EFL learners took this 60 item-test and, out of 60 test items, the most appropriate 30 items were selected based on a Rasch-model analysis using “Winsteps.” This test highly correlates with the test takers’ TOEIC IP score (r = .86) and it is valid enough to asses the participant listening proficiency (α = .929)
This file is on Slideshare. h0p://www.slideshare.net/KosukeSugai/20130905-‐baal
Acknowledgment
This research was parEally supported by a Grant-‐in-‐Aid for ScienEfic Research (C) (No. 22520637) of The Ministry of EducaEon, Science, Sports and Culture, Japan.
References
Ishikawa, K. (2009). Recogni(on and produc(on of English syllables by speakers of English and Japanese: Insights from the syllabifica(on process and syllable-‐coun(ng training. Tokyo: Kurosio publishers.
Jiang, N. (2012). Conduc(ng Reac(on Time Research in Second Language Studies (Second Language Acquisi(on Research Series). Routledge.
Koike, Y. (1978). Gaikokugo toshite no eigo no Hearing nouryoku keisei youin no jisshouteki kenkyuu (I). Monbukagakusho showa 52 nenndo kagakukennkyuuhi hojokin kennkyuu houkoku.
Lado, R. and Andrade, R. (1950) Test of aural percep(on for Japanese students. Ann Arbor: English language InsEtute.
Shizuka,T. (2007). Kisokara hukaku rikai suru Rasch modeling: Koumoku outou riron toha nitehinaru sokuteino paradigm. Osaka: Kansai-‐daigaku shuppannbu.
Solé, M-‐J, Beddor, P. S., and Ohala, M. (2007). Experimental approaches to phonology. Oxford: Oxford University Press.
Sugai, K. (2006). Nihonjin EFL gakushuush no eigo shiin chikaku: tan’onnsetsugo ni okeru nan’ido no chousa. Jjikkenn onnseigaku to ippann gengogaku. Tokyo: Tokyo-‐do shuppan.
Takebayasi, S. (1996). Eigo onseigaku. Tokyo: Kenkyu-‐sha. Takehuta, Y. (1996). Nihonjin eigo no kagaku: sono genjou to asu he no tenbou.
Tokyo: Kenkyu-‐sha. Otomo, K. (1996). Koumoku outou riron nyuumon: gengo tesuto de-‐ta no atarashii
bunsekihou. Tokyo: Taishukan shoten.


![SSC - prepadda.comprepadda.com/wp-content/uploads/english/ARTICLE IMPORTANT NOTES[].pdf Means to say ( ) Vowel Consonant Consonant Vowel Vowel = Vowel Consonant = Consonant ... I had](https://img.pdfslide.us/doc/110x75/5e4437036ae6ba6d743ded6b/ssc-prepaddacomprepaddacomwp-contentuploadsenglisharticle-important-notes.jpg)