Embed Size (px)
Citation preview
Predator diversity, intraguild predation, and indirecteffects drive parasite transmissionJason R. Rohra,1, David J. Civitelloa, Patrick W. Crumrineb, Neal T. Halsteada, Andrew D. Millerc, Anna M. Schotthoeferd,Carl Stenoiene, Lucinda B. Johnsonf, and Val R. Beasleyg
aDepartment of Integrative Biology, University of South Florida, Tampa, FL 33620; bDepartments of Biological Sciences and Geography and Environment,Rowan University, Glassboro, NJ 08028; cDepartment of Geography and Environmental Systems, University of Maryland, Baltimore County, Baltimore, MD21250; dMarshfield Clinic Research Foundation, Marshfield, WI 54449; eDepartment of Ecology Evolution and Behavior, University of Minnesota, St. Paul, MN55108; fNatural Resources Research Institute, University of Minnesota Duluth, Duluth, MN 55811; and gDepartment of Veterinary and Biomedical Sciences,The Pennsylvania State University, University Park, PA 16802
Edited by Burton H. Singer, University of Florida, Gainesville, FL, and approved January 23, 2015 (received for review August 19, 2014)
Humans are altering biodiversity globally and infectious diseasesare on the rise; thus, there is interest in understanding how changesto biodiversity affect disease. Here, we explore how predatordiversity shapes parasite transmission. In a mesocosm experimentthat manipulated predator (larval dragonflies and damselflies)density and diversity, non-intraguild (non-IG) predators that onlyconsume free-living cercariae (parasitic trematodes) reduced meta-cercarial infections in tadpoles, whereas intraguild (IG) predatorsthat consume both parasites and tadpole hosts did not. This likelyoccurred because IG predators reduced tadpole densities andanticercarial behaviors, increasing per capita exposure rates ofthe surviving tadpoles (i.e., via density- and trait-mediated effects)despite the consumption of parasites. A mathematical model dem-onstrated that non-IG predators reduce macroparasite infections, butIG predation weakens this “dilution effect” and can even amplifyparasite burdens. Consistent with the experiment and model, a wet-land survey revealed that the diversity of IG predators was unrelatedto metacercarial burdens in amphibians, but the diversity of non-IGpredators was negatively correlated with infections. These results arestrikingly similar to generalities that have emerged from the predatordiversity–pest biocontrol literature, suggesting that there may begeneral mechanisms for pest control and that biocontrol researchmight inform disease management and vice versa. In summary, weidentified a general trait of predators—where they fall on an IG pre-dation continuum—that predicts their ability to reduce infections andpossibly pests in general. Consequently, managing assemblages ofpredators represents an underused tool for the management ofhuman and wildlife diseases and pest populations.
biodiversity–ecosystem function | dilution effect | schistosomiasis | snail |trophic cascade
In the last century there has been an unprecedented globalincrease in infectious diseases and decline and homogenization
of biodiversity (1, 2). The controversial dilution effect hypothesissuggests that these two phenomena might be linked, specificallyby proposing that biodiversity often decreases disease risk (3–11). Dilution effect research, for the most part, has focused onhost diversity even though there is considerable evidence thatselective predation on infected or uninfected hosts can stronglyaffect parasite transmission (7, 8) and that predation on parasitesis widespread (9). As an example, in the well-studied CarpinteriaSalt Marsh food web, 44% of trophic links are believed to involvepredation on parasites (12). Despite the likely importance ofpredators to disease dynamics, we lack evidence supporting(i) the importance of predation to disease relative to more well-established factors known to affect parasite transmission,(ii) knowledge of environmental contexts that affect the impact ofpredators on disease, and (iii) the traits of predators that makethem strong or weak “diluters” of disease risk [any species thatreduces infections per focal host by removing parasites (equiv-alent to the solute] or serving as a less competent host thanthe focal host [equivalent to the solvent)]. This latter point is
particularly important because it might facilitate identifyingtypes of predators that can be managed to increase or de-crease disease.Many predators can consume both parasites and hosts (9),
creating intraguild (IG) “predation” [IGP; predation can besubstituted with natural enemy attack to capture both predatorsand parasites (13)] modules in food webs, defined as the killingand eating of potential competitors (14). These modules com-bine competition with predation and/or infection because thepredator and parasite compete for a shared resource, the host,but at least one of the natural enemies can also benefit fromconsuming or infecting the other (13, 14). IGP is widespread, andit can structure and potentially stabilize communities (15, 16).However, it complicates predicting the impacts of predators onparasite transmission (9, 17, 18). For instance, by reducing thedensity of hosts, IG predators can increase the per capita ex-posure of the remaining hosts to parasites (10, 19), which couldmake IG predators weaker diluters of disease risk than predatorsthat consume parasites but not the focal hosts (hereafter referredto as non-IG predators). In contrast, selective predation oninfected hosts should reduce disease spread (7, 8). Additionally,IG predators often induce changes in traits of prey, such as be-havior, growth, or morphology, which can also modulate parasitetransmission (10, 17, 18). These effects can oppose or rein-force the reduction in parasite transmission associated with IG
Significance
Humans are altering biodiversity globally and infectious dis-eases are on the rise; thus, there is considerable interest inunderstanding how changes to biodiversity affect disease risk.We show that the diversity of predators that consume para-sites was the best negative predictor of infections in frogs,suggesting that predation on parasites can be an importantmechanism of disease reduction. Follow-up experiments, fielddata, and mathematical models revealed that intraguild pred-ators, predators that consume both hosts and parasites, de-crease macroparasite infections per host less than predatorsthat only consume parasites, representing a general trait ofpredators that predicts their ability to reduce disease. Conse-quently, managing assemblages of non-intraguild and intra-guild predators is an underutilized tool to minimize human andwildlife diseases.
Author contributions: J.R.R., D.J.C., P.W.C., A.M.S., and V.R.B. designed research; J.R.R.,D.J.C., P.W.C., N.T.H., A.D.M., A.M.S., C.S., L.B.J., and V.R.B. performed research; J.R.R. andD.J.C. contributed new reagents/analytic tools; J.R.R. and P.W.C. analyzed data; and J.R.R.and D.J.C. wrote the paper.
The authors declare no conflict of interest.
This article is a PNAS Direct Submission.1To whom correspondence should be addressed. Email: [email protected].
This article contains supporting information online at www.pnas.org/lookup/suppl/doi:10.1073/pnas.1415971112/-/DCSupplemental.
3008–3013 | PNAS | March 10, 2015 | vol. 112 | no. 10 www.pnas.org/cgi/doi/10.1073/pnas.1415971112
predators consuming parasites and it is the net effect of thesepotentially countervailing trait- and density-mediated indirecteffects [TMIEs and DMIEs, respectively (20)] that will dictatethe overall effect of predation on disease risk (18, 21).Here, we use field surveys, experiments, and mathematical
models to identify the mechanisms driving predation-dependentpatterns of infection in a trematode–amphibian system. In thissystem, free-living, parasitic trematode cercariae are transmittedfrom snails, the first intermediate host, to tadpoles, the secondintermediate host (22) (see SI Background for a description ofthe life cycle) and several vertebrate and invertebrate taxa areknown to consume cercariae (e.g., refs. 9 and 23–25; see SIBackground for more details). To develop our hypotheses, weturned to the rich literature of predator–prey interactions be-cause it has a longer history than the host–parasite literature(18). Consistent with both the dilution effect hypothesis (3–5)and a meta-analysis that revealed that predator diversity on av-erage supresses prey (26), we hypothesized that, at ecologicallyrelevant densities, increased diversity of parasite predatorswould decrease trematode infections in frogs. We postulated thatthat this effect of parasite predators would be of a strengthcomparable to that of more well-established factors known toaffect trematode abundance (discussed below). Finally, there isconsiderable evidence that the efficacy of predator diversity incontrolling pest species is dependent on IG predation and non-consumptive or trait-mediated effects (26–29). Consequently, wehypothesized that the effects of predators on parasite transmissionwould depend on the sum of density- and trait-mediated effects andthe relative abundance of IG versus non-IG predator species.
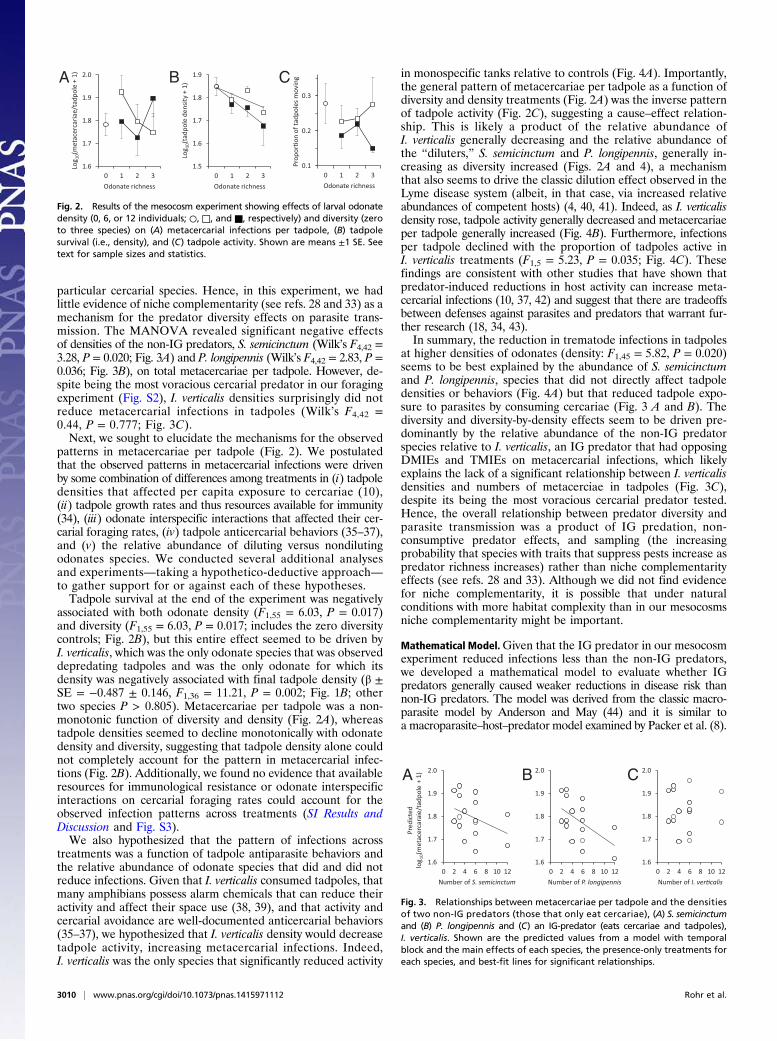
Results and DiscussionWetland Survey. We surveyed 18 wetlands in Minnesota (see Fig.S1 for map) to evaluate whether the taxonomic richness ofpotential cercarial predators predicted the numbers of meta-cercariae (encysted cercariae) per frog per wetland and toevaluate its predictive ability relative to other plausible pre-dictors of these infections, such as host (frog and snail) speciesrichness; snail abundance; melanomacrophage densities in frogs(immune cells that fight trematodes); and concentrations of ni-trate, phosphate, calcium, and the herbicide atrazine. The mul-timodel inference analyses revealed that taxonomic richness ofpotential cercarial predators was the best predictor of meta-cercarial infections per frog per wetland. The numbers of meta-cercariae per tadpole were lower in wetlands with more speciesof cercarial predators (sum of seven species of metacercariae;model averaged coefficient ± SE = −0.344 ± 0.121, F1,16 = 12.83,R2 = 0.45, P = 0.002; Fig. 1A and Table S1). Richness of cercarialpredators appeared in >90% of the models with ΔAICc <4 andhad a relative importance score of 0.96 (Table S1). A jackknifeanalysis revealed that the significance and direction of this effectwas robust to the removal of individual taxa or even all drag-onflies and damselflies (odonates) (Table S2), highlighting thatan assemblage of cercarial predators was associated with thedecline in metacercarial infection in frogs. The herbicide atrazinewas the only other significant predictor of infections (Table S1),but it was a positive predictor supporting previous findings (30).Given that the diversity of cercarial predators predicted infections
in frogs, we next sought to elucidate mechanisms by which predatorsaffect these infections. We focused on larval odonates as ourpredator guild because they are important predators of cercariae inponds (23–25) and some species can also be predators of tadpolehosts (e.g., ref. 31).
Foraging Experiment Without Interspecific Interactions. We firstconducted laboratory experiments to quantify the cercarial for-aging rates of several odonate species in the presence and absenceof interspecific interactions (see below for results of interspecificinteractions). All four larval odonate species significantly reduced
cercariae through foraging (df = 4, χ2 = 63.45, P < 0.0001; allpairwise comparisons with control P < 0.0001; Fig. S2). Thedamselfly, Ischnura verticalis, had a higher cercarial foraging ratethan that of the other three odonate species (all P < 0.0001;Fig. S2), which did not differ from one another (0.212 < P < 0.759;Fig. S2). Hence, based on cercarial foraging rates alone, I. verticalismight be expected to be the strongest diluter of disease risk.
Mesocosm Experiments.We conducted an experiment to elucidatemechanisms by which density and diversity of larval odonatesaffect abundance of three species of parasitic trematodes in Ranaclamitans (green frog) tadpoles. Each of these three trematodespecies was found commonly in our wetland survey (see ref. 27).This experiment used a 2 × 2 × 2 × 2 fully factorial design, whichcrossed the presence or absence of three species of odonates[late instar I. verticalis (damselfly), or early instar Pachydiplaxlongipennis or Sympetrum semicinctum (dragonfly)], with one oftwo odonate densities, 6 or 12 larvae. I. verticalis was the only IGpredator. This design resulted in three odonate densities (0, 6,and 12 larvae) and four odonate diversity treatments (0–3). Inour wetland survey, all wetlands had one to three odonate spe-cies (27.8%, 55.6%, and 16.7%, respectively) and the lower ofthe two densities in our experiment is more ecologically relevant(32); thus, we focus on the richness and density levels mostcommonly found in the field (see SI Results and Discussion fora discussion of the other richness and density levels).We first tested for main and interactive effects of odonate
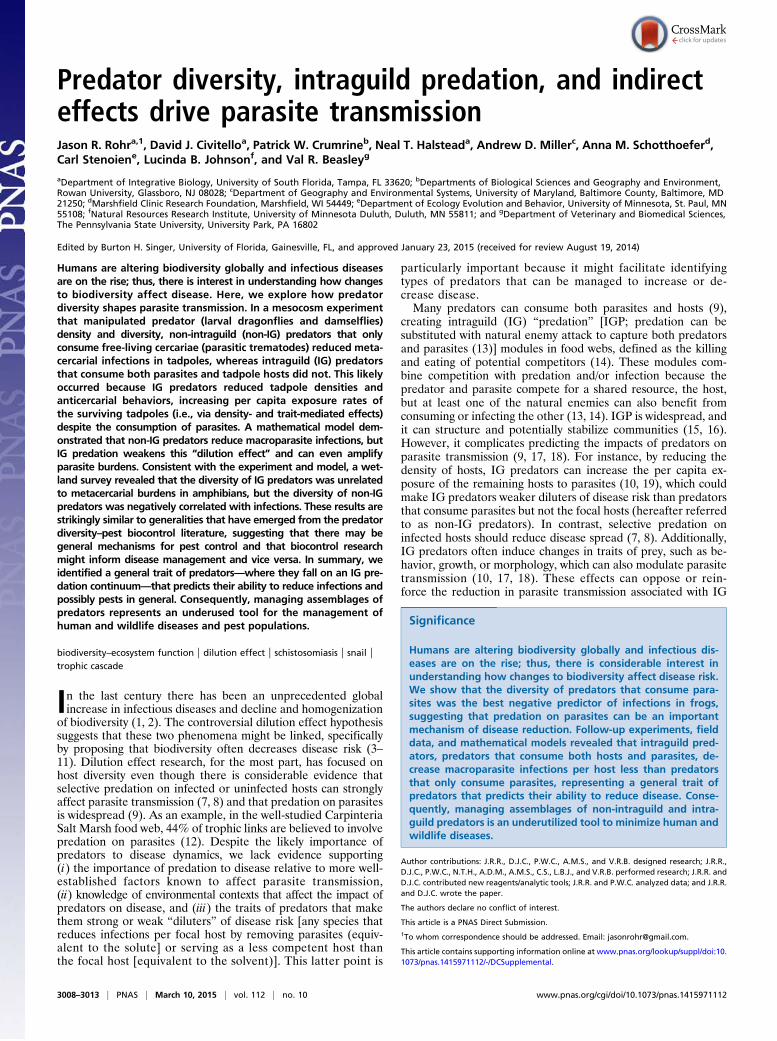
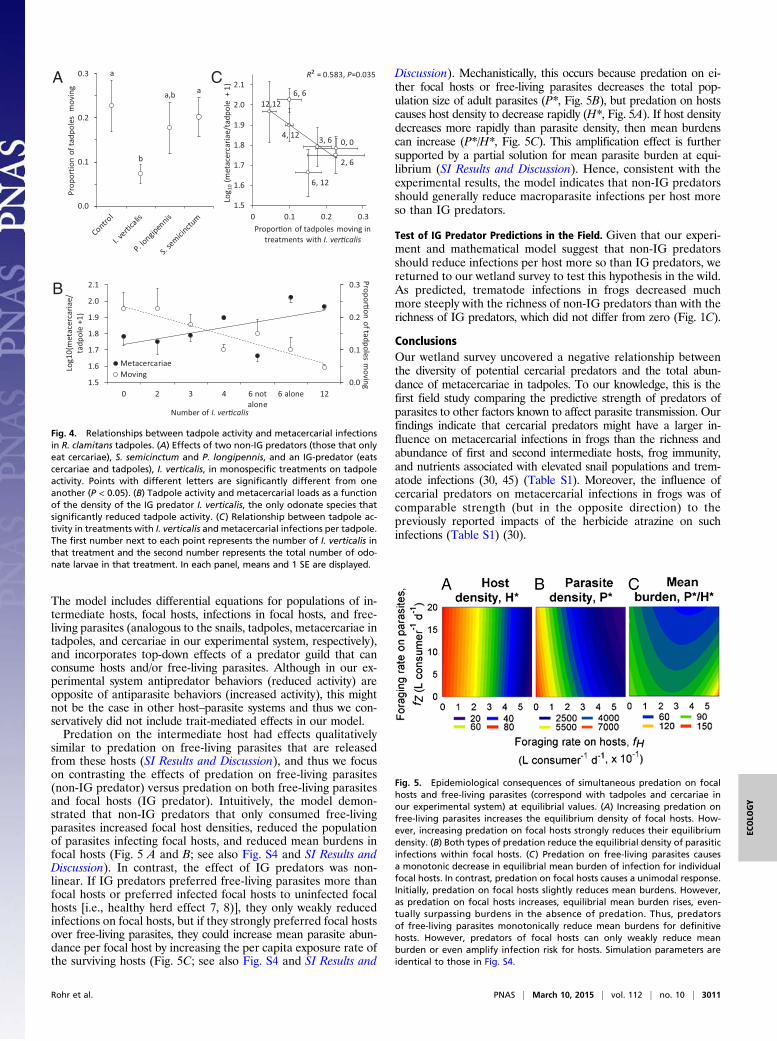
density and diversity on total metacercariae per tadpole [ex-cluding the zero diversity treatment so it was not a missing cellsdesign; multivariate ANOVA (MANOVA) on all three trema-tode species and univariate ANOVAs produced similarresults, Table S3]. At the lowest odonate density, total meta-cercariae per tadpole decreased with increasing odonate richnessfrom one to three species (Fig. 2A). At the highest odonatedensity, total metacercariae per tadpole decreased as odonaterichness went from one to two species but increased from two tothree species (density: F1,45 = 5.82, P = 0.020; diversity: F1,45 =4.17, P = 0.047; interaction: F1,45 = 4.07, P = 0.050; Fig. 2A).The previous statistical analysis ignored odonate species identity.
To elucidate which odonate species were driving the density anddiversity patterns in infections, we tested for the main effects ofoverall odonate density (a continuous predictor), each odonatespecies, and all two-way interactions between odonate species.There were no significant interactions between odonate species(P > 0.115), suggesting that interspecific interactions were notdriving the infection patterns. Additionally, each odonate specieshad similar effects on each trematode species, providing littleevidence that odonates specialized or had search images for
0 4 8 12Number of I.verticalis
1.4
1.5
1.6
1.7
1.8
1.9
2.0
goL01
)1+
ytisnedelopdat(
F1,36=11.21P=0.002R2=0.237
3 4 5 6 7 8 9 10Taxonomic richness
of cercarial predators
0
200
400
600
800
1000gorf/ecnadnubalairacrecateM
F1,16=12.83P=0.002R2=0.445
-1.0-0.8-0.6-0.4-0.20.00.20.40.6
Non-IGPrichness
IGPrichness
Slop
e be
twee
n ric
hnes
s and
m
etac
erca
rial a
bund
ance
F1,16 = 8.24P = 0.011
A B C
Fig. 1. The relationship between the taxonomic richness of potential cer-carial predators in a wetland and the number of metacercariae per frogper wetland (A), effects of the density of I. verticalis on the survival ofR. clamitans tadpoles in a mesocosm experiment (B), and the standardizedslope parameters (±1 SE) between the number of metacercariae per frog perwetland and either the taxonomic richness of non-IG (those that only eatcercariae) or IG predators (those that regularly eat cercariae and tadpoles) ina wetland (C) (see A for the relationship of the two groups combined). Inthe scatterplots, best-fit lines and 95% confidence bands are presented.
Rohr et al. PNAS | March 10, 2015 | vol. 112 | no. 10 | 3009
ECOLO
GY
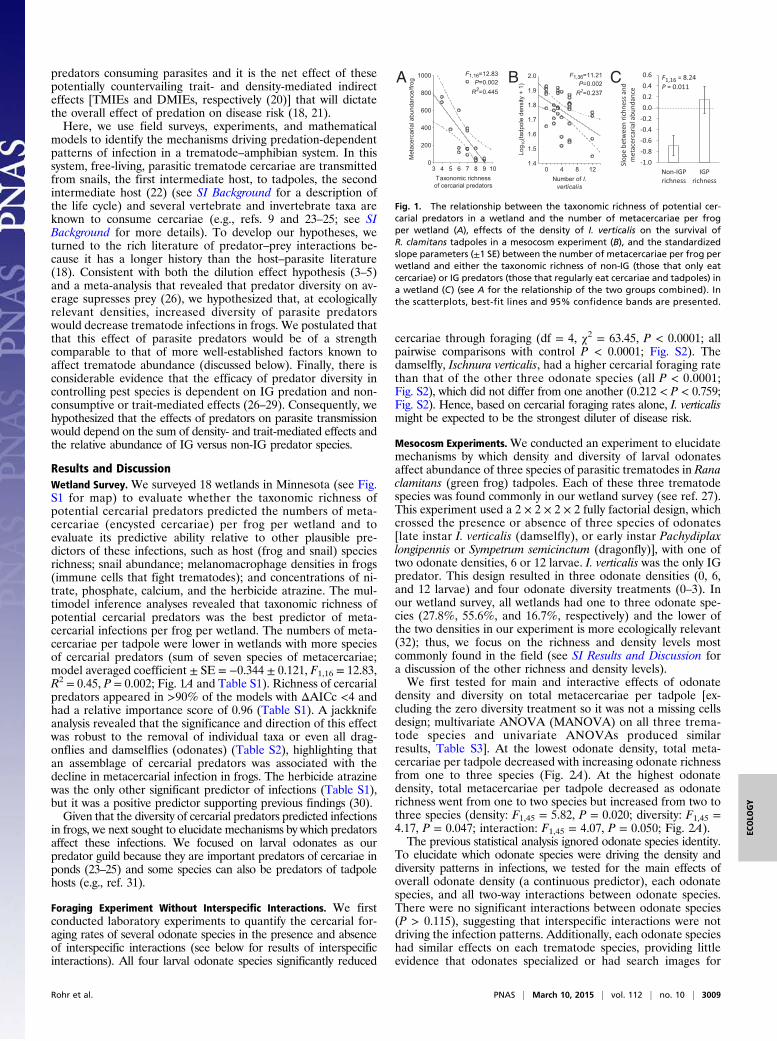
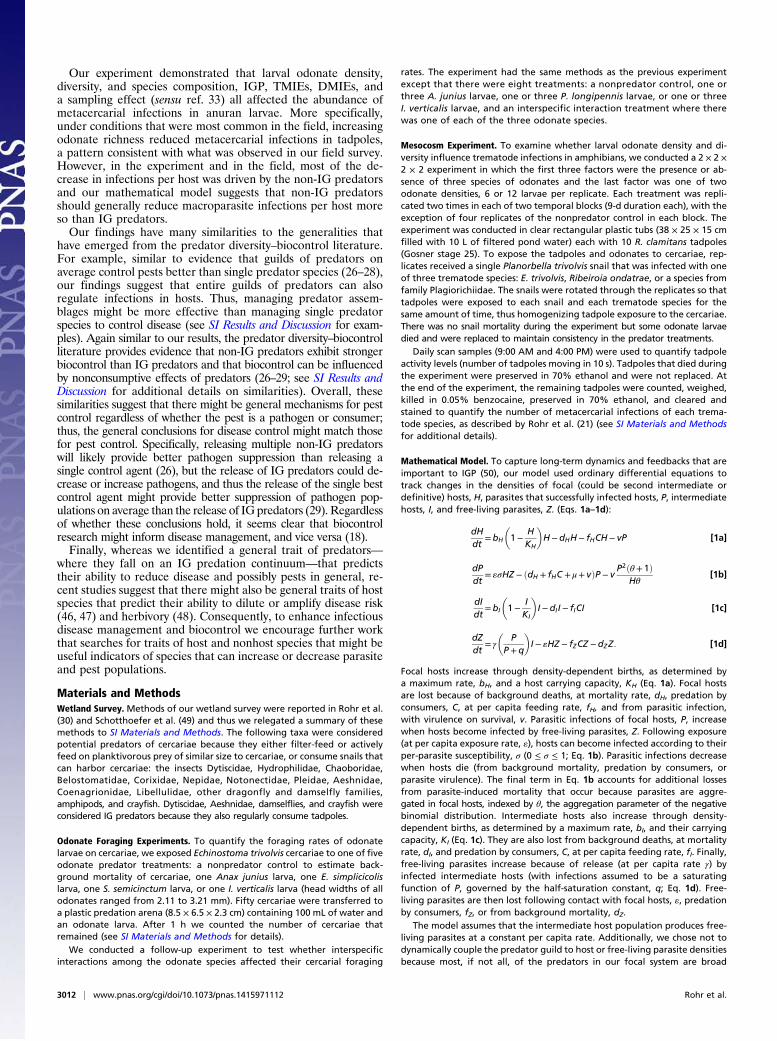
particular cercarial species. Hence, in this experiment, we hadlittle evidence of niche complementarity (see refs. 28 and 33) as amechanism for the predator diversity effects on parasite trans-mission. The MANOVA revealed significant negative effectsof densities of the non-IG predators, S. semicinctum (Wilk’s F4,42 =3.28, P = 0.020; Fig. 3A) and P. longipennis (Wilk’s F4,42 = 2.83, P =0.036; Fig. 3B), on total metacercariae per tadpole. However, de-spite being the most voracious cercarial predator in our foragingexperiment (Fig. S2), I. verticalis densities surprisingly did notreduce metacercarial infections in tadpoles (Wilk’s F4,42 =0.44, P = 0.777; Fig. 3C).Next, we sought to elucidate the mechanisms for the observed
patterns in metacercariae per tadpole (Fig. 2). We postulatedthat the observed patterns in metacercarial infections were drivenby some combination of differences among treatments in (i) tadpoledensities that affected per capita exposure to cercariae (10),(ii) tadpole growth rates and thus resources available for immunity(34), (iii) odonate interspecific interactions that affected their cer-carial foraging rates, (iv) tadpole anticercarial behaviors (35–37),and (v) the relative abundance of diluting versus nondilutingodonates species. We conducted several additional analysesand experiments—taking a hypothetico-deductive approach—to gather support for or against each of these hypotheses.Tadpole survival at the end of the experiment was negatively
associated with both odonate density (F1,55 = 6.03, P = 0.017)and diversity (F1,55 = 6.03, P = 0.017; includes the zero diversitycontrols; Fig. 2B), but this entire effect seemed to be driven byI. verticalis, which was the only odonate species that was observeddepredating tadpoles and was the only odonate for which itsdensity was negatively associated with final tadpole density (β ±SE = −0.487 ± 0.146, F1,36 = 11.21, P = 0.002; Fig. 1B; othertwo species P > 0.805). Metacercariae per tadpole was a non-monotonic function of diversity and density (Fig. 2A), whereastadpole densities seemed to decline monotonically with odonatedensity and diversity, suggesting that tadpole density alone couldnot completely account for the pattern in metacercarial infec-tions (Fig. 2B). Additionally, we found no evidence that availableresources for immunological resistance or odonate interspecificinteractions on cercarial foraging rates could account for theobserved infection patterns across treatments (SI Results andDiscussion and Fig. S3).We also hypothesized that the pattern of infections across
treatments was a function of tadpole antiparasite behaviors andthe relative abundance of odonate species that did and did notreduce infections. Given that I. verticalis consumed tadpoles, thatmany amphibians possess alarm chemicals that can reduce theiractivity and affect their space use (38, 39), and that activity andcercarial avoidance are well-documented anticercarial behaviors(35–37), we hypothesized that I. verticalis density would decreasetadpole activity, increasing metacercarial infections. Indeed,I. verticalis was the only species that significantly reduced activity
in monospecific tanks relative to controls (Fig. 4A). Importantly,the general pattern of metacercariae per tadpole as a function ofdiversity and density treatments (Fig. 2A) was the inverse patternof tadpole activity (Fig. 2C), suggesting a cause–effect relation-ship. This is likely a product of the relative abundance ofI. verticalis generally decreasing and the relative abundance ofthe “diluters,” S. semicinctum and P. longipennis, generally in-creasing as diversity increased (Figs. 2A and 4), a mechanismthat also seems to drive the classic dilution effect observed in theLyme disease system (albeit, in that case, via increased relativeabundances of competent hosts) (4, 40, 41). Indeed, as I. verticalisdensity rose, tadpole activity generally decreased and metacercariaeper tadpole generally increased (Fig. 4B). Furthermore, infectionsper tadpole declined with the proportion of tadpoles active inI. verticalis treatments (F1,5 = 5.23, P = 0.035; Fig. 4C). Thesefindings are consistent with other studies that have shown thatpredator-induced reductions in host activity can increase meta-cercarial infections (10, 37, 42) and suggest that there are tradeoffsbetween defenses against parasites and predators that warrant fur-ther research (18, 34, 43).In summary, the reduction in trematode infections in tadpoles
at higher densities of odonates (density: F1,45 = 5.82, P = 0.020)seems to be best explained by the abundance of S. semicinctumand P. longipennis, species that did not directly affect tadpoledensities or behaviors (Fig. 4A) but that reduced tadpole expo-sure to parasites by consuming cercariae (Fig. 3 A and B). Thediversity and diversity-by-density effects seem to be driven pre-dominantly by the relative abundance of the non-IG predatorspecies relative to I. verticalis, an IG predator that had opposingDMIEs and TMIEs on metacercarial infections, which likelyexplains the lack of a significant relationship between I. verticalisdensities and numbers of metacerciae in tadpoles (Fig. 3C),despite its being the most voracious cercarial predator tested.Hence, the overall relationship between predator diversity andparasite transmission was a product of IG predation, non-consumptive predator effects, and sampling (the increasingprobability that species with traits that suppress pests increase aspredator richness increases) rather than niche complementarityeffects (see refs. 28 and 33). Although we did not find evidencefor niche complementarity, it is possible that under naturalconditions with more habitat complexity than in our mesocosmsniche complementarity might be important.
Mathematical Model.Given that the IG predator in our mesocosmexperiment reduced infections less than the non-IG predators,we developed a mathematical model to evaluate whether IGpredators generally caused weaker reductions in disease risk thannon-IG predators. The model was derived from the classic macro-parasite model by Anderson and May (44) and it is similar toa macroparasite–host–predator model examined by Packer et al. (8).
A
1.6
1.7
1.8
1.9
2.0
0 1 2 3
Log 1
0)1
+elopdat/eairacrecate
m(
Odonate richness
1.5
1.6
1.7
1.8
1.9
0 1 2 3Lo
g 10(
tadp
ole
dens
ity +
1)
Odonate richness
0.1
0.2
0.3
0 1 2 3
Prop
or�o
n of
tadp
oles
mov
ing
Odonate richness
B C
Fig. 2. Results of the mesocosm experiment showing effects of larval odonatedensity (0, 6, or 12 individuals; ○, □, and ■, respectively) and diversity (zeroto three species) on (A) metacercarial infections per tadpole, (B) tadpolesurvival (i.e., density), and (C) tadpole activity. Shown are means ±1 SE. Seetext for sample sizes and statistics.
1.6
1.7
1.8
1.9
2.0
0 2 4 6 8 10 12
Pred
icte
d
Number of I. ver�calis
1.6
1.7
1.8
1.9
2.0
0 2 4 6 8 10 12
Pred
icte
d
Number of P. longipennis
1.6
1.7
1.8
1.9
2.0
0 2 4 6 8 10 12
Pred
icte
d lo
g 10(
met
acer
cara
ie/t
adpo
le +
1)
Number of S. semicinctum
A B C
Fig. 3. Relationships between metacercariae per tadpole and the densitiesof two non-IG predators (those that only eat cercariae), (A) S. semicinctumand (B) P. longipennis and (C) an IG-predator (eats cercariae and tadpoles),I. verticalis. Shown are the predicted values from a model with temporalblock and the main effects of each species, the presence-only treatments foreach species, and best-fit lines for significant relationships.
3010 | www.pnas.org/cgi/doi/10.1073/pnas.1415971112 Rohr et al.
The model includes differential equations for populations of in-termediate hosts, focal hosts, infections in focal hosts, and free-living parasites (analogous to the snails, tadpoles, metacercariae intadpoles, and cercariae in our experimental system, respectively),and incorporates top-down effects of a predator guild that canconsume hosts and/or free-living parasites. Although in our ex-perimental system antipredator behaviors (reduced activity) areopposite of antiparasite behaviors (increased activity), this mightnot be the case in other host–parasite systems and thus we con-servatively did not include trait-mediated effects in our model.Predation on the intermediate host had effects qualitatively
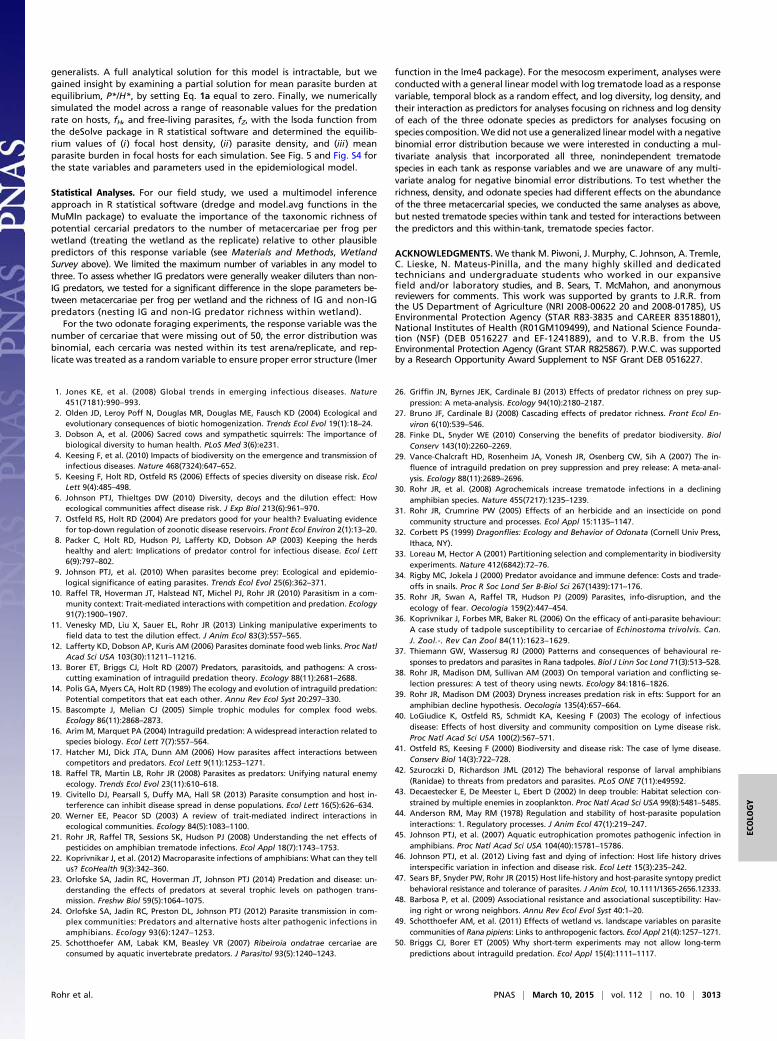
similar to predation on free-living parasites that are releasedfrom these hosts (SI Results and Discussion), and thus we focuson contrasting the effects of predation on free-living parasites(non-IG predator) versus predation on both free-living parasitesand focal hosts (IG predator). Intuitively, the model demon-strated that non-IG predators that only consumed free-livingparasites increased focal host densities, reduced the populationof parasites infecting focal hosts, and reduced mean burdens infocal hosts (Fig. 5 A and B; see also Fig. S4 and SI Results andDiscussion). In contrast, the effect of IG predators was non-linear. If IG predators preferred free-living parasites more thanfocal hosts or preferred infected focal hosts to uninfected focalhosts [i.e., healthy herd effect 7, 8)], they only weakly reducedinfections on focal hosts, but if they strongly preferred focal hostsover free-living parasites, they could increase mean parasite abun-dance per focal host by increasing the per capita exposure rate ofthe surviving hosts (Fig. 5C; see also Fig. S4 and SI Results and
Discussion). Mechanistically, this occurs because predation on ei-ther focal hosts or free-living parasites decreases the total pop-ulation size of adult parasites (P*, Fig. 5B), but predation on hostscauses host density to decrease rapidly (H*, Fig. 5A). If host densitydecreases more rapidly than parasite density, then mean burdenscan increase (P*/H*, Fig. 5C). This amplification effect is furthersupported by a partial solution for mean parasite burden at equi-librium (SI Results and Discussion). Hence, consistent with theexperimental results, the model indicates that non-IG predatorsshould generally reduce macroparasite infections per host moreso than IG predators.
Test of IG Predator Predictions in the Field. Given that our experi-ment and mathematical model suggest that non-IG predatorsshould reduce infections per host more so than IG predators, wereturned to our wetland survey to test this hypothesis in the wild.As predicted, trematode infections in frogs decreased muchmore steeply with the richness of non-IG predators than with therichness of IG predators, which did not differ from zero (Fig. 1C).
ConclusionsOur wetland survey uncovered a negative relationship betweenthe diversity of potential cercarial predators and the total abun-dance of metacercariae in tadpoles. To our knowledge, this is thefirst field study comparing the predictive strength of predators ofparasites to other factors known to affect parasite transmission. Ourfindings indicate that cercarial predators might have a larger in-fluence on metacercarial infections in frogs than the richness andabundance of first and second intermediate hosts, frog immunity,and nutrients associated with elevated snail populations and trem-atode infections (30, 45) (Table S1). Moreover, the influence ofcercarial predators on metacercarial infections in frogs was ofcomparable strength (but in the opposite direction) to thepreviously reported impacts of the herbicide atrazine on suchinfections (Table S1) (30).
R² = 0.583, P=0.035
1.5
1.6
1.7
1.8
1.9
2.0
2.1
0 0.1 0.2 0.3Lo
g 10
(met
acer
caria
e/ta
dpol
e +
1)Propor�on of tadpoles moving in
treatments with I. ver�calis
12,126, 6
4, 12
6, 12
3, 6
2, 6
0, 0
0.0
0.1
0.2
0.3gnivo
mselopdatfo
noitroporPa
b
a,b a
0.0
0.1
0.2
0.3
1.5
1.6
1.7
1.8
1.9
2.0
2.1
0 2 3 4 6 notalone
6 alone 12
Propor�on of tadpoles moving
/eairacrecatem(01goL
)1+elopdat
Number of I. ver�calis
MetacercariaeMoving
CA
B
Fig. 4. Relationships between tadpole activity and metacercarial infectionsin R. clamitans tadpoles. (A) Effects of two non-IG predators (those that onlyeat cercariae), S. semicinctum and P. longipennis, and an IG-predator (eatscercariae and tadpoles), I. verticalis, in monospecific treatments on tadpoleactivity. Points with different letters are significantly different from oneanother (P < 0.05). (B) Tadpole activity and metacercarial loads as a functionof the density of the IG predator I. verticalis, the only odonate species thatsignificantly reduced tadpole activity. (C) Relationship between tadpole ac-tivity in treatments with I. verticalis and metacercarial infections per tadpole.The first number next to each point represents the number of I. verticalis inthat treatment and the second number represents the total number of odo-nate larvae in that treatment. In each panel, means and 1 SE are displayed.
Fig. 5. Epidemiological consequences of simultaneous predation on focalhosts and free-living parasites (correspond with tadpoles and cercariae inour experimental system) at equilibrial values. (A) Increasing predation onfree-living parasites increases the equilibrium density of focal hosts. How-ever, increasing predation on focal hosts strongly reduces their equilibriumdensity. (B) Both types of predation reduce the equilibrial density of parasiticinfections within focal hosts. (C) Predation on free-living parasites causesa monotonic decrease in equilibrial mean burden of infection for individualfocal hosts. In contrast, predation on focal hosts causes a unimodal response.Initially, predation on focal hosts slightly reduces mean burdens. However,as predation on focal hosts increases, equilibrial mean burden rises, even-tually surpassing burdens in the absence of predation. Thus, predatorsof free-living parasites monotonically reduce mean burdens for definitivehosts. However, predators of focal hosts can only weakly reduce meanburden or even amplify infection risk for hosts. Simulation parameters areidentical to those in Fig. S4.
Rohr et al. PNAS | March 10, 2015 | vol. 112 | no. 10 | 3011
ECOLO
GY
Our experiment demonstrated that larval odonate density,diversity, and species composition, IGP, TMIEs, DMIEs, anda sampling effect (sensu ref. 33) all affected the abundance ofmetacercarial infections in anuran larvae. More specifically,under conditions that were most common in the field, increasingodonate richness reduced metacercarial infections in tadpoles,a pattern consistent with what was observed in our field survey.However, in the experiment and in the field, most of the de-crease in infections per host was driven by the non-IG predatorsand our mathematical model suggests that non-IG predatorsshould generally reduce macroparasite infections per host moreso than IG predators.Our findings have many similarities to the generalities that
have emerged from the predator diversity–biocontrol literature.For example, similar to evidence that guilds of predators onaverage control pests better than single predator species (26–28),our findings suggest that entire guilds of predators can alsoregulate infections in hosts. Thus, managing predator assem-blages might be more effective than managing single predatorspecies to control disease (see SI Results and Discussion for exam-ples). Again similar to our results, the predator diversity–biocontrolliterature provides evidence that non-IG predators exhibit strongerbiocontrol than IG predators and that biocontrol can be influencedby nonconsumptive effects of predators (26–29; see SI Results andDiscussion for additional details on similarities). Overall, thesesimilarities suggest that there might be general mechanisms for pestcontrol regardless of whether the pest is a pathogen or consumer;thus, the general conclusions for disease control might match thosefor pest control. Specifically, releasing multiple non-IG predatorswill likely provide better pathogen suppression than releasing asingle control agent (26), but the release of IG predators could de-crease or increase pathogens, and thus the release of the single bestcontrol agent might provide better suppression of pathogen pop-ulations on average than the release of IG predators (29). Regardlessof whether these conclusions hold, it seems clear that biocontrolresearch might inform disease management, and vice versa (18).Finally, whereas we identified a general trait of predators—
where they fall on an IG predation continuum—that predictstheir ability to reduce disease and possibly pests in general, re-cent studies suggest that there might also be general traits of hostspecies that predict their ability to dilute or amplify disease risk(46, 47) and herbivory (48). Consequently, to enhance infectiousdisease management and biocontrol we encourage further workthat searches for traits of host and nonhost species that might beuseful indicators of species that can increase or decrease parasiteand pest populations.
Materials and MethodsWetland Survey. Methods of our wetland survey were reported in Rohr et al.(30) and Schotthoefer et al. (49) and thus we relegated a summary of thesemethods to SI Materials and Methods. The following taxa were consideredpotential predators of cercariae because they either filter-feed or activelyfeed on planktivorous prey of similar size to cercariae, or consume snails thatcan harbor cercariae: the insects Dytiscidae, Hydrophilidae, Chaoboridae,Belostomatidae, Corixidae, Nepidae, Notonectidae, Pleidae, Aeshnidae,Coenagrionidae, Libellulidae, other dragonfly and damselfly families,amphipods, and crayfish. Dytiscidae, Aeshnidae, damselflies, and crayfish wereconsidered IG predators because they also regularly consume tadpoles.
Odonate Foraging Experiments. To quantify the foraging rates of odonatelarvae on cercariae, we exposed Echinostoma trivolvis cercariae to one of fiveodonate predator treatments: a nonpredator control to estimate back-ground mortality of cercariae, one Anax junius larva, one E. simplicicolislarva, one S. semicinctum larva, or one I. verticalis larva (head widths of allodonates ranged from 2.11 to 3.21 mm). Fifty cercariae were transferred toa plastic predation arena (8.5 × 6.5 × 2.3 cm) containing 100 mL of water andan odonate larva. After 1 h we counted the number of cercariae thatremained (see SI Materials and Methods for details).
We conducted a follow-up experiment to test whether interspecificinteractions among the odonate species affected their cercarial foraging
rates. The experiment had the same methods as the previous experimentexcept that there were eight treatments: a nonpredator control, one orthree A. junius larvae, one or three P. longipennis larvae, or one or threeI. verticalis larvae, and an interspecific interaction treatment where therewas one of each of the three odonate species.
Mesocosm Experiment. To examine whether larval odonate density and di-versity influence trematode infections in amphibians, we conducted a 2 × 2 ×2 × 2 experiment in which the first three factors were the presence or ab-sence of three species of odonates and the last factor was one of twoodonate densities, 6 or 12 larvae per replicate. Each treatment was repli-cated two times in each of two temporal blocks (9-d duration each), with theexception of four replicates of the nonpredator control in each block. Theexperiment was conducted in clear rectangular plastic tubs (38 × 25 × 15 cmfilled with 10 L of filtered pond water) each with 10 R. clamitans tadpoles(Gosner stage 25). To expose the tadpoles and odonates to cercariae, rep-licates received a single Planorbella trivolvis snail that was infected with oneof three trematode species: E. trivolvis, Ribeiroia ondatrae, or a species fromfamily Plagiorichiidae. The snails were rotated through the replicates so thattadpoles were exposed to each snail and each trematode species for thesame amount of time, thus homogenizing tadpole exposure to the cercariae.There was no snail mortality during the experiment but some odonate larvaedied and were replaced to maintain consistency in the predator treatments.
Daily scan samples (9:00 AM and 4:00 PM) were used to quantify tadpoleactivity levels (number of tadpoles moving in 10 s). Tadpoles that died duringthe experiment were preserved in 70% ethanol and were not replaced. Atthe end of the experiment, the remaining tadpoles were counted, weighed,killed in 0.05% benzocaine, preserved in 70% ethanol, and cleared andstained to quantify the number of metacercarial infections of each trema-tode species, as described by Rohr et al. (21) (see SI Materials and Methodsfor additional details).
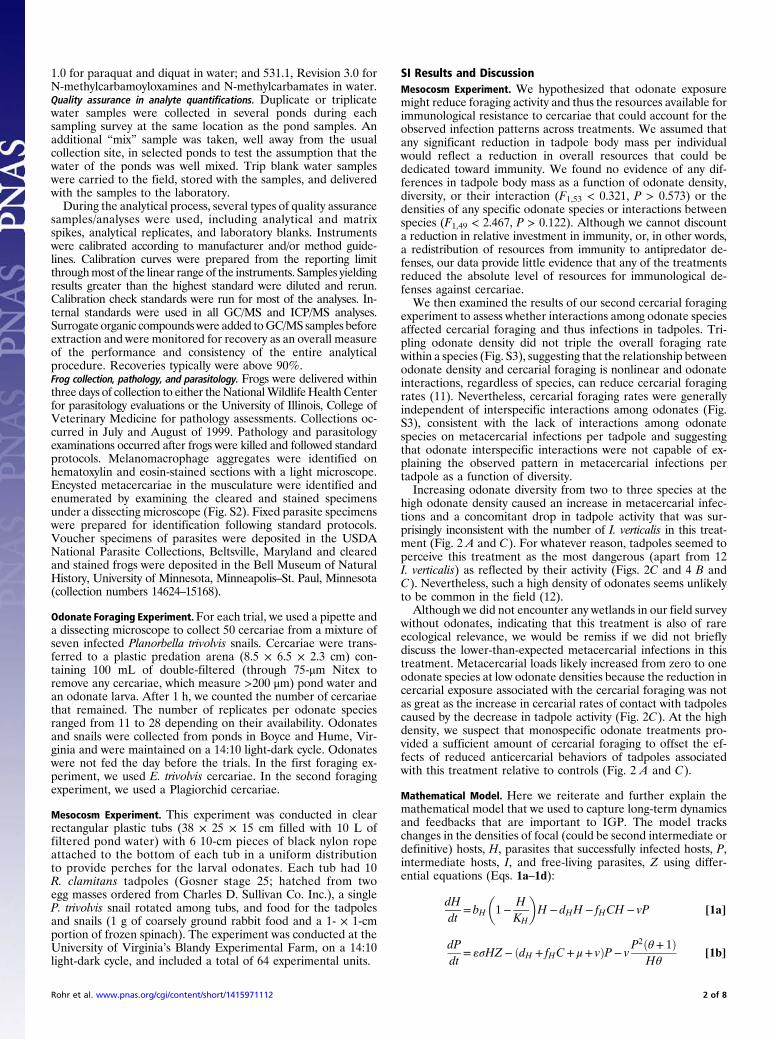
Mathematical Model. To capture long-term dynamics and feedbacks that areimportant to IGP (50), our model used ordinary differential equations totrack changes in the densities of focal (could be second intermediate ordefinitive) hosts, H, parasites that successfully infected hosts, P, intermediatehosts, I, and free-living parasites, Z. (Eqs. 1a–1d):
dHdt
=bH
�1−
HKH
�H−dHH− fHCH− vP [1a]
dPdt
= «σHZ − ðdH + fHC + μ+ vÞP − vP2ðθ+ 1Þ
Hθ[1b]
dIdt
=bI
�1−
IKI
�I−dII− fICI [1c]
dZdt
= γ
�P
P +q
�I− «HZ − fZCZ −dZZ: [1d]
Focal hosts increase through density-dependent births, as determined bya maximum rate, bH, and a host carrying capacity, KH (Eq. 1a). Focal hostsare lost because of background deaths, at mortality rate, dH, predation byconsumers, C, at per capita feeding rate, fH, and from parasitic infection,with virulence on survival, v. Parasitic infections of focal hosts, P, increasewhen hosts become infected by free-living parasites, Z. Following exposure(at per capita exposure rate, «), hosts can become infected according to theirper-parasite susceptibility, σ (0 ≤ σ ≤ 1; Eq. 1b). Parasitic infections decreasewhen hosts die (from background mortality, predation by consumers, orparasite virulence). The final term in Eq. 1b accounts for additional lossesfrom parasite-induced mortality that occur because parasites are aggre-gated in focal hosts, indexed by θ, the aggregation parameter of the negativebinomial distribution. Intermediate hosts also increase through density-dependent births, as determined by a maximum rate, bI, and their carryingcapacity, KI (Eq. 1c). They are also lost from background deaths, at mortalityrate, dI, and predation by consumers, C, at per capita feeding rate, fI. Finally,free-living parasites increase because of release (at per capita rate γ) byinfected intermediate hosts (with infections assumed to be a saturatingfunction of P, governed by the half-saturation constant, q; Eq. 1d). Free-living parasites are then lost following contact with focal hosts, «, predationby consumers, fZ, or from background mortality, dZ.
The model assumes that the intermediate host population produces free-living parasites at a constant per capita rate. Additionally, we chose not todynamically couple the predator guild to host or free-living parasite densitiesbecause most, if not all, of the predators in our focal system are broad
3012 | www.pnas.org/cgi/doi/10.1073/pnas.1415971112 Rohr et al.
generalists. A full analytical solution for this model is intractable, but wegained insight by examining a partial solution for mean parasite burden atequilibrium, P*/H*, by setting Eq. 1a equal to zero. Finally, we numericallysimulated the model across a range of reasonable values for the predationrate on hosts, fH, and free-living parasites, fZ, with the lsoda function fromthe deSolve package in R statistical software and determined the equilib-rium values of (i) focal host density, (ii) parasite density, and (iii) meanparasite burden in focal hosts for each simulation. See Fig. 5 and Fig. S4 forthe state variables and parameters used in the epidemiological model.
Statistical Analyses. For our field study, we used a multimodel inferenceapproach in R statistical software (dredge and model.avg functions in theMuMIn package) to evaluate the importance of the taxonomic richness ofpotential cercarial predators to the number of metacercariae per frog perwetland (treating the wetland as the replicate) relative to other plausiblepredictors of this response variable (see Materials and Methods, WetlandSurvey above). We limited the maximum number of variables in any model tothree. To assess whether IG predators were generally weaker diluters than non-IG predators, we tested for a significant difference in the slope parameters be-tween metacercariae per frog per wetland and the richness of IG and non-IGpredators (nesting IG and non-IG predator richness within wetland).
For the two odonate foraging experiments, the response variable was thenumber of cercariae that were missing out of 50, the error distribution wasbinomial, each cercaria was nested within its test arena/replicate, and rep-licate was treated as a random variable to ensure proper error structure (lmer
function in the lme4 package). For the mesocosm experiment, analyses wereconducted with a general linear model with log trematode load as a responsevariable, temporal block as a random effect, and log diversity, log density, andtheir interaction as predictors for analyses focusing on richness and log densityof each of the three odonate species as predictors for analyses focusing onspecies composition.We did not use a generalized linearmodel with a negativebinomial error distribution because we were interested in conducting a mul-tivariate analysis that incorporated all three, nonindependent trematodespecies in each tank as response variables and we are unaware of any multi-variate analog for negative binomial error distributions. To test whether therichness, density, and odonate species had different effects on the abundanceof the three metacercarial species, we conducted the same analyses as above,but nested trematode species within tank and tested for interactions betweenthe predictors and this within-tank, trematode species factor.
ACKNOWLEDGMENTS.We thankM. Piwoni, J. Murphy, C. Johnson, A. Tremle,C. Lieske, N. Mateus-Pinilla, and the many highly skilled and dedicatedtechnicians and undergraduate students who worked in our expansivefield and/or laboratory studies, and B. Sears, T. McMahon, and anonymousreviewers for comments. This work was supported by grants to J.R.R. fromthe US Department of Agriculture (NRI 2008-00622 20 and 2008-01785), USEnvironmental Protection Agency (STAR R83-3835 and CAREER 83518801),National Institutes of Health (R01GM109499), and National Science Founda-tion (NSF) (DEB 0516227 and EF-1241889), and to V.R.B. from the USEnvironmental Protection Agency (Grant STAR R825867). P.W.C. was supportedby a Research Opportunity Award Supplement to NSF Grant DEB 0516227.
1. Jones KE, et al. (2008) Global trends in emerging infectious diseases. Nature451(7181):990–993.
2. Olden JD, Leroy Poff N, Douglas MR, Douglas ME, Fausch KD (2004) Ecological andevolutionary consequences of biotic homogenization. Trends Ecol Evol 19(1):18–24.
3. Dobson A, et al. (2006) Sacred cows and sympathetic squirrels: The importance ofbiological diversity to human health. PLoS Med 3(6):e231.
4. Keesing F, et al. (2010) Impacts of biodiversity on the emergence and transmission ofinfectious diseases. Nature 468(7324):647–652.
5. Keesing F, Holt RD, Ostfeld RS (2006) Effects of species diversity on disease risk. EcolLett 9(4):485–498.
6. Johnson PTJ, Thieltges DW (2010) Diversity, decoys and the dilution effect: Howecological communities affect disease risk. J Exp Biol 213(6):961–970.
7. Ostfeld RS, Holt RD (2004) Are predators good for your health? Evaluating evidencefor top-down regulation of zoonotic disease reservoirs. Front Ecol Environ 2(1):13–20.
8. Packer C, Holt RD, Hudson PJ, Lafferty KD, Dobson AP (2003) Keeping the herdshealthy and alert: Implications of predator control for infectious disease. Ecol Lett6(9):797–802.
9. Johnson PTJ, et al. (2010) When parasites become prey: Ecological and epidemio-logical significance of eating parasites. Trends Ecol Evol 25(6):362–371.
10. Raffel TR, Hoverman JT, Halstead NT, Michel PJ, Rohr JR (2010) Parasitism in a com-munity context: Trait-mediated interactions with competition and predation. Ecology91(7):1900–1907.
11. Venesky MD, Liu X, Sauer EL, Rohr JR (2013) Linking manipulative experiments tofield data to test the dilution effect. J Anim Ecol 83(3):557–565.
12. Lafferty KD, Dobson AP, Kuris AM (2006) Parasites dominate food web links. Proc NatlAcad Sci USA 103(30):11211–11216.
13. Borer ET, Briggs CJ, Holt RD (2007) Predators, parasitoids, and pathogens: A cross-cutting examination of intraguild predation theory. Ecology 88(11):2681–2688.
14. Polis GA, Myers CA, Holt RD (1989) The ecology and evolution of intraguild predation:Potential competitors that eat each other. Annu Rev Ecol Syst 20:297–330.
15. Bascompte J, Melian CJ (2005) Simple trophic modules for complex food webs.Ecology 86(11):2868–2873.
16. Arim M, Marquet PA (2004) Intraguild predation: A widespread interaction related tospecies biology. Ecol Lett 7(7):557–564.
17. Hatcher MJ, Dick JTA, Dunn AM (2006) How parasites affect interactions betweencompetitors and predators. Ecol Lett 9(11):1253–1271.
18. Raffel TR, Martin LB, Rohr JR (2008) Parasites as predators: Unifying natural enemyecology. Trends Ecol Evol 23(11):610–618.
19. Civitello DJ, Pearsall S, Duffy MA, Hall SR (2013) Parasite consumption and host in-terference can inhibit disease spread in dense populations. Ecol Lett 16(5):626–634.
20. Werner EE, Peacor SD (2003) A review of trait-mediated indirect interactions inecological communities. Ecology 84(5):1083–1100.
21. Rohr JR, Raffel TR, Sessions SK, Hudson PJ (2008) Understanding the net effects ofpesticides on amphibian trematode infections. Ecol Appl 18(7):1743–1753.
22. Koprivnikar J, et al. (2012) Macroparasite infections of amphibians: What can they tellus? EcoHealth 9(3):342–360.
23. Orlofske SA, Jadin RC, Hoverman JT, Johnson PTJ (2014) Predation and disease: un-derstanding the effects of predators at several trophic levels on pathogen trans-mission. Freshw Biol 59(5):1064–1075.
24. Orlofske SA, Jadin RC, Preston DL, Johnson PTJ (2012) Parasite transmission in com-plex communities: Predators and alternative hosts alter pathogenic infections inamphibians. Ecology 93(6):1247–1253.
25. Schotthoefer AM, Labak KM, Beasley VR (2007) Ribeiroia ondatrae cercariae areconsumed by aquatic invertebrate predators. J Parasitol 93(5):1240–1243.
26. Griffin JN, Byrnes JEK, Cardinale BJ (2013) Effects of predator richness on prey sup-pression: A meta-analysis. Ecology 94(10):2180–2187.
27. Bruno JF, Cardinale BJ (2008) Cascading effects of predator richness. Front Ecol En-viron 6(10):539–546.
28. Finke DL, Snyder WE (2010) Conserving the benefits of predator biodiversity. BiolConserv 143(10):2260–2269.
29. Vance-Chalcraft HD, Rosenheim JA, Vonesh JR, Osenberg CW, Sih A (2007) The in-fluence of intraguild predation on prey suppression and prey release: A meta-anal-ysis. Ecology 88(11):2689–2696.
30. Rohr JR, et al. (2008) Agrochemicals increase trematode infections in a decliningamphibian species. Nature 455(7217):1235–1239.
31. Rohr JR, Crumrine PW (2005) Effects of an herbicide and an insecticide on pondcommunity structure and processes. Ecol Appl 15:1135–1147.
32. Corbett PS (1999) Dragonflies: Ecology and Behavior of Odonata (Cornell Univ Press,Ithaca, NY).
33. Loreau M, Hector A (2001) Partitioning selection and complementarity in biodiversityexperiments. Nature 412(6842):72–76.
34. Rigby MC, Jokela J (2000) Predator avoidance and immune defence: Costs and trade-offs in snails. Proc R Soc Lond Ser B-Biol Sci 267(1439):171–176.
35. Rohr JR, Swan A, Raffel TR, Hudson PJ (2009) Parasites, info-disruption, and theecology of fear. Oecologia 159(2):447–454.
36. Koprivnikar J, Forbes MR, Baker RL (2006) On the efficacy of anti-parasite behaviour:A case study of tadpole susceptibility to cercariae of Echinostoma trivolvis. Can.J. Zool.-. Rev Can Zool 84(11):1623–1629.
37. Thiemann GW, Wassersug RJ (2000) Patterns and consequences of behavioural re-sponses to predators and parasites in Rana tadpoles. Biol J Linn Soc Lond 71(3):513–528.
38. Rohr JR, Madison DM, Sullivan AM (2003) On temporal variation and conflicting se-lection pressures: A test of theory using newts. Ecology 84:1816–1826.
39. Rohr JR, Madison DM (2003) Dryness increases predation risk in efts: Support for anamphibian decline hypothesis. Oecologia 135(4):657–664.
40. LoGiudice K, Ostfeld RS, Schmidt KA, Keesing F (2003) The ecology of infectiousdisease: Effects of host diversity and community composition on Lyme disease risk.Proc Natl Acad Sci USA 100(2):567–571.
41. Ostfeld RS, Keesing F (2000) Biodiversity and disease risk: The case of lyme disease.Conserv Biol 14(3):722–728.
42. Szuroczki D, Richardson JML (2012) The behavioral response of larval amphibians(Ranidae) to threats from predators and parasites. PLoS ONE 7(11):e49592.
43. Decaestecker E, De Meester L, Ebert D (2002) In deep trouble: Habitat selection con-strained by multiple enemies in zooplankton. Proc Natl Acad Sci USA 99(8):5481–5485.
44. Anderson RM, May RM (1978) Regulation and stability of host-parasite populationinteractions: 1. Regulatory processes. J Anim Ecol 47(1):219–247.
45. Johnson PTJ, et al. (2007) Aquatic eutrophication promotes pathogenic infection inamphibians. Proc Natl Acad Sci USA 104(40):15781–15786.
46. Johnson PTJ, et al. (2012) Living fast and dying of infection: Host life history drivesinterspecific variation in infection and disease risk. Ecol Lett 15(3):235–242.
47. Sears BF, Snyder PW, Rohr JR (2015) Host life-history and host-parasite syntopy predictbehavioral resistance and tolerance of parasites. J Anim Ecol, 10.1111/1365-2656.12333.
48. Barbosa P, et al. (2009) Associational resistance and associational susceptibility: Hav-ing right or wrong neighbors. Annu Rev Ecol Evol Syst 40:1–20.
49. Schotthoefer AM, et al. (2011) Effects of wetland vs. landscape variables on parasitecommunities of Rana pipiens: Links to anthropogenic factors. Ecol Appl 21(4):1257–1271.
50. Briggs CJ, Borer ET (2005) Why short-term experiments may not allow long-termpredictions about intraguild predation. Ecol Appl 15(4):1111–1117.
Rohr et al. PNAS | March 10, 2015 | vol. 112 | no. 10 | 3013
ECOLO
GY
Supporting InformationRohr et al. 10.1073/pnas.1415971112SI BackgroundTrematode Life Cycle. In our focal trematode–amphibian system,adult trematodes are found in vertebrate definitive hosts, wherethey reproduce sexually. Trematode eggs are released into wa-terbodies in the excrement of the definitive host. Miracidia hatchfrom the eggs and infect snails, the first intermediate host. Thesemiracidia develop into sporocysts. Through asexual reproduction,the sporocysts produce, and the snail sheds free-living trematodecercariae. The cercariae, in turn, swim through the water searchingfor tadpoles, the second intermediate host. Two of the three focalcercariae in our experiment use proteolytic enzymes to encyst asmetacercariae s.c. The last trematode, Echinostoma trivolvis, crawlsup the amphibian cloaca and encysts as metacercariae in the kid-neys. Finally, if an infected tadpole is consumed by a suitable de-finitive host, the life cycle is completed (1).
Taxa That Consume Cercariae. Several taxa are known to consumeseveral species of free-living cercariae. Many of the seminalstudies were conducted on Schistosoma mansoni cercariae, a para-site that infects humans. Rowan (2) and Knight et al. (3) reportedthat the guppy Lebistes reticulatus consume S. mansoni cercariae.Christensen (4) found that Daphnia pulex and Daphnia longispina(Cladocera), Notodromas monacha and Cypria ophthalmica(Ostracoda), and L. reticulatus were predators of S. mansonicercariae. Additionally, experiments conducted by Christensen(4) and Christensen et al. (5) showed that predation of cercariaereduced transmission of S. mansoni to laboratory mice.Kaplan et al. (6) presented six species of native estuarine fishes
with 10 native trematode species. Many of the fishes engorged oncercariae. Moreover, they found evidence that fish also con-sumed cercariae under field conditions.Schotthoefer et al. (7) showed thatHydra spp., damselfly (Odonata,
Coenagrionidae) larvae, dragonfly (Odonata, Libellulidae)larvae, and copepods (Cyclopoida) consumed Ribeiroia ondatraecercariae. Damselfly and dragonfly larvae were particularlyvoracious, in some cases consuming 80–90% of the cercariaeoffered within 10 min. In most cases, the foraging rates of pred-ators on cercariae were not significantly affected by alterna-tive prey.Orlofske et al. (8) revealed that California newt larvae (Taricha
torosa), western mosquitofish (Gambusia affinis), damselfly lar-vae (Enallagma spp. or Lestes spp.), and California clam shrimp(Cyzicus californicus) all depredated R. ondatrae cercariae. More-over, in laboratory experiments, newt larvae and damselfly larvaereduced transmission of cercariae to tadpole hosts. Bioassays in-dicated that these predators consumed cercariae even in the pres-ence of alternative prey.
SI Materials and MethodsWetland Survey.Overview. To quantify the diversity of amphibians and macro-invertebrates we conducted daytime visual time- and area-constrained dip-net sampling, adjusting effort according to thesize of the wetland. Vegetation was quantified by randomlyplacing three 10-m transects within each community type aroundeach wetland, and the line-intercept method was used to recordrelative cover of each plant species under or over the line.Macroinvertebrate and vegetation sampling occurred during threevisits (March–April, May–June, and July–August). Snails wereidentified to species and arthropods were identified to family orbelow. We wanted to avoid destructively sampling macroin-vertebrates and thus obtained presence–absence information for
each snail and arthropod captured and abundance informationfor the dominant snail species, P. trivolvis.On two visits (one in April–May and a second in June–July) we
obtained water samples and attempted to collect a minimum of15 recently metamorphosed Rana pipiens for parasite assess-ments and 25 for pathology studies including immune cellquantification. We quantified nitrate, phosphate, calcium (nec-essary for shell production), and atrazine (herbicide) levels fromthe water samples because each can promote snail populationgrowth (9, 10). Amphibians were necropsied and their macro-parasites were identified and quantified. Additionally, we quantifiedmelanomacrophages from the hematoxylin and eosin-stained andsectioned livers of the amphibians because they are important im-mune cells for fighting trematodes (10).Wetland selection and biotic sampling. Candidate wetlands wereidentified on National Wetland Inventory maps and selected forinclusion in the study following field reconnaissance within theBroadleaf Forest Ecoregion inMinnesota. Final criteria for inclusionin the analyses were (i) classification as a palustrine aquatic bed oremergent wetland, (ii) 0.5–5.0 ha in size, (iii) degree of landscapedisturbance perceived by field assessments, (iv) landowner permis-sion, (v) the presence of R. pipiens, and (vi) intermediate host (snail)abundance. Attempts were also made to include only wetlands thatwere at least 2 km apart to reduce spatial autocorrelation.Analyte sampling and quantification. Water samples were taken justbelow the surface in the deepest area of the wetlands using a polesampler (Nasco Swing Sampler 3228) and an amber glass col-lecting bottle, with care to avoid surface plants and other floatingmatter. Water was then decanted into a series of dedicated bottlesspecifically prepared for groups of analytes, including base neutralorganics, acid herbicides, paraquat/diquat, metals, glyphosate,carbamate insecticides, and inorganic ions. Water for metalsanalysis was stabilized with ultra-grade nitric acid.Water for diquatand paraquat assays was stabilized with reagent-grade sulfuric acid.Finally, water for carbamate analysis was stabilized with mono-chloroacetic acid buffer. The samples were immediately chilled onice and transferred on cold packs to the laboratory every 2 to 3 d.Seven sediment cores were collected from each wetland in
0.6 m of water at approximately equidistant points around thewetland edge using a soil sampler auger (AMS basic soil sampler3106) fitted with a 25- × 5-cm acrylic plastic sleeve. Samples wereimmediately placed and remained on ice to maintain 4 °C. Sam-ples were sent to the analytical laboratory within 3 d of collection.The coring technique allowed us to collect sediment from thesediment–water interface, which is most likely to be actively en-gaged in exchange with the overlying water and in contact withamphibians. For three of the seven cores, the top 15 cm of eachcore was sent to the South Dakota State University Soil AnalysisLaboratory for determination of organic matter content, phos-phorus, and texture. Loss-on-ignition was used to measure organicmatter content. Extractable P was determined using the sodiummethod. The remaining four cores were sent to the Illinois WasteManagement and Research Center (recently renamed the IllinoisSustainable Technology Center) at the University of Illinois forquantification of elements and organic contaminants.The following standard US EPAmethods were used to quantify
analytes with occasional minor modifications: 200.8 for metalsand elements in tissue; 1631 for mercury in digested samples;525.2 for base neutral organic compounds in water; 3545, 3630C,and 3640A for base neutral organic compounds in sediment andtissue; 8151A, 515.1, and 515.2 for acid herbicide compounds inwater and sediment; 547 for glyphosate in water; 549.1, Revision
Rohr et al. www.pnas.org/cgi/content/short/1415971112 1 of 8
1.0 for paraquat and diquat in water; and 531.1, Revision 3.0 forN-methylcarbamoyloxamines and N-methylcarbamates in water.Quality assurance in analyte quantifications. Duplicate or triplicatewater samples were collected in several ponds during eachsampling survey at the same location as the pond samples. Anadditional “mix” sample was taken, well away from the usualcollection site, in selected ponds to test the assumption that thewater of the ponds was well mixed. Trip blank water sampleswere carried to the field, stored with the samples, and deliveredwith the samples to the laboratory.During the analytical process, several types of quality assurance
samples/analyses were used, including analytical and matrixspikes, analytical replicates, and laboratory blanks. Instrumentswere calibrated according to manufacturer and/or method guide-lines. Calibration curves were prepared from the reporting limitthroughmost of the linear range of the instruments. Samples yieldingresults greater than the highest standard were diluted and rerun.Calibration check standards were run for most of the analyses. In-ternal standards were used in all GC/MS and ICP/MS analyses.Surrogate organic compoundswere added toGC/MS samples beforeextraction and were monitored for recovery as an overall measureof the performance and consistency of the entire analyticalprocedure. Recoveries typically were above 90%.Frog collection, pathology, and parasitology. Frogs were delivered withinthree days of collection to either theNationalWildlifeHealth Centerfor parasitology evaluations or the University of Illinois, College ofVeterinary Medicine for pathology assessments. Collections oc-curred in July and August of 1999. Pathology and parasitologyexaminations occurred after frogs were killed and followed standardprotocols. Melanomacrophage aggregates were identified onhematoxylin and eosin-stained sections with a light microscope.Encysted metacercariae in the musculature were identified andenumerated by examining the cleared and stained specimensunder a dissecting microscope (Fig. S2). Fixed parasite specimenswere prepared for identification following standard protocols.Voucher specimens of parasites were deposited in the USDANational Parasite Collections, Beltsville, Maryland and clearedand stained frogs were deposited in the Bell Museum of NaturalHistory, University of Minnesota, Minneapolis–St. Paul, Minnesota(collection numbers 14624–15168).
Odonate Foraging Experiment.For each trial, we used a pipette anda dissecting microscope to collect 50 cercariae from a mixture ofseven infected Planorbella trivolvis snails. Cercariae were trans-ferred to a plastic predation arena (8.5 × 6.5 × 2.3 cm) con-taining 100 mL of double-filtered (through 75-μm Nitex toremove any cercariae, which measure >200 μm) pond water andan odonate larva. After 1 h, we counted the number of cercariaethat remained. The number of replicates per odonate speciesranged from 11 to 28 depending on their availability. Odonatesand snails were collected from ponds in Boyce and Hume, Vir-ginia and were maintained on a 14:10 light-dark cycle. Odonateswere not fed the day before the trials. In the first foraging ex-periment, we used E. trivolvis cercariae. In the second foragingexperiment, we used a Plagiorchid cercariae.
Mesocosm Experiment. This experiment was conducted in clearrectangular plastic tubs (38 × 25 × 15 cm filled with 10 L offiltered pond water) with 6 10-cm pieces of black nylon ropeattached to the bottom of each tub in a uniform distributionto provide perches for the larval odonates. Each tub had 10R. clamitans tadpoles (Gosner stage 25; hatched from twoegg masses ordered from Charles D. Sullivan Co. Inc.), a singleP. trivolvis snail rotated among tubs, and food for the tadpolesand snails (1 g of coarsely ground rabbit food and a 1- × 1-cmportion of frozen spinach). The experiment was conducted at theUniversity of Virginia’s Blandy Experimental Farm, on a 14:10light-dark cycle, and included a total of 64 experimental units.
SI Results and DiscussionMesocosm Experiment. We hypothesized that odonate exposuremight reduce foraging activity and thus the resources available forimmunological resistance to cercariae that could account for theobserved infection patterns across treatments. We assumed thatany significant reduction in tadpole body mass per individualwould reflect a reduction in overall resources that could bededicated toward immunity. We found no evidence of any dif-ferences in tadpole body mass as a function of odonate density,diversity, or their interaction (F1,53 < 0.321, P > 0.573) or thedensities of any specific odonate species or interactions betweenspecies (F1,49 < 2.467, P > 0.122). Although we cannot discounta reduction in relative investment in immunity, or, in other words,a redistribution of resources from immunity to antipredator de-fenses, our data provide little evidence that any of the treatmentsreduced the absolute level of resources for immunological de-fenses against cercariae.We then examined the results of our second cercarial foraging
experiment to assess whether interactions among odonate speciesaffected cercarial foraging and thus infections in tadpoles. Tri-pling odonate density did not triple the overall foraging ratewithin a species (Fig. S3), suggesting that the relationship betweenodonate density and cercarial foraging is nonlinear and odonateinteractions, regardless of species, can reduce cercarial foragingrates (11). Nevertheless, cercarial foraging rates were generallyindependent of interspecific interactions among odonates (Fig.S3), consistent with the lack of interactions among odonatespecies on metacercarial infections per tadpole and suggestingthat odonate interspecific interactions were not capable of ex-plaining the observed pattern in metacercarial infections pertadpole as a function of diversity.Increasing odonate diversity from two to three species at the
high odonate density caused an increase in metacercarial infec-tions and a concomitant drop in tadpole activity that was sur-prisingly inconsistent with the number of I. verticalis in this treat-ment (Fig. 2 A and C). For whatever reason, tadpoles seemed toperceive this treatment as the most dangerous (apart from 12I. verticalis) as reflected by their activity (Figs. 2C and 4 B andC). Nevertheless, such a high density of odonates seems unlikelyto be common in the field (12).Although we did not encounter any wetlands in our field survey
without odonates, indicating that this treatment is also of rareecological relevance, we would be remiss if we did not brieflydiscuss the lower-than-expected metacercarial infections in thistreatment. Metacercarial loads likely increased from zero to oneodonate species at low odonate densities because the reduction incercarial exposure associated with the cercarial foraging was notas great as the increase in cercarial rates of contact with tadpolescaused by the decrease in tadpole activity (Fig. 2C). At the highdensity, we suspect that monospecific odonate treatments pro-vided a sufficient amount of cercarial foraging to offset the ef-fects of reduced anticercarial behaviors of tadpoles associatedwith this treatment relative to controls (Fig. 2 A and C).
Mathematical Model. Here we reiterate and further explain themathematical model that we used to capture long-term dynamicsand feedbacks that are important to IGP. The model trackschanges in the densities of focal (could be second intermediate ordefinitive) hosts, H, parasites that successfully infected hosts, P,intermediate hosts, I, and free-living parasites, Z using differ-ential equations (Eqs. 1a–1d):
dHdt
= bH
�1−
HKH
�H − dHH − fHCH − vP [1a]
dPdt
= «σHZ− ðdH + fHC+ μ+ vÞP− vP2ðθ+ 1Þ
Hθ[1b]
Rohr et al. www.pnas.org/cgi/content/short/1415971112 2 of 8
dIdt
= bI
�1−
IKI
�I − dII − fICI [1c]
dZdt
= γ
�P
P+ q
�I − «HZ− fZCZ− dZZ: [1d]
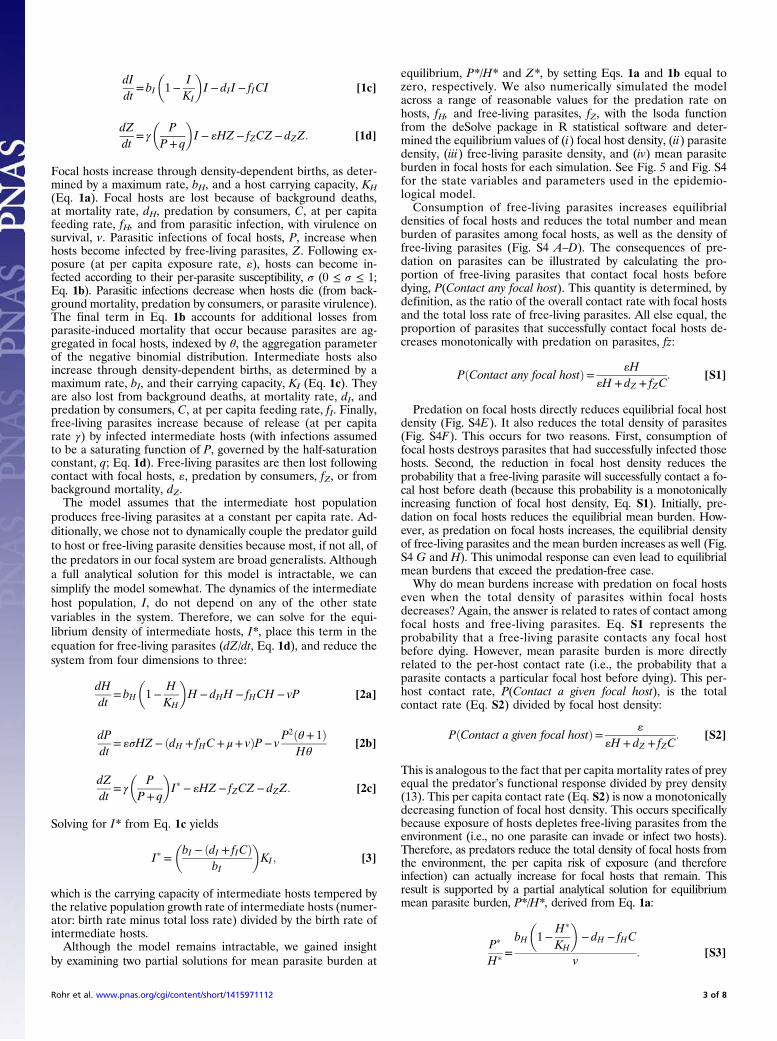
Focal hosts increase through density-dependent births, as deter-mined by a maximum rate, bH, and a host carrying capacity, KH(Eq. 1a). Focal hosts are lost because of background deaths,at mortality rate, dH, predation by consumers, C, at per capitafeeding rate, fH, and from parasitic infection, with virulence onsurvival, v. Parasitic infections of focal hosts, P, increase whenhosts become infected by free-living parasites, Z. Following ex-posure (at per capita exposure rate, «), hosts can become in-fected according to their per-parasite susceptibility, σ (0 ≤ σ ≤ 1;Eq. 1b). Parasitic infections decrease when hosts die (from back-ground mortality, predation by consumers, or parasite virulence).The final term in Eq. 1b accounts for additional losses fromparasite-induced mortality that occur because parasites are ag-gregated in focal hosts, indexed by θ, the aggregation parameterof the negative binomial distribution. Intermediate hosts alsoincrease through density-dependent births, as determined by amaximum rate, bI, and their carrying capacity, KI (Eq. 1c). Theyare also lost from background deaths, at mortality rate, dI, andpredation by consumers, C, at per capita feeding rate, fI. Finally,free-living parasites increase because of release (at per capitarate γ) by infected intermediate hosts (with infections assumedto be a saturating function of P, governed by the half-saturationconstant, q; Eq. 1d). Free-living parasites are then lost followingcontact with focal hosts, «, predation by consumers, fZ, or frombackground mortality, dZ.The model assumes that the intermediate host population
produces free-living parasites at a constant per capita rate. Ad-ditionally, we chose not to dynamically couple the predator guildto host or free-living parasite densities because most, if not all, ofthe predators in our focal system are broad generalists. Althougha full analytical solution for this model is intractable, we cansimplify the model somewhat. The dynamics of the intermediatehost population, I, do not depend on any of the other statevariables in the system. Therefore, we can solve for the equi-librium density of intermediate hosts, I*, place this term in theequation for free-living parasites (dZ/dt, Eq. 1d), and reduce thesystem from four dimensions to three:
dHdt
= bH
�1−
HKH
�H − dHH − fHCH − vP [2a]
dPdt
= «σHZ− ðdH + fHC+ μ+ vÞP− vP2ðθ+ 1Þ
Hθ[2b]
dZdt
= γ
�P
P+ q
�Ip − «HZ− fZCZ− dZZ: [2c]
Solving for I* from Eq. 1c yields
Ip =�bI − ðdI + fICÞ
bI
�KI ; [3]
which is the carrying capacity of intermediate hosts tempered bythe relative population growth rate of intermediate hosts (numer-ator: birth rate minus total loss rate) divided by the birth rate ofintermediate hosts.Although the model remains intractable, we gained insight
by examining two partial solutions for mean parasite burden at
equilibrium, P*/H* and Z*, by setting Eqs. 1a and 1b equal tozero, respectively. We also numerically simulated the modelacross a range of reasonable values for the predation rate onhosts, fH, and free-living parasites, fZ, with the lsoda functionfrom the deSolve package in R statistical software and deter-mined the equilibrium values of (i) focal host density, (ii) parasitedensity, (iii) free-living parasite density, and (iv) mean parasiteburden in focal hosts for each simulation. See Fig. 5 and Fig. S4for the state variables and parameters used in the epidemio-logical model.Consumption of free-living parasites increases equilibrial
densities of focal hosts and reduces the total number and meanburden of parasites among focal hosts, as well as the density offree-living parasites (Fig. S4 A–D). The consequences of pre-dation on parasites can be illustrated by calculating the pro-portion of free-living parasites that contact focal hosts beforedying, P(Contact any focal host). This quantity is determined, bydefinition, as the ratio of the overall contact rate with focal hostsand the total loss rate of free-living parasites. All else equal, theproportion of parasites that successfully contact focal hosts de-creases monotonically with predation on parasites, fz:
PðContact any focal hostÞ= «H«H + dZ + fZC
: [S1]
Predation on focal hosts directly reduces equilibrial focal hostdensity (Fig. S4E). It also reduces the total density of parasites(Fig. S4F). This occurs for two reasons. First, consumption offocal hosts destroys parasites that had successfully infected thosehosts. Second, the reduction in focal host density reduces theprobability that a free-living parasite will successfully contact a fo-cal host before death (because this probability is a monotonicallyincreasing function of focal host density, Eq. S1). Initially, pre-dation on focal hosts reduces the equilibrial mean burden. How-ever, as predation on focal hosts increases, the equilibrial densityof free-living parasites and the mean burden increases as well (Fig.S4 G and H). This unimodal response can even lead to equilibrialmean burdens that exceed the predation-free case.Why do mean burdens increase with predation on focal hosts
even when the total density of parasites within focal hostsdecreases? Again, the answer is related to rates of contact amongfocal hosts and free-living parasites. Eq. S1 represents theprobability that a free-living parasite contacts any focal hostbefore dying. However, mean parasite burden is more directlyrelated to the per-host contact rate (i.e., the probability that aparasite contacts a particular focal host before dying). This per-host contact rate, P(Contact a given focal host), is the totalcontact rate (Eq. S2) divided by focal host density:
PðContact a given focal hostÞ= «
«H + dZ + fZC: [S2]
This is analogous to the fact that per capita mortality rates of preyequal the predator’s functional response divided by prey density(13). This per capita contact rate (Eq. S2) is now a monotonicallydecreasing function of focal host density. This occurs specificallybecause exposure of hosts depletes free-living parasites from theenvironment (i.e., no one parasite can invade or infect two hosts).Therefore, as predators reduce the total density of focal hosts fromthe environment, the per capita risk of exposure (and thereforeinfection) can actually increase for focal hosts that remain. Thisresult is supported by a partial analytical solution for equilibriummean parasite burden, P*/H*, derived from Eq. 1a:
Pp
Hp=bH
�1−
Hp
KH
�− dH − fHC
v: [S3]
Rohr et al. www.pnas.org/cgi/content/short/1415971112 3 of 8
Predation on hosts, fHC (the third term in the numerator ofEq. S3), directly reduces mean burden. However, predation canalso depress equilibrium host density, H*, increasing the densitydependent birth rate of hosts (the first term in the numerator ofEq. S3). If the increase in density-dependent birth rate out-weighs the direct effect of predation, then predation on hostsincreases mean burdens. Thus, predators can increase mean bur-dens by causing greater relative decreases in host density thanparasite density (Fig. 5 and Fig. S4 E–H).In our model, density dependence in the focal host population
facilitates this pattern. Here we chose to represent density de-pendence among hosts with logistic population growth. However,intraspecific density dependence can be nonlinear, and over someranges of population density for some species it can act weakly. Ifdensity dependence only weakly affects the focal host population,then IGP-driven increases in parasitism might not occur asstrongly. Thus, the specific details regarding density dependencemay influence the potential and magnitude of IGP-driven increasesin parasitism across systems.Another effect (involving the density of free-living parasites)
arises in this model that contributes to increasing parasite burdenswith predation. Predation on hosts causes a reduction in the totalnumber of parasites in focal hosts (P*) but simultaneously causesthe density of free-living parasites in the environment (Z*) toincrease (Fig. S4 F and G). Again, we turn to a partial solutionfor Z* using Eq. 1b. First, assuming H is positive, we divide bothsides by H:
1H
dPdt
= «σZ− ðdH + fHC+ μ+ vÞ PH− v�PH
�2ðθ+ 1Þθ
: [S4]
At equilibrium, the right-hand side of this equation is equalto zero:
0= «σZp − ðdH + fHC+ μ+ vÞ Pp
Hp− v�P p
H p
�2ðθ+ 1Þθ
: [S5]
Rearranging this equation for Z* yields this partial solution:
Zp =
ðdH + fHC+ μ+ vÞ P
p
Hp+ v�P p
H p
�2ðθ+ 1Þθ
!,ð«σÞ: [S6]
Here Z* is an increasing function of both predation on hosts(fHC) and mean equilibrial burden (P*/H*). If we assume thatZ* is constant, then as fHC increases, P*/H* would have to de-crease. However, this does not occur; P*/H* increases, andtherefore Z* also increases with predation on hosts (Fig. S4G).This occurs because hosts deplete free-living parasites duringthe transmission process. If there are fewer hosts, then thereis less depletion via transmission. This decreases the total lossrate of free-living parasites from the environment (denomina-tor of Eq. S1), and therefore increases the density of free-living parasites. Thus, despite a lower total density of para-sites in focal hosts, predators can cause an increase in thedensity of free-living parasites in the environment (Fig. 5and Fig. S4 E–H). This provides a testable prediction of thismodel: Predators that disproportionately attack hosts couldsimultaneously boost mean parasite burden and the densityof free-living parasites.Some predator species can consume free-living parasites and
focal hosts (i.e., IG predators). Therefore, we simulated ourmodel across a 2D gradient of predation rates on parasites andfocal hosts. As in the simpler cases above, predators that onlyconsumed free-living parasites reduced disease efficiently. In fact,
for all rates of predation on focal hosts, increasing the predationrate on parasites resulted in higher focal host density, reduced thepopulation of parasites infecting focal hosts, and reduced meanburdens (Fig. 5). Increasing predation on focal hosts always re-duced the total number of parasites successfully infecting focalhosts (Fig. 5B). In contrast, increasing predation rates on hostshad a nonlinear effect on equilibrial mean parasite burden (Fig. 5C),even though increasing predation on hosts always reduced hostdensity (Fig. 5A). This recaptured the pattern from the previoussimulation (Fig. S4 E–H). Initially, increases in predation onfocal hosts reduce mean burden, but further increases in pre-dation minimally reduce mean burdens. High rates of pre-dation on focal hosts can elevate equilibrial mean burdenssubstantially, especially if predation on free-living parasites islow (Fig. 5C, lower right).
Similarities Between Predator Diversity–Biocontrol Literature andResults of This Study. Our findings have many similarities with thegeneralities that have emerged from the predator diversity–bio-control literature, suggesting that our work might inform both dis-ease management and pest control. First, similar to evidence thatguilds of predators on average control pests better than singlepredator species (14–16), our findings suggest that entire guildsof predators can also regulate infections in hosts. Thus, managingpredator assemblages might be more effective than managing singlepredator species to control disease. As an example, schistosomiasis isa debilitating trematode disease of humans in the tropics and man-agement efforts have focused on introducing single fish or crustaceanpredator species to control this disease (17, 18). Our results suggestthat research should compare the value of management that max-imizes the abundance and/or diversity of snail and cercarial predatorsto that of current approaches focused on single predator species.Second, and again similar to our results, the predator diversity–
biocontrol literature provides evidence that IG predation andnonconsumptive effects influence the strength of biocontrol offeredby predator diversity (14–16, 19). In our model, the strength ofpredator control of parasites was not considerably different if thepredator consumed the parasite directly or coincidentally byconsuming infected snails. Likewise, in a meta-analysis, biocontrolof herbivore pests was not reduced when IG predators consumedparasitized herbivores, thereby consuming both the herbivore anddeveloping parasitoid (20). Our model also revealed that IGpredators that strongly prefer free-living parasites over hosts sup-press parasite densities, whereas IG predators that strongly preferhosts over free-living parasites could increase parasite densitiesper host by increasing the per capita exposure rate of the survivinghosts. Similarly, and consistent with IG predation theory (21), ameta-analysis revealed that the addition of non-IG predators gen-erally suppressed pest prey populations, but IG predators, especiallythose that consumed one another, could even increase pests (19).These similarities between the effects of IG predators and
predator diversity on the control of both pathogens and pests suggestthat there may be general mechanisms for pest control regardless ofwhether the pest is a pathogen or consumer. Indeed, our resultssuggest that the general conclusion for disease control might matchthat for pest control. That is, releasingmultiple non-IGpredators willlikely provide better pathogen suppression than releasing a singlecontrol agent (14), but the release of IG predators could decrease orincrease pathogens and thus the release of the single best controlagent might provide better suppression of pathogen populations onaverage than the release of IG predators (19). Regardless ofwhether this conclusion holds, it seems clear that biocontrol re-search might inform disease management, and vice versa (22).
Disclaimer.Although the research described herein has been fundedby several granting agencies, this report has not been subjected totheir review and therefore does not necessarily reflect their pointsof view. Accordingly, no official endorsement should be inferred.
Rohr et al. www.pnas.org/cgi/content/short/1415971112 4 of 8
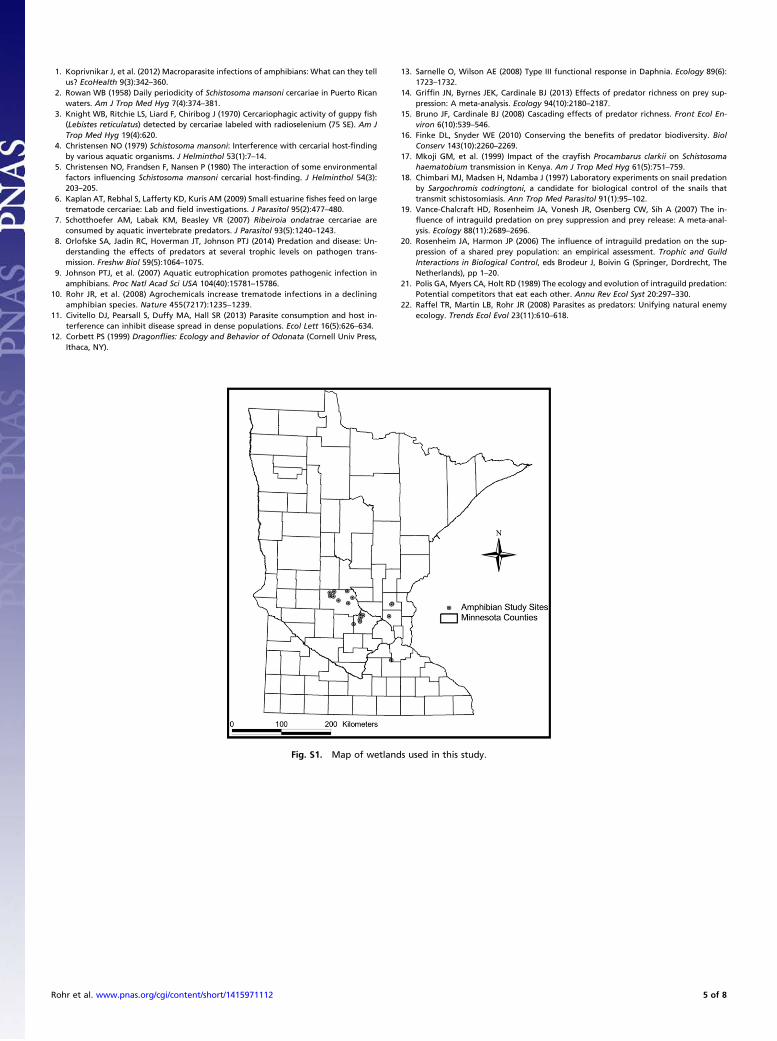
1. Koprivnikar J, et al. (2012) Macroparasite infections of amphibians: What can they tellus? EcoHealth 9(3):342–360.
2. Rowan WB (1958) Daily periodicity of Schistosoma mansoni cercariae in Puerto Ricanwaters. Am J Trop Med Hyg 7(4):374–381.
3. Knight WB, Ritchie LS, Liard F, Chiribog J (1970) Cercariophagic activity of guppy fish(Lebistes reticulatus) detected by cercariae labeled with radioselenium (75 SE). Am JTrop Med Hyg 19(4):620.
4. Christensen NO (1979) Schistosoma mansoni: Interference with cercarial host-findingby various aquatic organisms. J Helminthol 53(1):7–14.
5. Christensen NO, Frandsen F, Nansen P (1980) The interaction of some environmentalfactors influencing Schistosoma mansoni cercarial host-finding. J Helminthol 54(3):203–205.
6. Kaplan AT, Rebhal S, Lafferty KD, Kuris AM (2009) Small estuarine fishes feed on largetrematode cercariae: Lab and field investigations. J Parasitol 95(2):477–480.
7. Schotthoefer AM, Labak KM, Beasley VR (2007) Ribeiroia ondatrae cercariae areconsumed by aquatic invertebrate predators. J Parasitol 93(5):1240–1243.
8. Orlofske SA, Jadin RC, Hoverman JT, Johnson PTJ (2014) Predation and disease: Un-derstanding the effects of predators at several trophic levels on pathogen trans-mission. Freshw Biol 59(5):1064–1075.
9. Johnson PTJ, et al. (2007) Aquatic eutrophication promotes pathogenic infection inamphibians. Proc Natl Acad Sci USA 104(40):15781–15786.
10. Rohr JR, et al. (2008) Agrochemicals increase trematode infections in a decliningamphibian species. Nature 455(7217):1235–1239.
11. Civitello DJ, Pearsall S, Duffy MA, Hall SR (2013) Parasite consumption and host in-terference can inhibit disease spread in dense populations. Ecol Lett 16(5):626–634.
12. Corbett PS (1999) Dragonflies: Ecology and Behavior of Odonata (Cornell Univ Press,Ithaca, NY).
13. Sarnelle O, Wilson AE (2008) Type III functional response in Daphnia. Ecology 89(6):1723–1732.
14. Griffin JN, Byrnes JEK, Cardinale BJ (2013) Effects of predator richness on prey sup-pression: A meta-analysis. Ecology 94(10):2180–2187.
15. Bruno JF, Cardinale BJ (2008) Cascading effects of predator richness. Front Ecol En-viron 6(10):539–546.
16. Finke DL, Snyder WE (2010) Conserving the benefits of predator biodiversity. BiolConserv 143(10):2260–2269.
17. Mkoji GM, et al. (1999) Impact of the crayfish Procambarus clarkii on Schistosomahaematobium transmission in Kenya. Am J Trop Med Hyg 61(5):751–759.
18. Chimbari MJ, Madsen H, Ndamba J (1997) Laboratory experiments on snail predationby Sargochromis codringtoni, a candidate for biological control of the snails thattransmit schistosomiasis. Ann Trop Med Parasitol 91(1):95–102.
19. Vance-Chalcraft HD, Rosenheim JA, Vonesh JR, Osenberg CW, Sih A (2007) The in-fluence of intraguild predation on prey suppression and prey release: A meta-anal-ysis. Ecology 88(11):2689–2696.
20. Rosenheim JA, Harmon JP (2006) The influence of intraguild predation on the sup-pression of a shared prey population: an empirical assessment. Trophic and GuildInteractions in Biological Control, eds Brodeur J, Boivin G (Springer, Dordrecht, TheNetherlands), pp 1–20.
21. Polis GA, Myers CA, Holt RD (1989) The ecology and evolution of intraguild predation:Potential competitors that eat each other. Annu Rev Ecol Syst 20:297–330.
22. Raffel TR, Martin LB, Rohr JR (2008) Parasites as predators: Unifying natural enemyecology. Trends Ecol Evol 23(11):610–618.
Fig. S1. Map of wetlands used in this study.
Rohr et al. www.pnas.org/cgi/content/short/1415971112 5 of 8
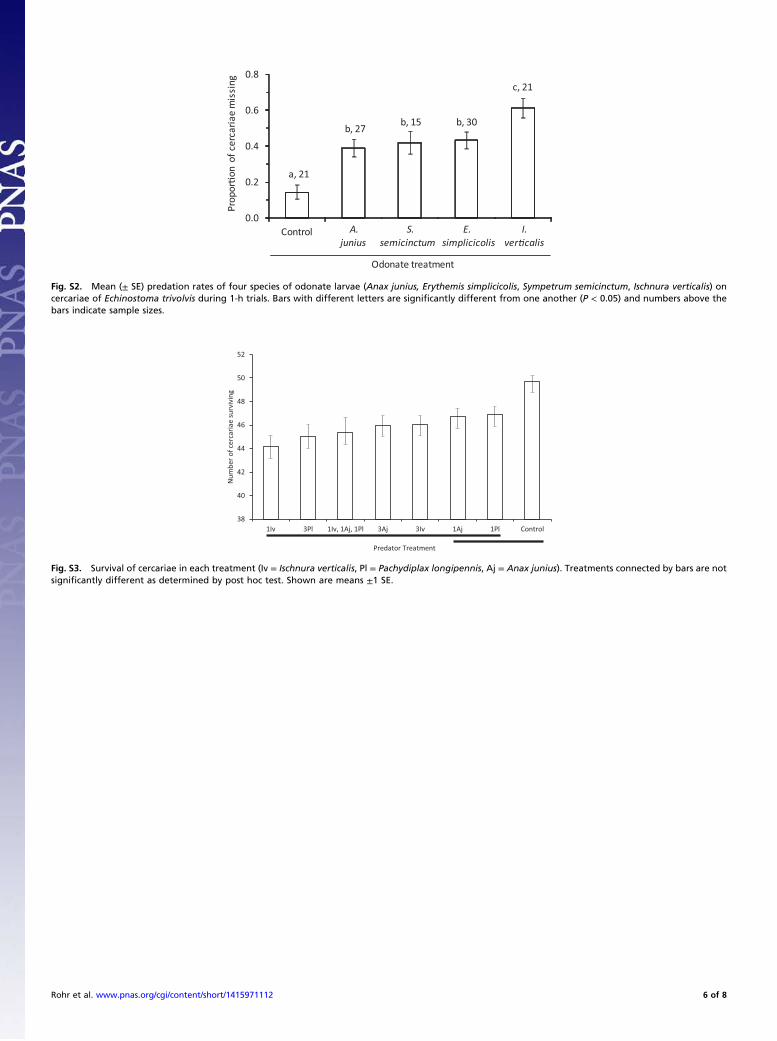
0.0
0.2
0.4
0.6
0.8
Control A. junius
S. semicinctum
E. simplicicolis
I. ver�calis
Prop
or�o
n of
cer
caria
e m
issi
ng
Odonate treatment
a, 21
b, 27 b, 15 b, 30
c, 21
A. S. E. I.junius semicinctum simplicicolis ver�calis
Fig. S2. Mean (± SE) predation rates of four species of odonate larvae (Anax junius, Erythemis simplicicolis, Sympetrum semicinctum, Ischnura verticalis) oncercariae of Echinostoma trivolvis during 1-h trials. Bars with different letters are significantly different from one another (P < 0.05) and numbers above thebars indicate sample sizes.
38
40
42
44
46
48
50
52
1Iv 3Pl 1Iv, 1Aj, 1Pl 3Aj 3Iv 1Aj 1Pl Control
Num
ber o
f cer
caria
e su
rviv
ing
Predator Treatment
Fig. S3. Survival of cercariae in each treatment (Iv = Ischnura verticalis, Pl = Pachydiplax longipennis, Aj = Anax junius). Treatments connected by bars are notsignificantly different as determined by post hoc test. Shown are means ±1 SE.
Rohr et al. www.pnas.org/cgi/content/short/1415971112 6 of 8
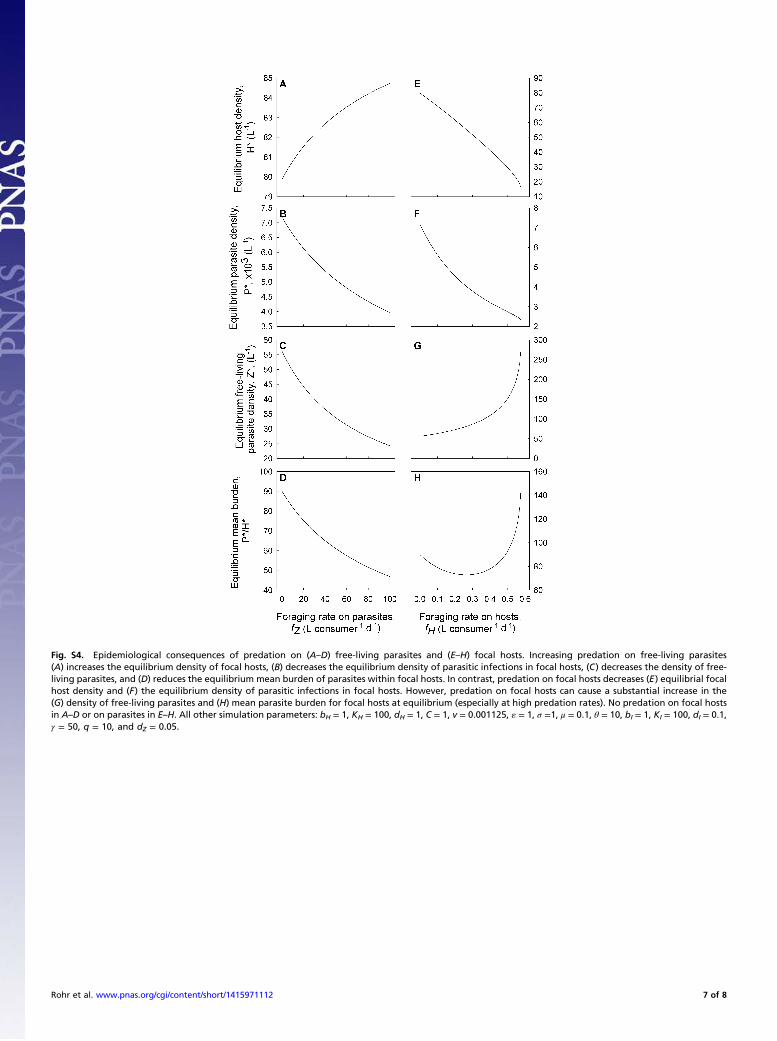
Fig. S4. Epidemiological consequences of predation on (A–D) free-living parasites and (E–H) focal hosts. Increasing predation on free-living parasites(A) increases the equilibrium density of focal hosts, (B) decreases the equilibrium density of parasitic infections in focal hosts, (C) decreases the density of free-living parasites, and (D) reduces the equilibrium mean burden of parasites within focal hosts. In contrast, predation on focal hosts decreases (E) equilibrial focalhost density and (F) the equilibrium density of parasitic infections in focal hosts. However, predation on focal hosts can cause a substantial increase in the(G) density of free-living parasites and (H) mean parasite burden for focal hosts at equilibrium (especially at high predation rates). No predation on focal hostsin A–D or on parasites in E–H. All other simulation parameters: bH = 1, KH = 100, dH = 1, C = 1, v = 0.001125, « = 1, σ =1, μ = 0.1, θ = 10, bI = 1, KI = 100, dI = 0.1,γ = 50, q = 10, and dZ = 0.05.
Rohr et al. www.pnas.org/cgi/content/short/1415971112 7 of 8
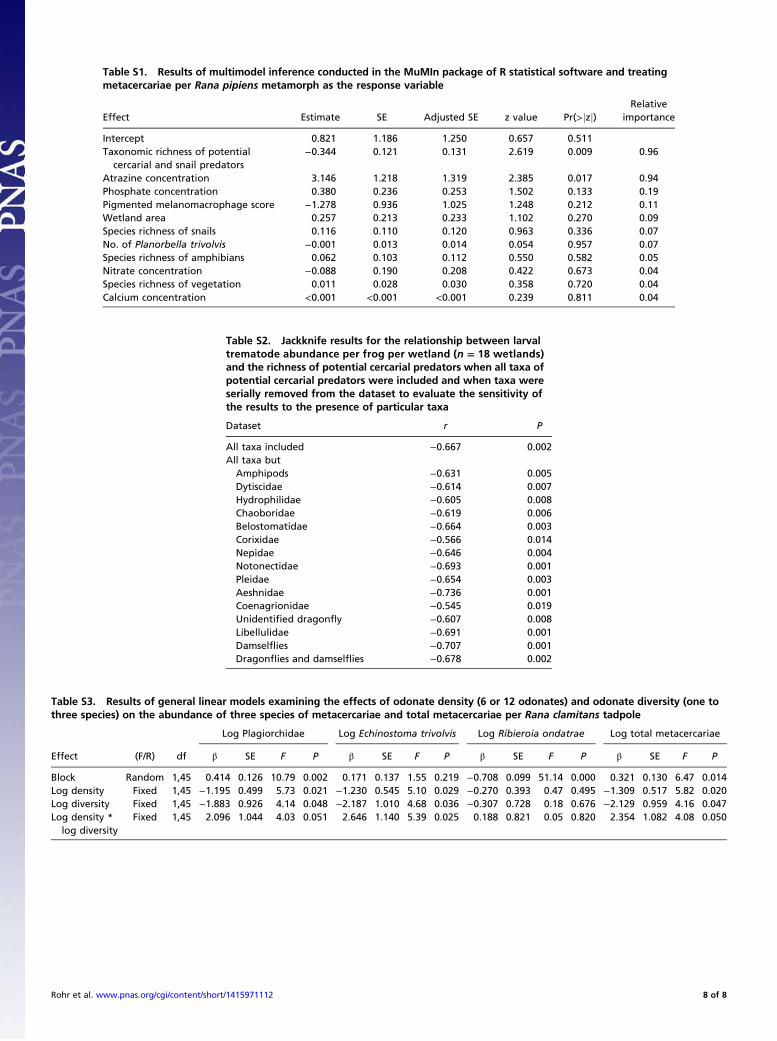
Table S1. Results of multimodel inference conducted in the MuMIn package of R statistical software and treatingmetacercariae per Rana pipiens metamorph as the response variable
Effect Estimate SE Adjusted SE z value Pr(>jzj)Relative
importance
Intercept 0.821 1.186 1.250 0.657 0.511Taxonomic richness of potential
cercarial and snail predators−0.344 0.121 0.131 2.619 0.009 0.96
Atrazine concentration 3.146 1.218 1.319 2.385 0.017 0.94Phosphate concentration 0.380 0.236 0.253 1.502 0.133 0.19Pigmented melanomacrophage score −1.278 0.936 1.025 1.248 0.212 0.11Wetland area 0.257 0.213 0.233 1.102 0.270 0.09Species richness of snails 0.116 0.110 0.120 0.963 0.336 0.07No. of Planorbella trivolvis −0.001 0.013 0.014 0.054 0.957 0.07Species richness of amphibians 0.062 0.103 0.112 0.550 0.582 0.05Nitrate concentration −0.088 0.190 0.208 0.422 0.673 0.04Species richness of vegetation 0.011 0.028 0.030 0.358 0.720 0.04Calcium concentration <0.001 <0.001 <0.001 0.239 0.811 0.04
Table S2. Jackknife results for the relationship between larvaltrematode abundance per frog per wetland (n = 18 wetlands)and the richness of potential cercarial predators when all taxa ofpotential cercarial predators were included and when taxa wereserially removed from the dataset to evaluate the sensitivity ofthe results to the presence of particular taxa
Dataset r P
All taxa included −0.667 0.002All taxa but
Amphipods −0.631 0.005Dytiscidae −0.614 0.007Hydrophilidae −0.605 0.008Chaoboridae −0.619 0.006Belostomatidae −0.664 0.003Corixidae −0.566 0.014Nepidae −0.646 0.004Notonectidae −0.693 0.001Pleidae −0.654 0.003Aeshnidae −0.736 0.001Coenagrionidae −0.545 0.019Unidentified dragonfly −0.607 0.008Libellulidae −0.691 0.001Damselflies −0.707 0.001Dragonflies and damselflies −0.678 0.002
Table S3. Results of general linear models examining the effects of odonate density (6 or 12 odonates) and odonate diversity (one tothree species) on the abundance of three species of metacercariae and total metacercariae per Rana clamitans tadpole
Log Plagiorchidae Log Echinostoma trivolvis Log Ribieroia ondatrae Log total metacercariae
Effect (F/R) df β SE F P β SE F P β SE F P β SE F P
Block Random 1,45 0.414 0.126 10.79 0.002 0.171 0.137 1.55 0.219 −0.708 0.099 51.14 0.000 0.321 0.130 6.47 0.014Log density Fixed 1,45 −1.195 0.499 5.73 0.021 −1.230 0.545 5.10 0.029 −0.270 0.393 0.47 0.495 −1.309 0.517 5.82 0.020Log diversity Fixed 1,45 −1.883 0.926 4.14 0.048 −2.187 1.010 4.68 0.036 −0.307 0.728 0.18 0.676 −2.129 0.959 4.16 0.047Log density *
log diversityFixed 1,45 2.096 1.044 4.03 0.051 2.646 1.140 5.39 0.025 0.188 0.821 0.05 0.820 2.354 1.082 4.08 0.050
Rohr et al. www.pnas.org/cgi/content/short/1415971112 8 of 8