Embed Size (px)
Citation preview

PRECISION ULTRASONIC SPRAY SOLUTIONS
2012 Route 9W Milton, NY USA T(845) 795.2020 F(845) 795.2720 Email: [email protected] Internet: www.sono-tek.com
2012ANNUAL REPORT
ON THE COVER
Sono-Tek sells precision ultrasonic spray systems into 5 main market segments, or niches:
1 Advanced electronics manufacturing (printed circuit board & semiconductor)
2 Alternative energy manufacturing
3 Medical device manufacturing
4 Glass manufacturing (including eyeglass lens coatings and wide area float glass)
5 Textiles / food coating applications (industrial coatings)
Depicted above is an oversized semi-custom robotic motion controlled coating system, from our FlexiCoat line of precision ultrasonic spray systems.
Cover detail: Our new Cobalt Series ultrasonic nozzles are fabricated with proprietary chemically resistant materials for spraying corrosive acid solutions containing metal oxide nanoparticles in manufacturing touch screens and thin film solar cells.

1SONO•TEK Corporation 2012 ANNUAL REPORT
Table of Contents
2012 CORPORATE HIGHLIGHTS
BUSINESS FOCUS .................................................... IFC
CORPORATE HIGHLIGHTS ...........................................1
FINANCIAL HIGHLIGHTS .......................................... 2-3
CHAIRMAN’S MESSAGE .......................................... 4-7
MANAGEMENT’S DISCUSSION ............................. 8-12
INDEPENDENT AUDITOR’S REPORT ..........................13
CONSOLIDATED FINANCIAL STATEMENTS ........ 14-28
COMMON STOCK ......................................................28
CORPORATE DIRECTORY. .........................................29
• Continuedstronggrowth,up22%thisyearto$12Minsales• Recordnetincome,morethandoubleoverlastyear• Strongcashgenerationandcashbalance• Significantgrowthinsolarenergycoatingapplications• Continuedsuccessandgrowthinimplantablemedicaldevicecoatingsales• Expansionofglasslinecoatingtonewmanufacturersandnewapplications• Inroadsintotransparentconductiveoxidecoatings,textilefinishing,andfoodmarketsthatpromisetogrowintonewsegments
Sono-Tek’s sales continued a strong growth trend this past fiscal year ending February 29, 2012, with record increases in sales and income once again. Our sales grew by 22% to $12M, and our income grew from $600k to over $1.4M, or $.10 per share ($.09 diluted). We achieved this success despite economic problems in the US and Europe, due primarily to our global diversification and market diversification program. We had breakthroughs in thin film solar energy applications, as well as in the emerging transparent conductive coatings markets, used in touchscreens and other devices. We expanded our protective glass coating applications to new manufacturers and to functional coatings such as anti-reflection and photoresist applications. In the medical device market, we have taken our strong customer and knowledge base in coating implantable cardiovascular stents, and we developed new equipment to coat the drug coated balloons and catheters that will be used in conjunction with drug eluting stents. Most importantly, we have created several new products for future sales.
News, Press Releases, and Recent Publishings
Excerpt from May 16, 2012 press release - Dr. Christopher L. Coccio, Chairman and CEO stated, “We are very pleased that we have been able to continue combining growth with increasing profit performance both this year, as well as over the past several years. This year’s results set new records for the Company’s sales and income, and creates a favorable financial platform for investments in continued growth. So far, our business improvement has been achieved solely by organic growth. While we continue to pursue growth as we penetrate new high tech markets such as thin film solar applications, transparent conductive oxide coatings, and broader medical implant coatings applications, we find ourselves now in a better position to consider enhanced rates of growth, and other strategic opportunities. In this regard, we have hired Morgan Joseph TriArtisan as an advisor to assist us in this activity.
Excerpt from editorial in Asian Solar Magazine, April/May 2012 issue, written by Stephen Harshbarger: “Ultrasonic atomization wet process is one alternative that places companies a step closer to a cost effective solution for bringing novel technologies to market, making production cost less of an obstacle...”
Excerpt from Maximizing the Use of Platinum Catalyst by Ultrasonic Spray Application, a technical article in ASME’s Journal of Fuel Cell Science and Technology, published February 2012, written by Robb Engle: “The density of the platinum-containing carbon web is key to ensuring the flow of gas through to the proton exchange membrane. Where more carbon molecules are coarsely pressed together, more resistance to the flow of gas will exist. And to the extent that the density varies throughout the coating, the electrical characteristics of the cell will be inconsistent... It is most ideal to ensure the density of the “web” created during the coating process is uniform.”
2
2012 FINANCIAL HIGHLIGHTS
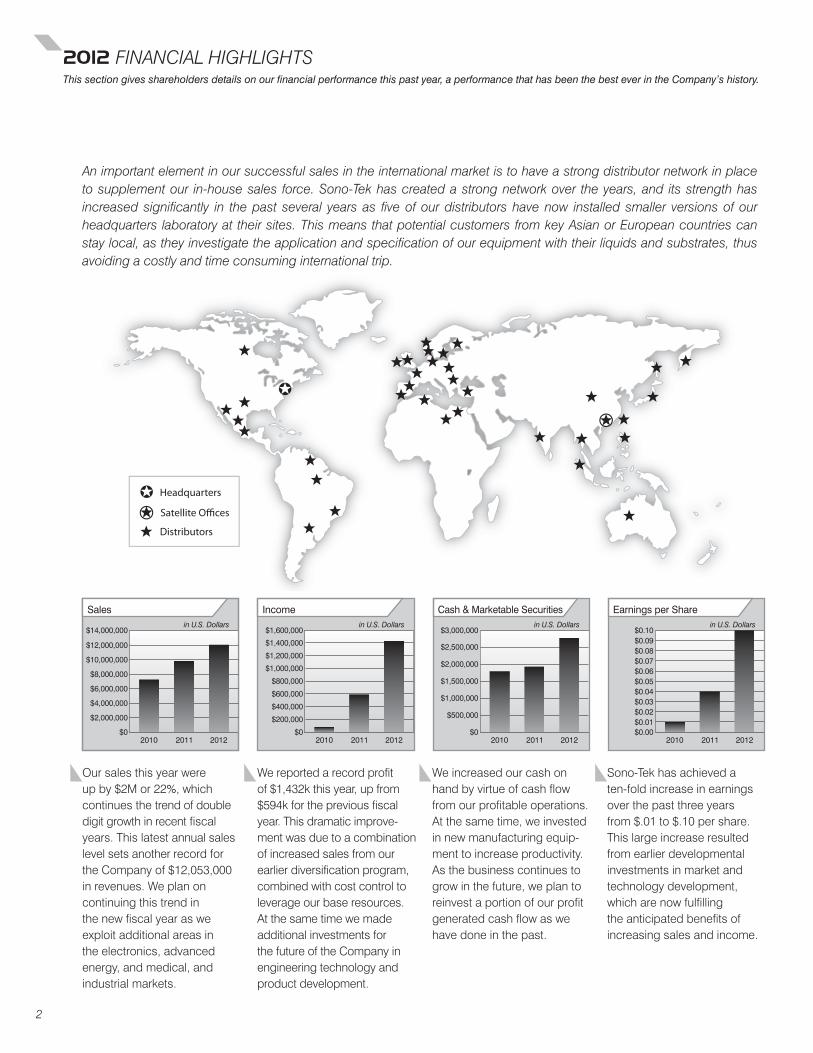
An important element in our successful sales in the international market is to have a strong distributor network in place to supplement our in-house sales force. Sono-Tek has created a strong network over the years, and its strength has increased significantly in the past several years as five of our distributors have now installed smaller versions of our headquarters laboratory at their sites. This means that potential customers from key Asian or European countries can stay local, as they investigate the application and specification of our equipment with their liquids and substrates, thus avoiding a costly and time consuming international trip.
Oursalesthisyearwereupby$2Mor22%,whichcontinuesthetrendofdoubledigitgrowthinrecentfiscalyears.ThislatestannualsaleslevelsetsanotherrecordfortheCompanyof$12,053,000inrevenues.Weplanoncontinuingthistrendinthenewfiscalyearasweexploitadditionalareasintheelectronics,advancedenergy,andmedical,andindustrialmarkets.
Wereportedarecordprofitof$1,432kthisyear,upfrom$594kforthepreviousfiscalyear.Thisdramaticimprove-mentwasduetoacombinationofincreasedsalesfromourearlierdiversificationprogram,combinedwithcostcontroltoleverageourbaseresources.AtthesametimewemadeadditionalinvestmentsforthefutureoftheCompanyinengineeringtechnologyandproductdevelopment.
Weincreasedourcashonhandbyvirtueofcashflowfromourprofitableoperations.Atthesametime,weinvestedinnewmanufacturingequip-menttoincreaseproductivity.Asthebusinesscontinuestogrowinthefuture,weplantoreinvestaportionofourprofitgeneratedcashflowaswehavedoneinthepast.
Sono-Tekhasachievedaten-foldincreaseinearningsoverthepastthreeyearsfrom$.01to$.10pershare.Thislargeincreaseresultedfromearlierdevelopmentalinvestmentsinmarketandtechnologydevelopment,whicharenowfulfillingtheanticipatedbenefitsofincreasingsalesandincome.
This section gives shareholders details on our financial performance this past year, a performance that has been the best ever in the Company’s history.
2010 2011 2012
$14,000,000
$12,000,000
$10,000,000
$8,000,000
$6,000,000
$4,000,000
$2,000,000
Sales
2010 2011 2012
$1,600,000
$1,400,000
$1,200,000
$1,000,000
$800,000
$600,000
$400,000
$200,000
$0$0
Income
2010 2011 2012
$3,000,000
$2,500,000
$2,000,000
$1,500,000
$1,000,000
$500,000
$0
Cash & Marketable Securities
2010 2011 2012
$0.10$0.09$0.08$0.07$0.06$0.05$0.04$0.03$0.02$0.01$0.00
Earnings per Sharein U.S. Dollarsin U.S. Dollarsin U.S. Dollarsin U.S. Dollars

3SONO•TEK Corporation 2012 ANNUAL REPORT
ASIA 40%
US & CANADA 36%
EUROPE 16%
LATIN AMERICA 8%
FINANCIAL HIGHLIGHTS
We track our sales in several different ways, as shown in the following pie charts. We have three significant sales territories at present, with 36% originating in the US and Canada, 40% originating in Asia, and 16% originating in Europe. This provides us with a highly diversified profile that affords us both stability and growth. Only 8% of our sales comes from Latin America at present, which may provide a fourth territory in the future as we focus more attention there in the coming year.
We also track sales by “type”, or as a function of the type of product that is involved. The largest slice at 57% comes from our standard products such as SonoFlux, MediCoat, WideTrack, ExactaCoat, and FlexiCoat, and a high fraction of these sales can be considered as recurring, in that customers come back to purchase additional units from us for either replacement of used equipment or expansion of their production lines later on. The next largest slice at 29% comes from engineered products, which involve semi-custom modifications of existing products to suit a new customer need. The objective here is to be selective and respond primarily to those situations that we expect to satisfy other customers too, once the new product variation has been demonstrated successfully. The last slice is our parts and service business at 14%, which is also a recurring revenue source as parts need replacement or refurbish-ment in our existing customer fleet.
Finally, We track our sales by the five market segments that we are currently serving. The advanced energy segment slice is 28%, and it represents our sales to silicon and thin film solar energy, and fuel cell applications. The electronics slice is 31%, and it involves our fluxing equipment, solder recovery equipment, specialty coatings such as OLED and transparent conductive oxides, and applications in the semiconductor field for MEMs and wafer texturing. The next slice is 23%, and it represents our sales to the medical device industry, which includes cardiac and other stents, anti-microbial bandages, drug coated balloons and catheters, and other coated medical equipment. The next slice represents our sales to glass manufacturers for both protective and functional glass coatings at 7%. This segment is expanding as we move beyond glass manufacturers to companies providing anti-scratch, anti-reflective, and other coatings for eyewear and other lenses. The last slice is 11%, and it includes sales to the textile and food industries, both of which have been under development and both of which show promise as emerging markets segments in their own right. These industries involve the applica-tion of anti-microbials or other functional coatings with our WideTrack systems, displacing conventional spraying and coating technology used in these industries.
Sales by Product Type FY 2012 Sales by Market Segment FY 2012
Sales by Territory FY 2012
14%
29%
57%
PARTS & SERVICE
ENGINEERED PRODUCTS
STANDARD PRODUCTS
7% 23%
31%
MEDICAL DEVICES
ELECTRONICS
ADVANCED ENERGY
11%
28%
GLASSINDUSTRIAL,TEXTILES & FOOD

4
5
Sono-Tek has continued to provide solutions to difficult coating applications, where customers have struggled to find a way to spray their chemistry onto substrates in uniform thin film targeted layers. In many cases we are the only viable choice for these challenging applications. We are offering more than a spraying and coating technology. We provide customers a way to deposit materials onto a variety of surfaces, so as to minimize the use of expensive chemicals, while enhancing the functional capabilities of the coatings. We see a continuing growth of our business in the next year as we become established as the solution of choice in the markets we are serving.
Our business approach is a straightforward one: We have one core technology of ultrasonic atomization for precision spraying and coating applications. We have two strategic business units applying our core technology to two broad markets: one for electronics and advanced energy applications, and the other for ultrasonic coating solutions in the medical, glass, textile, and food industries. We have three major geographical markets: North America, Europe, and Asia, which provides our Company balance and stability as global economic conditions change. We have four core product lines: printed circuit board fluxers (SonoFlux), robotic motion controlled coating systems (ExactaCoat and FlexiCoat), implantable and other medical device coating systems (MediCoat series), and our multi-nozzle, variable width WideTrack coating line. We recently added our HyperSonic high speed reciprocating coater to this line up, and we expect it to achieve core status in the next year or two as well. We currently serve five market niches: electronics, including semiconductor and specialty coatings, advanced energy applications for solar energy and fuel cells, medical device coating applications, glass coating applications, and developing industrial markets of textile finishing and food coatings.
CHAIRMAN’S MESSAGE
321
The following pages give shareholders more details on our technology, our product lines, and the Company’s philosophy for the coming years.
5SONO•TEK Corporation 2012 ANNUAL REPORT
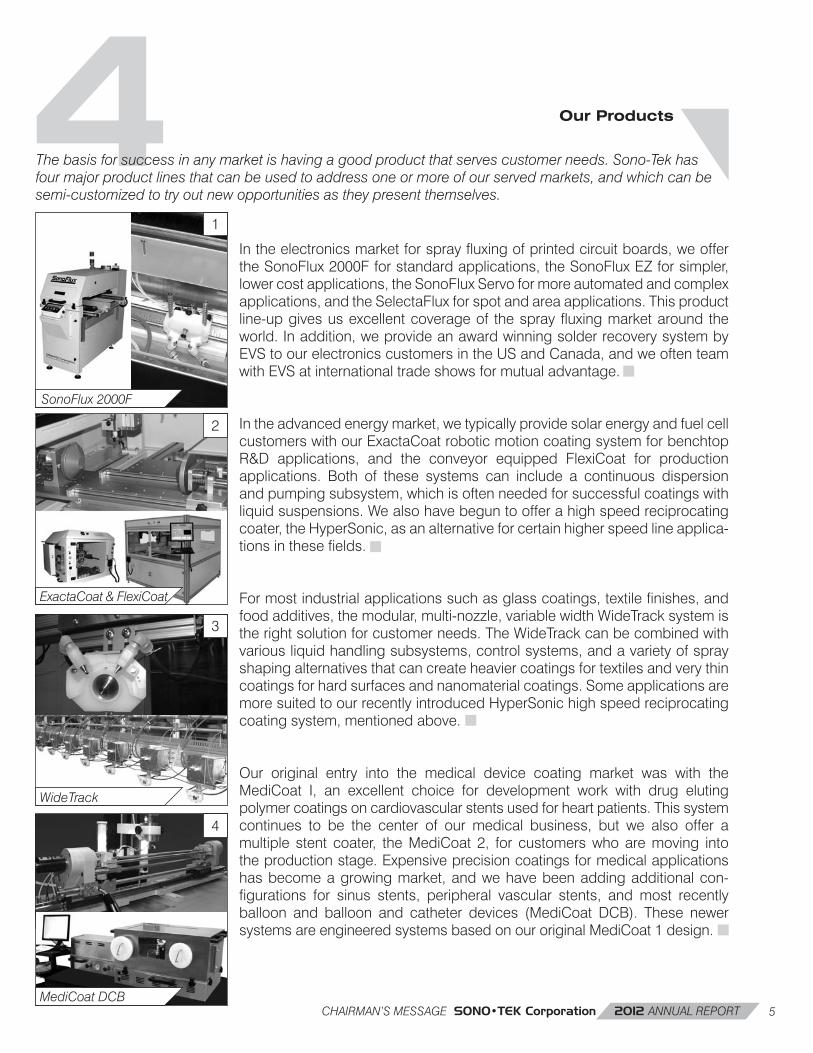
4The basis for success in any market is having a good product that serves customer needs. Sono-Tek has four major product lines that can be used to address one or more of our served markets, and which can be semi-customized to try out new opportunities as they present themselves.
Intheelectronicsmarketforsprayfluxingofprintedcircuitboards,weoffertheSonoFlux2000Fforstandardapplications,theSonoFluxEZforsimpler,lowercostapplications,theSonoFluxServoformoreautomatedandcomplexapplications,andtheSelectaFluxforspotandareaapplications.Thisproductline-upgivesusexcellentcoverageof thespray fluxingmarketaround theworld.Inaddition,weprovideanawardwinningsolderrecoverysystembyEVStoourelectronicscustomersintheUSandCanada,andweoftenteamwithEVSatinternationaltradeshowsformutualadvantage.
Intheadvancedenergymarket,wetypicallyprovidesolarenergyandfuelcellcustomerswithourExactaCoatroboticmotioncoatingsystemforbenchtopR&D applications, and the conveyor equipped FlexiCoat for productionapplications. Both of these systems can include a continuous dispersionandpumpingsubsystem,whichisoftenneededforsuccessfulcoatingswithliquidsuspensions.Wealsohavebeguntoofferahighspeedreciprocatingcoater,theHyperSonic,asanalternativeforcertainhigherspeedlineapplica-tionsinthesefields.
Formostindustrialapplicationssuchasglasscoatings,textilefinishes,andfoodadditives,themodular,multi-nozzle,variablewidthWideTracksystemistherightsolutionforcustomerneeds.TheWideTrackcanbecombinedwithvariousliquidhandlingsubsystems,controlsystems,andavarietyofsprayshapingalternativesthatcancreateheaviercoatingsfortextilesandverythincoatingsforhardsurfacesandnanomaterialcoatings.SomeapplicationsaremoresuitedtoourrecentlyintroducedHyperSonichighspeedreciprocatingcoatingsystem,mentionedabove.
Our original entry into the medical device coating market was with theMediCoat I, an excellent choice for development work with drug elutingpolymercoatingsoncardiovascularstentsusedforheartpatients.Thissystemcontinues to be the center of our medical business, but we also offer amultiple stent coater, theMediCoat 2, for customerswho aremoving intotheproductionstage.Expensiveprecisioncoatingsformedicalapplicationshasbecomeagrowingmarket,andwehavebeenaddingadditionalcon-figurations for sinus stents, peripheral vascular stents, and most recentlyballoon and balloon and catheter devices (MediCoat DCB). These newersystemsareengineeredsystemsbasedonouroriginalMediCoat1design.
Our Products
CHAIRMAN’S MESSAGE
CHAIRMAN’S MESSAGE
ExactaCoat & FlexiCoat
1
2
3
4
3
WideTrack
SonoFlux 2000F
MediCoat DCB

6
Muchoftheprogressthatwehavemadeinthepastyearandbeforecanbedirectlyrelatedtoourprogressin developing improvements on, and additions to, our core ultrasonic atomization technology. For ournozzles,wehavemadesignificantstridesinmarryingourtitaniumnozzleswithnewandproprietarycoatingtechnology.Thishasallowedustoenterattractivemarketssprayingandcoatinghighlyaggressiveliquidsindevelopingsolarenergyandtouchscreenapplications.
Spray shaping the atomized liquids is another important area that has allowed us to marry customerapplication requirementswith the shape of the droplet pattern leaving the nozzles. Herewe have bothproprietaryandpatentedapproachestocreatingcoatingpatternsfordifferentneeds,whetheritisforafinebeam,aconicalorvortexingpattern,awideellipseforarectangularpattern,oramoreconcentratedstreamofdropletsneededforporousorfabricsubstrates.
Fluidhandling isalsoakey input toprecisionsprayingandcoating,andsignificantworkhasgone intodeveloping a continuous pumping system that can keep suspensions in a uniform state prior to beingatomized—akeycompetitiveadvantageinmanyfuelcellandsolarcellapplications.
Wehaverecentlycompleteddevelopmentofanadvanceddigitalstateoftheartbroadbandgeneratorforournozzles.ThenewEchogeneratoriscapableofprovidinggreateratomizationoutputwithlessenergyinput,whilealsoofferingtheabilitytoeasilycreatenewcontrolscenarioswithsoftwarechanges,insteadofcostlyandtimeconsuminghardwarechanges.Itpromisestoopendoorstonewapplications.
Thecombinationoftheabovetechnologydevelopmentscombinedwithnewsystemstargetedforspecificextensionsofourmarketshasbeenresponsibleforthegrowththatwehaveenjoyedinrecentyears,andwillremainafocusofourresourceallocationsinthecomingyears.
CHAIRMAN’S MESSAGE continued
Our Technology

7SONO•TEK Corporation 2012 ANNUAL REPORT
Looking Ahead
Sono-Tek is at an interesting point in its development, by virtue of demonstrating that it has a viable business model capable of extended organic growth, even in difficult economic times. The key to this successful multi-year growth has been and will continue to be our core technology, the ultrasonic atomization nozzle, and various application specific coating systems built around one or more of these nozzles. We at Sono-Tek believe that our precision coating technology would gradually displace less accurate and wasteful forms of coating substrates, particularly when the liquids involved are expensive, and where there are high demands for a precise and repeatable process.
Our success in the electronics, medical, solar energy, fuel cell, and glass coating markets has come because these applications are generally difficult ones, requiring a coating technology that can meet customer demands better than alternative technologies. Each of these markets presents the opportunity to sell replacement and add-on equipment to existing customers, to extend to new customers with demonstrated success, and to seek parallel opportunities that can use the same or slightly modified equipment. In addition, we continue to interact with customers in laboratory and demonstration trials in new areas of application that could add to our portfolio.
Our speed of developing new applications and customers is limited only by our size, resources, and global reach. We intend to continue to add to our resources and global sales network for organic growth, but at the same time we have begun to examine strategic alternatives that could accelerate the growth of our business in the next several years. Whatever the path forward, we are confident that our unique technology and strong team of employees will deliver unusual growth in the years ahead. Sincerely,
Christopher L. Coccio, PhD Chairman and CEOJuly 10, 2012
CHAIRMAN’S MESSAGE
CHAIRMAN’S MESSAGE continued
Officers and Management Team (left to right): Ed Bozydaj, Robb Engle, Luis Abarca, Christopher Coccio, Joseph Riemer, Steve Harshbarger, Stephen Bagley

8
Forward-Looking Statements
Wediscussexpectationsregardingourfutureperformance,suchasourbusinessoutlook,inourannualandquarterlyreports,pressreleases,andotherwrittenandoralstatements.These“forward-lookingstatements”arebasedoncurrentlyavailablecompetitive,financialandeconomicdataandouroperatingplans.Theyareinherentlyuncertain,andinvestorsmustrecognizethateventscouldturnouttobesignificantlydifferentfromourexpectations.Thesefactorsinclude,amongotherconsiderations,generaleconomicandbusinessconditions;political,regulatory,competitiveandtechnologicaldevelopmentsaffectingouroperationsorthedemandforourproducts;timelydevelopmentandmarketacceptanceofnewproducts;adequacyoffinancing;capacityadditions,theabilitytoenforcepatentsandtheabilitytoachieveincreasedsalesvolumeandcontinuedprofitability.
Weundertakenoobligationtoupdateanyforward-lookingstatement.
Overview
Wehavedevelopedauniqueandproprietaryseriesofultrasonicatomizingnozzles,whicharebeingusedinanincreasingvarietyofelectronics,advancedenergy(solarandfuelcells),medicaldevice,glass,textilesandfoodapplications.Thesenozzlesareelectricallydrivenandcreateafine,uniform,lowvelocitysprayofatomizedliquidparticles,incontrasttocommonpressurenozzles.Thesecharacteristicscreateaseriesofcommercialapplicationsthatbenefitfromtheprecise,uniform,thincoatingsthatcanbeachieved.Whencombinedwithsignificantreductionsinliquidwasteandlessoverspraythancanbeachievedwithordinarypressurenozzlesystems,thereislowerenvironmentalimpactandlowerenergyuse.
Market Diversity
Duringthepastfouryearswehaveinvestedsignificanttime,moniesandeffortstoenhanceourmarketdiversity.Basedonourcoreultrasoniccoatingtechnology,weincreasedourportfolioofproducts,theindustriesweserveandthecountriesinwhichweoperate.
Todayweservesixmajorindustries:electronics,advancedenergy(solarandfuelcells),medicaldevice,glass,textilesandfood.
MostofoursalesnoworiginateoutsidetheUnitedStates,andwearegeographicallypresentdirectlyandthroughdistributorsandtraderepresentativesinNorthandLatinAmerica,EuropeandAsia.Theinfrastructureuponwhichthisdiversifiedmarketapproachisbased,includesanewlyequippedprocessdevelopmentlaboratory,astrengthenedsalesorganizationwithapplicationengineers,anengineeringteamwithadditionaltalentandthelatest,mostsophisticateddesignsoftwaretools,aswellasanexpanded,highlytrainedinstallationandserviceorganization.
Thenewproductswhichwereintroduced,thenewmarketsthatwerepenetrated,andtheregionsinwhichwenowoperate,areastrongfoundationforourfuturesalesgrowthandenhancedprofitability.
MANAGEMENT’S DISCUSSION AND ANALYSIS OF FINANCIAL CONDITION AND RESULTS OF OPERATIONS

9SONO•TEK Corporation 2012 ANNUAL REPORT
Liquidity and Capital Resources
Working Capital–Ourworkingcapitalincreased$1,333,000fromaworkingcapitalof$3,322,000atFebruary28,2011to$4,655,000atFebruary29,2012.Theincreaseinworkingcapitalthisyearisduetothecurrentyear’snetincomewhichresultedinanincreaseincash.Ourcurrentratiois4to1atFebruary29,2012,ascomparedto3.1to1atFebruary28,2011.
Stockholders’ Equity–Stockholders’equityincreased$1,491,000from$4,317,000atFebruary28,2011to$5,808,000atFebruary29,2012.Theincreaseinstockholders’equityistheresultofthecurrentyear’snetincomeof$1,432,000,stockbasedcompensationof$49,000andtheexerciseofstockoptionsfor$10,000.
Operating Activities–Ouroperatingactivitiesprovided$1,192,000ofcashfortheyearendedFebruary29,2012ascomparedtoproviding$1,158,000fortheyearendedFebruary28,2011.DuringtheyearendedFebruary29,2012,wehadnetincomeof$1,432,000,accountsreceivabledecreased$222,000,inventoriesincreased$691,000,prepaidexpensesandotherassetsdecreased$25,000,deferredtaxassetsincreased$86,000andaccountspayable,accruedexpensesandcustomerdepositsdecreased$125,000andincometaxespayableincreased$37,000.Inaddition,weincurrednon-cashexpensesof$330,000fordepreciationandamortizationand$48,000forstockbasedcompensationexpense.
FortheyearendedFebruary29,2012,ourinventoriesincreased$691,000whencomparedtoFebruary28,2011.Duringthecurrentyear,rawmaterialsincreased$497,000,workinprocessdecreased$50,000,finishedgoodsincreased$176,000andourallowanceforobsolescencedecreased$68,000.Theincreaseinrawmaterialsisaresultofouracceleratedpurchasingstrategy.Thechangeinpurchasingwastoreduceourtimeneededtofulfillcustomerordersandabuild-upinanticipationofincreasedsalesvolume.AsofFebruary29,2012,wehaveeliminatedouracceleratedpurchasingstrategyandpurchasematerialsonlywhenneededforcustomerorders.OurfinishedgoodsincreasedduetocustomerordersthatwereshippedafterFebruary29,2012.
Investing Activities –FortheyearendedFebruary29,2012,weused$491,000inourinvestingactivitiesascomparedtousing$2,993,000fortheyearendedFebruary28,2011.In2012and2011,weused$475,000and$195,000,respectively,forthepurchaseormanufactureofequipment,furnishingsandleaseholdimprovements.Inaddition,in2012and2011weused$12,000and$9,000,respectively,forpatentapplicationcosts.In2012and2011weused$5,000and$249,000,respectivelyforthepurchaseofmarketablesecurities.In2011weused$2,540,000forthepurchaseofland,buildingsandimprovements.
Financing Activities–Ourfinancingactivitiesprovided$147,000ofcashfortheyearendedFebruary29,2012ascomparedtoproviding$1,731,000fortheyearendedFebruary28,2011.DuringtheyearendedFebruary29,2012,wehadproceedsofanotepayablefor$237,000forthepurchaseofadditionalproductionequipment.DuringtheyearendedFebruary28,2011,wehadproceedsofanotepayablefor$2,100,000forthepurchaseofland,buildingsandimprovements.In2011,werepaidtheoutstandingbalanceofourlineofcreditof$350,000.Wehadproceedsof$10,000and$3,000forstockoptionexercisesin2012and2011,respectively.Inaddition,wemaderepaymentsofnotespayableof$100,000and$22,000in2012and2011,respectively.
Net Increase in Cash–FortheyearendedFebruary29,2012,ourcashbalanceincreasedby$848,000ascomparedtoadecreaseof$104,000fortheyearendedFebruary28,2011.DuringtheyearendedFebruary29,2012,ouroperationsprovided$1,192,000ofcash,weused$491,000ininvestingactivitiesandourfinancingactivitiesprovided$147,000ofcash.
MANAGEMENT’S DISCUSSION

10
Wecurrentlyhavearevolvingcreditlineof$750,000anda$250,000equipmentpurchasefacility,bothofwhicharewithabank.TherevolvingcreditlineiscollateralizedbyalloftheassetsoftheCompany,exceptforthelandandbuildings.Thelineofcreditispayableondemandandmustberetiredfora30dayperiodonceannually.AsofFebruary29,2012,wehadnooutstandingborrowingsunderthelineofcredit.
Wehadoutstandingborrowingsof$199,000undertheequipmentfacilityatFebruary29,2012.Theborrowinghasarepaymenttermof48monthsandbearsinterestat2.12%.
Wehadoutstandingborrowingsunderanotepayableof$2,036,000atFebruary29,2012.Thenoteispayableover20yearsandbearsinterestat5.5%.Thenotepayableissecuredbyamortgageonourlandandbuildings.
Results of Operations
FortheyearendedFebruary29,2012,oursalesincreasedby$2,139,000to$12,053,000ascomparedto$9,914,000fortheyearendedFebruary28,2011,anincreaseof22%.FortheyearendedFebruary29,2012,weexperiencedanincreaseinsalesofourstentcoaterunits,fluxersandrelatedaccessoriesandourFlexiCoatandExactaCoat(XYZ)Platformunits.Duringthecurrentyear,wedidexperienceadecreaseinsalesofourWideTrackunitsduetoadecreaseindemandfromfloatglassmanufacturers.FortheyearendedFebruary29,2012,salestocustomerslocatedinEuropeancountriesincreasedby$1,580,000or126%,salestocustomerslocatedinAsiancountriesincreasedby$212,000or6%andsalestoU.S.basedcustomersincreasedby$272,000or6%.
Ourgrossprofitincreased$1,394,000,to$6,166,000fortheyearendedFebruary29,2012from$4,772,000fortheyearendedFebruary28,2011.Ourgrossmarginpercentagewas50%fortheyearendedFebruary29,2012comparedto48%fortheyearendedFebruary28,2011.Theimprovementinthecurrentyear’sgrossprofitisduetoanincreaseinsalesofourstentcoaterunits,anincreaseinsalesofourXYZplatformunitsandanincreaseinsalesofourfluxerunitsandrelatedaccessories.Inadditiontotheincreaseinsalesoftheaboveproductlines,wealsosawanincreaseinthegrossmarginpercentagesofourfluxerunitsandrelatedaccessories,ourWideTrackunitsandourXYZplatformunits.
Researchandproductdevelopmentcostsincreased$305,000to$1,129,000fortheyearendedFebruary29,2012ascomparedto$823,000fortheyearendedFebruary28,2011.Theincreaseisduetoincreasedengineeringpersonnelandengineeringmaterials.DuringtheyearendedFebruary29,2012,weexpendedapproximately$711,000forengineeringpersonnelascomparedto$534,000duringtheyearendedFebruary28,2011.DuringtheyearendedFebruary29,2012,weexpendedapproximately$218,000foradditionalresearch,materialsandproductdevelopmentascomparedto$50,000duringtheyearendedFebruary28,2011.Theincreaseintheseexpenseswasoffsetbyadecreaseindepreciationexpenseandrentalexpense.
Marketingandsellingcostsincreased$218,000to$2,398,000fortheyearendedFebruary29,2012from$2,180,000,fortheyearendedFebruary28,2011.Theincreaseisduetoincreasedsalespersonnel,commissionsandtradeshowandtravelexpenses.DuringtheyearendedFebruary29,2012,weexpendedapproximately$1,691,000forsalariesandcommissionsascomparedto$1,503,000duringtheyearendedFebruary28,2011.DuringtheyearendedFebruary29,2012,weexpendedapproximately$429,000fortravelandtradeshowexpensesascomparedto$337,000duringtheyearendedFebruary28,2011.Theincreaseintheseexpenseswasoffsetbyadecreaseindepreciationexpenseandrentalexpense.
Generalandadministrativecostsincreased$83,000to$1,249,000fortheyearendedFebruary29,2012from$1,167,000,fortheyearendedFebruary28,2011.Theincreaseisduetosalaryincreases,additionalprofessionalandconsultingfeesandincreasedcorporateexpenses.Theincreaseintheseexpenseswasoffsetbydecreasesinbaddebtexpense,rentalexpenseandothermiscellaneousexpenses.
MANAGEMENT’S DISCUSSION continued

11SONO•TEK Corporation 2012 ANNUAL REPORT
ThetwelvemonthperiodendedFebruary28,2011includesrentexpenseof$125,000allocatedasfollows:
CostofGoodsSold............................................$ 51,000ResearchandDevelopment............................... 32,000MarketingandSelling......................................... 25,000GeneralandAdministrative................................ 17,000 $125,000
ThetwelvemonthsendedFebruary29,2012resultsdonotincludeanyrentalexpenseasallinter-companytrans-actionsareeliminatedinconsolidationduetoourpurchaseoftheSono-TekIndustrialParkinDecember2010.
RealestateoperationsexpenseareexpensesfortheoperationsoftheSono-TekIndustrialPark.Allinter-companyrevenueiseliminatedinconsolidation.FortheyearendedFebruary29,2012,theresultsofourrentalrealestateoperationsareasfollows:
RentalIncome.................................................... $ 86,377
Depreciation....................................................... 57,415Insurance............................................................ 10,913GroundsandLandscaping............................... 20,676Propertytaxes.................................................... 38,900Miscellaneous.................................................... 678TotalExpenses................................................... 128,582
LossbeforeInterest........................................... (42,205)
InterestExpense................................................ 113,747
NetLoss............................................................. $(155,952)
ItshouldbenotedthattheCompany’seliminationofrentalexpenseasdetailedinthestatementsofoperationswasreplacedbyrentaloperationsexpenseasdetailedintheprecedingtable.Therentalincomedetailedinthetableaboveisincludedinthenetsalesamountonthestatementsofoperationsonpage15.
Interestincomeincreasedto$6,000fortheyearendedFebruary29,2012ascomparedto$2,000fortheyearendedFebruary28,2011.OurpresentinvestmentpolicyistoinvestexcesscashinshorttermcashequivalentswithanS&PratingofatleastA1+.
Interestexpenseincreasedto$118,000fortheyearendedFebruary29,2012ascomparedto$8,000fortheyearendedFebruary28,2011.TheincreaseininterestexpenseisduetotheoutstandingnotepayablewehavefortheacquisitionoftheSono-TekIndustrialPark.
Werecordedanincometaxbenefitof$291,000fortheyearendedFebruary29,2012ascomparedtoanexpenseof$14,500fortheyearendedFebruary28,2011.AsofFebruary29,2012,wehavenonetoperatinglossdeductionsavailabletocarryforward.ThedetailsofthecurrentyearstaxbenefitareexplainedinNote11inourfinancialstatements.
FortheyearendedFebruary29,2012,wehadnetincomeof$1,432,000comparedto$594,000fortheyearendedFebruary28,2011.Theimprovementinournetincomeisduetoanincreaseinsales,animprovedgrossprofitmarginandanincometaxbenefit.
MANAGEMENT’S DISCUSSION
MANAGEMENT’S DISCUSSION continued

12
Off - Balance Sheet Arrangements
WedonothaveanyOff-BalanceSheetArrangementsasofFebruary29,2012.
Critical Accounting Policies
ThediscussionandanalysisoftheCompany’sfinancialconditionandresultsofoperationsarebasedupontheCompany’sconsolidatedfinancialstatements,whichhavebeenpreparedinaccordancewithaccountingprinciplesgenerallyacceptedintheUnitedStatesofAmerica.ThepreparationofthesefinancialstatementsrequirestheCompanytomakeestimatesandjudgmentsthataffectthereportedamountofassetsandliabilities,revenuesandexpenses,andrelateddisclosureoncontingentassetsandliabilitiesatthedateofthefinancialstatements.Actualresultsmaydifferfromtheseestimatesunderdifferentassumptionsandconditions.
Criticalaccountingpoliciesaredefinedasthosethatarereflectiveofsignificantjudgmentsanduncertainties,andmaypotentiallyresultinmateriallydifferentresultsunderdifferentassumptionsandconditions.AsofFebruary29,2012,managementbelievestherearenocriticalaccountingpoliciesapplicabletotheCompanythatarereflectiveofsignificantjudgmentsandoruncertainties.
Stock-Based Compensation
Thecomputationoftheexpenseassociatedwithstock-basedcompensationrequirestheuseofavaluationmodel.ASC718isacomplexaccountingstandard,theapplicationofwhichrequiressignificantjudgmentandtheuseofestimates,particularlysurroundingBlack-Scholesassumptionssuchasstockpricevolatility,expectedoptionlives,andexpectedoptionforfeiturerates,tovalueequity-basedcompensation.WecurrentlyuseaBlack-Scholesoptionpricingmodeltocalculatethefairvalueofstockoptions.WeprimarilyusehistoricaldatatodeterminetheassumptionstobeusedintheBlack-Scholesmodelandhavenoreasontobelievethatfuturedataislikelytodiffermateriallyfromhistoricaldata.However,changesintheassumptionstoreflectfuturestockpricevolatilityandfuturestockawardexerciseexperiencecouldresultinachangeintheassumptionsusedtovalueawardsinthefutureandmayresultinamaterialchangetothefairvaluecalculationofstock-basedawards.ASC718requirestherecognitionofthefairvalueofstockcompensationinnetincome.Althougheveryeffortismadetoensuretheaccuracyofourestimatesandassumptions,significantunanticipatedchangesinthoseestimates,interpretationsandassumptionsmayresultinrecordingstockoptionexpensethatmaymateriallyimpactourfinancialstatementsforeachrespectivereportingperiod.
Impact of New Accounting Pronouncements
InMay2011,theFinancialAccountingStandardsBoard(“FASB”)amendeditsguidancerelatedtoFairValueMeasurement:AmendmentstoAchieveCommonFairValueMeasurementandDisclosureRequirementsinU.S.generallyacceptedaccountingprinciples(“U.S.GAAP”)andtheInternationalFinancialReportingStandards(“IFRS”),thatresultsinaconsistentdefinitionoffairvalueandcommonrequirementsformeasurementofanddisclosureaboutfairvalue.ThenewguidanceclarifiesandchangessomefairvaluemeasurementprinciplesanddisclosurerequirementsunderU.S.GAAP.Amongthemistheclarificationthattheconceptsofhighestandbestuseandvaluationpremiseinafairvaluemeasurementshouldonlybeappliedwhenmeasuringthefairvalueofnonfinancialassets.Additionally,thenewguidancerequiresquantitativeinformationaboutunobservableinputs,anddisclosureofthevaluationprocessesusedandnarrativedescriptionswithregardtofairvaluemeasurementswithintheLevel3categorizationofthefairvaluehierarchy.TherequirementsoftheamendedaccountingguidanceareeffectiveforusMarch1,2012andearlyadoptionisprohibited.Theadoptionofthenewaccountingguidanceisnotexpectedtohaveamaterialimpactonourconsolidatedfinancialstatements.
Allotheraccountingpronouncementsissuedbutnotyeteffectivehavebeendeemedtobenotapplicableortheadoptionofsuchaccountingpronouncementisnotexpectedtohaveamaterialimpactonthefinancials.
MANAGEMENT’S DISCUSSION continued

13SONO•TEK Corporation 2012 ANNUAL REPORT
REPORT OF INDEPENDENT REGISTERED PUBLIC ACCOUNTING FIRM
TotheStockholdersandBoardofDirectors
Sono-Tek Corporation
Milton,NewYork
WehaveauditedtheaccompanyingconsolidatedbalancesheetsofSono-TekCorporationasofFebruary29,2012andFebruary28,2011,andtherelatedconsolidatedstatementsofoperations,stockholders’equityandcashflowsforeachoftheyearsendedFebruary29,2012andFebruary28,2011.ThesefinancialstatementsaretheresponsibilityoftheCompany’smanagement.Ourresponsibilityistoexpressanopiniononthesefinancialstatementsbasedonouraudits.
WeconductedourauditsinaccordancewiththestandardsofthePublicCompanyAccountingOversightBoard(UnitedStates).Thosestandardsrequirethatweplanandperformtheauditstoobtainreasonableassuranceaboutwhetherthefinancialstatementsarefreeofmaterialmisstatement.Anauditincludesexamining,onatestbasis,evidencesupportingtheamountsanddisclosuresinthefinancialstatements.Anauditalsoincludesassessingtheaccountingprinciplesusedandsignificantestimatesmadebymanagement,aswellasevaluatingtheoverallfinancialstatementpresentation.Webelievethatourauditsprovideareasonablebasisforouropinion.
Inouropinion,thefinancialstatementsreferredtoabovepresentfairly,inallmaterialrespects,thefinancialpositionofSono-TekCorporation,asofFebruary29,2012andFebruary28,2011andtheresultsoftheiroperationandtheircashflowsforeachoftheyearsthenendedFebruary29,2012andFebruary28,2011inconformitywithaccountingprinciplesgenerallyacceptedintheUnitedStates.
SHERB&CO.,LLP
CertifiedPublicAccountants
NewYork,NewYork
May14,2012
MANAGEMENT’S DISCUSSION continued
INDEPENDENT AUDITOR’S REPORT

14
CONSOLIDATED BALANCE SHEETS
ASSETS February29, February28,
2012 2011CurrentAssets: Cashandcashequivalents....................................................... $ 2,531,689 $ 1,683,801 MarketableSecurities................................................................ 253,987 249,100 Accountsreceivable(lessallowanceof$26,000and $26,000,respectively)............................................................. 754,605 976,339 Inventories,net.......................................................................... 2,559,128 1,868,144 Prepaidexpensesandothercurrentassets.............................. 112,392 131,404 Totalcurrentassets............................................... 6,211,801 4,908,788
Land............................................................................................ 250,000 250,000Buildings,net............................................................................... 2,229,650 2,280,175Equipment,furnishingsandleaseholdimprovements,net........ 617,200 414,210Intangibleassets,net.................................................................. 83,455 79,150Otherassets................................................................................ - 6,542Deferredtaxasset....................................................................... 86,167 -
TOTALASSETS........................................................................... $ 9,478,273 $ 7,938,865
LIABILITIES AND STOCKHOLDERS’ EQUITY
CurrentLiabilities: Accountspayable...................................................................... $ 552,979 $ 643,315 Accruedexpenses.................................................................... 529,732 507,517 CustomerDeposits.................................................................... 316,246 373,577 Currentmaturitiesoflongtermdebt.......................................... 120,303 62,247 Incometaxespayable................................................................ 37,250 -
Totalcurrentliabilities............................................. 1,556,510 1,586,656
Longtermdebt,lesscurrentmaturities...................................... 2,114,196 2,035,579
TotalLiabilities............................................................................ 3,670,706 3,622,235
CommitmentsandContingencies............................................. - -
Stockholders’Equity Commonstock,$.01parvalue;25,000,000sharesauthorized, 14,455,444and14,441,511issuedandoutstanding, respectively..................................................................................... 144,553 144,416 Additionalpaid-incapital........................................................... 8,657,629 8,599,122 Accumulateddeficit................................................................... (2,994,615) (4,426,908)
Totalstockholders’equity............................................................ 5,807,567 4,316,630
TOTALLIABILITIESANDSTOCKHOLDERS’EQUITY................ $ 9,478,273 $ 7,938,865
See notes to consolidated financial statements.
CONSOLIDATED FINANCIAL STATEMENTS

15SONO•TEK Corporation 2012 ANNUAL REPORT
CONSOLIDATED STATEMENTS OF OPERATIONS
YearsEnded February29, February28, 2012 2011
NetSales.................................................................................... $12,052,893 $ 9,914,312CostofGoodsSold.................................................................... 5,886,667 5,142,229 GrossProfit............................................................ 6,166,226 4,772,083
OperatingExpenses Researchandproductdevelopment........................................ 1,128,729 823,089 Marketingandselling................................................................ 2,398,367 2,180,268 Generalandadministrative........................................................ 1,249,209 1,166,690 Realestateoperationsexpense................................................ 128,582 - TotalOperatingExpenses...................................... 4,904,887 4,170,047
OperatingIncome..................................................................... 1,261,339 602,036
OtherIncome(Expense):InterestExpense.......................................................................... (118,115) (7,921)InterestIncome............................................................................ 6,049 1,870OtherIncome(Expense)............................................................. (7,499) 12,460IncomebeforeIncomeTaxes...................................................... 1,141,774 608,445
IncomeTaxExpense(Benefit)..................................................... (290,519) 14,500
NetIncome................................................................................. $ 1,432,293 $ 593,945
BasicEarningsPerShare.......................................................... $ .10 $ .04
DilutedEarningsPerShare......................................................... $ .09 $ .04
WeightedAverageShares–Basic............................................. 14,442,908 14,439,166
WeightedAverageShares–Diluted........................................... 15,407,144 15,028,047
See notes to consolidated financial statements.
CONSOLIDATED FINANCIAL STATEMENTS
16
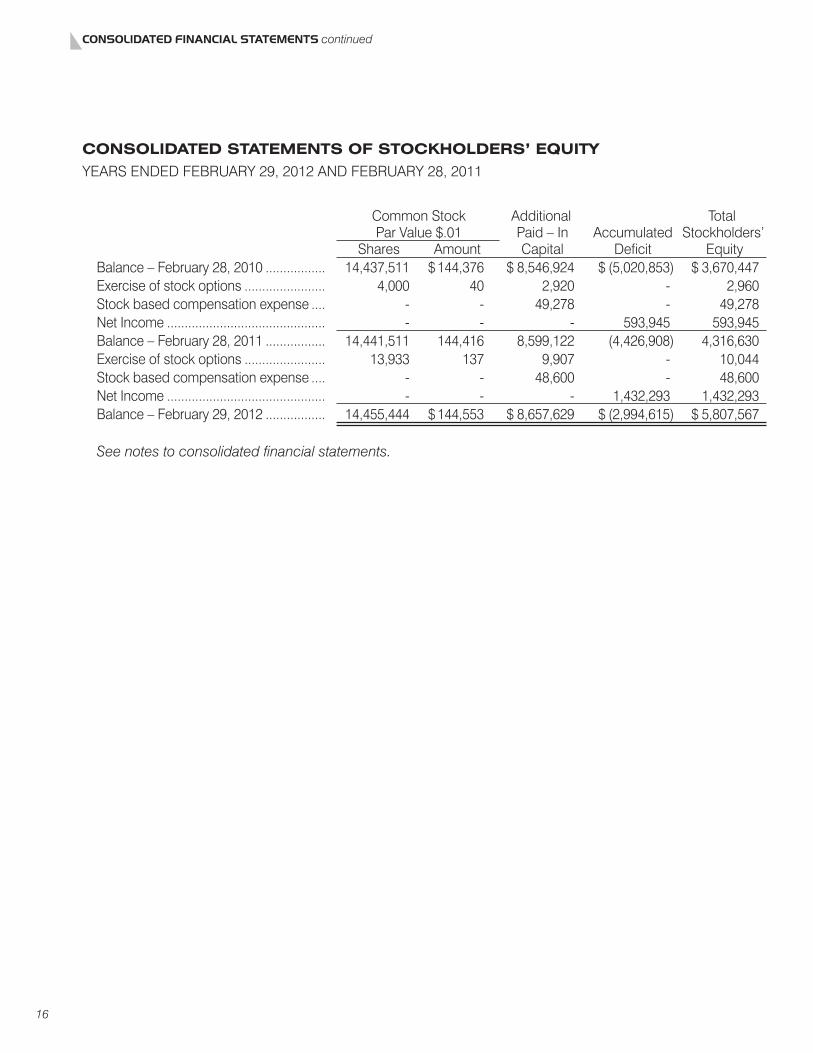
CONSOLIDATED STATEMENTS OF STOCKHOLDERS’ EQUITY
YEARSENDEDFEBRUARY29,2012ANDFEBRUARY28,2011
CommonStock Additional Total ParValue$.01 Paid–In Accumulated Stockholders’ Shares Amount Capital Deficit EquityBalance–February28,2010.................... 14,437,511 $144,376 $8,546,924 $(5,020,853) $3,670,447Exerciseofstockoptions.......................... 4,000 40 2,920 - 2,960Stockbasedcompensationexpense....... - - 49,278 - 49,278NetIncome................................................ - - - 593,945 593,945Balance–February28,2011.................... 14,441,511 144,416 8,599,122 (4,426,908) 4,316,630Exerciseofstockoptions.......................... 13,933 137 9,907 - 10,044Stockbasedcompensationexpense....... - - 48,600 - 48,600NetIncome................................................ - - - 1,432,293 1,432,293Balance–February29,2012.................... 14,455,444 $144,553 $8,657,629 $(2,994,615) $5,807,567
See notes to consolidated financial statements.
CONSOLIDATED FINANCIAL STATEMENTS continued

17SONO•TEK Corporation 2012 ANNUAL REPORT
CONSOLIDATED STATEMENTS OF CASH FLOWS
YearsEnded February29, February28, 2012 2011
CASHFLOWSFROMOPERATINGACTIVITIES: NetIncome............................................................................... $1,432,293 $ 593,945 Adjustmentstoreconcilenetincometonetcash providedbyoperatingactivities: Depreciationandamortization........................................ 329,501 312,823 Stockbasedcompensationexpense.............................. 48,600 49,278 Allowancefordoubtfulaccounts..................................... - 10,000 (Increase)Decreasein: Accountsreceivable.............................................. 221,734 (11,910) Inventories............................................................. (690,984) (110,991) Prepaidexpensesandothercurrentassets........... 25,554 (73,629) Deferredtaxasset................................................... (86,167) - (Decrease)Increasein: Accountspayableandaccruedexpenses............ (68,121) 89,002 Customerdeposits................................................ (57,331) 299,623 Incometaxespayable........................................... 37,250 - NetCashProvidedbyOperatingActivities..... 1,192,329 1,158,141
CASHFLOWSFROMINVESTINGACTIVITIES: Purchaseofequipment,furnishingsandleasehold improvements......................................................................... (474,041) (195,035) Purchaseofland,buildingsandimprovements........................ - (2,539,716) Purchaseofmarketablesecurities............................................ (4,887) (249,100) Patentapplicationcosts............................................................ (12,230) (9,442)NetCash(UsedIn)InvestingActivities.................................. (491,158) (2,993,293)
CASHFLOWSFROMFINANCINGACTIVITIES: Proceedsfromexerciseofoptions............................................ 10,044 2,960 Proceedsfromnotepayable.................................................... - 2,100,000 Proceedsfromnotepayable–Bank......................................... 237,000 - Repaymentoflineofcredit–Bank............................................ - (350,000) Repaymentoflongtermdebt.................................................... (100,327) (21,523) NetCashProvidedbyFinancingActivities............................ 146,717 1,731,437
NETINCREASE(DECREASE)INCASHANDCASHEQUIVALENTS......................................................................... 847,888 (103,715)
CASHANDCASHEQUIVALENTS: Beginningofyear....................................................................... 1,683,801 1,787,516 Endofyear................................................................................. $ 2,531,689 $1,683,801
See notes to consolidated financial statements.
CONSOLIDATED FINANCIAL STATEMENTS

18
NOTES TO CONSOLIDATED FINANCIAL STATEMENTSYEARS ENDED FEBRUARY 29, 2012 AND FEBRUARY 28, 2011
NOTE 1: BUSINESS DESCRIPTION
TheCompanywasincorporatedinNewYorkonMarch21,1975forthepurposeofengaginginthedevelopment,manufacture,andsaleofultrasonicliquidatomizingnozzles,whicharesoldworld-wide.Ultrasonicnozzlesystemsatomizelowtomediumviscosityliquidsbyconvertingelectricalenergyintomechanicalmotionintheformofhighfrequencyultrasonicvibrationsthatbreakliquidsintominutedropsthatcanbeappliedtosurfacesatlowvelocity.
Basedonitscoretechnologyofultrasonicliquidatomizingnozzles,theCompanyhasdevelopedintellectualpropertyintheareaofprecisionspraycoatingofliquids.TheCompanyispresentlyengagedinthedevelopment,manufacture,sales,installationandservicingofdiverseultrasoniccoatingequipmentforvariousmanufacturingindustriesworldwide.
NOTE 2: SIGNIFICANT ACCOUNTING POLICIES
Consolidation-TheaccompanyingconsolidatedfinancialstatementsofSono-TekCorporation,aNewYorkcorporation(the“Company”),includetheaccountsoftheCompanyanditswhollyownedsubsidiaries,Sono-TekCleaningSystemsInc.andSono-TekIndustrialPark,LLC.Sono-TekCleaningSystems,Inc.,aNewJerseyCorporation(“SCS”),ceasedoperationsduringtheFiscalYearEndedFebruary28,2002.Sono-TekIndustrialPark,LLC(“SIP”),operatesasarealestateholdingcompanyfortheCompany’srealestateoperationsandstartedoperatinginDecember2010.
Reclassifications-Whereappropriate,prioryear’sfinancialstatementsreflectreclassificationstoconformtothecurrentyear’spresentation.
Cash and Cash Equivalents-Cashandcashequivalentsconsistofmoneymarketmutualfunds,shorttermcommercialpaperandshort-termcertificatesofdepositwithoriginalmaturitiesof90daysorless.
Supplemental Cash Flow Disclosure-
YearsEnded February29, February28, 2012 2011Interestpaid..................................................................................... $118,115 $14,546Incometaxespaid............................................................................ $ 6,663 $216
Inventories-Inventoriesarestatedatthelowerofcostormarket.Costisdeterminedusingthefirst-in,first-out(FIFO)methodforrawmaterials,subassembliesandwork-in-progressandthespecificidentificationmethodforfinishedgoods.
Allowance for doubtful accounts-TheCompanyrecordsabaddebtexpense/allowancebasedonmanagement’sestimateofuncollectibleaccounts.Alloutstandingaccountsreceivableaccountsarereviewedforcollectabilityonanindividualbasis.ThebaddebtexpenserecordedfortheyearsendedFebruary29,2012andFebruary28,2011was$0and$10,000,respectively.

19SONO•TEK Corporation 2012 ANNUAL REPORT
Equipment, Furnishings and Leasehold Improvements-Equipment,furnishingsandleaseholdimprovementsarestatedatcost.Depreciationofequipmentandfurnishingsiscomputedbyuseofthestraight-linemethodbasedontheestimatedusefullivesoftheassets,whichrangefromthreetofiveyears.
Land and Buildings-Landandbuildingsarestatedatcost.Buildingsarebeingdepreciatedbyuseofthestraight-linemethodbasedonanestimatedusefullifeoffortyyears.
Product Warranty-Expectedfutureproductwarrantyexpenseisrecordedwhentheproductissold.
Intangible Assets-Includecostsofpatentapplicationswhicharedeferredandchargedtooperationsoverseventeenyearsfordomesticpatentsandtwelveyearsforforeignpatentsandtheunamortizedportionofdeferredfinancingcosts.Theaccumulatedamortizationofpatentsis$85,983and$78,058atFebruary29,2012andFebruary28,2011,respectively.Annualamortizationexpenseofsuchintangibleassetsisexpectedtobe$7,900peryearforthenextfiveyears.
Research and Product Development Expenses-Researchandproductdevelopmentexpensesrepre-sentengineeringandotherexpendituresincurredfordevelopingnewproducts,forrefiningtheCompany’sexistingproductsandfordevelopingsystemstomeetuniquecustomerspecificationsforpotentialordersorfornewindustryapplicationsandareexpensedasincurred.
Income Taxes-TheCompanyaccountsforincometaxesundertheassetandliabilitymethod.Underthismethod,deferredincometaxesarerecognizedforthetaxconsequencesof“temporarydifferences”byapplyingenactedstatutorytaxratesapplicabletofutureyearstodifferencesbetweenthefinancialstatementcarryingamountsandthetaxbasisofexistingassetsandliabilities.Ifitismorelikelythannotthatsomeportionorallofadeferredtaxassetwillnotberealized,avaluationallowanceisrecognized.
Earnings Per Share -Basicearningspershare(“EPS”)iscomputedbydividingnetincomebytheweighted-averagenumberofcommonsharesoutstandingfortheperiod.DilutedEPSreflectsthepotentialdilutionthatcouldoccurifsecuritiesorothercontractstoissuecommonstockwereexercisedorconvertedintocommonstock.
Shipping and Handling Costs-Shippingandhandlingcostsareincludedincostofsalesintheaccompanyingconsolidatedstatementsofoperations.
Advertising Expenses-TheCompanyexpensesthecostofadvertisingintheperiodinwhichtheadvertisingtakesplace.AdvertisingexpensefortheyearsendedFebruary29,2012andFebruary28,2011was$248,798and$206,271,respectively.
Long-Lived Assets-TheCompanyperiodicallyevaluatesthecarryingvalueoflong-livedassets,includingintangibleassets,wheneventsandcircumstanceswarrantsuchareview.Thecarryingvalueofalong-livedassetisconsideredimpairedwhentheanticipatedundiscountedcashflowfromsuchassetisseparatelyidentifiableandislessthanitscarryingvalue.Inthatevent,alossisrecognizedbasedontheamountbywhichthecarryingvalueexceedsthefairmarketvalueofthelong-livedasset.Fairmarketvalueisdeterminedprimarilyusingtheanticipatedcashflowsdiscountedataratecommensuratewiththeriskinvolved.
NOTES TO CONSOLIDATED FINANCIAL STATEMENTS

20
Recognition of Revenue-Salesarerecordedatthetimetitlepassestothecustomer,which,basedonshippingterms,generallyoccurswhentheproductisshippedtothecustomer.Basedonpriorexperience,theCompanyreasonablyestimatesitssalesreturnsandwarrantyreserves.Salesarepresentednetofdiscountsandallowances.Discountsandallowancesaredeterminedwhenasaleisnegotiated.TheCompanydoesnotgrantitscustomersorindependentrepresentativestheabilitytoreturnequipmentnordoesitgrantpriceadjustmentsafterasaleiscomplete.
Concentration of Credit Risk-TheCompanydoesnotbelievethatitissubjecttoanyunusualorsignifi-cantrisks,inthenormalcourseofbusiness.TheCompanyhadonecustomer,whichaccountedfor6.7%ofsalesduringtheyearendedFebruary29,2012.Threecustomersaccountedfor26.6%oftheoutstandingaccountsreceivablesatFebruary29,2012.
Fair Value of Financial Instruments-EffectiveJune1,2008,theCompanyadoptedtheguidanceintheFairValueMeasurementsandDisclosureTopicoftheAccountingStandardsCodificationforassetsandliabilitiesmeasuredatfairvalueonarecurringbasis.Thisguidanceestablishesacommondefinitionforfairvaluetobeappliedtoexistinggenerallyacceptedaccountingprinciplesthatrequiretheuseoffairvaluemeasurements,establishesaframeworkformeasuringfairvalueandexpandsdisclosureaboutsuchfairvaluemeasurements.TheadoptionofthisguidancedidnothaveanimpactontheCompany’sfinancialpositionoroperatingresults,butdidexpandcertaindisclosures.Theguidancedefinesfairvalueasthepricethatwouldbereceivedtosellanassetorpaidtotransferaliabilityinanorderlytransactionbetweenmarketparticipantsatthemeasurementdate.Additionally,theguidancerequirestheuseofvaluationtechniquesthatmaximizetheuseofobservableinputsandminimizetheuseofunobservableinputs.Theseinputsareprioritizedbelow:
Level1:Quotedpricesinactivemarkets.
Level2:Observablemarket-basedinputsorunobservableinputsthatarecorroboratedbymarketdata.
Level3:Unobservableinputsforwhichthereislittleornomarketdata,whichrequiretheuseofthereportingentity’sownassumptions.
ThefairvaluesoffinancialassetsoftheCompanyweredeterminedusingthefollowingcategoriesatFebruary29,2012:
Quoted prices in active markets (Level 1)MarketableSecurities..................................... $253,987
MarketableSecuritiesincludemutualfundsof$253,987,thatareconsideredtobehighlyliquidandeasilytradeableasofFebruary29,2012.ThesesecuritiesarevaluedusinginputsobservableinactivemarketsforidenticalsecuritiesandarethereforeclassifiedasLevel1withintheCompany’sfairvaluehierarchy.
Inaddition,theguidanceoftheFairValueOptionforFinancialAssetsandFinancialLiabilitiesTopicoftheCodificationwaseffectiveforJune1,2008.Theguidanceexpandsopportunitiestousefairvaluemeasurementsinfinancialreportingandpermitsentitiestochoosetomeasuremanyfinancialinstrumentsandcertainotheritemsatfairvalue.
NOTES TO CONSOLIDATED FINANCIAL STATEMENTS continued
21SONO•TEK Corporation 2012 ANNUAL REPORT
Management Estimates-ThepreparationoffinancialstatementsinconformitywithaccountingprinciplesgenerallyacceptedintheUnitedStatesofAmericarequiresmanagementtomakeestimatesandassumptionsthataffectthereportedamountsofassetsandliabilitiesanddisclosureofcontingentassetsandliabilitiesatthedateofthefinancialstatementsandthereportedamountsofrevenuesandexpensesduringthereportingperiod.Actualresultscoulddifferfromthoseestimates.
New Accounting Pronouncements -
InMay2011,theFinancialAccountingStandardsBoard(“FASB”)amendeditsguidancerelatedtoFairValueMeasurement:AmendmentstoAchieveCommonFairValueMeasurementandDisclosureRequirementsinU.S.generallyacceptedaccountingprinciples(“U.S.GAAP”)andtheInternationalFinancialReportingStandards(“IFRS”),thatresultsinaconsistentdefinitionoffairvalueandcommonrequirementsformeasurementofanddisclosureaboutfairvalue.ThenewguidanceclarifiesandchangessomefairvaluemeasurementprinciplesanddisclosurerequirementsunderU.S.GAAP.Amongthemistheclarificationthattheconceptsofhighestandbestuseandvaluationpremiseinafairvaluemeasurementshouldonlybeappliedwhenmeasuringthefairvalueofnonfinancialassets.Additionally,thenewguidancerequiresquantitativeinformationaboutunobservableinputs,anddisclosureofthevaluationprocessesusedandnarrativedescriptionswithregardtofairvaluemeasurementswithintheLevel3categorizationofthefairvaluehierarchy.TherequirementsoftheamendedaccountingguidanceareeffectiveforusMarch1,2012andearlyadoptionisprohibited.Theadoptionofthenewaccountingguidanceisnotexpectedtohaveamaterialimpactonourconsolidatedfinancialstatements.
Allotheraccountingpronouncementsissuedbutnotyeteffectivehavebeendeemedtobenotapplicableortheadoptionofsuchaccountingpronouncementisnotexpectedtohaveamaterialimpactonthefinancials.
NOTE 3: SEGMENT INFORMATION
TheCompanyoperatesintwosegments:ultrasonicspraycoatingsystems,whichisthebusinessofdeveloping,manufacturing,selling,installingandservicingultrasonicspraycoatingequipment;andrealestateoperations,whichisthebusinessofowningandoperatingtheSono-TekIndustrialPark.
Allinter-companytransactionsareeliminatedinconsolidation.ForthetwelvemonthsendedFebruary29,2012,segmentinformationisasfollows:
TwelveMonthsEndedFebruary29,2012 RentalRealEstate UltrasonicSpraying Operations Eliminations Consolidated
NetSales................................. $11,966,516 $ 222,116 $ 135,739 $12,052,893RentalExpense....................... $ 135,739 $ 128,582 $(135,739) $ 128,582InterestExpense..................... $ 4,368 $ 113,747 $ 118,115NetIncome(Loss).................. $ 1,403,589 $ (20,213) $ 1,383,376Assets...................................... $ 6,862,717 $2,529,389 $ 9,392,106Debt......................................... $ 198,920 $2,035,579 $ 2,234,499
Thetabularinformationpresentedaboveforthefiscalyear2012hasnotbeenpresentedforthefiscalyear2011.TherealestateoperationsbeganinJanuary2011,andtheoperationalresultsforthisperiodofownershipweredeemedimmaterialandincludednetasotherincomeinthefinancialstatements.
NOTES TO CONSOLIDATED FINANCIAL STATEMENTS
NOTES TO CONSOLIDATED FINANCIAL STATEMENTS continued

22
NOTE 4: STOCK-BASED COMPENSATION
TheCompanyadoptedASC718,“ShareBasedPayments.”whichrequirescompaniestoexpensethevalueofemployeestockoptionsandsimilarawards.
Theweighted-averagefairvalueofoptionshasbeenestimatedonthedateofgrantusingtheBlack-Scholesoptions-pricingmodel.Theweighted-averageBlack-Scholesassumptionsareasfollows:
2012 2011Expectedlife..................................................................................... 4years 4yearsRiskfreeinterestrate....................................................................... .71%-1.17% .57%-1.17%Expectedvolatility............................................................................ 29%-31% 37%-53%Expecteddividendyield................................................................... 0% 0%
Incomputingtheimpact,thefairvalueofeachoptionisestimatedonthedateofgrantbasedontheBlack-Scholesoptions-pricingmodelutilizingcertainassumptionsforariskfreeinterestrate,volatilityandexpectedremaininglivesoftheawards.Theassumptionsusedincalculatingthefairvalueofshare-basedpaymentawardsrepresentmanagement’sbestestimates,buttheseestimatesinvolveinherentuncertaintiesandtheapplicationofmanagementjudgment.Asaresult,iffactorschangeandtheCompanyusesdifferentassumptions,theCompany’sstock-basedcompensationexpensecouldbemateriallydifferentinthefuture.Inaddition,theCompanyisrequiredtoestimatetheexpectedforfeiturerateandonlyrecognizeexpenseforthosesharesexpectedtovest.InestimatingtheCompany’sforfeiturerate,theCompanyanalyzeditshistoricalforfeiturerate,theremaininglivesofunvestedoptions,andthenumberofvestedoptionsasapercentageoftotaloptionsoutstanding.IftheCompany’sactualforfeiturerateismateriallydifferentfromitsestimate,oriftheCompanyreevaluatestheforfeiturerateinthefuture,thestock-basedcompensationexpensecouldbesignificantlydifferentfromwhattheCompanyhasrecordedinthecurrentperiod.
FortheyearsendedFebruary29,2012andFebruary28,2011,netincomeandearningspersharereflecttheactualdeductionforstock-basedcompensationexpense.TheimpactofapplyingASC718approximated$48,600and$49,278inadditionalcompensationexpensefortheyearsthenended,respectively.Suchamountisincludedingeneralandadministrativeexpensesonthestatementofoperations.Theexpenseforstock-basedcompensationisanon-cashexpenseitem.
NOTE 5: INVENTORIES
Inventoriesconsistofthefollowing:
February29, February28, 2012 2011RawMaterials................................................................................... $1,295,938 $799,355Work-in-process............................................................................... 544,805 594,744Consignment.................................................................................... 7,127 7,861FinishedGoods................................................................................ 905,142 729,142 Totals................................................................................... 2,753,012 2,131,102Less:Allowance.............................................................................. (193,884) (262,958) $2,559,128 $1,868,144
NOTES TO CONSOLIDATED FINANCIAL STATEMENTS continued

23SONO•TEK Corporation 2012 ANNUAL REPORT
NOTE 6: BUILDINGS, EQUIPMENT, FURNISHINGS AND LEASEHOLD IMPROVEMENTS
Equipment,furnishingsandleaseholdimprovementsconsistofthefollowing:
February29, February28, 2012 2011Buildings.......................................................................................... $ 2,296,606 $ 2,289,716Laboratoryequipment..................................................................... 526,388 423,286Machineryandequipment............................................................... 613,946 376,518Leaseholdimprovements................................................................ 152,161 138,810Tradeshowanddemonstrationequipment.................................... 772,313 721,246Furnitureandfixtures....................................................................... 641,572 579,369 Totals................................................................................... 5,002,986 4,528,945Less:accumulateddepreciation.................................................... (2,156,136) (1,834,560) $2,846,850 $2,694,385
DepreciationexpensefortheyearsendedFebruary29,2012andFebruary28,2011was$321,577and$305,618,respectively.
NOTE 7: ACCRUED EXPENSES
Accruedexpensesconsistofthefollowing:
February29, February28, 2012 2011Accruedcompensation................................................................... $198,056 $288,929Estimatedwarrantycosts................................................................ 36,000 28,050Accruedcommissions..................................................................... 181,682 126,092Professionalfees.............................................................................. 30,172 14,850Otheraccruedexpenses................................................................. 83,822 49,596 $529,732 $507,517
NOTE 8: REVOLVING LINE OF CREDIT
TheCompanyhasa$750,000revolvinglineofcreditatprimewhichwas3.25%atFebruary29,2012.ThelineofcreditiscollateralizedbyalloftheassetsoftheCompany,exceptforthelandandbuildings.Thelineofcreditispayableondemandandmustberetiredfora30dayperiodonceannually.IftheCompanyfailstoperformthe30dayannualpaydownorifthebankelectstoterminatethecreditline,thebankmayatitsoptionconverttheoutstandingbalancetoa36monthtermnotewithpaymentsincludinginterestin36equalinstallments.AsofFebruary29,2012,theCompany’soutstandingbalancewas$0,andtheunusedcreditlinewas$750,000.
NOTES TO CONSOLIDATED FINANCIAL STATEMENTS

24
NOTE 9: LONG-TERM DEBT
Long-termdebtconsistsofthefollowing: February29, February28, 2012 2011
Notepayable,individual,collateralizedbylandandbuildings,payableinmonthlyinstallmentsofprincipalandinterestof$14,446throughJanuary2031.Interestrate5.5%.20yearterm.......................................... $2,035,579 $2,095,179
Equipmentloan,bank,collateralizedbyrelatedproductionequipment,payableinmonthlyinstallmentsofprincipalandinterestof$5,158throughJune2015.Interestrate2.12%.48monthterm........................................... 198,920 0
Equipmentloan,bank,collateralizedbyrelatedofficeequipment,payableinmonthlyinstallmentsofprincipalandinterestof$529throughSeptember2011.Interestrate5.22%.36monthterm................................. 0 2,647
Totallongtermdebt.................................................................. 2,234,499 2,097,826Duewithinoneyear................................................................... 120,303 62,247Dueafteroneyear..................................................................... $2,114,196 $2,035,579
Long-termdebtispayableasfollows:
FiscalYearendingFebruary28, 2013........................................................................ $ 120,303 2014........................................................................ 126,000 2015........................................................................ 131,026 2016........................................................................ 94,600 2017........................................................................ 78,417 Thereafter............................................................... $1,684,153
NOTE 10: COMMITMENTS AND CONTINGENCIES
TheCompanydoesnothaveanymaterialcommitmentsorcontingenciesasofFebruary29,2012.
NOTES TO CONSOLIDATED FINANCIAL STATEMENTS continued

25SONO•TEK Corporation 2012 ANNUAL REPORT
NOTE 11: INCOME TAXES
Theannualprovision(benefit)forincometaxesdiffersfromamountscomputedbyapplyingthemaximumU.S.Federalincometaxrateof35%topre-taxincomeasfollows:
February29, February28, 2012 2011Expectedfederalincometax........................................................... $ 486,150 $ 212,880Statetax,netoffederal.................................................................... 34,725 36,494Permanenttimingdifference............................................................ 28,319 53,721Statetaxcredits............................................................................... (251,196) -Utilizationofnetoperatinglosscarryforwardsand researchanddevelopmenttaxcredits.......................................... (502,350) -(Decrease)invaluationallowance................................................... (86,167) (288,595)Incometaxexpense(benefit).......................................................... $(290,519) $ 14,500
Currentfederalandstateincometaxes.......................................... $ 46,844 $ 14,500Recognitionofdeferredtaxassets.................................................. (86,167) -Statetaxcredits............................................................................... (251,196) -Incometaxexpense(benefit).......................................................... $(290,519) $ 14,500
Thenetdeferredtaxassetiscomprisedofthefollowing:
February29, February28, 2012 2011Inventory........................................................................................... $ 126,000 $ 135,000Allowanceforaccountsreceivable.................................................. 10,000 -Accruedexpensesandother........................................................... 91,000 60,000Netoperatinglosses........................................................................ - 541,000Researchtaxcredits........................................................................ 110,000 -Deferredtaxasset............................................................................ 337,000 736,000Deferredtaxliability.......................................................................... (251,000) (152,000)Valuationallowance......................................................................... - (584,000)Netdeferredtaxasset...................................................................... $ 86,000 $ -
Thechangeinthevaluationallowancewas$584,000fortheyearendedFebruary28,2012.Thechangerepresentsa$584,000decreaseinthenetoperatinglossvaluationallowance,theutilizationof$502,000ofthenetoperatinglosscarryforwardassetandresearchanddevelopmenttaxcredits,recognitionof$86,000oftimingdifferences,inclusiveofresearchanddevelopmenttaxcreditscarriedforwardanda$24,000decreaseinprioryearstimingdifferences.
AtFebruary29,2012,theCompanyhasnonetoperatinglosscarryforwardsremainingbutdoeshave$110,000ofresearchanddevelopmenttaxcreditsbeingcarriedforward.
NOTES TO CONSOLIDATED FINANCIAL STATEMENTS
26
NOTE 12: STOCKHOLDERS’ EQUITY
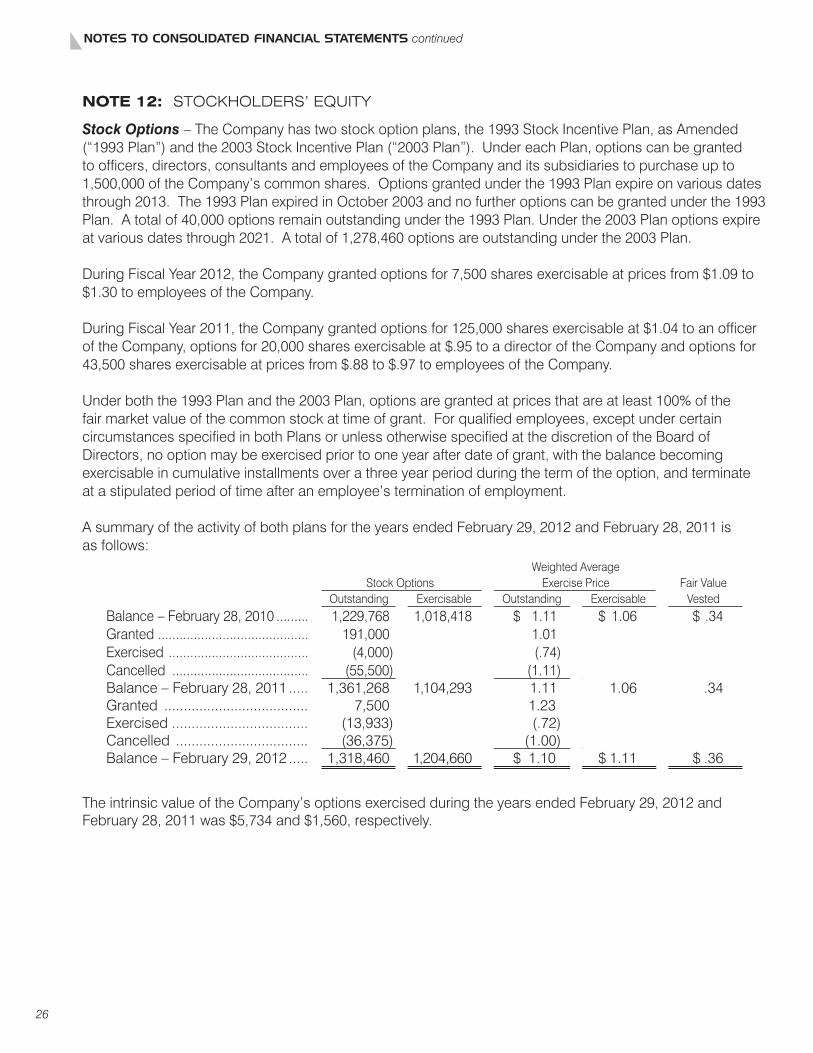
Stock Options –TheCompanyhastwostockoptionplans,the1993StockIncentivePlan,asAmended(“1993Plan”)andthe2003StockIncentivePlan(“2003Plan”).UndereachPlan,optionscanbegrantedtoofficers,directors,consultantsandemployeesoftheCompanyanditssubsidiariestopurchaseupto1,500,000oftheCompany’scommonshares.Optionsgrantedunderthe1993Planexpireonvariousdatesthrough2013.The1993PlanexpiredinOctober2003andnofurtheroptionscanbegrantedunderthe1993Plan.Atotalof40,000optionsremainoutstandingunderthe1993Plan.Underthe2003Planoptionsexpireatvariousdatesthrough2021.Atotalof1,278,460optionsareoutstandingunderthe2003Plan.
DuringFiscalYear2012,theCompanygrantedoptionsfor7,500sharesexercisableatpricesfrom$1.09to$1.30toemployeesoftheCompany.
DuringFiscalYear2011,theCompanygrantedoptionsfor125,000sharesexercisableat$1.04toanofficeroftheCompany,optionsfor20,000sharesexercisableat$.95toadirectoroftheCompanyandoptionsfor43,500sharesexercisableatpricesfrom$.88to$.97toemployeesoftheCompany.
Underboththe1993Planandthe2003Plan,optionsaregrantedatpricesthatareatleast100%ofthefairmarketvalueofthecommonstockattimeofgrant.Forqualifiedemployees,exceptundercertaincircumstancesspecifiedinbothPlansorunlessotherwisespecifiedatthediscretionoftheBoardofDirectors,nooptionmaybeexercisedpriortooneyearafterdateofgrant,withthebalancebecomingexercisableincumulativeinstallmentsoverathreeyearperiodduringthetermoftheoption,andterminateatastipulatedperiodoftimeafteranemployee’sterminationofemployment.
AsummaryoftheactivityofbothplansfortheyearsendedFebruary29,2012andFebruary28,2011isasfollows:
WeightedAverage StockOptions ExercisePrice FairValue Outstanding Exercisable Outstanding Exercisable Vested
Balance–February28,2010......... 1,229,768 1,018,418 $ 1.11 $ 1.06 $ .34Granted.......................................... 191,000 1.01 Exercised....................................... (4,000) (.74) Cancelled...................................... (55,500) (1.11) Balance–February28,2011..... 1,361,268 1,104,293 1.11 1.06 .34Granted..................................... 7,500 1.23 Exercised................................... (13,933) (.72)Cancelled.................................. (36,375) (1.00)Balance–February29,2012..... 1,318,460 1,204,660 $ 1.10 $1.11 $.36
TheintrinsicvalueoftheCompany’soptionsexercisedduringtheyearsendedFebruary29,2012andFebruary28,2011was$5,734and$1,560,respectively.
NOTES TO CONSOLIDATED FINANCIAL STATEMENTS continued
27SONO•TEK Corporation 2012 ANNUAL REPORT
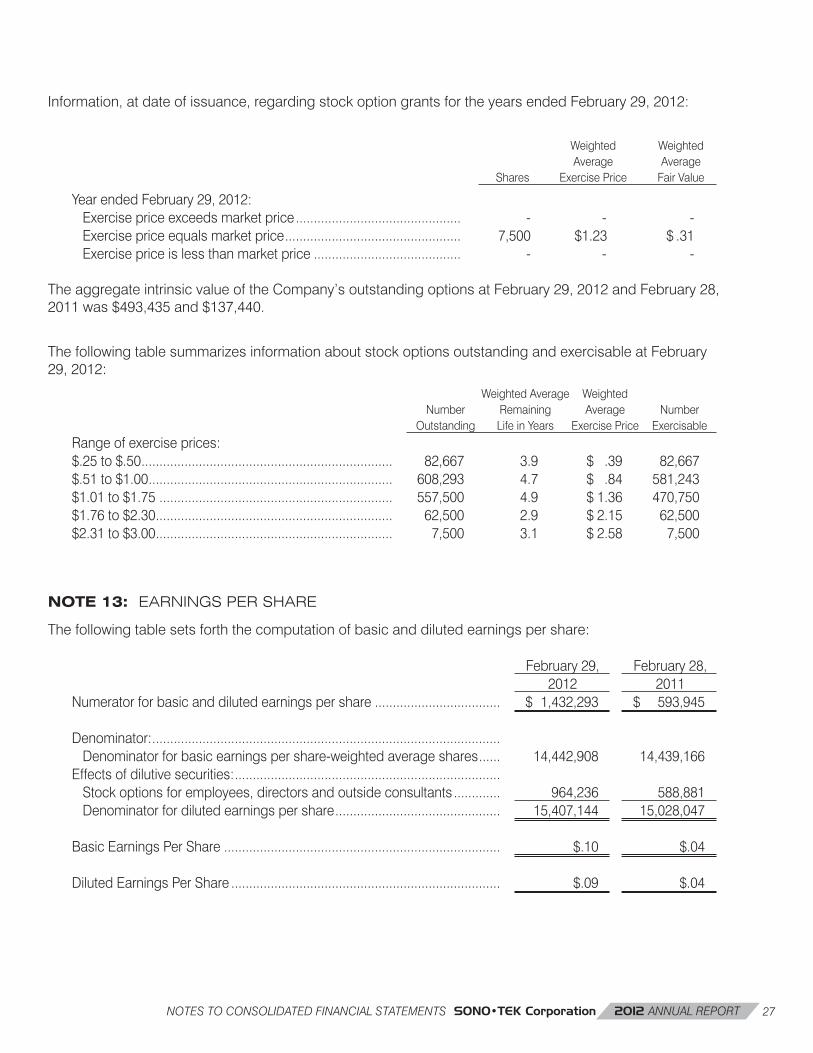
Information,atdateofissuance,regardingstockoptiongrantsfortheyearsendedFebruary29,2012:
Weighted Weighted Average Average Shares ExercisePrice FairValue
YearendedFebruary29,2012: Exercisepriceexceedsmarketprice.............................................. - - -Exercisepriceequalsmarketprice................................................. 7,500 $1.23 $.31Exercisepriceislessthanmarketprice......................................... - - -
TheaggregateintrinsicvalueoftheCompany’soutstandingoptionsatFebruary29,2012andFebruary28,2011was$493,435and$137,440.
ThefollowingtablesummarizesinformationaboutstockoptionsoutstandingandexercisableatFebruary29,2012:
WeightedAverage Weighted Number Remaining Average Number Outstanding LifeinYears ExercisePrice Exercisable
Rangeofexerciseprices: $.25to$.50...................................................................... 82,667 3.9 $ .39 82,667$.51to$1.00.................................................................... 608,293 4.7 $ .84 581,243$1.01to$1.75................................................................. 557,500 4.9 $1.36 470,750$1.76to$2.30.................................................................. 62,500 2.9 $2.15 62,500$2.31to$3.00.................................................................. 7,500 3.1 $2.58 7,500
NOTE 13: EARNINGS PER SHARE
Thefollowingtablesetsforththecomputationofbasicanddilutedearningspershare:
February29, February28, 2012 2011
Numeratorforbasicanddilutedearningspershare................................... $ 1,432,293 $ 593,945
Denominator:................................................................................................. Denominatorforbasicearningspershare-weightedaverageshares...... 14,442,908 14,439,166Effectsofdilutivesecurities:.......................................................................... Stockoptionsforemployees,directorsandoutsideconsultants............. 964,236 588,881Denominatorfordilutedearningspershare.............................................. 15,407,144 15,028,047
BasicEarningsPerShare............................................................................. $.10 $.04
DilutedEarningsPerShare........................................................................... $.09 $.04
NOTES TO CONSOLIDATED FINANCIAL STATEMENTS

28
COMMON STOCKPrior to February 21, 2011, our Common Stock traded in the over-the-counter market on the OTC Bulletin Board. Since February 22, 2011 our common stock has been traded on the over-the-counter QB platform. The following table sets forth the range of high and low closing bid quotations for our Common Stock for the periods indicated.
YEAR ENDED FEBRUARY 29, FEBRUARY 28, 2012 2011 HIGH LOW HIGH LOW
First Quarter ............................................................................... $ 1.45 $ 1.02 $ 1.13 $ 0.95Second Quarter ......................................................................... 1.45 1.13 1.00 0.86Third Quarter ............................................................................. 1.38 1.07 1.05 0.70Fourth Quarter ........................................................................... 1.30 0.88 1.06 0.92
The above quotations are believed to represent inter-dealer quotations without retail markups, markdowns or commissions and may not represent actual transactions.
As of February 29, 2012, there were 195 shareholders of record of our Common Stock, according to our stock transfer agent. We estimate that we have between 1,000 and 1,400 beneficial shareholders of our common stock. The difference between the shareholders of record and the total shareholders is due to stock being held in street names at our transfer agent.
We have not paid any cash dividends on our Common Stock since inception. We intend to retain earnings, if any, for use in our business and for other corporate purposes.
NOTE 14: SIGNIFICANT CUSTOMERS AND FOREIGN SALES
ExportsalestocustomerslocatedoutsidetheUnitedStateswereapproximatelyasfollows:
February29, February28, 2012 2011WesternEurope............................................................................... $2,832,000 $1,252,000FarEast............................................................................................ 4,053,000 3,841,000Other................................................................................................ 500,000 531,000 $7,385,000 $5,624,000
DuringFiscalYears2012and2011,salestoforeigncustomersaccountedforapproximately$7,385,000and$5,624,000,or62%and57%respectively,oftotalrevenues.
Onecustomeraccountedfor6.7%oftheCompany’ssalesforFiscalYearendedFebruary29,2012.
NOTE 15: SUBSEQUENT EVENTS
TheCompanyhasevaluatedsubsequenteventsfordisclosurepurposes.
NOTES TO CONSOLIDATED FINANCIAL STATEMENTS continued
COMMON STOCK
Directors
Christopher L. Coccio, Ph.D. - Chairman and CEO
Joseph Riemer, Ph.D. - President
Samuel Schwartz - Chairman Emeritus and former Chairman of the Board, retired Chairman and CEO of Krystinel Corporation.
Edward J. Handler, Esq. - Compensation and Audit Committees, retired partner from Kenyon and Kenyon intellectual property law firm, President and COO of The Bronx Project, Inc., past President of the West Point Society of New York.
Eric Haskell, CPA - Audit Committee, former Executive Vice President and Chief Financial Officer of SunCom Wireless Holdings, Inc., former Chief Financial Officer of Systems & Computer Technology Corp.
Philip A. Strasburg, CPA - Compensation Committee, Certified Public Accountant in New York State, retired partner from Anchin Block and Anchin accounting firm, Chairman of the Audit Committee.
Donald F. Mowbray, Ph.D. - Chairman of Compensation Committee, Independent Consultant, Retired head of General Electric’s Corporate R&D Mechanical Engineering Laboratory.
Executive Officers
Christopher L. Coccio, Ph.D. - Chairman and CEO
Joseph Riemer, Ph.D. - President
Stephen J. Bagley, CPA - Chief Financial Officer
R. Stephen Harshbarger - Executive Vice President and Director of Electronics & Advanced Energy
Corporate Headquarters
2012 Route 9WMilton, NY 12547 USAPhone: 845.795.2020Fax: 845.795.2720
Corporate Website
http://www.sono-tek.com
Corporate E-mail
CORPORATE DIRECTORY
SONO•TEK Corporation 2012 ANNUAL REPORT 29

2012 Route 9W Milton, NY USA T(845) 795.2020 F(845) 795.2720 Email: [email protected] Internet: www.sono-tek.com


![[845-10] Nonmonetary Transactions - Overall · [845-10] Nonmonetary Transactions - Overall [845-10-00] Overall - Status General ... Exchanges of a nonfinancial asset for a noncontrolling](https://img.pdfslide.us/doc/110x75/5ae138b67f8b9a1c248e22b3/845-10-nonmonetary-transactions-845-10-nonmonetary-transactions-overall-845-10-00.jpg)