Embed Size (px)
Citation preview

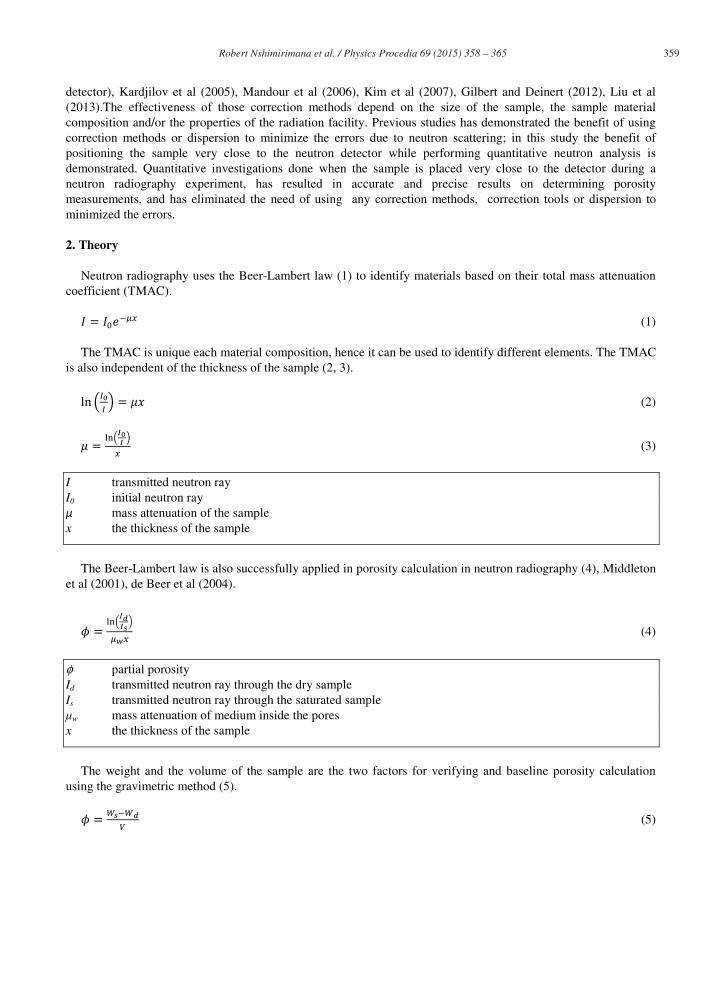
Physics Procedia 69 ( 2015 ) 358 – 365
Available online at www.sciencedirect.com
1875-3892 © 2015 The Authors. Published by Elsevier B.V. This is an open access article under the CC BY-NC-ND license (http://creativecommons.org/licenses/by-nc-nd/4.0/).Selection and peer-review under responsibility of Paul Scherrer Institutdoi: 10.1016/j.phpro.2015.07.050
ScienceDirect
10 World Conference on Neutron Radiography 5-10 October 2014
Precision of Porosity Calculation from “Material Stopping Power” Using Neutron Radiography
Robert Nshimirimana*a, Mabuti Radebea, Frikkie de Beera aSouth African Nuclear Energy Corporation (Necsa), P.O Box 582, Pretoria 0001, South Africa
Abstract
The ability of digital neutron radiography to determine several important physical properties (e.g. porosity) of porous media and to identify the location of constituencies inside the sample in a non-destructive manner, are of great important in the fields of nuclear waste encapsulation and –shielding, civil engineering and geological studies. Unfortunately material thickness and radiation scatter hamper the accuracy and precision of measurements. Correction methods are used to minimize the effect of neutron scattering in quantitative analysis neutron radiography experiment. To further minimize the error due to neutron scattering, it is advisable to position the sample as far away as possible from the neutron detector when perform quantitative neutron radiography. That requires the trade between sharpness and neutron scattering. In this work the neutron radiography quantitative experiments were performed when the samples are placed too close ( 0.1 cm) to the detector; and accurate results of porosity measurement were obtained without applying any neutron scattering correction tool or method.
© 2015 The Authors. Published by Elsevier B.V. Selection and peer-review under responsibility of Paul Scherrer Institut.
Keywords: porosity; masse attenuation cofficient; stopping power; gravimetric. neutron scattering
1. Introduction
Quantitative investigation using neutron radiography (NRAD) is associated with errors due to neutron scattering and the neutron energy spectrum, Hassanein et al (2005), Deinert et al (2005), Moradi et al (2009), Fijał-Kirejczyk et al (2010), and Kang et al (2013). Errors due to neutron scattering are being corrected using software tools, a scatter grid, controlling the sample size or by dispersion (increase the distance between the sample and the
* Corresponding author. Tel.: +27123055638 E-mail address: [email protected]
© 2015 The Authors. Published by Elsevier B.V. This is an open access article under the CC BY-NC-ND license (http://creativecommons.org/licenses/by-nc-nd/4.0/).Selection and peer-review under responsibility of Paul Scherrer Institut
Robert Nshimirimana et al. / Physics Procedia 69 ( 2015 ) 358 – 365 359
detector), Kardjilov et al (2005), Mandour et al (2006), Kim et al (2007), Gilbert and Deinert (2012), Liu et al (2013).The effectiveness of those correction methods depend on the size of the sample, the sample material composition and/or the properties of the radiation facility. Previous studies has demonstrated the benefit of using correction methods or dispersion to minimize the errors due to neutron scattering; in this study the benefit of positioning the sample very close to the neutron detector while performing quantitative neutron analysis is demonstrated. Quantitative investigations done when the sample is placed very close to the detector during a neutron radiography experiment, has resulted in accurate and precise results on determining porosity measurements, and has eliminated the need of using any correction methods, correction tools or dispersion to minimized the errors.
2. Theory
Neutron radiography uses the Beer-Lambert law (1) to identify materials based on their total mass attenuation coefficient (TMAC).
(1)
The TMAC is unique each material composition, hence it can be used to identify different elements. The TMAC is also independent of the thickness of the sample (2, 3).
(2)
(3)
I transmitted neutron ray I0 initial neutron ray
mass attenuation of the sample x the thickness of the sample
The Beer-Lambert law is also successfully applied in porosity calculation in neutron radiography (4), Middleton et al (2001), de Beer et al (2004).
(4)
φ partial porosity Id transmitted neutron ray through the dry sample Is transmitted neutron ray through the saturated sample
w mass attenuation of medium inside the pores x the thickness of the sample
The weight and the volume of the sample are the two factors for verifying and baseline porosity calculation using the gravimetric method (5).
(5)

360 Robert Nshimirimana et al. / Physics Procedia 69 ( 2015 ) 358 – 365
φ partial porosity Ws weight of the sample when saturated Wd weight of the sample when dry V volume of the sample
Experimental
3.1. Procedure
Ideally, the porosity measured applying the 2 different techniques depicted equation (4) and equation (5) on the same sample should give similar results. The discrepancy is mostly due to the detection of multi-scattering of neutrons by the sample or the environment (Fig 1) when detected alongside the direct neutron beam. Liquid water, as contrast agent and - despite being a highly scattering material, is mostly used in neutron radiography for porosity calculation.
Fig. 1. Schematic diagram of neutron scattering from the sample or the environment on the scintillator detector. The scattered neutrons contribute to the error in porosity measurement using neutron radiography.
Multi-scattering effects increases with the thickness of the sample, hence the experimental calculation of for water as example, is not constant and this contradict the theoretical prediction as per equation-3; it varies mostly due to the increase in water thickness. The non-linearity of the experimental value of for water calls on calibration in advance when is being practically determined using different thickness of water. In case the pores of the sample are saturated with water, the experimental value of is used in porosity measurement. The porosity results calculated from neutron radiography were compared with the porosity results obtained from the conventional gravimetric method being used in this study.
In this study the water thickness Calibration performed (Fig. 2) when the samples were place very close (at 0.1 cm) to the neutron detector (Fig. 3).
3.2. Experimental setup and data processing
The porosity measurement experiment were done at the neutron radiography facility at Necsa and repeated at the neutron radiography facility at Kaeri. At the neutron radiography at Necsa, a neutron scintillation screen (6LiF/ZnS: Cu,Al, Au) and Peltier-cooled (1024 x1024) CCD camera, de Beer (2005) were used in neutron detection while at Kaeri neutron facility, a Li6-based scintillator and L DW CCD camera (2048 x 2048) were used, Sim et al (2014), Sim et al (2004).

Robert Nshimirimana et al. / Physics Procedia 69 ( 2015 ) 358 – 365 361
Fig. 2. Different thickness (1 to 10 mm) of aluminium containers were used in water thickness calibration for .
Fig. 3. Schematic representation of sample position during water thickness calibration and porosity measurement. The sample is positioned
as close as possible to the neutron detector.
During the neutron radiography scan, the samples were positioned at the same area and at the closest position to the neutron detector as shown in Fig. 3, meaning that the sample to detector position was minimized ( 0.1 cm). Concrete and mortar (Fig. 4) were used as porous media samples; the thickness of porous media samples varied between 1.5 and 1.7 cm. Table 1 describes the set up parameters used in 2D-neutron radiography porosity experiments. There are, however, a couple of parameters, unique to any neutron radiography facility, which cannot be changed to standardize and thus compare 1-1 based research results, but the principle can be applied successfully despite the differences.
Table 1. Experimental set up parameter.Parameters Neutron radiography at Necsa Neutron radiography at Kaeri
Sample position from the scintillator screen (cm) 0.1 0.1
Number of radiographs of each sample 3 5
Exposure time (second) 20 20
Field of view (cm) 10 x 10 15.5 x 15
Detector pixel size (cm) 0.0098 0.0111
Spatial resolution (cm/pixel) 0.0097 0.0111
Number of dark current images 3 5
Number of flat field (open beam) radiographs 3 5
Sample thickness (cm) 1.4 ~ 1.7 1.4 ~ 1.7

362 Robert Nshimirimana et al. / Physics Procedia 69 ( 2015 ) 358 – 365
Fig. 4. Examples of porous media sample used in the experiment. Mortars (left) and concretes (right). The height varies from 5 to 7 cm, the
width from 4.5 to 5 cm and the thickness from 1.4 to 1.7 cm.
The data processing of radiographs were done consecutively as follow:
• Obtain of the averaged neutron radiograph from multiple radiographs within the raw data • Removal of the remaining white spots in the averaged radiograph • Normalization of the averaged radiograph for each sample to the averaged open beam radiograph • Subtraction of the averaged dark current image from the averaged radiograph for each sample
The intensity Id and Is (see equation 4) were calculated from the average of gray value pixels in the region of interest as shown in Fig 5.
Fig. 5. Region of interest: Intensity values of Id which is the gray value of the dry sample (a,c) and the values of Is as the gray values of the
saturated samples (b, d) were measure as the average value of the region of the interest (red box in the images) on porous media samples.
4. Result and discussion
The set up shown in Fig. 3. where the sample is positioned at a distance as close as possible to the neutron detector, increases the probability of:• The scattered neutrons from the sample to be detected in the region of interest. • The scattered neutron from the environment to have passed through the sample when they are detected in the
region of interest.
The contribution of the scattered neutrons to the transmitted beam did not in this case impact negatively on water thickness calibration as shown in Fig. 6.

Robert Nshimirimana et al. / Physics Procedia 69 ( 2015 ) 358 – 365 363
Fig. 6. Result of Water thickness calibration of when the samples were scanned very close to the neutron detector. Radiographs of
different thickness of water and empty containers (left); the resulting graph (right) is linear as predicted in equation (2). The results were
confirmed at both neutron radiography facilities at Kaeri, Korea and Necsa, South Africa.
Both water thickness calibration from Necsa and Kaeri shows the results of a linear graph of similar coefficient as the thickness of water increases. The value ( 1.07 cm-1) of the coefficient of the graphs is far different from the theoretical literature value (3.47 cm-1) of mass attenuation coefficient of water. The difference is due to the contribution of the scattering component of the neutron beam as expected. The theoretical literature value (3.47 cm-1) is calculated without taking into account the multi- scattering effects.
Despite the different between the experimental value and the theoretical literature value of , there was no neutron scattering correction done to correct the experimental value ( 1.07 cm-1) of The reasoning is that the experimental value of the calibrated when the sample is very close ( 0.1cm distance between the detector and the sample) fit very well in the Beer-Lambert law. Hence the experimental value ( 1.07 cm-1) was used in equation (4) to calculate the porosity of mortars and concrete samples. The results of calculation were in good agreement (Fig. 7, and table 2,3) with porosity results from the conventional gravimetric analytic method.
Fig. 7. Porosity calculation using neutron radiography and gravimetric method Measurement done at Necsa (left), measurement done at Kaeri (right). The neutron radiography scans were done when the sample was as close as possible to the neutron detector position and all the
calculation were done without any neutron scattering correction.

364 Robert Nshimirimana et al. / Physics Procedia 69 ( 2015 ) 358 – 365
Table 2. Results of experiments performed at Kaeri. Difference between the porosity ( ) calculated using neutron radiograph and gravimetric methods. All the samples were placed very close to the detector ( 0.1 cm from the scintillator screen) and the calculations were done without any neutron scattering correction.
Concrete id Thickness (cm) Neutron radiography Gravimetric Difference
C-1-6 1.52 11.79% 10.08% 1.71%
C-1-8 1.60 11.11% 10.07% 1.04%
C-1-4 1.58 12.25% 9.99% 2.26%
C-1-5 1.49 11.59% 10.40% 1.19%
Table 3. Difference between the porosity ( ) calculated using neutron radiograph and gravimetric method. Experiments were performed at Necsa. All the samples were placed very close to the detector ( 0.1 cm from the scintillator screen) and the calculations were done without any neutron scattering correction.
Concrete id Thickness (cm) Neutron radiography Gravimetric Difference
C1-1 1.70 8.48% 8.31% 0.17%
C 1-2 1.53 11.78% 9.43% 2.36%
C 1-3 1.59 10.07% 9.68% 0.39%
C 1-4 1.58 11.00% 9.84% 1.15%
C 1-5 1.49 10.27% 9.47% 0.80%
C 1-6 1.52 11.01% 9.72% 1.29%
C 1-7 1.58 12.83% 11.88% 0.95%
C 1-8 1.60 11.90% 10.91% 0.99%
C 1-9 1.47 11.38% 10.32% 1.06%
C 1-10 1.50 12.26% 10.73% 1.53%
5. Conclusion
It was found that there is an agreement of porosity determination using the conventional gravimetric method and neutron radiography when the sample is positioned very close ( 0.1 cm) to the detector. The agreement is being observed without any neutron scattering correction made on either the water calibration radiographs or thus the porosity measurements. Hence there is no need to use software tools, a scatter grid or dispersion to correct for the neutron scattering when the sample is very close ( 0.1 cm) to the detector.
So far a 10 mm maximum thickness of water was used during calibration; further investigation is needed to determine the maximum “safe” thickness of water calibration at the detector position. The experimentalcalculated when the sample is very close ( 0.1 cm) is called the “material stopping power”. Future studies are required to investigate the use of the “material stopping power” principle to successfully identify chemical elements or compound material within the sample. Future studies will also include the determination of the thickest sample to be radiographed in this position without applying scattering correction methods in order to correlate with high degree with e.g. the gravimetric method.
Acknowledgements`
The author would like to thank Necsa and KAERI teams for providing their neutron radiography facilities for this study.
Robert Nshimirimana et al. / Physics Procedia 69 ( 2015 ) 358 – 365 365
References
De Beer, F.C., Middleton, M.F., Hilson, J. (2004) Neutron radiography of porous rocks and iron ore, Appl. Radiat. Isotopes, 61, (4) , p 487. De Beer, F.C. 2005. Characteristics of the neutron/X-ray tomography system at the SANRAD facility in South Africa. Nuclear Instruments And
Methods In Physics Research A 542: 1-8. Deinert, M.R., Lowe, C.W., Cady, K.B., Unlu, K., Parlange, J.Y. 2005. Performance and calibration of a neutron image intensifier tube based
real-time radiography system. IEEE Trans. Nucl. Sci. 52(1), 349-355. Fijał-Kirejczyk, I., Milczarek, J.J., Banaszak, J., oł dek, J., Trzci ski, A., 2010. Drying of Kaolin Clay cylinder: Dynamic neutron
radiography studies. Defect and Diffusion Forum 508, 297-512. Gilbert, A.J., Deinert, M.R., 2012. Quantitative imaging of freezing at the millimeter scale using neutron radiography. Nuclear Instruments and
Methods in Physics Research A 671, 118-124. Hassanein, R., Lehmann, E., Vontobel, P., 2005. Methods of scattering corrections for quantitative neutron radiography. Nuclear Instruments
and Methods in Physics Research A 542, 353-360. Kang, M., Bilheux, H.Z., Voisin, S., Cheng, C.L., Perfect, E., Horita, J., Warren, J.M., 2013. Water calibration measurement for neutron
radiography: Application to water content quantification in porous media. Kardjilov, N., de Beer, F.C., Hassanein, R., Lehmann, E., Vontobel, P., 2005. Scattering corrections in neutron radiography using point
scattered functions. Nuclear Instruments and Methods in Physics Research A 542, 336-341. Kim, T., Kim, J., Kim, M.H., Sim, C., 2007. Accurate measurement technique of water thickness in Al block by using grid method.
Transactions of the Korean Nuclear Society Spring Meeting, Jeju, May 10-11. Liu, S., B cherl, T., Li, H., Zou, Y., Lu, Y., Guo, Z., 2013. Corrections on energy spectrum and scatterings for fast neutron radiography at
Nectar facility. Chinese Phys. C. 37, 118201, doi:10.1088/1674-1137/37/11/118201. Mandour, M.A., Shaat, M.K., Badawi, A.A., Mongy, T., Mohamed, N.M.A., 2006. Removal Of Scattered Thermal Neutrons Using Antiscatter
Grid. Nuclear Instruments And Methods In Physics Research A 568: 810-815. Middleton, M.F., Pázsit, I., Solymar, M., 2001. Petrophysical Application of Neutron Radiography. Nondestr. Test. Eval., Vol. 16, 321-333. Moradi, A.B., Conesa, H.M., Robinson, B., Lehmann, E., Kuehne, G., Kaestner, A., Oswald, S., Schulin, R., 2009. Neutron radiography as a
tool for revealing root development in soil: capabilities and limitations. Plant Soil 318, 243-255. Sim, C.M., Oh, H.S., Kim, T.J., Lee, Y.S., Kim, Y.K., Kwak, S.S., Hwang, Y.H., 2014. Detecting Internal Hot Corrosion of In-service Turbine
Blades using Neutron Tomography with Gd Tagging. Journal of Nondestructive Evaluation 33, 493-503. Sim, C.M., Nam, K., Lim, I., Lee, C., Choi, H., 2004. Characterization of HANARO neutron radiography facility in accordance with ASTM
standard E545-91/E803-91 for KOLAS/IS017025.