Embed Size (px)
DESCRIPTION
Citation preview
arX
iv:1
205.
3494
v3 [
astr
o-ph
.CO
] 8
Jan
201
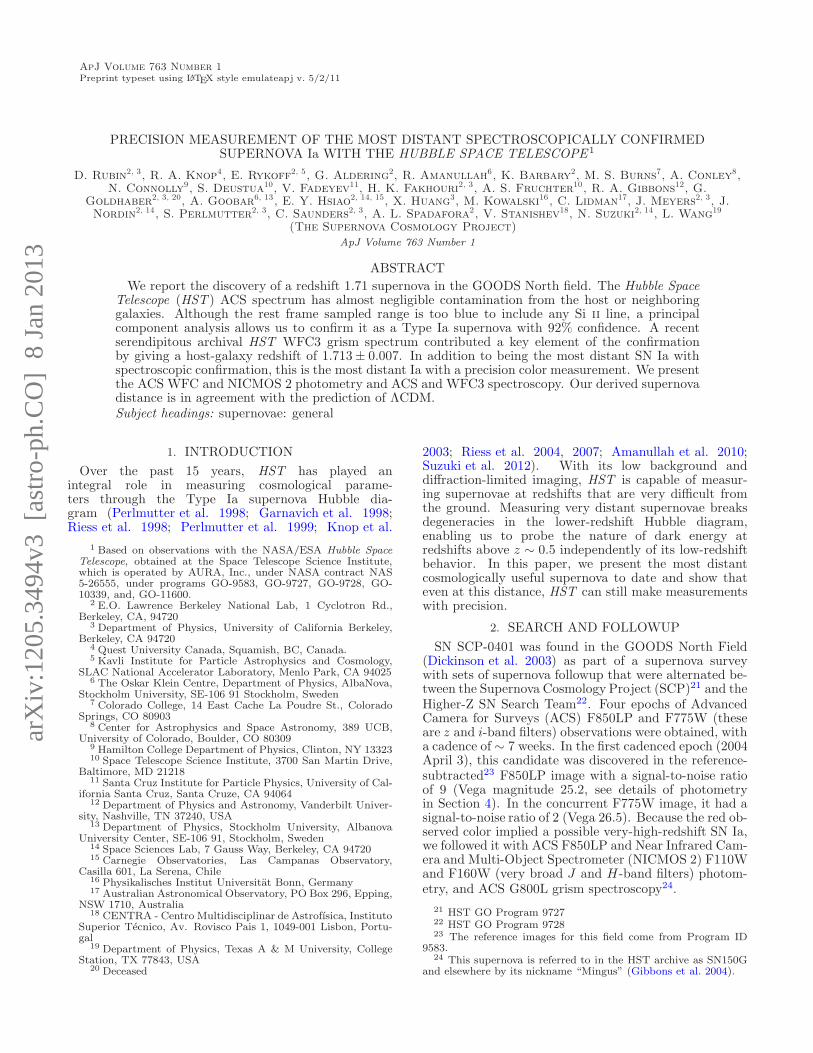
3ApJ Volume 763 Number 1Preprint typeset using LATEX style emulateapj v. 5/2/11
PRECISION MEASUREMENT OF THE MOST DISTANT SPECTROSCOPICALLY CONFIRMEDSUPERNOVA Ia WITH THE HUBBLE SPACE TELESCOPE1
D. Rubin2, 3, R. A. Knop4, E. Rykoff2, 5, G. Aldering2, R. Amanullah6, K. Barbary2, M. S. Burns7, A. Conley8,N. Connolly9, S. Deustua10, V. Fadeyev11, H. K. Fakhouri2, 3, A. S. Fruchter10, R. A. Gibbons12, G.
Goldhaber2, 3, 20, A. Goobar6, 13, E. Y. Hsiao2, 14, 15, X. Huang3, M. Kowalski16, C. Lidman17, J. Meyers2, 3, J.Nordin2, 14, S. Perlmutter2, 3, C. Saunders2, 3, A. L. Spadafora2, V. Stanishev18, N. Suzuki2, 14, L. Wang19
(The Supernova Cosmology Project)
ApJ Volume 763 Number 1
ABSTRACT
We report the discovery of a redshift 1.71 supernova in the GOODS North field. The Hubble SpaceTelescope (HST ) ACS spectrum has almost negligible contamination from the host or neighboringgalaxies. Although the rest frame sampled range is too blue to include any Si ii line, a principalcomponent analysis allows us to confirm it as a Type Ia supernova with 92% confidence. A recentserendipitous archival HST WFC3 grism spectrum contributed a key element of the confirmationby giving a host-galaxy redshift of 1.713± 0.007. In addition to being the most distant SN Ia withspectroscopic confirmation, this is the most distant Ia with a precision color measurement. We presentthe ACS WFC and NICMOS 2 photometry and ACS and WFC3 spectroscopy. Our derived supernovadistance is in agreement with the prediction of ΛCDM.Subject headings: supernovae: general
1. INTRODUCTION
Over the past 15 years, HST has played anintegral role in measuring cosmological parame-ters through the Type Ia supernova Hubble dia-gram (Perlmutter et al. 1998; Garnavich et al. 1998;Riess et al. 1998; Perlmutter et al. 1999; Knop et al.
1 Based on observations with the NASA/ESA Hubble SpaceTelescope, obtained at the Space Telescope Science Institute,which is operated by AURA, Inc., under NASA contract NAS5-26555, under programs GO-9583, GO-9727, GO-9728, GO-10339, and, GO-11600.
2 E.O. Lawrence Berkeley National Lab, 1 Cyclotron Rd.,Berkeley, CA, 94720
3 Department of Physics, University of California Berkeley,Berkeley, CA 94720
4 Quest University Canada, Squamish, BC, Canada.5 Kavli Institute for Particle Astrophysics and Cosmology,
SLAC National Accelerator Laboratory, Menlo Park, CA 940256 The Oskar Klein Centre, Department of Physics, AlbaNova,
Stockholm University, SE-106 91 Stockholm, Sweden7 Colorado College, 14 East Cache La Poudre St., Colorado
Springs, CO 809038 Center for Astrophysics and Space Astronomy, 389 UCB,
University of Colorado, Boulder, CO 803099 Hamilton College Department of Physics, Clinton, NY 1332310 Space Telescope Science Institute, 3700 San Martin Drive,
Baltimore, MD 2121811 Santa Cruz Institute for Particle Physics, University of Cal-
ifornia Santa Cruz, Santa Cruze, CA 9406412 Department of Physics and Astronomy, Vanderbilt Univer-
sity, Nashville, TN 37240, USA13 Department of Physics, Stockholm University, Albanova
University Center, SE-106 91, Stockholm, Sweden14 Space Sciences Lab, 7 Gauss Way, Berkeley, CA 9472015 Carnegie Observatories, Las Campanas Observatory,
Casilla 601, La Serena, Chile16 Physikalisches Institut Universitat Bonn, Germany17 Australian Astronomical Observatory, PO Box 296, Epping,
NSW 1710, Australia18 CENTRA - Centro Multidisciplinar de Astrofısica, Instituto
Superior Tecnico, Av. Rovisco Pais 1, 1049-001 Lisbon, Portu-gal
19 Department of Physics, Texas A & M University, CollegeStation, TX 77843, USA
20 Deceased
2003; Riess et al. 2004, 2007; Amanullah et al. 2010;Suzuki et al. 2012). With its low background anddiffraction-limited imaging, HST is capable of measur-ing supernovae at redshifts that are very difficult fromthe ground. Measuring very distant supernovae breaksdegeneracies in the lower-redshift Hubble diagram,enabling us to probe the nature of dark energy atredshifts above z ∼ 0.5 independently of its low-redshiftbehavior. In this paper, we present the most distantcosmologically useful supernova to date and show thateven at this distance, HST can still make measurementswith precision.
2. SEARCH AND FOLLOWUP
SN SCP-0401 was found in the GOODS North Field(Dickinson et al. 2003) as part of a supernova surveywith sets of supernova followup that were alternated be-tween the Supernova Cosmology Project (SCP)21 and theHigher-Z SN Search Team22. Four epochs of AdvancedCamera for Surveys (ACS) F850LP and F775W (theseare z and i-band filters) observations were obtained, witha cadence of ∼ 7 weeks. In the first cadenced epoch (2004April 3), this candidate was discovered in the reference-subtracted23 F850LP image with a signal-to-noise ratioof 9 (Vega magnitude 25.2, see details of photometryin Section 4). In the concurrent F775W image, it had asignal-to-noise ratio of 2 (Vega 26.5). Because the red ob-served color implied a possible very-high-redshift SN Ia,we followed it with ACS F850LP and Near Infrared Cam-era and Multi-Object Spectrometer (NICMOS 2) F110Wand F160W (very broad J and H-band filters) photom-etry, and ACS G800L grism spectroscopy24.
21 HST GO Program 972722 HST GO Program 972823 The reference images for this field come from Program ID
9583.24 This supernova is referred to in the HST archive as SN150G
and elsewhere by its nickname “Mingus” (Gibbons et al. 2004).
2 Rubin et al.
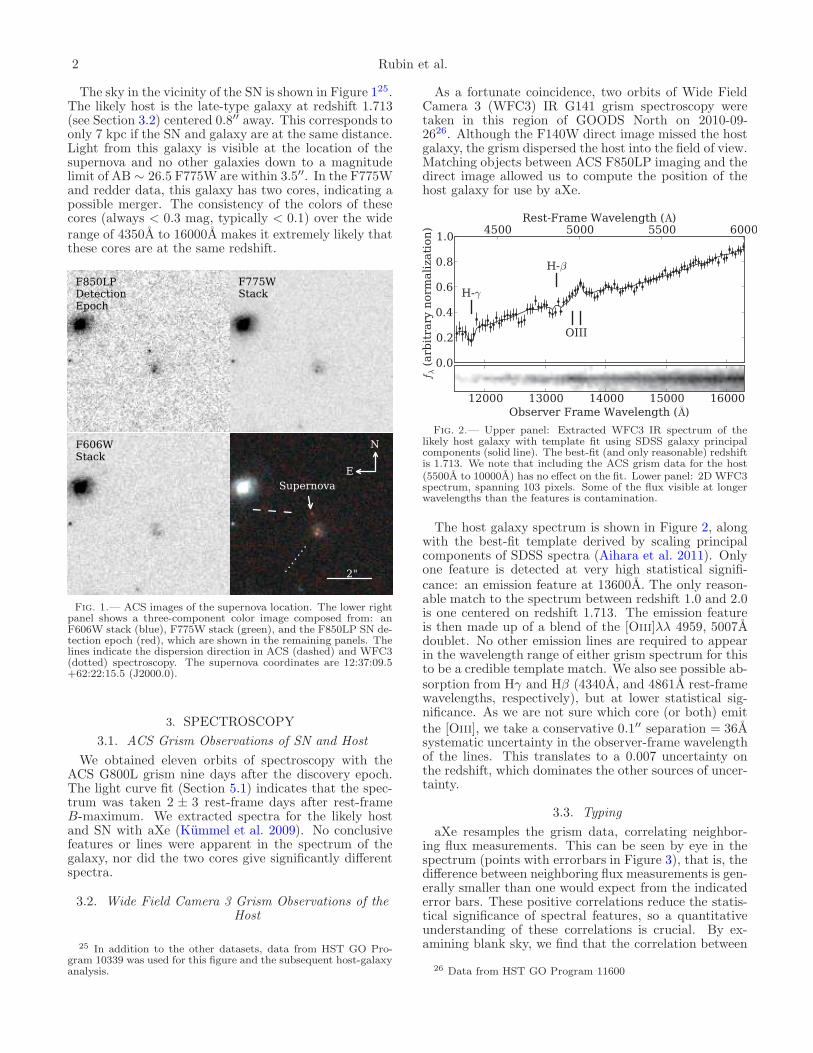
The sky in the vicinity of the SN is shown in Figure 125.The likely host is the late-type galaxy at redshift 1.713(see Section 3.2) centered 0.8′′ away. This corresponds toonly 7 kpc if the SN and galaxy are at the same distance.Light from this galaxy is visible at the location of thesupernova and no other galaxies down to a magnitudelimit of AB ∼ 26.5 F775W are within 3.5′′. In the F775Wand redder data, this galaxy has two cores, indicating apossible merger. The consistency of the colors of thesecores (always < 0.3 mag, typically < 0.1) over the widerange of 4350A to 16000A makes it extremely likely thatthese cores are at the same redshift.
F850LPDetectionEpoch
F775WStack
F606WStack
SupernovaE
N
2"
Fig. 1.— ACS images of the supernova location. The lower rightpanel shows a three-component color image composed from: anF606W stack (blue), F775W stack (green), and the F850LP SN de-tection epoch (red), which are shown in the remaining panels. Thelines indicate the dispersion direction in ACS (dashed) and WFC3(dotted) spectroscopy. The supernova coordinates are 12:37:09.5+62:22:15.5 (J2000.0).
3. SPECTROSCOPY
3.1. ACS Grism Observations of SN and Host
We obtained eleven orbits of spectroscopy with theACS G800L grism nine days after the discovery epoch.The light curve fit (Section 5.1) indicates that the spec-trum was taken 2 ± 3 rest-frame days after rest-frameB-maximum. We extracted spectra for the likely hostand SN with aXe (Kummel et al. 2009). No conclusivefeatures or lines were apparent in the spectrum of thegalaxy, nor did the two cores give significantly differentspectra.
3.2. Wide Field Camera 3 Grism Observations of theHost
25 In addition to the other datasets, data from HST GO Pro-gram 10339 was used for this figure and the subsequent host-galaxyanalysis.
As a fortunate coincidence, two orbits of Wide FieldCamera 3 (WFC3) IR G141 grism spectroscopy weretaken in this region of GOODS North on 2010-09-2626. Although the F140W direct image missed the hostgalaxy, the grism dispersed the host into the field of view.Matching objects between ACS F850LP imaging and thedirect image allowed us to compute the position of thehost galaxy for use by aXe.
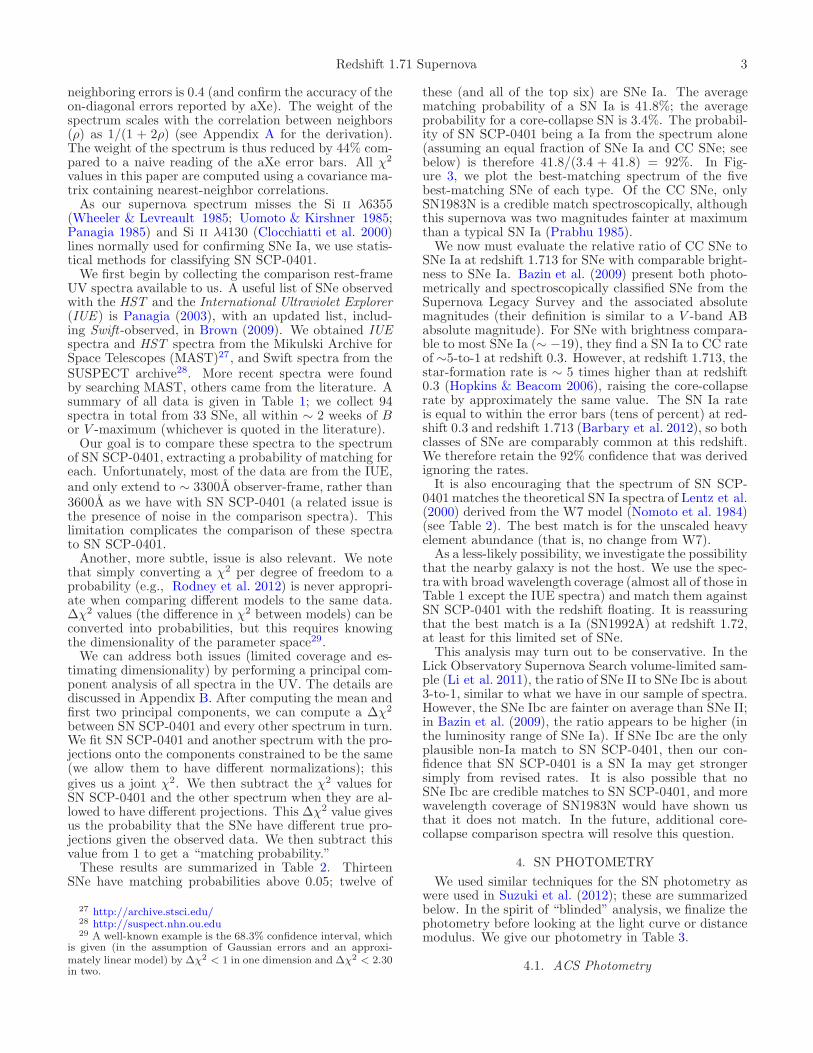
Fig. 2.— Upper panel: Extracted WFC3 IR spectrum of thelikely host galaxy with template fit using SDSS galaxy principalcomponents (solid line). The best-fit (and only reasonable) redshiftis 1.713. We note that including the ACS grism data for the host(5500A to 10000A) has no effect on the fit. Lower panel: 2D WFC3spectrum, spanning 103 pixels. Some of the flux visible at longerwavelengths than the features is contamination.
The host galaxy spectrum is shown in Figure 2, alongwith the best-fit template derived by scaling principalcomponents of SDSS spectra (Aihara et al. 2011). Onlyone feature is detected at very high statistical signifi-cance: an emission feature at 13600A. The only reason-able match to the spectrum between redshift 1.0 and 2.0is one centered on redshift 1.713. The emission featureis then made up of a blend of the [Oiii]λλ 4959, 5007Adoublet. No other emission lines are required to appearin the wavelength range of either grism spectrum for thisto be a credible template match. We also see possible ab-sorption from Hγ and Hβ (4340A, and 4861A rest-framewavelengths, respectively), but at lower statistical sig-nificance. As we are not sure which core (or both) emitthe [Oiii], we take a conservative 0.1′′ separation = 36Asystematic uncertainty in the observer-frame wavelengthof the lines. This translates to a 0.007 uncertainty onthe redshift, which dominates the other sources of uncer-tainty.
3.3. Typing
aXe resamples the grism data, correlating neighbor-ing flux measurements. This can be seen by eye in thespectrum (points with errorbars in Figure 3), that is, thedifference between neighboring flux measurements is gen-erally smaller than one would expect from the indicatederror bars. These positive correlations reduce the statis-tical significance of spectral features, so a quantitativeunderstanding of these correlations is crucial. By ex-amining blank sky, we find that the correlation between
26 Data from HST GO Program 11600
Redshift 1.71 Supernova 3
neighboring errors is 0.4 (and confirm the accuracy of theon-diagonal errors reported by aXe). The weight of thespectrum scales with the correlation between neighbors(ρ) as 1/(1 + 2ρ) (see Appendix A for the derivation).The weight of the spectrum is thus reduced by 44% com-pared to a naive reading of the aXe error bars. All χ2
values in this paper are computed using a covariance ma-trix containing nearest-neighbor correlations.As our supernova spectrum misses the Si ii λ6355
(Wheeler & Levreault 1985; Uomoto & Kirshner 1985;Panagia 1985) and Si ii λ4130 (Clocchiatti et al. 2000)lines normally used for confirming SNe Ia, we use statis-tical methods for classifying SN SCP-0401.We first begin by collecting the comparison rest-frame
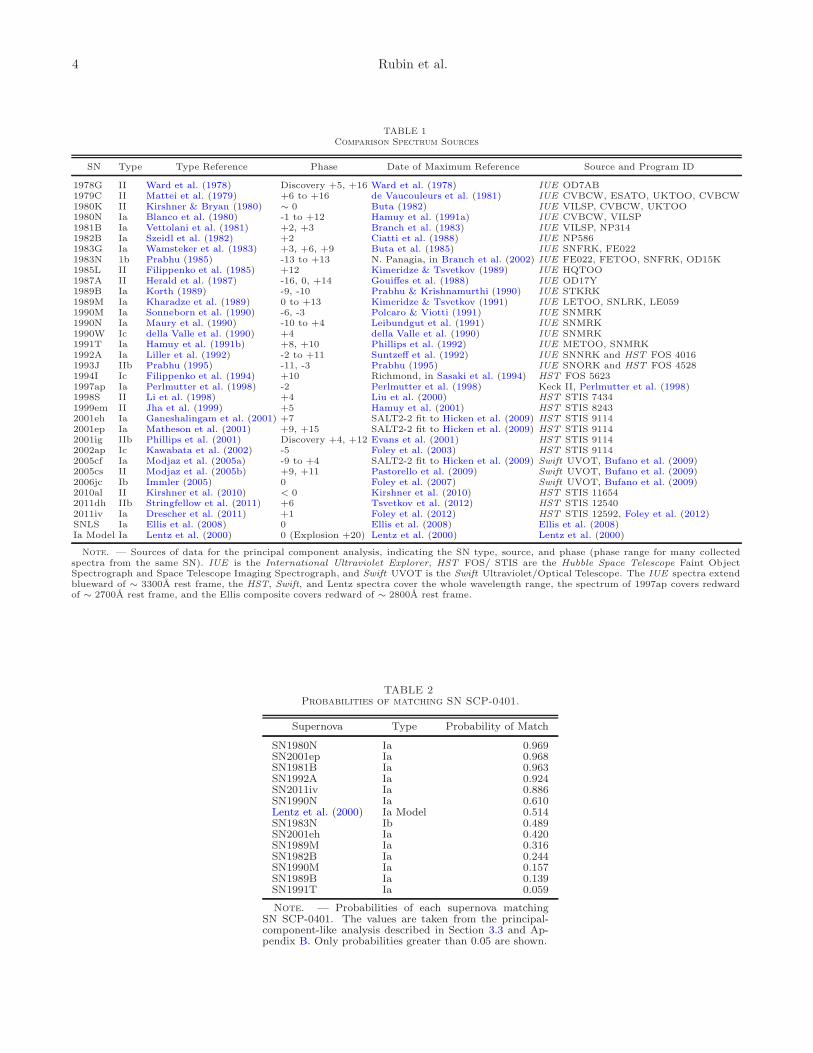
UV spectra available to us. A useful list of SNe observedwith the HST and the International Ultraviolet Explorer(IUE ) is Panagia (2003), with an updated list, includ-ing Swift -observed, in Brown (2009). We obtained IUEspectra and HST spectra from the Mikulski Archive forSpace Telescopes (MAST)27, and Swift spectra from theSUSPECT archive28. More recent spectra were foundby searching MAST, others came from the literature. Asummary of all data is given in Table 1; we collect 94spectra in total from 33 SNe, all within ∼ 2 weeks of Bor V -maximum (whichever is quoted in the literature).Our goal is to compare these spectra to the spectrum
of SN SCP-0401, extracting a probability of matching foreach. Unfortunately, most of the data are from the IUE,and only extend to ∼ 3300A observer-frame, rather than3600A as we have with SN SCP-0401 (a related issue isthe presence of noise in the comparison spectra). Thislimitation complicates the comparison of these spectrato SN SCP-0401.Another, more subtle, issue is also relevant. We note
that simply converting a χ2 per degree of freedom to aprobability (e.g., Rodney et al. 2012) is never appropri-ate when comparing different models to the same data.∆χ2 values (the difference in χ2 between models) can beconverted into probabilities, but this requires knowingthe dimensionality of the parameter space29.We can address both issues (limited coverage and es-
timating dimensionality) by performing a principal com-ponent analysis of all spectra in the UV. The details arediscussed in Appendix B. After computing the mean andfirst two principal components, we can compute a ∆χ2
between SN SCP-0401 and every other spectrum in turn.We fit SN SCP-0401 and another spectrum with the pro-jections onto the components constrained to be the same(we allow them to have different normalizations); thisgives us a joint χ2. We then subtract the χ2 values forSN SCP-0401 and the other spectrum when they are al-lowed to have different projections. This ∆χ2 value givesus the probability that the SNe have different true pro-jections given the observed data. We then subtract thisvalue from 1 to get a “matching probability.”These results are summarized in Table 2. Thirteen
SNe have matching probabilities above 0.05; twelve of
27 http://archive.stsci.edu/28 http://suspect.nhn.ou.edu29 A well-known example is the 68.3% confidence interval, which
is given (in the assumption of Gaussian errors and an approxi-mately linear model) by ∆χ2 < 1 in one dimension and ∆χ2 < 2.30in two.
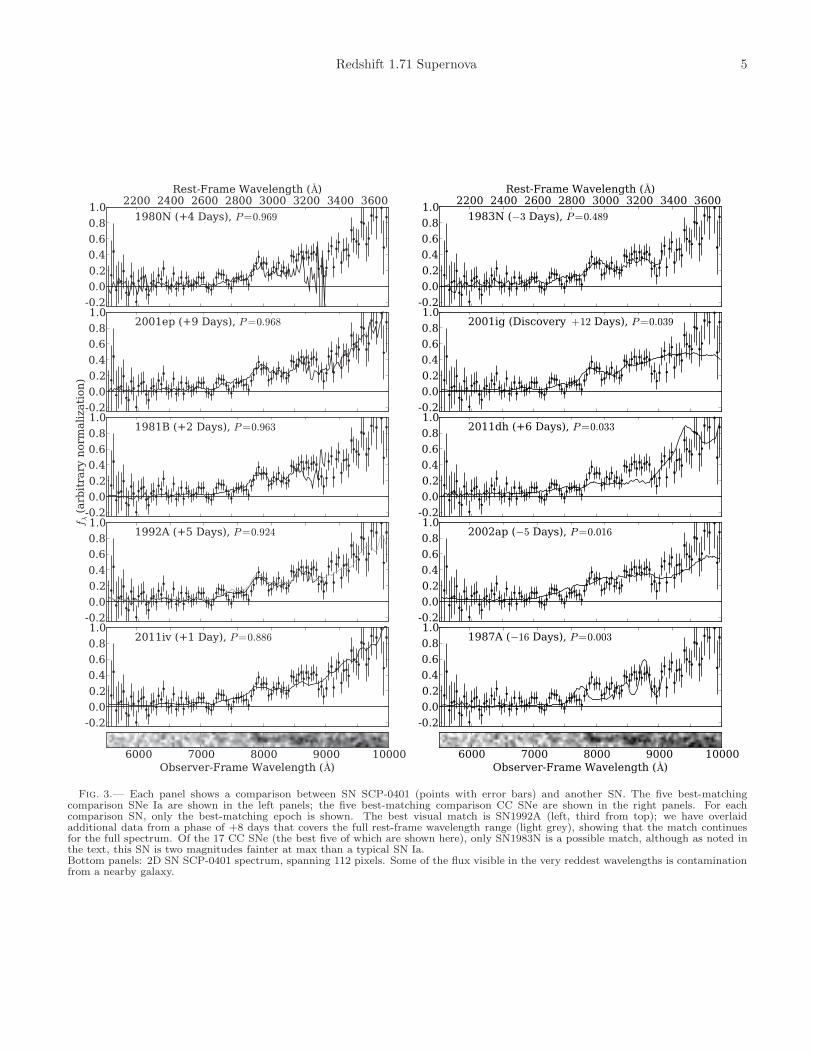
these (and all of the top six) are SNe Ia. The averagematching probability of a SN Ia is 41.8%; the averageprobability for a core-collapse SN is 3.4%. The probabil-ity of SN SCP-0401 being a Ia from the spectrum alone(assuming an equal fraction of SNe Ia and CC SNe; seebelow) is therefore 41.8/(3.4 + 41.8) = 92%. In Fig-ure 3, we plot the best-matching spectrum of the fivebest-matching SNe of each type. Of the CC SNe, onlySN1983N is a credible match spectroscopically, althoughthis supernova was two magnitudes fainter at maximumthan a typical SN Ia (Prabhu 1985).We now must evaluate the relative ratio of CC SNe to
SNe Ia at redshift 1.713 for SNe with comparable bright-ness to SNe Ia. Bazin et al. (2009) present both photo-metrically and spectroscopically classified SNe from theSupernova Legacy Survey and the associated absolutemagnitudes (their definition is similar to a V -band ABabsolute magnitude). For SNe with brightness compara-ble to most SNe Ia (∼ −19), they find a SN Ia to CC rateof ∼5-to-1 at redshift 0.3. However, at redshift 1.713, thestar-formation rate is ∼ 5 times higher than at redshift0.3 (Hopkins & Beacom 2006), raising the core-collapserate by approximately the same value. The SN Ia rateis equal to within the error bars (tens of percent) at red-shift 0.3 and redshift 1.713 (Barbary et al. 2012), so bothclasses of SNe are comparably common at this redshift.We therefore retain the 92% confidence that was derivedignoring the rates.It is also encouraging that the spectrum of SN SCP-
0401 matches the theoretical SN Ia spectra of Lentz et al.(2000) derived from the W7 model (Nomoto et al. 1984)(see Table 2). The best match is for the unscaled heavyelement abundance (that is, no change from W7).As a less-likely possibility, we investigate the possibility
that the nearby galaxy is not the host. We use the spec-tra with broad wavelength coverage (almost all of those inTable 1 except the IUE spectra) and match them againstSN SCP-0401 with the redshift floating. It is reassuringthat the best match is a Ia (SN1992A) at redshift 1.72,at least for this limited set of SNe.This analysis may turn out to be conservative. In the
Lick Observatory Supernova Search volume-limited sam-ple (Li et al. 2011), the ratio of SNe II to SNe Ibc is about3-to-1, similar to what we have in our sample of spectra.However, the SNe Ibc are fainter on average than SNe II;in Bazin et al. (2009), the ratio appears to be higher (inthe luminosity range of SNe Ia). If SNe Ibc are the onlyplausible non-Ia match to SN SCP-0401, then our con-fidence that SN SCP-0401 is a SN Ia may get strongersimply from revised rates. It is also possible that noSNe Ibc are credible matches to SN SCP-0401, and morewavelength coverage of SN1983N would have shown usthat it does not match. In the future, additional core-collapse comparison spectra will resolve this question.
4. SN PHOTOMETRY
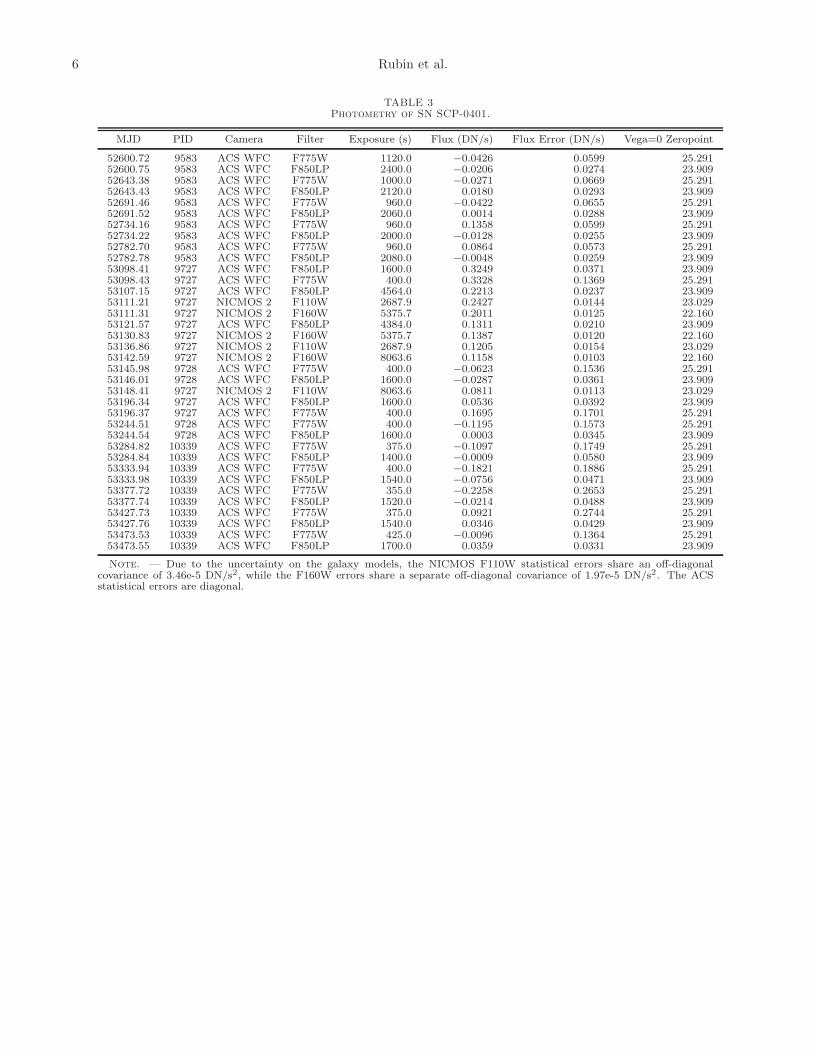
We used similar techniques for the SN photometry aswere used in Suzuki et al. (2012); these are summarizedbelow. In the spirit of “blinded” analysis, we finalize thephotometry before looking at the light curve or distancemodulus. We give our photometry in Table 3.
4.1. ACS Photometry
4 Rubin et al.
TABLE 1Comparison Spectrum Sources
SN Type Type Reference Phase Date of Maximum Reference Source and Program ID
1978G II Ward et al. (1978) Discovery +5, +16 Ward et al. (1978) IUE OD7AB1979C II Mattei et al. (1979) +6 to +16 de Vaucouleurs et al. (1981) IUE CVBCW, ESATO, UKTOO, CVBCW1980K II Kirshner & Bryan (1980) ∼ 0 Buta (1982) IUE VILSP, CVBCW, UKTOO1980N Ia Blanco et al. (1980) -1 to +12 Hamuy et al. (1991a) IUE CVBCW, VILSP1981B Ia Vettolani et al. (1981) +2, +3 Branch et al. (1983) IUE VILSP, NP3141982B Ia Szeidl et al. (1982) +2 Ciatti et al. (1988) IUE NP5861983G Ia Wamsteker et al. (1983) +3, +6, +9 Buta et al. (1985) IUE SNFRK, FE0221983N 1b Prabhu (1985) -13 to +13 N. Panagia, in Branch et al. (2002) IUE FE022, FETOO, SNFRK, OD15K1985L II Filippenko et al. (1985) +12 Kimeridze & Tsvetkov (1989) IUE HQTOO1987A II Herald et al. (1987) -16, 0, +14 Gouiffes et al. (1988) IUE OD17Y1989B Ia Korth (1989) -9, -10 Prabhu & Krishnamurthi (1990) IUE STKRK1989M Ia Kharadze et al. (1989) 0 to +13 Kimeridze & Tsvetkov (1991) IUE LETOO, SNLRK, LE0591990M Ia Sonneborn et al. (1990) -6, -3 Polcaro & Viotti (1991) IUE SNMRK1990N Ia Maury et al. (1990) -10 to +4 Leibundgut et al. (1991) IUE SNMRK1990W Ic della Valle et al. (1990) +4 della Valle et al. (1990) IUE SNMRK1991T Ia Hamuy et al. (1991b) +8, +10 Phillips et al. (1992) IUE METOO, SNMRK1992A Ia Liller et al. (1992) -2 to +11 Suntzeff et al. (1992) IUE SNNRK and HST FOS 40161993J IIb Prabhu (1995) -11, -3 Prabhu (1995) IUE SNORK and HST FOS 45281994I Ic Filippenko et al. (1994) +10 Richmond, in Sasaki et al. (1994) HST FOS 56231997ap Ia Perlmutter et al. (1998) -2 Perlmutter et al. (1998) Keck II, Perlmutter et al. (1998)1998S II Li et al. (1998) +4 Liu et al. (2000) HST STIS 74341999em II Jha et al. (1999) +5 Hamuy et al. (2001) HST STIS 82432001eh Ia Ganeshalingam et al. (2001) +7 SALT2-2 fit to Hicken et al. (2009) HST STIS 91142001ep Ia Matheson et al. (2001) +9, +15 SALT2-2 fit to Hicken et al. (2009) HST STIS 91142001ig IIb Phillips et al. (2001) Discovery +4, +12 Evans et al. (2001) HST STIS 91142002ap Ic Kawabata et al. (2002) -5 Foley et al. (2003) HST STIS 91142005cf Ia Modjaz et al. (2005a) -9 to +4 SALT2-2 fit to Hicken et al. (2009) Swift UVOT, Bufano et al. (2009)2005cs II Modjaz et al. (2005b) +9, +11 Pastorello et al. (2009) Swift UVOT, Bufano et al. (2009)2006jc Ib Immler (2005) 0 Foley et al. (2007) Swift UVOT, Bufano et al. (2009)2010al II Kirshner et al. (2010) < 0 Kirshner et al. (2010) HST STIS 116542011dh IIb Stringfellow et al. (2011) +6 Tsvetkov et al. (2012) HST STIS 125402011iv Ia Drescher et al. (2011) +1 Foley et al. (2012) HST STIS 12592, Foley et al. (2012)SNLS Ia Ellis et al. (2008) 0 Ellis et al. (2008) Ellis et al. (2008)Ia Model Ia Lentz et al. (2000) 0 (Explosion +20) Lentz et al. (2000) Lentz et al. (2000)
Note. — Sources of data for the principal component analysis, indicating the SN type, source, and phase (phase range for many collectedspectra from the same SN). IUE is the International Ultraviolet Explorer, HST FOS/ STIS are the Hubble Space Telescope Faint ObjectSpectrograph and Space Telescope Imaging Spectrograph, and Swift UVOT is the Swift Ultraviolet/Optical Telescope. The IUE spectra extendblueward of ∼ 3300A rest frame, the HST, Swift, and Lentz spectra cover the whole wavelength range, the spectrum of 1997ap covers redwardof ∼ 2700A rest frame, and the Ellis composite covers redward of ∼ 2800A rest frame.
TABLE 2Probabilities of matching SN SCP-0401.
Supernova Type Probability of Match
SN1980N Ia 0.969SN2001ep Ia 0.968SN1981B Ia 0.963SN1992A Ia 0.924SN2011iv Ia 0.886SN1990N Ia 0.610Lentz et al. (2000) Ia Model 0.514SN1983N Ib 0.489SN2001eh Ia 0.420SN1989M Ia 0.316SN1982B Ia 0.244SN1990M Ia 0.157SN1989B Ia 0.139SN1991T Ia 0.059
Note. — Probabilities of each supernova matchingSN SCP-0401. The values are taken from the principal-component-like analysis described in Section 3.3 and Ap-pendix B. Only probabilities greater than 0.05 are shown.
Redshift 1.71 Supernova 5
-0.2
0.0
0.2
0.4
0.6
0.8
1.01987A (−16 Days), P=0.003
-0.2
0.0
0.2
0.4
0.6
0.8
1.02002ap (−5 Days), P=0.016
-0.2
0.0
0.2
0.4
0.6
0.8
1.02011dh (+6 Days), P=0.033
-0.2
0.0
0.2
0.4
0.6
0.8
1.02001ig (Discovery +12 Days), P=0.039
-0.2
0.0
0.2
0.4
0.6
0.8
1.01983N (−3 Days), P=0.489
2200 2400 2600 2800 3000 3200 3400 3600Rest-Frame Wavelength (
A)
6000 7000 8000 9000 10000Observer-Frame Wavelength (
A)
Fig. 3.— Each panel shows a comparison between SN SCP-0401 (points with error bars) and another SN. The five best-matchingcomparison SNe Ia are shown in the left panels; the five best-matching comparison CC SNe are shown in the right panels. For eachcomparison SN, only the best-matching epoch is shown. The best visual match is SN1992A (left, third from top); we have overlaidadditional data from a phase of +8 days that covers the full rest-frame wavelength range (light grey), showing that the match continuesfor the full spectrum. Of the 17 CC SNe (the best five of which are shown here), only SN1983N is a possible match, although as noted inthe text, this SN is two magnitudes fainter at max than a typical SN Ia.Bottom panels: 2D SN SCP-0401 spectrum, spanning 112 pixels. Some of the flux visible in the very reddest wavelengths is contaminationfrom a nearby galaxy.
6 Rubin et al.
TABLE 3Photometry of SN SCP-0401.
MJD PID Camera Filter Exposure (s) Flux (DN/s) Flux Error (DN/s) Vega=0 Zeropoint
52600.72 9583 ACS WFC F775W 1120.0 −0.0426 0.0599 25.29152600.75 9583 ACS WFC F850LP 2400.0 −0.0206 0.0274 23.90952643.38 9583 ACS WFC F775W 1000.0 −0.0271 0.0669 25.29152643.43 9583 ACS WFC F850LP 2120.0 0.0180 0.0293 23.90952691.46 9583 ACS WFC F775W 960.0 −0.0422 0.0655 25.29152691.52 9583 ACS WFC F850LP 2060.0 0.0014 0.0288 23.90952734.16 9583 ACS WFC F775W 960.0 0.1358 0.0599 25.29152734.22 9583 ACS WFC F850LP 2000.0 −0.0128 0.0255 23.90952782.70 9583 ACS WFC F775W 960.0 0.0864 0.0573 25.29152782.78 9583 ACS WFC F850LP 2080.0 −0.0048 0.0259 23.90953098.41 9727 ACS WFC F850LP 1600.0 0.3249 0.0371 23.90953098.43 9727 ACS WFC F775W 400.0 0.3328 0.1369 25.29153107.15 9727 ACS WFC F850LP 4564.0 0.2213 0.0237 23.90953111.21 9727 NICMOS 2 F110W 2687.9 0.2427 0.0144 23.02953111.31 9727 NICMOS 2 F160W 5375.7 0.2011 0.0125 22.16053121.57 9727 ACS WFC F850LP 4384.0 0.1311 0.0210 23.90953130.83 9727 NICMOS 2 F160W 5375.7 0.1387 0.0120 22.16053136.86 9727 NICMOS 2 F110W 2687.9 0.1205 0.0154 23.02953142.59 9727 NICMOS 2 F160W 8063.6 0.1158 0.0103 22.16053145.98 9728 ACS WFC F775W 400.0 −0.0623 0.1536 25.29153146.01 9728 ACS WFC F850LP 1600.0 −0.0287 0.0361 23.90953148.41 9727 NICMOS 2 F110W 8063.6 0.0811 0.0113 23.02953196.34 9727 ACS WFC F850LP 1600.0 0.0536 0.0392 23.90953196.37 9727 ACS WFC F775W 400.0 0.1695 0.1701 25.29153244.51 9728 ACS WFC F775W 400.0 −0.1195 0.1573 25.29153244.54 9728 ACS WFC F850LP 1600.0 0.0003 0.0345 23.90953284.82 10339 ACS WFC F775W 375.0 −0.1097 0.1749 25.29153284.84 10339 ACS WFC F850LP 1400.0 −0.0009 0.0580 23.90953333.94 10339 ACS WFC F775W 400.0 −0.1821 0.1886 25.29153333.98 10339 ACS WFC F850LP 1540.0 −0.0756 0.0471 23.90953377.72 10339 ACS WFC F775W 355.0 −0.2258 0.2653 25.29153377.74 10339 ACS WFC F850LP 1520.0 −0.0214 0.0488 23.90953427.73 10339 ACS WFC F775W 375.0 0.0921 0.2744 25.29153427.76 10339 ACS WFC F850LP 1540.0 0.0346 0.0429 23.90953473.53 10339 ACS WFC F775W 425.0 −0.0096 0.1364 25.29153473.55 10339 ACS WFC F850LP 1700.0 0.0359 0.0331 23.909
Note. — Due to the uncertainty on the galaxy models, the NICMOS F110W statistical errors share an off-diagonalcovariance of 3.46e-5 DN/s2, while the F160W errors share a separate off-diagonal covariance of 1.97e-5 DN/s2. The ACSstatistical errors are diagonal.
Redshift 1.71 Supernova 7
We begin by iteratively combining each epoch withMultiDrizzle (Fruchter & Hook 2002; Koekemoer et al.2002) and aligning all epochs. Aperture photometry witha three-pixel radius (0.15′′) is computed for all epochs,with the zero level set by the many epochs without theSN. As the pixel values in the resampled images are cor-related, the background error is derived empirically (byplacing many three-pixel radius apertures in object-freeparts of the image), and the Poisson error of the apertureflux is added in quadrature. We use a zeropoint of 23.909(Vega = 0) for the F850LP data, derived in Suzuki et al.(2012) along with the effective throughput, and 25.291(Vega = 0) for the F775W data, from Bohlin (2007).
4.2. NICMOS Photometry
The optimal radius for aperture photometry withNICMOS is approximately 1 pixel (0.076′′), preclud-ing any resampling of the NICMOS images. FollowingSuzuki et al. (2012), we therefore performed the NIC-MOS photometry using analytic galaxy models (one foreach filter) which were convolved with their PSFs andresampled to match the images. The supernova positionand fluxes were modeled simultaneously using PSFs gen-erated for each spectral energy distribution (SED) andband. As there are two cores for this galaxy, we usetwo azimuthally symmetric elliptical models (with radialvariation described by splines) to model the cores (as theSN is reasonably far off-core, this is mainly needed to getthe centroid of the model correct for each image). The re-maining azimuthal asymmetry of the galaxy was modeledwith a two-dimensional second-order spline, with nodesspaced every five pixels (0.38′′).While optimizing the host-galaxy model (e.g., the
spline-node spacing), we use simulated SNe at dozensof positions at comparable separation from the galaxy tocheck for any bias or unexplained variance in the pho-tometry. No bias is seen at the 0.01 magnitude level ineither band. However, the final epoch in F110W showsa small amount of unexplained variance (χ2/degree offreedom 1.35) for the recovered fluxes around the trueflux, possibly due to slight South Atlantic Anomaly per-sistence. We rescale the photometry error bar for thisepoch to make the χ2 per degree of freedom 1.We used a NICMOS F110W zeropoint of 23.757 AB
(23.029 Vega = 0) (Ripoche et al. ApJ Submitted) anda NICMOS F160W zeropoint of 22.16 (Vega = 0) (seediscussion in Amanullah et al. 2010).
5. ANALYSIS
5.1. Light-Curve Fit
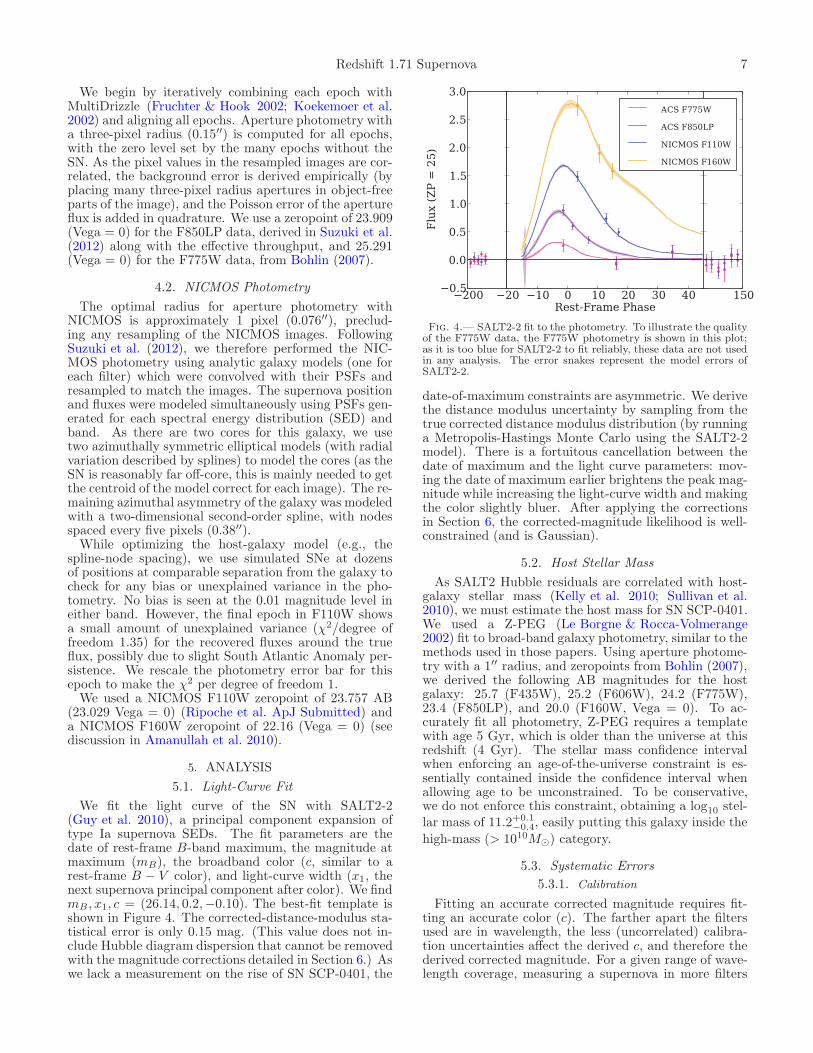
We fit the light curve of the SN with SALT2-2(Guy et al. 2010), a principal component expansion oftype Ia supernova SEDs. The fit parameters are thedate of rest-frame B-band maximum, the magnitude atmaximum (mB), the broadband color (c, similar to arest-frame B − V color), and light-curve width (x1, thenext supernova principal component after color). We findmB, x1, c = (26.14, 0.2,−0.10). The best-fit template isshown in Figure 4. The corrected-distance-modulus sta-tistical error is only 0.15 mag. (This value does not in-clude Hubble diagram dispersion that cannot be removedwith the magnitude corrections detailed in Section 6.) Aswe lack a measurement on the rise of SN SCP-0401, the
Fig. 4.— SALT2-2 fit to the photometry. To illustrate the qualityof the F775W data, the F775W photometry is shown in this plot;as it is too blue for SALT2-2 to fit reliably, these data are not usedin any analysis. The error snakes represent the model errors ofSALT2-2.
date-of-maximum constraints are asymmetric. We derivethe distance modulus uncertainty by sampling from thetrue corrected distance modulus distribution (by runninga Metropolis-Hastings Monte Carlo using the SALT2-2model). There is a fortuitous cancellation between thedate of maximum and the light curve parameters: mov-ing the date of maximum earlier brightens the peak mag-nitude while increasing the light-curve width and makingthe color slightly bluer. After applying the correctionsin Section 6, the corrected-magnitude likelihood is well-constrained (and is Gaussian).
5.2. Host Stellar Mass
As SALT2 Hubble residuals are correlated with host-galaxy stellar mass (Kelly et al. 2010; Sullivan et al.2010), we must estimate the host mass for SN SCP-0401.We used a Z-PEG (Le Borgne & Rocca-Volmerange2002) fit to broad-band galaxy photometry, similar to themethods used in those papers. Using aperture photome-try with a 1′′ radius, and zeropoints from Bohlin (2007),we derived the following AB magnitudes for the hostgalaxy: 25.7 (F435W), 25.2 (F606W), 24.2 (F775W),23.4 (F850LP), and 20.0 (F160W, Vega = 0). To ac-curately fit all photometry, Z-PEG requires a templatewith age 5 Gyr, which is older than the universe at thisredshift (4 Gyr). The stellar mass confidence intervalwhen enforcing an age-of-the-universe constraint is es-sentially contained inside the confidence interval whenallowing age to be unconstrained. To be conservative,we do not enforce this constraint, obtaining a log10 stel-lar mass of 11.2+0.1
−0.4, easily putting this galaxy inside the
high-mass (> 1010M⊙) category.
5.3. Systematic Errors
5.3.1. Calibration
Fitting an accurate corrected magnitude requires fit-ting an accurate color (c). The farther apart the filtersused are in wavelength, the less (uncorrelated) calibra-tion uncertainties affect the derived c, and therefore thederived corrected magnitude. For a given range of wave-length coverage, measuring a supernova in more filters
8 Rubin et al.
will also decrease the sensitivity of the fit to any givenmiscalibration (again assuming independent calibrationuncertainties for the data in each filter). With three pass-bands within the SALT2-2 range and a long wavelengthbaseline, the SN distance modulus we derive from thelight curve fit is more resilient against calibration uncer-tainties than most high-redshift SNe distances. Our dis-tance modulus is most sensitive to the F160W zeropoint,with ∂µ/∂(F160W zeropoint) =1.5 (that is, a change inthe F160W zeropoint of 0.01 magnitudes changes the cor-rected magnitude by 0.015), a factor of two better thanis typically achieved with only one color. The other cal-ibration uncertainties combine to a systematic error ofonly ∼ 0.01 mag on the distance modulus.The NICMOS 2 F160W data are affected by a count-
rate nonlinearity of 0.026±0.015mag/dex (de Jong et al.2006), which adds an effective zeropoint uncertainty of0.06 magnitudes at the flux level of high-redshift SNe,assuming a power-law dependence of the non-linearityover the full range of flux between the standard starsand the SNe (4-5 dex). Based on the F110W results ofRipoche et al. (ApJ Submitted), we add an uncertaintyof 0.03 magnitudes to account for possible deviation froma power law. We will improve this uncertainty with afuture recalibration of the F160W non-linearity using thetechniques in Ripoche et al. in a future paper.
5.3.2. Malmquist Bias
Most SNe Ia at redshift 1.71 would be too faint tobe found by the search, even at maximum brightness.Malmquist bias is therefore present. Most of this bias istaken out by making the corrections we describe in Sec-tion 6, but some bias remains. (If it were possible to per-fectly correct SNe, such that all SNe were equally brightafter correction, no Malmquist bias would remain.) Asimple simulation (detailed further in Rubin et al., inprep) that selects SNe from the parent distribution anddetermines if they could be found at redshift 1.71 al-lows us to estimate that this remaining Malmquist biasis about 0.08 mag.If there are SNe at high enough significance to find,
but not to get a spectrum of, there may be additionalMalmquist bias. We investigate this possibility here us-ing the observed spectrum of SN SCP-0401. The faintestsupernova we could have found would be S/N ∼ 5, ratherthan S/N ∼ 9. Increasing the noise in the spectrum by afactor 1.8 allows more supernovae of both types to matchthe spectrum. The net effect is to lower the confidenceof being a Ia to 86%, in which case we would still use thesupernova for cosmological analysis. (In an earlier study(Kowalski et al. 2008), we showed that the analysis isrobust to this level of non Ia contamination.)The largest contributors to the Malmquist bias uncer-
tainty are the magnitude cut for the search (which wetake to be uncertain at the 0.2 mag level) and the uncor-rected residual dispersion of SNe at redshift 1.71 (whichwe take to be 0.20 ± 0.05 (see discussions below in Sec-tions 5.3.3 and 6). Each of these contributes about 0.03magnitudes to the Malmquist bias uncertainty. There-fore, the total uncertainty, which would correlate fromsupernova-to-supernova were there others like it, is about0.04 mag.
5.3.3. Lensing
The bright spiral galaxy 3.5′′ away from the super-nova (visible to its upper left in Figure 1) is at redshift0.64 (Cowie et al. 2004), and is thus a potential sourceof gravitational magnification for the supernova. Here,we provide a rough estimate of the size of this effect.As with the host galaxy, we used Z-PEG to derive the
stellar mass. For this larger (apparent size) galaxy, weused a 1.5′′ radius, and obtained the following AB mag-nitudes: 23.5 (F435W), 22.7 (F606W), 21.8 (F775W),and 21.5 (F850LP). We use the Z-PEG stellar mass of4 × 1010M⊙ with the relation between stellar mass andhalo mass from Guo et al. (2010) to derive the total massof the halo, 1.4× 10¹²M⊙. Assuming a singular isother-mal sphere model, with M200 ∼ Mhalo, we find a mag-nification of 1.08 (using the Navarro et al. (1996) NFWprofile provides virtually the same answer). This numberis not the magnification of the supernova; had the lens-ing galaxy not been there, the supernova would likely beslightly de-magnified (compared to a filled-beam distancemodulus). Holz & Linder (2005) find that the scatterdue to lensing is approximately 0.093z = 0.16 magni-tudes at this redshift. We include this uncertainty in ourdistance modulus error (as noted below) and see no evi-dence that SN SCP-0401 is magnified or de-magnified bymore than this.The mean magnification of supernova fluxes is zero at
a given redshift. (Selection effects can bias the observedSNe to higher magnification, but Jonsson et al. (2006)see no evidence of this in the Riess et al. (2004) sam-ple.) However, we fit our cosmological constraints inlog(flux) (magnitudes), where the mean magnification isnot zero (as supernova fluxes are roughly log-normallydistributed, and we use least-squares fitting, fitting inmagnitudes is appropriate). We evaluate the lensing biasfrom working with magnitudes using the distributions ofWang et al. (2002) and find it to be 0.01 mag (biasedfaint). In principle, most of this bias is well-understood(from knowledge of the corrected supernova luminositydistribution and the lensing distribution) and could beremoved.
6. CONCLUSIONS
We apply the corrections detailed in Suzuki et al.(2012) Equation 3 to obtain a SALT2-2 distance mod-ulus corrected for x1, c, and host mass, reproduced here.
µB = mB +α ·x1 −β · c+ δ ·P (mtrue⋆ < 1010M⊙)−MB ,
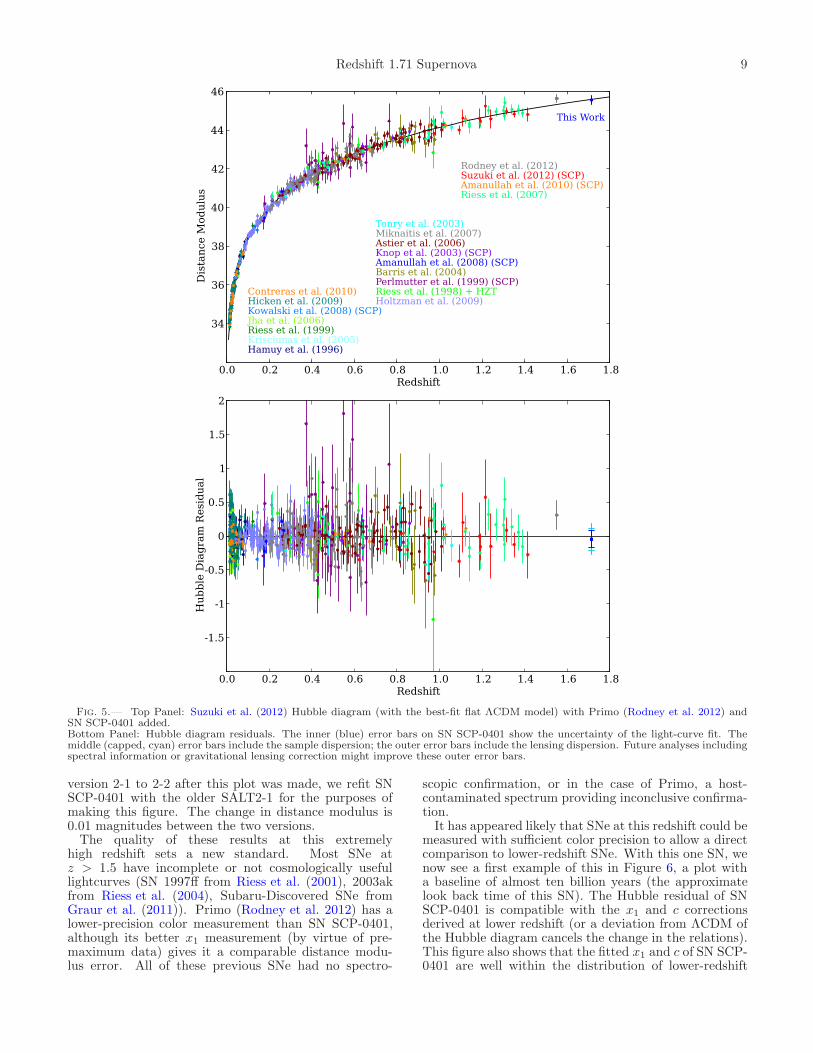
(1)where α is the light-curve-width-correction coefficient,β is the color-correction coefficient, δ is the host-mass-correction coefficient, and MB is the (h = 0.70) absoluteB-magnitude. In addition to the propagated lightcurvefit uncertainties, we add in quadrature the distance mod-ulus scatter due to lensing (above) and σsample, the errorneeded to get a χ2 per degree of freedom of 1 around theHubble line for the GOODS SNe. We takeMB = −19.09,α = 0.14, β = 3.1, δ = −0.07, σsample = 0.11 (Rubinet al., in prep) and find a distance modulus (no mag-nification or Malmquist bias correction) of 45.57 ± 0.24statistical, ± ∼ 0.1 systematic. This is fully consistentwith the value of 45.60 predicted from a flat Ωm = 0.27ΛCDM universe. Figure 5 shows the Hubble diagramof Suzuki et al. (2012) with SN SCP-0401 and Primo(Rodney et al. 2012) added. As SALT was updated from
Redshift 1.71 Supernova 9
0.0 0.2 0.4 0.6 0.8 1.0 1.2 1.4 1.6 1.8Redshift
34
36
38
40
42
44
46
Hamuy et al. (1996)Krisciunas et al. (2005)Riess et al. (1999)Jha et al. (2006)Kowalski et al. (2008) (SCP)Hicken et al. (2009)Contreras et al. (2010)
Holtzman et al. (2009)Riess et al. (1998) + HZTPerlmutter et al. (1999) (SCP)Barris et al. (2004)Amanullah et al. (2008) (SCP)Knop et al. (2003) (SCP)Astier et al. (2006)Miknaitis et al. (2007)Tonry et al. (2003)
Riess et al. (2007)Amanullah et al. (2010) (SCP)Suzuki et al. (2012) (SCP)Rodney et al. (2012)
This Work
Distance M
odulus
0.0 0.2 0.4 0.6 0.8 1.0 1.2 1.4 1.6 1.8Redshift
-1.5
-1
-0.5
0
0.5
1
1.5
2
Hubble Diagram Residual
Fig. 5.— Top Panel: Suzuki et al. (2012) Hubble diagram (with the best-fit flat ΛCDM model) with Primo (Rodney et al. 2012) andSN SCP-0401 added.Bottom Panel: Hubble diagram residuals. The inner (blue) error bars on SN SCP-0401 show the uncertainty of the light-curve fit. Themiddle (capped, cyan) error bars include the sample dispersion; the outer error bars include the lensing dispersion. Future analyses includingspectral information or gravitational lensing correction might improve these outer error bars.
version 2-1 to 2-2 after this plot was made, we refit SNSCP-0401 with the older SALT2-1 for the purposes ofmaking this figure. The change in distance modulus is0.01 magnitudes between the two versions.The quality of these results at this extremely
high redshift sets a new standard. Most SNe atz > 1.5 have incomplete or not cosmologically usefullightcurves (SN 1997ff from Riess et al. (2001), 2003akfrom Riess et al. (2004), Subaru-Discovered SNe fromGraur et al. (2011)). Primo (Rodney et al. 2012) has alower-precision color measurement than SN SCP-0401,although its better x1 measurement (by virtue of pre-maximum data) gives it a comparable distance modu-lus error. All of these previous SNe had no spectro-
scopic confirmation, or in the case of Primo, a host-contaminated spectrum providing inconclusive confirma-tion.It has appeared likely that SNe at this redshift could be
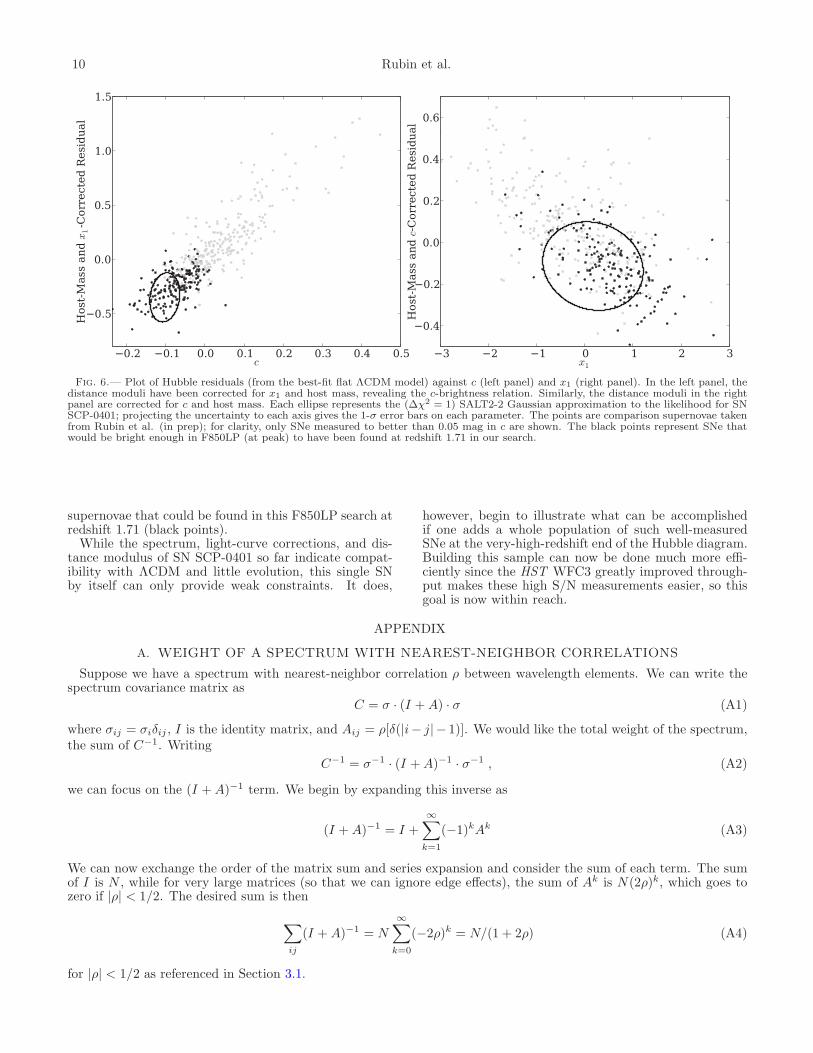
measured with sufficient color precision to allow a directcomparison to lower-redshift SNe. With this one SN, wenow see a first example of this in Figure 6, a plot witha baseline of almost ten billion years (the approximatelook back time of this SN). The Hubble residual of SNSCP-0401 is compatible with the x1 and c correctionsderived at lower redshift (or a deviation from ΛCDM ofthe Hubble diagram cancels the change in the relations).This figure also shows that the fitted x1 and c of SN SCP-0401 are well within the distribution of lower-redshift
10 Rubin et al.
Fig. 6.— Plot of Hubble residuals (from the best-fit flat ΛCDM model) against c (left panel) and x1 (right panel). In the left panel, thedistance moduli have been corrected for x1 and host mass, revealing the c-brightness relation. Similarly, the distance moduli in the rightpanel are corrected for c and host mass. Each ellipse represents the (∆χ2 = 1) SALT2-2 Gaussian approximation to the likelihood for SNSCP-0401; projecting the uncertainty to each axis gives the 1-σ error bars on each parameter. The points are comparison supernovae takenfrom Rubin et al. (in prep); for clarity, only SNe measured to better than 0.05 mag in c are shown. The black points represent SNe thatwould be bright enough in F850LP (at peak) to have been found at redshift 1.71 in our search.
supernovae that could be found in this F850LP search atredshift 1.71 (black points).While the spectrum, light-curve corrections, and dis-
tance modulus of SN SCP-0401 so far indicate compat-ibility with ΛCDM and little evolution, this single SNby itself can only provide weak constraints. It does,
however, begin to illustrate what can be accomplishedif one adds a whole population of such well-measuredSNe at the very-high-redshift end of the Hubble diagram.Building this sample can now be done much more effi-ciently since the HST WFC3 greatly improved through-put makes these high S/N measurements easier, so thisgoal is now within reach.
APPENDIX
A. WEIGHT OF A SPECTRUM WITH NEAREST-NEIGHBOR CORRELATIONS
Suppose we have a spectrum with nearest-neighbor correlation ρ between wavelength elements. We can write thespectrum covariance matrix as
C = σ · (I +A) · σ (A1)
where σij = σiδij , I is the identity matrix, and Aij = ρ[δ(|i− j| − 1)]. We would like the total weight of the spectrum,the sum of C−1. Writing
C−1 = σ−1 · (I +A)−1 · σ−1 , (A2)
we can focus on the (I +A)−1 term. We begin by expanding this inverse as
(I +A)−1 = I +∞∑
k=1
(−1)kAk (A3)
We can now exchange the order of the matrix sum and series expansion and consider the sum of each term. The sumof I is N , while for very large matrices (so that we can ignore edge effects), the sum of Ak is N(2ρ)k, which goes tozero if |ρ| < 1/2. The desired sum is then
∑
ij
(I +A)−1 = N
∞∑
k=0
(−2ρ)k = N/(1 + 2ρ) (A4)
for |ρ| < 1/2 as referenced in Section 3.1.
Redshift 1.71 Supernova 11
B. SPECTRAL PRINCIPAL COMPONENT ANALYSIS
As discussed in Section 3.3, we use a principal component analysis to allow comparisons between spectra with limitedwavelength coverage and non-negligible noise, as well as to help establish the dimensionality of the parameter space,so that ∆χ2 values can be converted into probabilities. We have opted to perform this principal component analysis inlog(flux) so that color variations can be more accurately modeled. As the signal-to-noise of most spectra is inadequateto simply take the log of the fluxes, we construct the principal components using an iterative fit.We model each spectrum as
a0 ∗ c0(λ) exp[a1 ∗ c1(λ) + a2 ∗ c2(λ)] (B1)
where a0 is the normalization, c0(λ) represents the mean, a1 and a2 are the projections onto the first and secondcomponents, and c1(λ) and c2(λ) are the first and second components.We fit the mean and first component (0 and 1, above) and their projections first (with the second component fixed to
zero). After convergence, we fit the mean and second component with the first component held fixed. This sequentialprocedure ensures that at every stage, the component we are fitting is the one that contributes the most varianceremaining. We start versions of the fit with many randomly chosen initial values for the projections to ensure thatwe have a converged solution (the components are always initialized at zero). We exclude the models of Lentz et al.(2000) from training the components, but we do compute the projections to enable a quantitative comparison to SNSCP-0401.We use an error floor to prevent extremely well-measured wavelength regions or spectra from dominating the analysis.
The error floor required is that needed to obtain a χ2 per degree of freedom of 1 for the residuals from the model.For our two-component analysis, this is S/N 5 per ∆λ/λ of 0.01 (a spectrum with ∆λ/λ of 0.001 would therefore belimited to S/N 1.6 per resolution element).There is some ambiguity about how many principal components to use. Increasing the number allows for a smaller
error floor (as more and more of the variance is described by the principal components). It also allows for betterdiscrimination between spectra (e.g., spectra that are similar in the first two principal components may be dissimilarin the third). However, increasing the number also increases the ∆χ2 values required for a given level of statisticalsignificance. Two principal components are all that is necessary to fit almost all spectra to within the accuracy thatthe spectrum SN SCP-0401 has been measured; two are therefore used for the results of this paper.As a test, we also compute the probability of SN SCP-0401 being a Ia (see Section 3.3) using one component and
three components. Our results are robust; we find 93% confidence using one component, 92% confidence using two,and 91% confidence using three components. It is important to note that we chose to use two components beforeseeing any of these probabilities.
12 Rubin et al.
We would like to thank Henry Ferguson of the Space Telescope Science Institute for ensuring fast turnaround forthese time-critical observations. We would also like to thank Bahram Mobasher for providing photometric redshifts forthe host galaxies of our candidates. The archival WFC3 data used to obtain the host redshift were taken under HSTGO Program 11600, PI Benjamin Weiner. We would like to thank the SUSPECT archive for their part in assemblingour collection of spectra. Finally we thank the anonymous referee, whose feedback greatly improved this manuscript.Financial support for this work was provided by NASA through program GO-9727 from the Space Telescope Science
Institute, which is operated by AURA, Inc., under NASA contract NAS 5-26555. This work was also partially supportedby the Director, Office of Science, Department of Energy, under grant DE-AC02-05CH11231.Facilities: Hubble Space Telescope.
REFERENCES
Aihara, H., Allende Prieto, C., An, D., et al. 2011, ApJS, 193, 29Amanullah, R., Lidman, C., Rubin, D., et al. 2010, ApJ, 716, 712Barbary, K., Aldering, G., Amanullah, R., et al. 2012, ApJ, 745,
31Bazin, G., Palanque-Delabrouille, N., Rich, J., et al. 2009, A&A,
499, 653Blanco, V. M., Schweizer, F., Moffat, A. F. J., et al. 1980,
IAU Circ., 3556, 2Bohlin, R. C. 2007, Photometric Calibration of the ACS CCD
Cameras, Tech. rep.Branch, D., Lacy, C. H., McCall, M. L., et al. 1983, ApJ, 270, 123Branch, D., Benetti, S., Kasen, D., et al. 2002, ApJ, 566, 1005Brown, P. J. 2009, PhD thesis, The Pennsylvania State UniversityBufano, F., Immler, S., Turatto, M., et al. 2009, ApJ, 700, 1456Buta, R. J. 1982, PASP, 94, 578Buta, R. J., Corwin, Jr., H. G., & Opal, C. B. 1985, PASP, 97,
229Ciatti, F., Barbon, R., Cappellaro, E., & Rosino, L. 1988, A&A,
202, 15Clocchiatti, A., Phillips, M. M., Suntzeff, N. B., et al. 2000, ApJ,
529, 661Cowie, L. L., Barger, A. J., Hu, E. M., Capak, P., & Songaila, A.
2004, AJ, 127, 3137de Jong, R. S., Bergeron, E., Riess, A., & Bohlin, R. 2006,
NICMOS count-rate dependent nonlinearity tests using flatfieldlamps, Tech. rep.
de Vaucouleurs, G., de Vaucouleurs, A., Buta, R., Ables, H. D., &Hewitt, A. V. 1981, PASP, 93, 36
della Valle, M., Pasquini, L., Phillips, M., & McCarthy, P. 1990,IAU Circ., 5079, 1
Dickinson, M., Giavalisco, M., & GOODS Team. 2003, in TheMass of Galaxies at Low and High Redshift, ed. R. Bender &A. Renzini, 324
Drescher, C., Parker, S., Brimacombe, J., Noguchi, T., & Nakano,S. 2011, Central Bureau Electronic Telegrams, 2940, 1
Ellis, R. S., Sullivan, M., Nugent, P. E., et al. 2008, ApJ, 674, 51Evans, R. O., White, B., & Bembrick, C. 2001, IAU Circ., 7772, 1Filippenko, A. V., Sargent, W. L. W., Kriss, G., et al. 1985,
IAU Circ., 4080, 1Filippenko, A. V., Matheson, T., Barth, A. J., et al. 1994,
IAU Circ., 5964, 1Foley, R. J., Smith, N., Ganeshalingam, M., et al. 2007, ApJ, 657,
L105Foley, R. J., Papenkova, M. S., Swift, B. J., et al. 2003, PASP,
115, 1220Foley, R. J., Kromer, M., Howie Marion, G., et al. 2012, ApJ,
753, L5Fruchter, A. S., & Hook, R. N. 2002, PASP, 114, 144Ganeshalingam, M., Li, W. D., Chornock, R., & Filippenko,
A. V. 2001, IAU Circ., 7714, 4Garnavich, P. M., Kirshner, R. P., Challis, P., et al. 1998, ApJ,
493, L53Gibbons, R. A., Knop, R. A., Kuznetsova, N., & Supernova
Cosmology Project Collaboration. 2004, in Bulletin of theAmerican Astronomical Society, Vol. 36, AmericanAstronomical Society Meeting Abstracts, 1460
Gouiffes, C., Rosa, M., Melnick, J., et al. 1988, A&A, 198, L9Graur, O., Poznanski, D., Maoz, D., et al. 2011, MNRAS, 417, 916Guo, Q., White, S., Li, C., & Boylan-Kolchin, M. 2010, MNRAS,
404, 1111Guy, J., Sullivan, M., Conley, A., et al. 2010, A&A, 523, A7Hamuy, M., Phillips, M. M., Maza, J., et al. 1991a, AJ, 102, 208Hamuy, M., Phillips, M. M., Silva, D., Lubcke, G., & Steffey, P.
1991b, IAU Circ., 5251, 1Hamuy, M., Pinto, P. A., Maza, J., et al. 2001, ApJ, 558, 615Herald, D., McNaught, R. H., Morel, M., et al. 1987, IAU Circ.,
4317, 1Hicken, M., Challis, P., Jha, S., et al. 2009, ApJ, 700, 331Holz, D. E., & Linder, E. V. 2005, ApJ, 631, 678Hopkins, A. M., & Beacom, J. F. 2006, ApJ, 651, 142Immler, S. 2005, in Chandra Proposal, 2292Jha, S., Challis, P., Garnavich, P., et al. 1999, IAU Circ., 7296, 2
Jonsson, J., Dahlen, T., Goobar, A., et al. 2006, ApJ, 639, 991Kawabata, K. S., Jeffery, D. J., Iye, M., et al. 2002, in 8th
Asian-Pacific Regional Meeting, Volume II, ed. S. Ikeuchi,J. Hearnshaw, & T. Hanawa, 333–334
Kelly, P. L., Hicken, M., Burke, D. L., Mandel, K. S., & Kirshner,R. P. 2010, ApJ, 715, 743
Kharadze, E. K., Pskovsky, Y. P., Kimeridze, G. N., et al. 1989,IAU Circ., 4802, 1
Kimeridze, G. N., & Tsvetkov, D. Y. 1989, Astrofizika, 31, 17—. 1991, Soviet Ast., 35, 168Kirshner, R., & Bryan, J. 1980, IAU Circ., 3534, 2Kirshner, R., Blondin, S., Chevalier, R., et al. 2010, The
Astronomer’s Telegram, 2513, 1Knop, R. A., Aldering, G., Amanullah, R., et al. 2003, ApJ, 598,
102Koekemoer, A. M., Fruchter, A. S., Hook, R. N., & Hack, W.
2002, in The 2002 HST Calibration Workshop : Hubble afterthe Installation of the ACS and the NICMOS Cooling System,ed. S. Arribas, A. Koekemoer, & B. Whitmore, 337
Korth, S. 1989, BAV Rundbrief, 38, 88Kowalski, M., Rubin, D., Aldering, G., et al. 2008, ApJ, 686, 749Kummel, M., Walsh, J. R., Pirzkal, N., Kuntschner, H., &
Pasquali, A. 2009, PASP, 121, 59Le Borgne, D., & Rocca-Volmerange, B. 2002, A&A, 386, 446Leibundgut, B., Kirshner, R. P., Filippenko, A. V., et al. 1991,
ApJ, 371, L23Lentz, E. J., Baron, E., Branch, D., Hauschildt, P. H., & Nugent,
P. E. 2000, ApJ, 530, 966Li, W., Leaman, J., Chornock, R., et al. 2011, MNRAS, 412, 1441Li, W.-D., Li, C., Filippenko, A. V., & Moran, E. C. 1998,
IAU Circ., 6829, 1Liller, W., Brown, N., McNaught, R. H., et al. 1992, IAU Circ.,
5428, 1Liu, Q.-Z., Hu, J.-Y., Hang, H.-R., et al. 2000, A&AS, 144, 219Matheson, T., Jha, S., Challis, P., Kirshner, R., & Huchra, J.
2001, IAU Circ., 7731, 3Mattei, J., Johnson, G. E., Rosino, L., Rafanelli, P., & Kirshner,
R. 1979, IAU Circ., 3348, 1Maury, A., Thouvenot, E., Buil, C., et al. 1990, IAU Circ., 5039, 1Modjaz, M., Kirshner, R., Challis, P., & Berlind, P. 2005a,
Central Bureau Electronic Telegrams, 160, 1Modjaz, M., Kirshner, R., Challis, P., & Hutchins, R. 2005b,
Central Bureau Electronic Telegrams, 174, 1Navarro, J. F., Frenk, C. S., & White, S. D. M. 1996, ApJ, 462,
563Nomoto, K., Thielemann, F.-K., & Yokoi, K. 1984, ApJ, 286, 644Panagia, N. 1985, in Lecture Notes in Physics, Berlin Springer
Verlag, Vol. 224, Supernovae as Distance Indicators, ed.N. Bartel, 14–33
Panagia, N. 2003, in Lecture Notes in Physics, Berlin SpringerVerlag, Vol. 598, Supernovae and Gamma-Ray Bursters, ed.K. Weiler, 113–144
Pastorello, A., Valenti, S., Zampieri, L., et al. 2009, MNRAS, 394,2266
Perlmutter, S., Aldering, G., della Valle, M., et al. 1998, Nature,391, 51
Perlmutter, S., Aldering, G., Goldhaber, G., et al. 1999, ApJ,517, 565
Phillips, M. M., Suntzeff, N. B., Krisciunas, K., et al. 2001,IAU Circ., 7772, 2
Phillips, M. M., Wells, L. A., Suntzeff, N. B., et al. 1992, AJ, 103,1632
Polcaro, V. F., & Viotti, R. 1991, A&A, 242, L9Prabhu, T. P. 1985, Bulletin of the Astronomical Society of India,
13, 68—. 1995, Journal of Astrophysics and Astronomy Supplement, 16,
317Prabhu, T. P., & Krishnamurthi, A. 1990, A&A, 232, 75Riess, A. G., Filippenko, A. V., Challis, P., et al. 1998, AJ, 116,
1009Riess, A. G., Nugent, P. E., Gilliland, R. L., et al. 2001, ApJ, 560,
49
Redshift 1.71 Supernova 13
Riess, A. G., Strolger, L.-G., Tonry, J., et al. 2004, ApJ, 607, 665Riess, A. G., Strolger, L.-G., Casertano, S., et al. 2007, ApJ, 659,
98Ripoche, P., Aldering, G., Amanullah, R., et al. ApJ SubmittedRodney, S. A., Riess, A. G., Dahlen, T., et al. 2012, ApJ, 746, 5Sasaki, M., Kosugi, G., Ishigaki, T., et al. 1994, PASJ, 46, L187Sonneborn, G., Kirshner, R., della Valle, M., et al. 1990,
IAU Circ., 5034, 1Stringfellow, G. S., Howell, S. B., Probst, R., & Seebode, S. 2011,
The Astronomer’s Telegram, 3428, 1Sullivan, M., Conley, A., Howell, D. A., et al. 2010, MNRAS, 406,
782Suntzeff, N., Parker, J., Hunter, D., et al. 1992, IAU Circ., 5432, 2
Suzuki, N., Rubin, D., Lidman, C., et al. 2012, ApJ, 746, 85Szeidl, B., Lovas, M., Barbon, R., et al. 1982, IAU Circ., 3671, 1Tsvetkov, D. Y., Volkov, I. M., Sorokina, E., et al. 2012,
Peremennye Zvezdy, 32, 6Uomoto, A., & Kirshner, R. P. 1985, A&A, 149, L7Vettolani, G., Marano, B., Zitelli, V., et al. 1981, IAU Circ., 3584,
1Wamsteker, W., Talavera, A., Machetto, F., et al. 1983,
IAU Circ., 3791, 2Wang, Y., Holz, D. E., & Munshi, D. 2002, ApJ, 572, L15Ward, M. J., Blades, J. C., & Griffiths, R. E. 1978, IAU Circ.,
3309, 1Wheeler, J. C., & Levreault, R. 1985, ApJ, 294, L17