Embed Size (px)
Citation preview
Proceedings World Geothermal Congress 2010 Bali, Indonesia, 25-29 April 2010
1
Precision Gravity Modeling and Interpretation at the Salak Geothermal Field, Indonesia
Gregg A. Nordquist, Jorge Acuña and Jim Stimac
Chevron Geothermal Salak, Sentral Senayan-II Office Tower, Jl. Asia Afrika, No. 8, Jakarta 10270, Indonesia
Keywords: Salak, Precision Gravity, Simulation, Numerical Model
ABSTRACT
Eight (8) precision gravity surveys have been conducted over the Awibengkok geothermal field. The base line survey was conducted in 1994 with the latest repeat occurring in 2008. These gravity data are used to provide constraints for calibrating the numerical model’s net depletion and for constraining reservoir mass replacement from re-injection and natural inflow from aquifers outside the production zone. For the analysis the observed gravity trends and changes are compared to the simulated gravity. The simulated gravity is calculated by associating the gravity change at the surface with predicted density changes in the numerical model’s rectangular blocks in the subsurface. A comparison of the observed gravity changes versus the simulated gravity change at Awibengkok show a mismatch in the Northeast sector of the field. Analysis of the data shows that the mismatch is a result of increased mass that is not accounted for in the numerical model. Simple 2 ½ D gravity models show that over time the area of increased mass is occurring at a constant rate and in a consistent location. Using reasonable porosities these models suggest a minimum rate of influx of about 110 kph from an external aquifer could account for the observed mass changes. The gravity models are consistent with increasing saturation in a dacitic unit located above the reservoir. An alternative model is that shallow recharge is also occurring into reservoir with a portion of the gravity changes resulting from re-saturation of the matrix in the steam cap area or pressure support requiring less support from the matrix. Geochemical trends lend some support for this latter interpretation.
1. INTRODUCTION
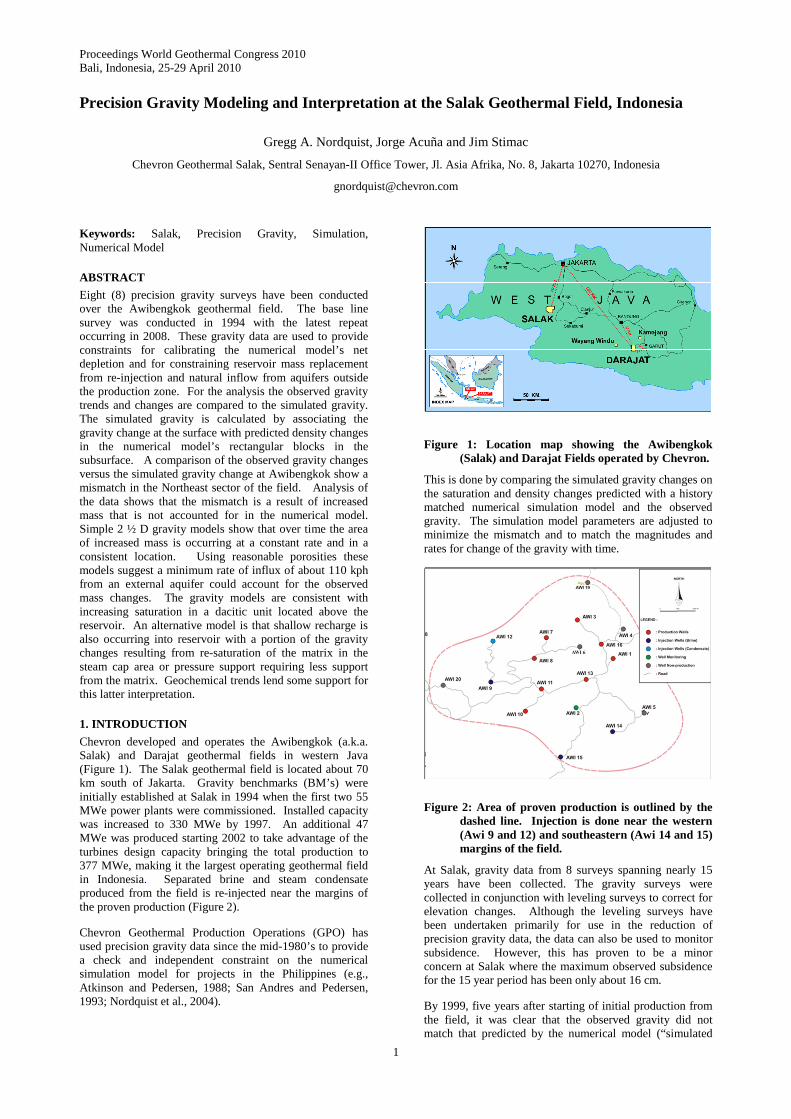
Chevron developed and operates the Awibengkok (a.k.a. Salak) and Darajat geothermal fields in western Java (Figure 1). The Salak geothermal field is located about 70 km south of Jakarta. Gravity benchmarks (BM’s) were initially established at Salak in 1994 when the first two 55 MWe power plants were commissioned. Installed capacity was increased to 330 MWe by 1997. An additional 47 MWe was produced starting 2002 to take advantage of the turbines design capacity bringing the total production to 377 MWe, making it the largest operating geothermal field in Indonesia. Separated brine and steam condensate produced from the field is re-injected near the margins of the proven production (Figure 2).
Chevron Geothermal Production Operations (GPO) has used precision gravity data since the mid-1980’s to provide a check and independent constraint on the numerical simulation model for projects in the Philippines (e.g., Atkinson and Pedersen, 1988; San Andres and Pedersen, 1993; Nordquist et al., 2004).
Figure 1: Location map showing the Awibengkok (Salak) and Darajat Fields operated by Chevron.
This is done by comparing the simulated gravity changes on the saturation and density changes predicted with a history matched numerical simulation model and the observed gravity. The simulation model parameters are adjusted to minimize the mismatch and to match the magnitudes and rates for change of the gravity with time.
Figure 2: Area of proven production is outlined by the dashed line. Injection is done near the western (Awi 9 and 12) and southeastern (Awi 14 and 15) margins of the field.
At Salak, gravity data from 8 surveys spanning nearly 15 years have been collected. The gravity surveys were collected in conjunction with leveling surveys to correct for elevation changes. Although the leveling surveys have been undertaken primarily for use in the reduction of precision gravity data, the data can also be used to monitor subsidence. However, this has proven to be a minor concern at Salak where the maximum observed subsidence for the 15 year period has been only about 16 cm.
By 1999, five years after starting of initial production from the field, it was clear that the observed gravity did not match that predicted by the numerical model (“simulated
Nordquist et al.
2
gravity”). This mismatch has continued to diverge through 2008 when the latest survey was completed. This paper summarizes the interpretation of what is causing this mismatch.
2. GENERALIZED GEOLOGIC SETTING
The Salak geothermal system is hosted mainly by andesitic to rhyodacitic rocks, and floored by marine sedimentary rocks of Miocene age cut by intrusions (Stimac et al., 2008). The volcanic sequence is capped by a 8,400 year old phreatic explosion breccia, rhyolite fallout tuff (>8,400 years and <40,000 years), rhyolite lavas, domes and related tuffs (≥40-120 ka), and dacite to rhyodacite lavas and domes (185-280 ka) that were erupted across the eastern part of the field from NNE-trending vents controlled by a major fault. More regionally extensive basaltic andesite to andesite volcanic centers are mostly from 180-1610 ka old (Figure 3). Surface and subsurface fault patterns, formation image logs and tracer studies indicate strongly anisotropic permeability aligned with the dominant N to NE fracture trend, dividing the field into a number of subcompartments that are locally connected by fractured aquifers and NW and E-W trending
fractures (Stimac et al., 2010).
Figure 3: Generalized geologic map of the Salak Geothermal Field (after Stimac et al., 2008)
The geothermal system is a liquid-dominated, fracture-controlled reservoir with benign chemistry and low to moderate non-condensible gas (NCG) content (Acuña et al., 2008). The commercial Awibengkok reservoir is a moderate to high-temperature (240-312oC) geothermal
resource with high fracture permeability, moderate porosity (mean = 10.6%) and moderate to low matrix permeability (geometric mean = 0.026 md). The principal deep upflow zone is located in the western part of the field (275 to 312oC), and ascending fluids move up along N- or NNE-trending structures that breach low-permeability tuff layers in the central and east-central parts of the field. Fluids in the central part of the reservoir are uniform in composition and temperature, representing the mixing of upflow and convective reflux. Fluids ascend and flow laterally to the shallow top of reservoir in the eastern area near Awi 1 and 13 (240 to 270oC). The eastern reservoir is shallower and has been more affected by volcanic eruptions during the period of hydrothermal activity. This has led to steam loss, condensation, and local ingress of shallow steam heated water that has contributed to lower temperatures in this area.
3. GRAVITY AND LEVELING SURVEYS
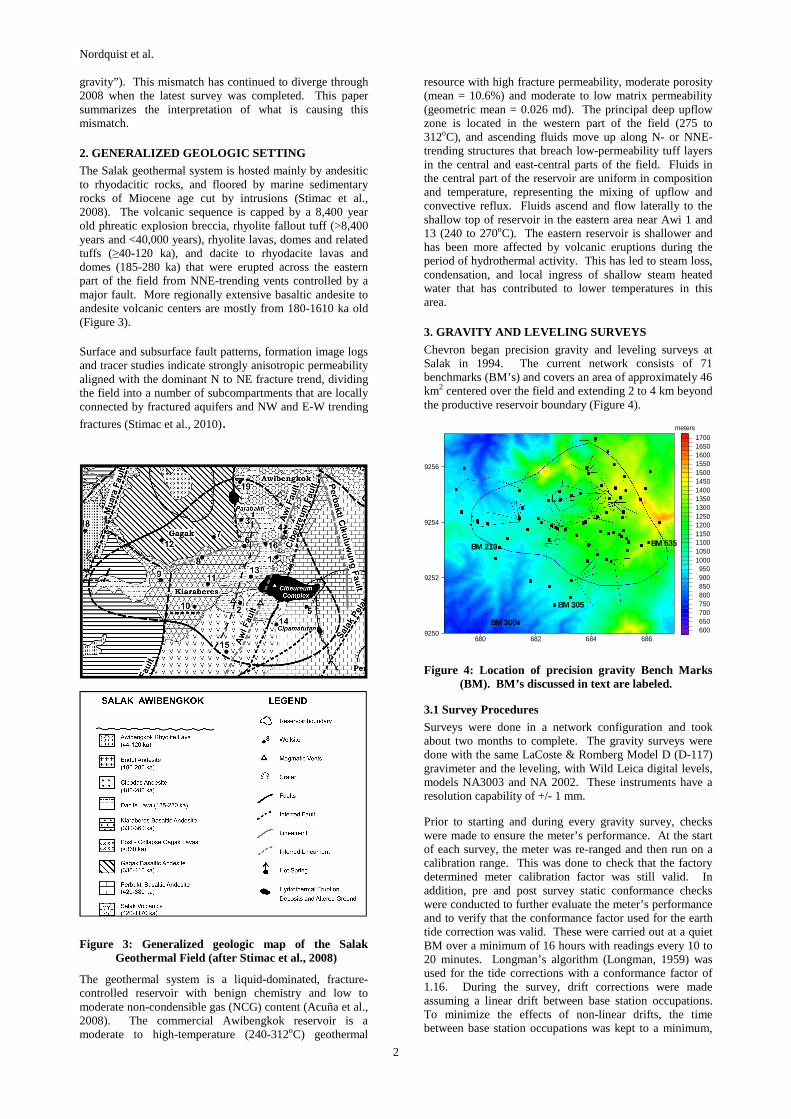
Chevron began precision gravity and leveling surveys at Salak in 1994. The current network consists of 71 benchmarks (BM’s) and covers an area of approximately 46 km2 centered over the field and extending 2 to 4 km beyond the productive reservoir boundary (Figure 4).
680 682 684 6869250
9252
9254
9256
170016501600155015001450140013501300125012001150110010501000950900850800750700650600
meters
BM 300
BM 210
BM 305
BM 535
Figure 4: Location of precision gravity Bench Marks (BM). BM’s discussed in text are labeled.
3.1 Survey Procedures
Surveys were done in a network configuration and took about two months to complete. The gravity surveys were done with the same LaCoste & Romberg Model D (D-117) gravimeter and the leveling, with Wild Leica digital levels, models NA3003 and NA 2002. These instruments have a resolution capability of +/- 1 mm.
Prior to starting and during every gravity survey, checks were made to ensure the meter’s performance. At the start of each survey, the meter was re-ranged and then run on a calibration range. This was done to check that the factory determined meter calibration factor was still valid. In addition, pre and post survey static conformance checks were conducted to further evaluate the meter’s performance and to verify that the conformance factor used for the earth tide correction was valid. These were carried out at a quiet BM over a minimum of 16 hours with readings every 10 to 20 minutes. Longman’s algorithm (Longman, 1959) was used for the tide corrections with a conformance factor of 1.16. During the survey, drift corrections were made assuming a linear drift between base station occupations. To minimize the effects of non-linear drifts, the time between base station occupations was kept to a minimum,
Nordquist et al.
3
within 2.5 hours for at least 75% of the closures. The drift rates for every closure were checked daily. If an unusually large drift was observed, such as might be caused by a meter tare (abrupt change in the readings due to the gravity meter being mishandled), those readings were reviewed and sometimes repeated. Tares, when they occurred, were clearly evident in the drift rate. For most cases, the BM’s affected by the tare were simply re-surveyed. In the event of a serious problem such as a major hit or bump to the gravity meter, the meter may be re-checked on the calibration run and the conformance check conducted to confirm the meters performance. For quality control, the network closures for the tide and drift corrected gravity data were regularly checked.
The next processing step for the leveling and gravity survey networks was to perform a least square adjustment (Eckhardt, 1986). The leveling data were network-adjusted with relative elevations determined with respect to a BM where the elevation was assumed constant. The gravity network was least square adjusted following removal of meter drifts, earth tides and elevation effects. To account for changes in BM elevation due to subsidence, a constant vertical gradient of –308.6 microgal/meter was assumed.
The final step was to adjust the gravity readings between surveys to a common datum. This was necessary because there was no way to accurately determine the true drift of the meter between surveys. Therefore, the gravity values for each survey were essentially measured with respect to an arbitrary datum. To determine a common datum between surveys, a BM located about 3 km south of the field is used as the fixed reference. This BM was assumed to be outside the area that is affected by production or injection related gravity changes. This assumption is verified by checking that other BMs near the margin have no more than a +/- 10 microgal variance from the 1995 survey. The 1994 survey is not used because it was conducted during the wet season and shows some unusual gravity changes at several BMs.
3.2 Data Quality
The Salak gravity data have uncertainties on the order of about 10 microgals with occasional outliers of more than 20 microgals. The uncertainties are illustrated with BM’s that are located near the margins of the production field, where little or no gravity changes related to geothermal production/injection are expected (Figure 5). Typical uncertainties for the elevation data are about 1 to 2 cm, which translate to about 3 to 6 microgals. Seasonal changes in the shallow groundwater levels can also have a significant effect on the gravity. Depending on near-surface porosities and the magnitude of the changes in water level, the measured gravity may vary 10’s or even 100’s of microgals (e.g. Allis and Hunt, 1986). The only survey measured during the wet season (1994) showed some spurious results which were interpreted to be due to shallow groundwater changes beneath several of the BM’s. To reduce the impact of seasonal groundwater level changes, subsequent surveys were scheduled during the dry
season.
4. INTEGRATION WITH SIMULATION RESULTS
A standard practice by Chevron is to compare the observed gravity with the simulated gravity calculated based on the saturation changes and mass changes predicted by the numerical model. This provides an independent check on the mass balance for the numerical model and a quantitative
estimate of the amount of external recharge into the geothermal system. A history match of pressure and enthalpy that is consistent with the gravity data provides further confidence that the simulation model is correctly representing the key features of the reservoir and its response to production and injection (Atkinson and Pederson, 1988).
-20
-10
0
10
20
30
Jan-94
Jan-96
Jan-98
Jan-00
Jan-02
Jan-04
Jan-06
Jan-08
Mic
roG
al
BM's Near Margins
BM 535
BM 210
BM 305
Figure 5: Illustrates data quality for 3 BMs located near the field margins. Locations of the BMs are highlighted on Figure 4.
The objective is to match the trends and magnitudes of the observed gravity changes with the simulated gravity. The simulated surface gravity changes are calculated by associating the gravity change at the surface with predicted density changes in the numerical model’s rectangular blocks in the subsurface using the method of Talwani and Ewing (1960). The density changes occur as a result of saturation changes in the fractures and matrix related to the geothermal production activities. To assess the match, the rates, magnitudes, and areal extents of the calculated and observed gravity changes are compared with time plots and with map views. Where the measured and simulated values appear inconsistent, the numerical model is reviewed and changes made as appropriate.
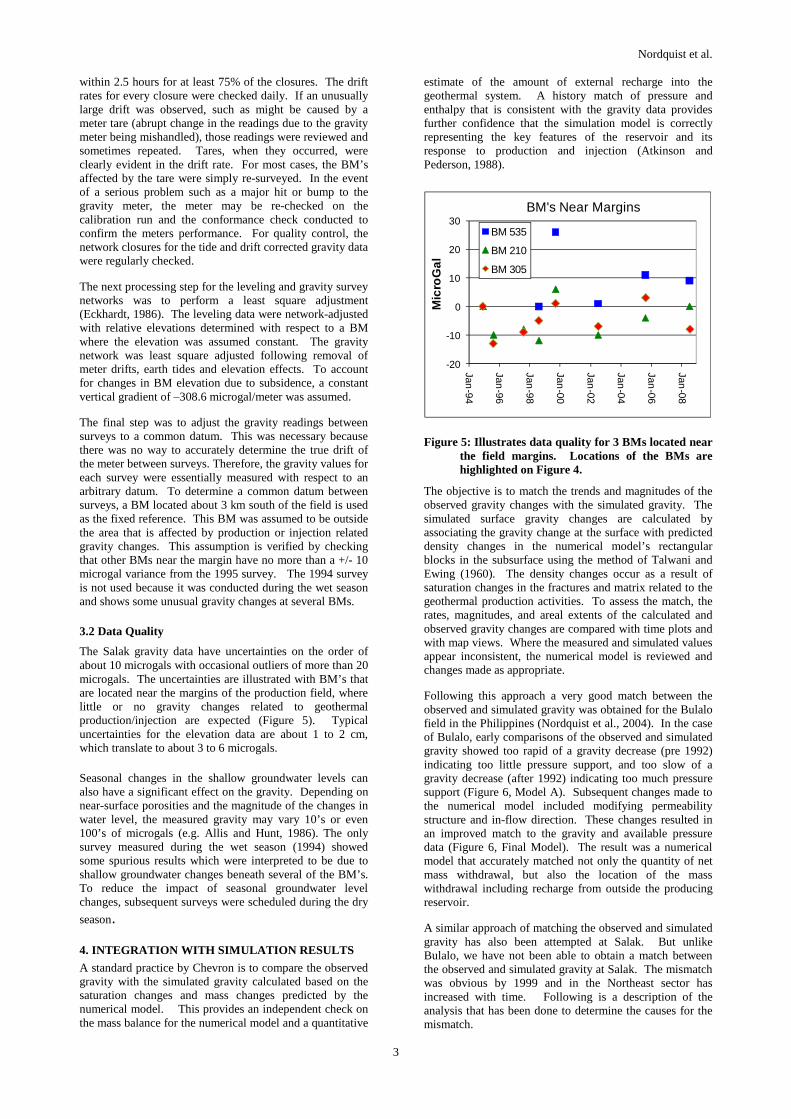
Following this approach a very good match between the observed and simulated gravity was obtained for the Bulalo field in the Philippines (Nordquist et al., 2004). In the case of Bulalo, early comparisons of the observed and simulated gravity showed too rapid of a gravity decrease (pre 1992) indicating too little pressure support, and too slow of a gravity decrease (after 1992) indicating too much pressure support (Figure 6, Model A). Subsequent changes made to the numerical model included modifying permeability structure and in-flow direction. These changes resulted in an improved match to the gravity and available pressure data (Figure 6, Final Model). The result was a numerical model that accurately matched not only the quantity of net mass withdrawal, but also the location of the mass withdrawal including recharge from outside the producing reservoir.
A similar approach of matching the observed and simulated gravity has also been attempted at Salak. But unlike Bulalo, we have not been able to obtain a match between the observed and simulated gravity at Salak. The mismatch was obvious by 1999 and in the Northeast sector has increased with time. Following is a description of the analysis that has been done to determine the causes for the mismatch.
Nordquist et al.
4
Bulalo BM48
-700
-600
-500
-400
-300
-200
-100
0
Jan-
80
Jan-
82
Jan-
84
Jan-
86
Jan-
88
Jan-
90
Jan-
92
Jan-
94
Jan-
96
Jan-
98
Gra
vity
Cha
nge
(Mic
roga
l) ObservedModel AFinal Model
Figure 6: Shows comparison of initial versus final match of observed and simulated gravity for BM from Bulalo field, Philippines.
4.1 Analysis of Gravity Mismatch and Implications
As was the case for Bulalo the initial numerical modeling used the ASTRO/TETRAD code. The dual porosity Salak model constructed with ASTRO did a very good job of matching many parameters of the reservoir except the microgravity.
A study was carried out to investigate the mismatch and the impact of matrix permeability and external recharge on the gravity match (Acuña, 2005). The matrix permeability, fracture spacing and external recharge are the primary variables used to match microgravity. For this study, the fracture spacing was kept constant and the matrix permeability was varied. A reduction in matrix permeability causes a corresponding reduction in the amount of fluid released by the matrix during this period. The same effect could be caused by an increase in fracture spacing.
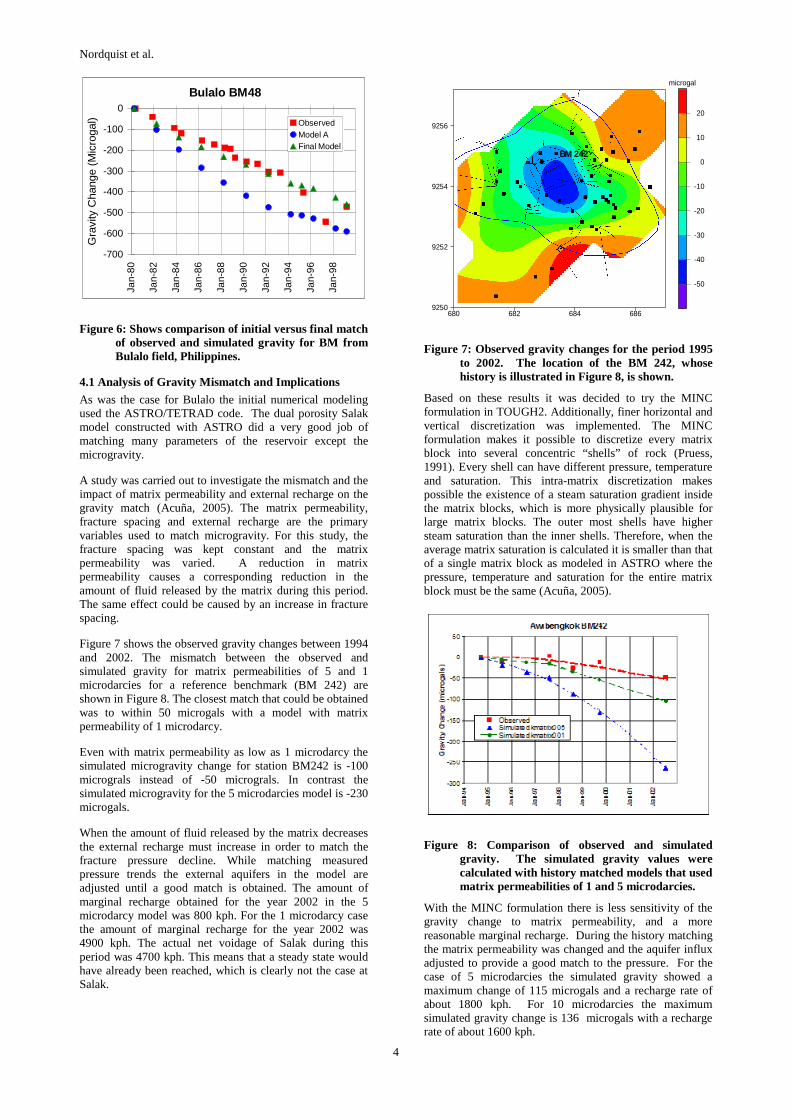
Figure 7 shows the observed gravity changes between 1994 and 2002. The mismatch between the observed and simulated gravity for matrix permeabilities of 5 and 1 microdarcies for a reference benchmark (BM 242) are shown in Figure 8. The closest match that could be obtained was to within 50 microgals with a model with matrix permeability of 1 microdarcy.
Even with matrix permeability as low as 1 microdarcy the simulated microgravity change for station BM242 is -100 micrograls instead of -50 micrograls. In contrast the simulated microgravity for the 5 microdarcies model is -230 microgals.
When the amount of fluid released by the matrix decreases the external recharge must increase in order to match the fracture pressure decline. While matching measured pressure trends the external aquifers in the model are adjusted until a good match is obtained. The amount of marginal recharge obtained for the year 2002 in the 5 microdarcy model was 800 kph. For the 1 microdarcy case the amount of marginal recharge for the year 2002 was 4900 kph. The actual net voidage of Salak during this period was 4700 kph. This means that a steady state would have already been reached, which is clearly not the case at Salak.
680 682 684 6869250
9252
9254
9256
20
10
0
-10
-20
-30
-40
-50
microgal
BM 242
Figure 7: Observed gravity changes for the period 1995 to 2002. The location of the BM 242, whose history is illustrated in Figure 8, is shown.
Based on these results it was decided to try the MINC formulation in TOUGH2. Additionally, finer horizontal and vertical discretization was implemented. The MINC formulation makes it possible to discretize every matrix block into several concentric “shells” of rock (Pruess, 1991). Every shell can have different pressure, temperature and saturation. This intra-matrix discretization makes possible the existence of a steam saturation gradient inside the matrix blocks, which is more physically plausible for large matrix blocks. The outer most shells have higher steam saturation than the inner shells. Therefore, when the average matrix saturation is calculated it is smaller than that of a single matrix block as modeled in ASTRO where the pressure, temperature and saturation for the entire matrix block must be the same (Acuña, 2005).
Figure 8: Comparison of observed and simulated gravity. The simulated gravity values were calculated with history matched models that used matrix permeabilities of 1 and 5 microdarcies.
With the MINC formulation there is less sensitivity of the gravity change to matrix permeability, and a more reasonable marginal recharge. During the history matching the matrix permeability was changed and the aquifer influx adjusted to provide a good match to the pressure. For the case of 5 microdarcies the simulated gravity showed a maximum change of 115 microgals and a recharge rate of about 1800 kph. For 10 microdarcies the maximum simulated gravity change is 136 microgals with a recharge rate of about 1600 kph.
Nordquist et al.
5
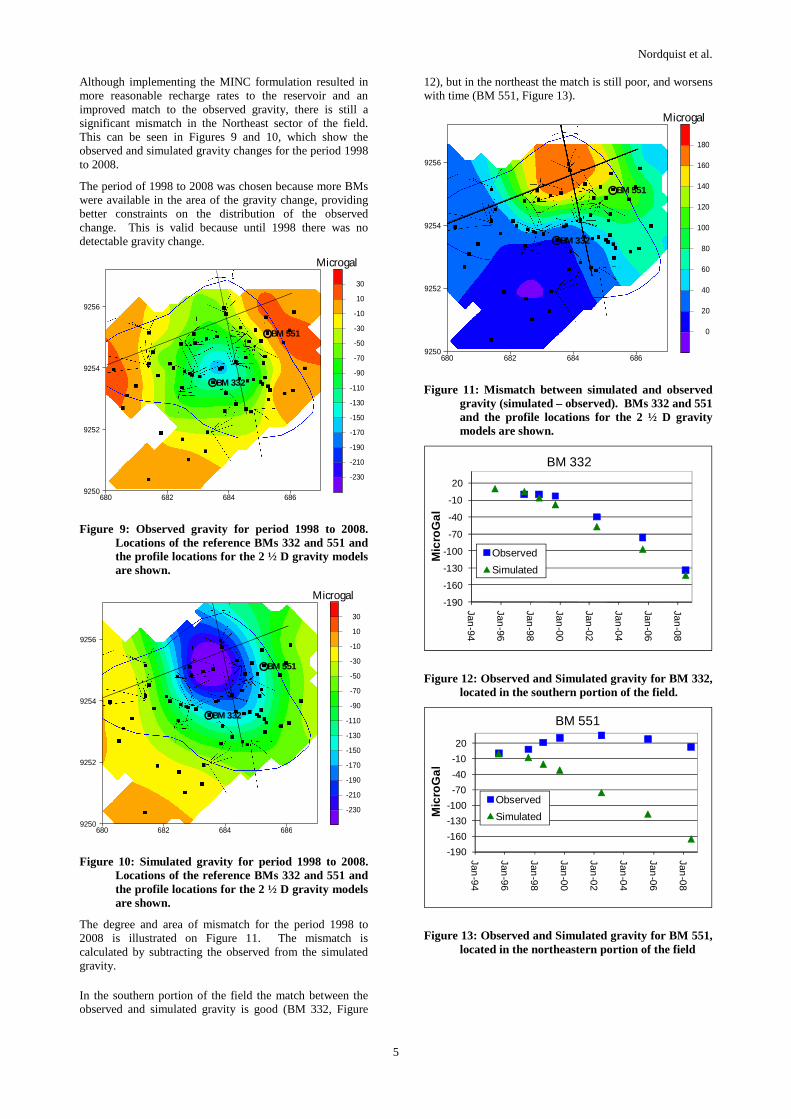
Although implementing the MINC formulation resulted in more reasonable recharge rates to the reservoir and an improved match to the observed gravity, there is still a significant mismatch in the Northeast sector of the field. This can be seen in Figures 9 and 10, which show the observed and simulated gravity changes for the period 1998 to 2008.
The period of 1998 to 2008 was chosen because more BMs were available in the area of the gravity change, providing better constraints on the distribution of the observed change. This is valid because until 1998 there was no detectable gravity change.
680 682 684 6869250
9252
9254
9256
30
10
-10
-30
-50
-70
-90
-110
-130
-150
-170
-190
-210
-230
Microgal
BM 332
BM 551
Figure 9: Observed gravity for period 1998 to 2008. Locations of the reference BMs 332 and 551 and the profile locations for the 2 ½ D gravity models are shown.
680 682 684 6869250
9252
9254
9256
30
10
-10
-30
-50
-70
-90
-110
-130
-150
-170
-190
-210
-230
Microgal
BM 551
BM 332
Figure 10: Simulated gravity for period 1998 to 2008. Locations of the reference BMs 332 and 551 and the profile locations for the 2 ½ D gravity models are shown.
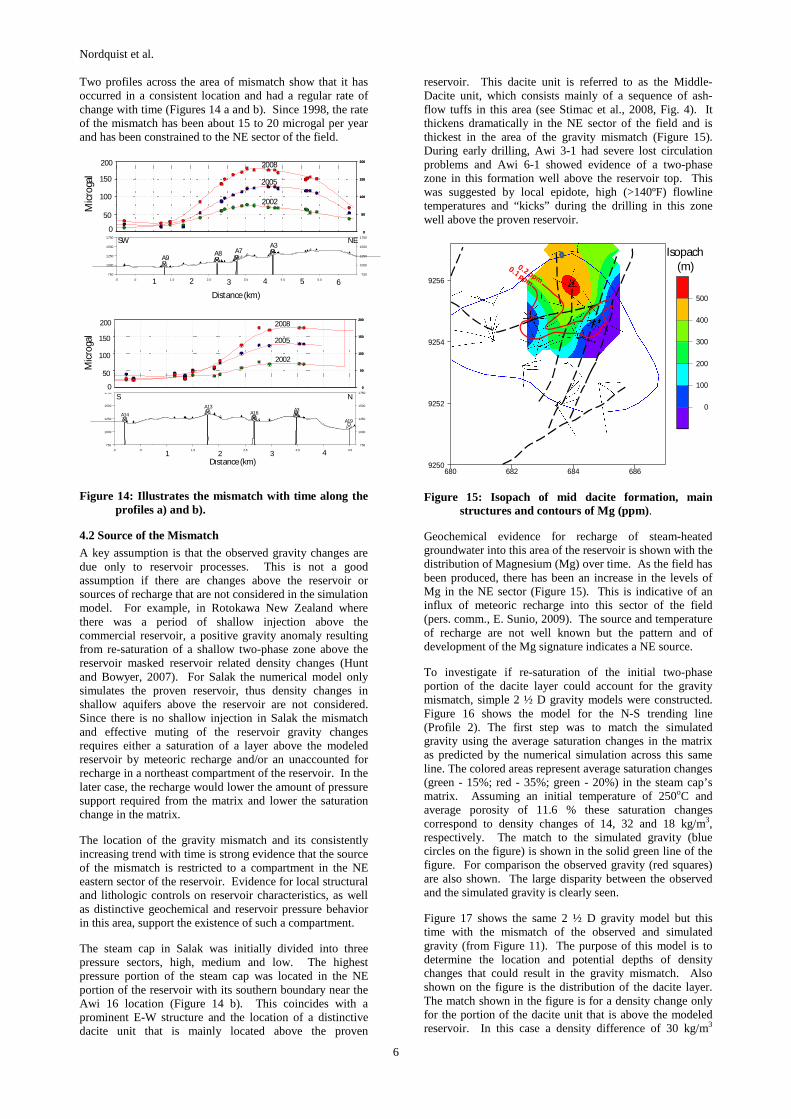
The degree and area of mismatch for the period 1998 to 2008 is illustrated on Figure 11. The mismatch is calculated by subtracting the observed from the simulated gravity.
In the southern portion of the field the match between the observed and simulated gravity is good (BM 332, Figure
12), but in the northeast the match is still poor, and worsens with time (BM 551, Figure 13).
680 682 684 6869250
9252
9254
9256
180
160
140
120
100
80
60
40
20
0
Microgal
BM 551
BM 332
Figure 11: Mismatch between simulated and observed gravity (simulated – observed). BMs 332 and 551 and the profile locations for the 2 ½ D gravity models are shown.
-190
-160
-130
-100
-70
-40
-10
20
Jan-94
Jan-96
Jan-98
Jan-00
Jan-02
Jan-04
Jan-06
Jan-08
Mic
roG
al
BM 332
Observed
Simulated
Figure 12: Observed and Simulated gravity for BM 332, located in the southern portion of the field.
-190
-160
-130
-100
-70
-40
-10
20
Jan-94
Jan-96
Jan-98
Jan-00
Jan-02
Jan-04
Jan-06
Jan-08
Mic
roG
al
BM 551
Observed
Simulated
Figure 13: Observed and Simulated gravity for BM 551, located in the northeastern portion of the field
Nordquist et al.
6
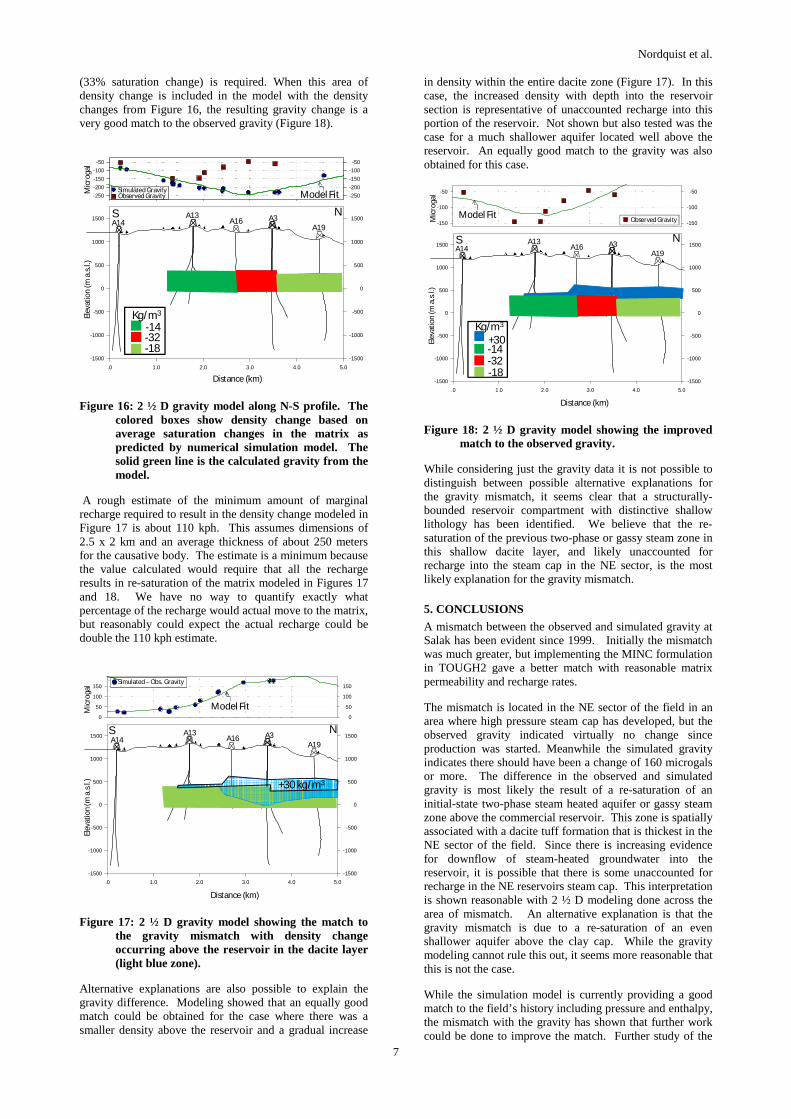
Two profiles across the area of mismatch show that it has occurred in a consistent location and had a regular rate of change with time (Figures 14 a and b). Since 1998, the rate of the mismatch has been about 15 to 20 microgal per year and has been constrained to the NE sector of the field.
200
150
100
50
0
200
150
100
50
0
200
150
100
50
0
200
150
100
50
0
200
150
100
50
0
200
150
100
50
0
.0 .5 1.0 1.5 2.0 2.5 3.0 3.5 4.0 4.5 5.0 5.5 6.0
1750
1500
1250
1000
750
1750
1500
1250
1000
750
A9A8 A7
A3SW NE
2008
2005
2002
Mic
roga
l
Distance (km)
0
50
100
150
200
1 2 3 4 5 6
200
150
100
50
0
200
150
100
50
0
200
150
100
50
0
200
150
100
50
0
200
150
100
50
0
200
150
100
50
0
.0 .5 1.0 1.5 2.0 2.5 3.0 3.5 4.0 4.5
1750
1500
1250
1000
750
1750
1500
1250
1000
750
A14
A13A16
A3
A19
S N
2008
2005
2002
Mic
roga
l
Distance (km)
0
50
100
150
200
1 2 3 4
Figure 14: Illustrates the mismatch with time along the profiles a) and b).
4.2 Source of the Mismatch
A key assumption is that the observed gravity changes are due only to reservoir processes. This is not a good assumption if there are changes above the reservoir or sources of recharge that are not considered in the simulation model. For example, in Rotokawa New Zealand where there was a period of shallow injection above the commercial reservoir, a positive gravity anomaly resulting from re-saturation of a shallow two-phase zone above the reservoir masked reservoir related density changes (Hunt and Bowyer, 2007). For Salak the numerical model only simulates the proven reservoir, thus density changes in shallow aquifers above the reservoir are not considered. Since there is no shallow injection in Salak the mismatch and effective muting of the reservoir gravity changes requires either a saturation of a layer above the modeled reservoir by meteoric recharge and/or an unaccounted for recharge in a northeast compartment of the reservoir. In the later case, the recharge would lower the amount of pressure support required from the matrix and lower the saturation change in the matrix.
The location of the gravity mismatch and its consistently increasing trend with time is strong evidence that the source of the mismatch is restricted to a compartment in the NE eastern sector of the reservoir. Evidence for local structural and lithologic controls on reservoir characteristics, as well as distinctive geochemical and reservoir pressure behavior in this area, support the existence of such a compartment.
The steam cap in Salak was initially divided into three pressure sectors, high, medium and low. The highest pressure portion of the steam cap was located in the NE portion of the reservoir with its southern boundary near the Awi 16 location (Figure 14 b). This coincides with a prominent E-W structure and the location of a distinctive dacite unit that is mainly located above the proven
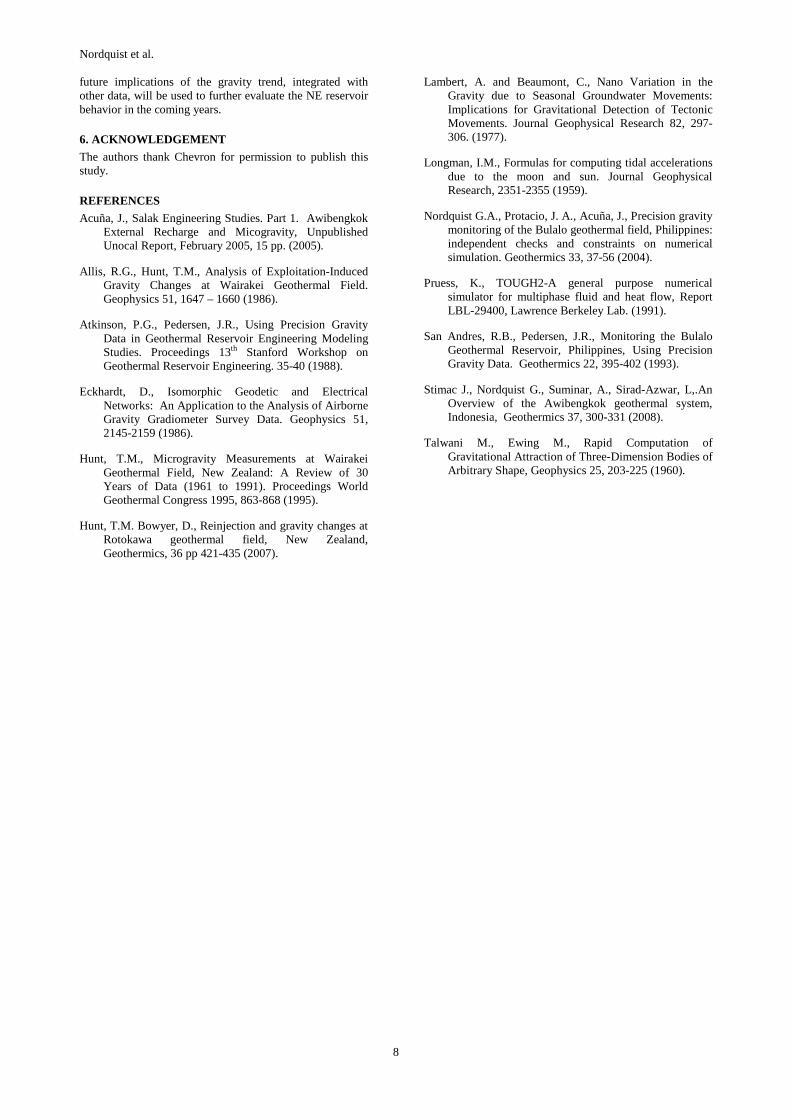
reservoir. This dacite unit is referred to as the Middle-Dacite unit, which consists mainly of a sequence of ash-flow tuffs in this area (see Stimac et al., 2008, Fig. 4). It thickens dramatically in the NE sector of the field and is thickest in the area of the gravity mismatch (Figure 15). During early drilling, Awi 3-1 had severe lost circulation problems and Awi 6-1 showed evidence of a two-phase zone in this formation well above the reservoir top. This was suggested by local epidote, high (>140ºF) flowline temperatures and “kicks” during the drilling in this zone well above the proven reservoir.
680 682 684 6869250
9252
9254
9256
500
400
300
200
100
0
Isopach(m)
Figure 15: Isopach of mid dacite formation, main structures and contours of Mg (ppm).
Geochemical evidence for recharge of steam-heated groundwater into this area of the reservoir is shown with the distribution of Magnesium (Mg) over time. As the field has been produced, there has been an increase in the levels of Mg in the NE sector (Figure 15). This is indicative of an influx of meteoric recharge into this sector of the field (pers. comm., E. Sunio, 2009). The source and temperature of recharge are not well known but the pattern and of development of the Mg signature indicates a NE source.
To investigate if re-saturation of the initial two-phase portion of the dacite layer could account for the gravity mismatch, simple 2 ½ D gravity models were constructed. Figure 16 shows the model for the N-S trending line (Profile 2). The first step was to match the simulated gravity using the average saturation changes in the matrix as predicted by the numerical simulation across this same line. The colored areas represent average saturation changes (green - 15%; red - 35%; green - 20%) in the steam cap’s matrix. Assuming an initial temperature of 250oC and average porosity of 11.6 % these saturation changes correspond to density changes of 14, 32 and 18 kg/m3, respectively. The match to the simulated gravity (blue circles on the figure) is shown in the solid green line of the figure. For comparison the observed gravity (red squares) are also shown. The large disparity between the observed and the simulated gravity is clearly seen.
Figure 17 shows the same 2 ½ D gravity model but this time with the mismatch of the observed and simulated gravity (from Figure 11). The purpose of this model is to determine the location and potential depths of density changes that could result in the gravity mismatch. Also shown on the figure is the distribution of the dacite layer. The match shown in the figure is for a density change only for the portion of the dacite unit that is above the modeled reservoir. In this case a density difference of 30 kg/m3
Nordquist et al.
7
(33% saturation change) is required. When this area of density change is included in the model with the density changes from Figure 16, the resulting gravity change is a very good match to the observed gravity (Figure 18).
d=985.000 d=980.000d=968.000
-50
-100
-150
-200
-250
-50
-100
-150
-200
-250
.0 1.0 2.0 3.0 4.0 5.0
1500
1000
500
0
-500
-1000
-1500
1500
1000
500
0
-500
-1000
-1500
Mic
roga
lEl
evat
ion
(m a
.s.l.
)
Distance (km)
Observed GravitySimulated Gravity
A14A13
A16 A3A19
NS
-14-32-18
Kg/m3
Model Fit
Figure 16: 2 ½ D gravity model along N-S profile. The colored boxes show density change based on average saturation changes in the matrix as predicted by numerical simulation model. The solid green line is the calculated gravity from the model.
A rough estimate of the minimum amount of marginal recharge required to result in the density change modeled in Figure 17 is about 110 kph. This assumes dimensions of 2.5 x 2 km and an average thickness of about 250 meters for the causative body. The estimate is a minimum because the value calculated would require that all the recharge results in re-saturation of the matrix modeled in Figures 17 and 18. We have no way to quantify exactly what percentage of the recharge would actual move to the matrix, but reasonably could expect the actual recharge could be double the 110 kph estimate.
0 0
.0 1.0 2.0 3.0 4.0 5.0
1500
1000
500
0
-500
-1000
-1500
1500
1000
500
0
-500
-1000
-1500
Simulated – Obs. Gravity
Mic
roga
lEl
evat
ion
(m a
.s.l.
)
Distance (km)
150
100
50
0
150
100
50
0
+30 kg/m3
A14A13
A16 A3A19
NS
Model Fit
Figure 17: 2 ½ D gravity model showing the match to the gravity mismatch with density change occurring above the reservoir in the dacite layer (light blue zone).
Alternative explanations are also possible to explain the gravity difference. Modeling showed that an equally good match could be obtained for the case where there was a smaller density above the reservoir and a gradual increase
in density within the entire dacite zone (Figure 17). In this case, the increased density with depth into the reservoir section is representative of unaccounted recharge into this portion of the reservoir. Not shown but also tested was the case for a much shallower aquifer located well above the reservoir. An equally good match to the gravity was also obtained for this case.
0 0
.0 1.0 2.0 3.0 4.0 5.0
1500
1000
500
0
-500
-1000
-1500
1500
1000
500
0
-500
-1000
-1500
-50
-100
-150
-50
-100
-150Observed GravityMic
roga
lEl
evat
ion
(m a
.s.l.
)
Distance (km)
A14A13
A16 A3A19
NS
-32
Kg/m3
Model Fit
-14
-18
+30
Figure 18: 2 ½ D gravity model showing the improved match to the observed gravity.
While considering just the gravity data it is not possible to distinguish between possible alternative explanations for the gravity mismatch, it seems clear that a structurally-bounded reservoir compartment with distinctive shallow lithology has been identified. We believe that the re-saturation of the previous two-phase or gassy steam zone in this shallow dacite layer, and likely unaccounted for recharge into the steam cap in the NE sector, is the most likely explanation for the gravity mismatch.
5. CONCLUSIONS
A mismatch between the observed and simulated gravity at Salak has been evident since 1999. Initially the mismatch was much greater, but implementing the MINC formulation in TOUGH2 gave a better match with reasonable matrix permeability and recharge rates.
The mismatch is located in the NE sector of the field in an area where high pressure steam cap has developed, but the observed gravity indicated virtually no change since production was started. Meanwhile the simulated gravity indicates there should have been a change of 160 microgals or more. The difference in the observed and simulated gravity is most likely the result of a re-saturation of an initial-state two-phase steam heated aquifer or gassy steam zone above the commercial reservoir. This zone is spatially associated with a dacite tuff formation that is thickest in the NE sector of the field. Since there is increasing evidence for downflow of steam-heated groundwater into the reservoir, it is possible that there is some unaccounted for recharge in the NE reservoirs steam cap. This interpretation is shown reasonable with 2 ½ D modeling done across the area of mismatch. An alternative explanation is that the gravity mismatch is due to a re-saturation of an even shallower aquifer above the clay cap. While the gravity modeling cannot rule this out, it seems more reasonable that this is not the case.
While the simulation model is currently providing a good match to the field’s history including pressure and enthalpy, the mismatch with the gravity has shown that further work could be done to improve the match. Further study of the
Nordquist et al.
8
future implications of the gravity trend, integrated with other data, will be used to further evaluate the NE reservoir behavior in the coming years.
6. ACKNOWLEDGEMENT
The authors thank Chevron for permission to publish this study.
REFERENCES
Acuña, J., Salak Engineering Studies. Part 1. Awibengkok External Recharge and Micogravity, Unpublished Unocal Report, February 2005, 15 pp. (2005).
Allis, R.G., Hunt, T.M., Analysis of Exploitation-Induced Gravity Changes at Wairakei Geothermal Field. Geophysics 51, 1647 – 1660 (1986).
Atkinson, P.G., Pedersen, J.R., Using Precision Gravity Data in Geothermal Reservoir Engineering Modeling Studies. Proceedings 13th Stanford Workshop on Geothermal Reservoir Engineering. 35-40 (1988).
Eckhardt, D., Isomorphic Geodetic and Electrical Networks: An Application to the Analysis of Airborne Gravity Gradiometer Survey Data. Geophysics 51, 2145-2159 (1986).
Hunt, T.M., Microgravity Measurements at Wairakei Geothermal Field, New Zealand: A Review of 30 Years of Data (1961 to 1991). Proceedings World Geothermal Congress 1995, 863-868 (1995).
Hunt, T.M. Bowyer, D., Reinjection and gravity changes at Rotokawa geothermal field, New Zealand, Geothermics, 36 pp 421-435 (2007).
Lambert, A. and Beaumont, C., Nano Variation in the Gravity due to Seasonal Groundwater Movements: Implications for Gravitational Detection of Tectonic Movements. Journal Geophysical Research 82, 297-306. (1977).
Longman, I.M., Formulas for computing tidal accelerations due to the moon and sun. Journal Geophysical Research, 2351-2355 (1959).
Nordquist G.A., Protacio, J. A., Acuña, J., Precision gravity monitoring of the Bulalo geothermal field, Philippines: independent checks and constraints on numerical simulation. Geothermics 33, 37-56 (2004).
Pruess, K., TOUGH2-A general purpose numerical simulator for multiphase fluid and heat flow, Report LBL-29400, Lawrence Berkeley Lab. (1991).
San Andres, R.B., Pedersen, J.R., Monitoring the Bulalo Geothermal Reservoir, Philippines, Using Precision Gravity Data. Geothermics 22, 395-402 (1993).
Stimac J., Nordquist G., Suminar, A., Sirad-Azwar, L,.An Overview of the Awibengkok geothermal system, Indonesia, Geothermics 37, 300-331 (2008).
Talwani M., Ewing M., Rapid Computation of Gravitational Attraction of Three-Dimension Bodies of Arbitrary Shape, Geophysics 25, 203-225 (1960).