Embed Size (px)
Citation preview

PRECISE™ SAP PERFORMANCE ADVISOR
Copyright © 2012 Precise Software Solutions, Inc. All rights reserved. Page 1 of 9
PRECISE™ SAP LITE PERFORMANCE ASSESSMENT
SAP Performance Advisor

PRECISE SAP PERFORMANCE ADVISOR
PRECISE™ SAP PERFORMANCE ADVISOR
Copyright © 2012 Precise Software Solutions, Inc. All rights reserved. Page 2 of 9
Overview
Using Precise™ for SAP, we can quickly identify poor performing SAP applications including transactions, SAP batches and RFC functions as well as identifying a SAP users’ experience. With Precise we can also identify the SQL statements that are causing the performance issues and provide recommendations to resolve those performance issues. All of this can be done very quickly, within a few clicks.
In this document we will review the health of SAP landscape, we will identify poor FB03 SAP transaction (transaction responsible for display documents), find the user/s which are being impacted by slow transaction, and understand where we spent the majority of the time (SAP Application, SAP queue, DB time, DB query etc). We will also provide recommendations to improve slow transaction response-time.
Identify the SAP transactions
With Precise, it is easy to identify the SAP transactions as shown in the screenshot below. The SAP transactions can be seen in the Precise Dashboard. In the screenshot we can see the top SAP transactions.
We can see the average response time for the transaction as well as whether it breaches its SLA compliance.
We will choose the transaction FB03 to investigate. This SAP transaction is used to display a document.
By clicking on the FB03 SAP transaction we will be taken to the Precise Activity Tab.
This shows us the SAP transaction we have chosen (FB03). It displays a graph showing the average response time for the transaction over the reporting period. It shows where the time is spent, whether it is in the Client; Queue time; Application or Database time.

PRECISE SAP PERFORMANCE ADVISOR
PRECISE™ SAP PERFORMANCE ADVISOR
Copyright © 2012 Precise Software Solutions, Inc. All rights reserved. Page 3 of 9
Analyzing the SAP transaction
Looking at the SAP Activity Tab we can see a number of tabs that give us information about the SAP transaction. We can see the General Tab; Response Time tab; Client Tab; Application Tab; Database Tab and Resources.
We can see in the General Tab that the Transaction has an average response time of 21.054 seconds and the Backend response time is 18.074 seconds. We can see that the response time is mainly broken down into Application and Database time.
We can see in the Response Time tab, the summed times for the Backend, Client, Queue, Application and Database times. This shows that the majority of the time is spent in the Application and Database.

PRECISE SAP PERFORMANCE ADVISOR
PRECISE™ SAP PERFORMANCE ADVISOR
Copyright © 2012 Precise Software Solutions, Inc. All rights reserved. Page 4 of 9
We can see in the Client Tab that the time spent in the GUI is 2.921 seconds on average (The time spent for the first round-trip to pass from the SAP application server to the client, including the time spent in the client machine), the network time is 0.0058 on average per transaction and there are on average 3 network roundtrips per transaction.
We can see in the Application Tab that the SAP transaction on average spent 0.003 seconds in Load + Generate time ( Time spent loading from the database and generating objects, such as ABAP source code, CUA and screen information ); 2.921 seconds in Roll time ( The time the program spends waiting at the application level for the GUI to respond) and 5.5 seconds in Processing time. We can see from here that the recommendation would be to look at the application time further and see whether the Roll time and Processing time can be tuned.
Looking at the Resources Tab we can see the resource used by the SAP transaction. We can see the memory, CPU and Kbytes transferred. We can see that the transaction is using 7.41 seconds on average.
Looking at the Database time we can see the activity that is occurring in the database including Sequential Reads, Direct Reads and Updates. We will be able to look at the Database activity in further detail by selecting the Analyze button.
By selecting the SAP transaction of interest and pressing the Analyze button we will then be taken to the SAP Oracle Activity Tab. User we will then be taken to the Precise for SAP Activity Tab.
SAP transaction - Oracle view
The SAP Oracle Activity Tab is filtered only to show the SAP transaction FB03. We can see only the SQL statements for that SAP transaction. From the screenshot, we can see very quickly the SQL statements that are consuming the most time.
We can see that statement 16994 is consuming over 99.9% of the time for the FB03 SAP transaction. We can see that the statement is spending time in CPU and also consuming I/O.
We can see that the average time in Oracle for statement 16994 is 0.5 seconds and there are 38,405 executions.
We can investigate this SQL statement further by selecting the “Tune” icon to the left of the SQL statement. This will then take us to the SQL Tab.
PRECISE SAP PERFORMANCE ADVISOR
PRECISE™ SAP PERFORMANCE ADVISOR
Copyright © 2012 Precise Software Solutions, Inc. All rights reserved. Page 5 of 9
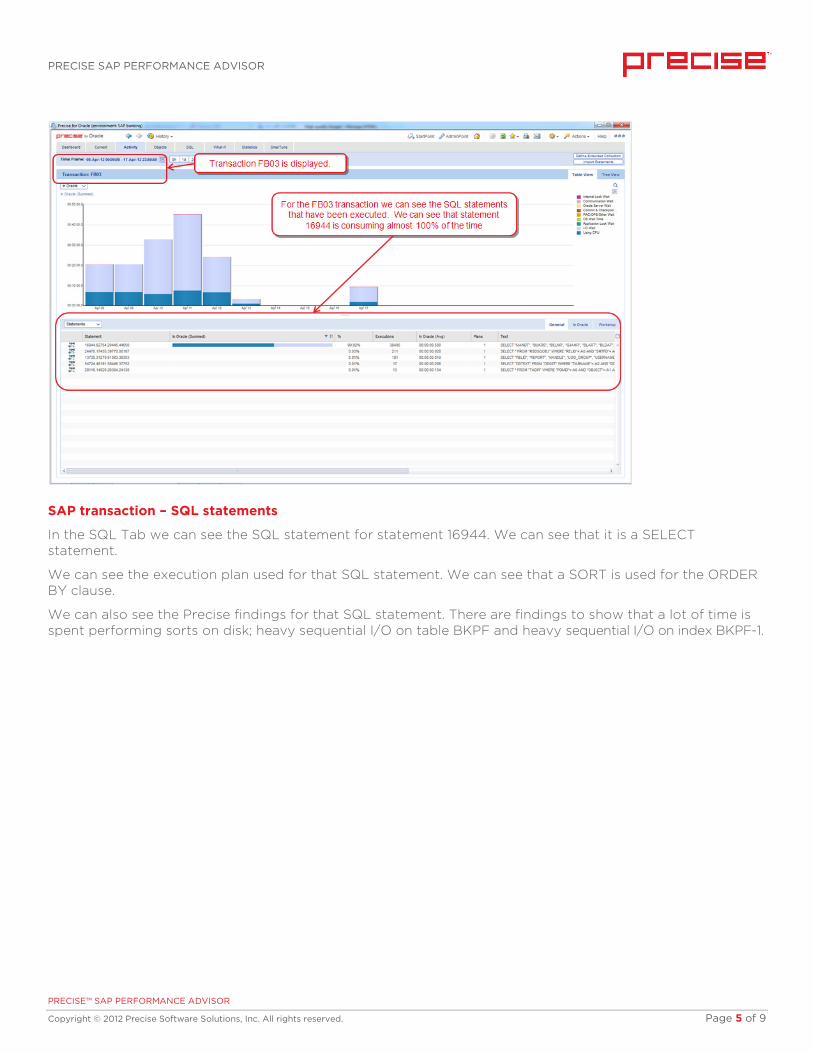
SAP transaction – SQL statements
In the SQL Tab we can see the SQL statement for statement 16944. We can see that it is a SELECT statement.
We can see the execution plan used for that SQL statement. We can see that a SORT is used for the ORDER BY clause.
We can also see the Precise findings for that SQL statement. There are findings to show that a lot of time is spent performing sorts on disk; heavy sequential I/O on table BKPF and heavy sequential I/O on index BKPF-1.

PRECISE SAP PERFORMANCE ADVISOR
PRECISE™ SAP PERFORMANCE ADVISOR
Copyright © 2012 Precise Software Solutions, Inc. All rights reserved. Page 6 of 9
SQL statement recommendations
In the Recommendations Tab for the SQL statement we can see the recommendations to improve the performance of the SQL statement.
In this example it is showing that the statement would benefit from a new index on the BKPF table and the index should be created on the columns MANDT, BSTAT, BLART and BUKRS.
It also shows links to the evaluation of the effects of this index.

PRECISE SAP PERFORMANCE ADVISOR
PRECISE™ SAP PERFORMANCE ADVISOR
Copyright © 2012 Precise Software Solutions, Inc. All rights reserved. Page 7 of 9
What-If evaluation
In the What-If Tab we can see the effects of the recommended index on that SQL statement and also any other SQL statements that access the table and could be affected by this index change.
We can see the statements affected and whether the index will have a positive or negative on the SQL statements.
PRECISE SAP PERFORMANCE ADVISOR
PRECISE™ SAP PERFORMANCE ADVISOR
Copyright © 2012 Precise Software Solutions, Inc. All rights reserved. Page 8 of 9
Summary
We have seen how easy it is to identify the top resource consuming SAP transactions. This is identified within the Precise SAP Dashboard.
By identifying the SAP transaction of interest (FB03) we can see the time spent in the Client; Queue Time; Application Time and Database Time in the SAP Activity Tab.
We can see that the SAP transaction is spending substantial time in the application with the processing time and the Roll time. This should be investigated further.
We can then choose the Analyze button to see the time spent by the transaction in the Oracle database. From here we can see the SQL statements executed by that SAP transaction.
By then selecting that SQL statement we can see the execution plan and also the findings for that SQL statement.
By looking at the recommendations for that SQL statement, an index can be created to reduce the SQL statement cost.
This shows how in a few simple steps it is possible to identify, diagnose and resolve performance issues in SAP.

PRECISE SAP PERFORMANCE ADVISOR
PRECISE™ SAP PERFORMANCE ADVISOR
Copyright © 2012 Precise Software Solutions, Inc. All rights reserved. Page 9 of 9
Precise™ SAP Performance Advisor
Document Release Version 1.0
Precise™, Precise Software™, the Precise™ Logo, Precise Precise i ™, Precise Indepth™, Precise Insight™, Precise Savvy™, SmarTune™,
Performance Warehouse™, Application Service Dashboard™, Precise for Storage Tiering™, Precise for Storage Tiering Plus Apps™,
Precise for Database & Storage™, Precise for Applications™, Precise for Storage™, Precise Insight Inquire™, Performance Management
Database™, and PMDB™ are trademarks or registered trademarks of Precise Software Solutions, Inc. or its affiliates in the U.S. and other
countries. Other names may be trademarks of their respective owners.
The product described in this document is distributed under licenses restricting its use, copying, distribution, decompilation and/or
reverse engineering. No part of this document may be reproduced in any form by any means without prior written authorization of
Precise Software Solutions, Inc. and its licensors, if any.
Certain third-party software may be distributed, embedded, or bundled with this product or recommended for use in connection with its
installation and use. Such third-party software is separately licensed by its copyright holder. The list that includes the names of the
copyright and license agreements can be found in the Release Notes document.
THE DOCUMENTATION IS PROVIDED “AS-IS” AND ALL EXPRESS OR IMPLIED CONDITIONS, REPRESENTATIONS AND WARRANTIES,
INCLUDING ANY IMPLIED WARRANTY OF MERCHANTABILITY, FITNESS FOR A PARTICULAR PURPOSE OR NON-INFRINGEMENT,
ARE DISCLAIMED, EXCEPT TO THE EXTENT THAT SUCH DISCLAIMERS ARE HELD TO BE LEGALLY INVALID. PRECISE SOFTWARE
SOLUTIONS, INC. SHALL NOT BE LIABLE FOR INCIDENTAL OR CONSEQUENTIAL DAMAGES IN CONNECTION WITH THE
FURNISHING, PERFORMANCE, OR USE OF THIS DOCUMENTATION. THE INFORMATION CONTAINED IN THIS DOCUMENTATION IS
SUBJECT TO CHANGE WITHOUT NOTICE.
The Licensed Software and Documentation are deemed to be commercial computer software as defined in FAR 12.212 and subject to
restricted rights as defined in FAR Section 52.227-19 “Commercial Computer Software - Restricted Rights” and DFARS 227.7202, “Rights
in Commercial Computer Software or Commercial Computer Software Documentation”, as applicable, and any successor regulations.
Any use, modification, reproduction release, performance, display or disclosure of the Licensed Software and Documentation by the U.S.
Government shall be solely in accordance with the terms of this Agreement.
Precise Software Solutions, Inc.
3 Twin Dolphin Drive
Suite 350
Redwood Shores, CA 94065