Embed Size (px)
Citation preview

Precalculus Mathematics: 2012-13 to 2017-18 Hoover City Schools
Page 1 of 23
Jump to… Scope and Sequence Map Units of Study Correlation of Standards Special Notes
Scope and Sequence Map
Conceptual Categories, Domains, Content Clusters, & Standard Numbers Units of Study (expected proficiency)
1st nwks 2nd nwks 3rd nwks 4th nwks
NUMBER AND QUANTITY (N)
The Complex Number System (CN) Represent complex numbers and their operations on the complex plane: 1(+), 2(+), 3(+)
9
Limits Understand limits of functions: 4(AL)
12
Vector and Matrix Quantities (VM) Represent and model with vector quantities: 5(+), 6(+), 7(+) Perform operations on vectors: 8(+), 9(+) Perform operations on matrices and use matrices in applications: 10(+), 11(+)
6 8
ALGEBRA (A)
Seeing Structure in Expressions (SSE) Write expressions in equivalent forms to solve problems: 12(+)
Arithmetic With Polynomial and Rational Expressions (APR) Use polynomial identities to solve problems: 13(+)
Reasoning With Equations and Inequalities (REI) Solve systems of equations: 14(+)
6
FUNCTIONS (F)
Conic Sections Understand the graphs and equations of conic sections: 15(AL)
7
Interpreting Functions (IF) Interpret functions that arise in applications in terms of the context: 16(+), 17(+) Analyze functions using different representations: 18(+)
1, 2 4
Building Functions (BF) Build a function that models a relationship between two quantities: 19(+) Build new functions from existing functions: 20(AL), 21(+), 22(+), 23(+), 24(+), 25(AL)
1, 3 4

Precalculus Mathematics: 2012-13 to 2017-18 Hoover City Schools
Page 2 of 23
Conceptual Categories, Domains, Content Clusters, & Standard Numbers Units of Study (expected proficiency)
1st nwks 2nd nwks 3rd nwks 4th nwks
Trigonometric Functions (TF) Recognize attributes of trigonometric functions and solve problems involving trigonometry: 26(AL),
27(AL), 28(AL) Extend the domain of trigonometric functions using the unit circle: 29(+), 30(+) Model periodic phenomena with trigonometric functions: 31(+), 32(+) Prove and apply trigonometric identities: 33(AL), 34(+)
4, 5 7
GEOMETRY (G)
Similarity, Right Triangles, and Trigonometry (SRT) Apply trigonometry to general triangles: 35(+)
4
Expressing Geometric Properties With Equations (GPE) Translate between the geometric description and the equation for a conic section: 36(+), 37(+) Explain volume formulas and use them to solve problems: 38(+)
7
STATISTICS AND PROBABILITY (S)
Interpreting Categorical and Quantitative Data (ID) Summarize, represent, and interpret data on a single count or measurement variable: 39(AL), 40(AL),
41, 42, 43
11
Making Inferences and Justifying Conclusions (IC) Understand and evaluate random processes underlying statistical experiments: 44, 45 Make inferences and justify conclusions from sample surveys, experiments, and observational
studies: 46, 47, 48, 49
11
Using Probability to Make Decisions (MD) Calculate expected values and use them to solve problems: 50(+), 51(+), 52(+), 53(+) Use probability to evaluate outcomes of decisions: 54(+)
11
Back to top
Units of Study Back to top
Unit 1- Functions and Their Graphs Indicators of Proficiency
Standards COS # CCSS # Basic Proficient Advanced Identify and evaluate even, odd, and piecewise functions. 16 F-IF4
Identify functions and evaluate piecewise functions
Identify even and odd functions by their graphs, and evaluate piecewise functions
Identify even and odd functions by graphs or and by substitution, and evaluate piecewise

Precalculus Mathematics: 2012-13 to 2017-18 Hoover City Schools
Page 3 of 23
Unit 1- Functions and Their Graphs Indicators of Proficiency
Standards COS # CCSS # Basic Proficient Advanced functions
Describe continuity and end behavior of functions using limits. 16 F-IF4
Describe continuity and end behavior of a function defined graphically
Describe continuity and end behavior of a function defined graphically or numerically
Describe continuity and end behavior of a function defined graphically, numerically, or analytically
Find intervals on which functions are increasing, constant, or decreasing. 16
F-IF4
Identify intervals of increase, decrease, or constant slope of a graphed function
Graph a function and identify intervals of increase, decrease, or constant slope
Solve word problems by graphing functions and finding intervals of increase, decrease, and constant slope
Determine the average rate of change of a function.
17 F-IF6
Determine the average rate of change of by formula
Determine the average rate of change of a function by formula and interpret graphically
Approximate instantaneous rate of change using a sequence of average rates of change
Graph and analyze basic functions and transformations of basic functions. Include piecewise, step, and absolute value functions, in addition to other functions.
16,18 F-IF7
Identify basic functions Identify transformations of basic functions
Identify multiple transformations of basic functions
Perform operations with functions.
Hoover
Perform operations on functions
Perform operations on functions and find the new domain and range
Perform operations on functions, find the new domain and range, and express operations as compositions of functions
Compose functions. Example: If ( ) is the temperature in the atmosphere as a function of height, and ( ) is the height of the weather balloon as a function of time, then ( ( )) is the temperature at the location of weather balloon as a function of time.
19 F-BF1
Given two explicit functions of x, write a composition in terms of x, and evaluate it for a given value of x
Find the domain of a composition of two functions of x, and simplify a composite function to demonstrate equality with another composite
Identify components of a composite function and describe it as a transformation of elementary functions
Determine the inverse of a function and a relation.
20
Find the inverse of a function or a relation using the graph, and find its range and domain
Find the inverse of a function using the formula and find its range and domain
Find the inverse of a function with more than one x in its formula, and find its range and domain
Verify by composition that one function is the inverse of another. 21 F-BF4
Compose inverse functions with one x in both formulas
Compose inverse functions with more than one x in both formulas
Compose inverse functions and simplify using common denominators and conjugate roots
Read values of an inverse function from a graph or a 22 F-BF4 Evaluate an inverse Evaluate compositions and Solve compositions and

Precalculus Mathematics: 2012-13 to 2017-18 Hoover City Schools
Page 4 of 23
Unit 1- Functions and Their Graphs Indicators of Proficiency
Standards COS # CCSS # Basic Proficient Advanced table, given that the function has an inverse. function by table operations of functions and
inverses by table operations of functions and inverses by table
Produce an invertible function from a non-invertible function by restricting the domain. 23 F-BF4
Restrict the domain of a function to make it invertible, given its graph
Restrict the domain of a function to make it invertible, given its formula
Divide the domain of a function to make each part invertible, and find the inverse of each part
Instructional Recommendations / Resources:
Back to top
Unit 2- Power, Polynomial, and Rational Functions Indicators of Proficiency
Standards COS # CCSS # Basic Proficient Advanced Graph and analyze power, radical, polynomial, and rational functions. 16,18
F-IF7b,c,d
Identify and describe graphs of functions
Graph and describe functions by plotting points
Graph and describe functions using algebraic properties
Solve radical and rational equations. Hoover
Solve radical and rational equations graphically
Solve radical and rational equations graphically and algebraically
Solve word problems by solving equations algebraically
Find complex zeros of polynomial functions.
Hoover
Find complex zeroes of quadratics and when given conjugates
Find complex zeroes of polynomials and when given conjugates
Find complex zeroes of polynomials and when given conjugates, and plot them in complex space
Solve polynomial and rational inequalities.
Hoover
Solve polynomial and rational inequalities graphically
Solve polynomial and rational inequalities graphically and algebraically
Solve word problems by solving polynomial and rational inequalities graphically and algebraically
Model real-world data with polynomial functions.
Hoover
Evaluate a given polynomial that models real world data
Use a graphing calculator to generate and evaluate a polynomial that models real world data
Use algebra to generate and evaluate a polynomial that models real world data
Instructional Recommendations / Resources:
Back to top

Precalculus Mathematics: 2012-13 to 2017-18 Hoover City Schools
Page 5 of 23
Unit 3- Exponential and Logarithmic Functions Indicators of Proficiency
Standards COS # CCSS # Basic Proficient Advanced Graph and analyze exponential and logarithmic functions.
16,18 F-IF7e
Graph an exponential or logarithmic function with no transformations, showing asymptotes and two known points
Graph an exponential or logarithmic function with an integer base and up to two transformations, showing asymptotes and two known points
Graph an exponential or logarithmic function with more than two transformations, showing asymptotes and at least two known points, including x and y intercepts if applicable
Solve problems involving exponential growth and decay. Hoover
Set up and evaluate exponential and functions that model growth and decay
Solve growth and decay problems for time using logarithms
Solve growth and decay problems for any factor using logarithms
Calculate future values of annuities and monthly payments. Hoover
Set up and evaluate exponential and functions that model annuities and monthly payments
Solve annuity and monthly payment problems for time using logarithms
Solve annuity and monthly payment problems for any factor using logarithms
Solve exponential and logarithmic equations and inequalities.
Hoover
Solve exponential and logarithmic inequalities graphically
Solve exponential and logarithmic inequalities graphically and algebraically
Solve word problems by solving exponential and logarithmic inequalities graphically and algebraically
Model data using exponential, logarithmic, and logistic functions.
Hoover
Evaluate a given exponential, logarithmic, or logistic functions that models real world data
Use a graphing calculator to generate and evaluate an exponential, logarithmic, or logistic function that models real world data
Use algebra to generate and evaluate an exponential, logarithmic, or logistic function that models real world data
Understand the inverse relationship between exponents and logarithms, and use this relationship to solve problems involving logarithms and exponents. 24 F-BF5
Convert between logarithmic equations and exponential equations, and solve exponential equations by finding a common base
Solve exponential and logarithmic equations by applying an exponent or logarithm with an integer base that cancels out
Solve exponential and logarithmic equations by applying a natural logarithm or exponent and the algebraic properties of exponents and logarithms
Set up and evaluate exponential and functions that model growth and decay
Solve growth and decay problems for time using logarithms
Solve growth and decay problems for any factor using logarithms
Compare effects of parameter changes on graphs of transcendental functions.
25
Graph an exponential or logarithmic function with
Graph an exponential or logarithmic function with
Graph an exponential or logarithmic function with

Precalculus Mathematics: 2012-13 to 2017-18 Hoover City Schools
Page 6 of 23
Unit 3- Exponential and Logarithmic Functions Indicators of Proficiency
Standards COS # CCSS # Basic Proficient Advanced Example: Explain the relationship between the graph to .
no transformations, showing asymptotes and two known points
an integer base and up to two transformations, showing asymptotes and two known points
more than two transformations, showing asymptotes and at least two known points, including x and y intercepts if applicable
Evaluate logarithms using the change of base formula
Change the base of an exponent using the power rule for logarithms
Interpret changes of base as translations and dilations of exponential or logarithmic functions
Instructional Recommendations / Resources:
Back to top
Unit 4- Trigonometric Functions Indicators of Proficiency
Standards COS # CCSS # Basic Proficient Advanced Solve right triangles. Hoover
Solve right triangles given a labeled diagram
Solve right triangles without a given diagram
Solve word problems using right triangles
Convert degree measures of angles to radian measures and vice versa.
Hoover Convert given conversion rules
Convert without being given conversion rules
Convert without being given conversion rules
Find arc length, angular and linear speeds, and areas of sectors. Hoover
Find quantities using given formulas
Find quantities without being given formulas
Solve word problems involving arc length, angular and linear speeds, and areas of sectors
Define and apply the six trigonometric functions.
Hoover
Find exact trigonometric function values with aid of unit circle and approximate values with a calculator
Find exact trigonometric function values with aid of unit circle and approximate values with a calculator
Solve problems involving use of trigonometric functions
Graph and analyze the six trigonometric functions and their transformations.
16,18 F-IF7e
Graph and analyze trigonometric functions containing one transformation
Graph and analyze trigonometric functions containing two or more transformations
Solve problems using sinusoidal functions and graph damped trigonometric functions
Evaluate inverse trigonometric functions.
18 F-IF7e
Evaluate basic inverse trigonometric functions
Evaluate compositions of inverse trigonometric functions
Graph inverse trigonometric functions and solve word problems
involving inverse trigonometric functions
Precalculus Mathematics: 2012-13 to 2017-18 Hoover City Schools
Page 7 of 23
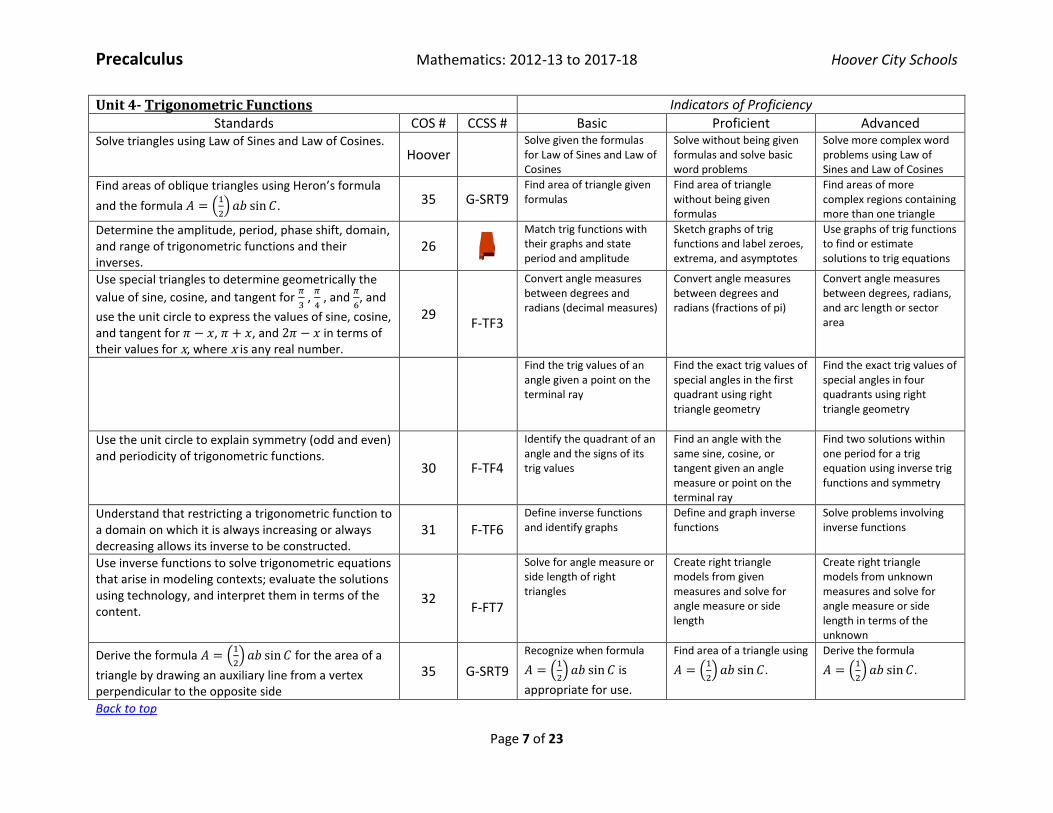
Unit 4- Trigonometric Functions Indicators of Proficiency
Standards COS # CCSS # Basic Proficient Advanced Solve triangles using Law of Sines and Law of Cosines.
Hoover Solve given the formulas for Law of Sines and Law of Cosines
Solve without being given formulas and solve basic word problems
Solve more complex word problems using Law of Sines and Law of Cosines
Find areas of oblique triangles using Heron’s formula
and the formula (
) . 35 G-SRT9
Find area of triangle given formulas
Find area of triangle without being given formulas
Find areas of more complex regions containing more than one triangle
Determine the amplitude, period, phase shift, domain, and range of trigonometric functions and their inverses.
26
Match trig functions with their graphs and state period and amplitude
Sketch graphs of trig functions and label zeroes, extrema, and asymptotes
Use graphs of trig functions to find or estimate solutions to trig equations
Use special triangles to determine geometrically the
value of sine, cosine, and tangent for
,
, and
, and
use the unit circle to express the values of sine, cosine, and tangent for , , and 2 in terms of their values for x, where x is any real number.
29
F-TF3
Convert angle measures between degrees and radians (decimal measures)
Convert angle measures between degrees and radians (fractions of pi)
Convert angle measures between degrees, radians, and arc length or sector area
Find the trig values of an angle given a point on the terminal ray
Find the exact trig values of special angles in the first quadrant using right triangle geometry
Find the exact trig values of special angles in four quadrants using right triangle geometry
Use the unit circle to explain symmetry (odd and even) and periodicity of trigonometric functions.
30 F-TF4
Identify the quadrant of an angle and the signs of its trig values
Find an angle with the same sine, cosine, or tangent given an angle measure or point on the terminal ray
Find two solutions within one period for a trig equation using inverse trig functions and symmetry
Understand that restricting a trigonometric function to a domain on which it is always increasing or always decreasing allows its inverse to be constructed.
31 F-TF6 Define inverse functions and identify graphs
Define and graph inverse functions
Solve problems involving inverse functions
Use inverse functions to solve trigonometric equations that arise in modeling contexts; evaluate the solutions using technology, and interpret them in terms of the content.
32
F-FT7
Solve for angle measure or side length of right triangles
Create right triangle models from given measures and solve for angle measure or side length
Create right triangle models from unknown measures and solve for angle measure or side length in terms of the unknown
Derive the formula (
) for the area of a
triangle by drawing an auxiliary line from a vertex perpendicular to the opposite side
35 G-SRT9
Recognize when formula
(
) is
appropriate for use.
Find area of a triangle using
(
) .
Derive the formula
(
) .
Back to top

Precalculus Mathematics: 2012-13 to 2017-18 Hoover City Schools
Page 8 of 23
Unit 5- Analytic Trigonometry Indicators of Proficiency
Standards COS # CCSS # Basic Proficient Advanced Verify trigonometric identities.
Hoover Verify one or two step identities using given list of identities
Verify more complex identities using given list of identities
Verify more complex identities without use of given list of identities
Solve trigonometric equations using algebraic techniques and trigonometric identities.
Hoover
Solve one or two step equations using given list of identities
Solve more complex equations using given list of identities
Solve more complex equations without use of given list of identities and solve problems using trigonometric equations
Define and apply sum, difference, double-angle, and half-angle identities. Hoover
Rewrite expressions and solve equations using given list of identities
Rewrite expressions and solve equations using given list of identities
Rewrite expressions and solve equations without given list of identities
Prove the Pythagorean identity , and use it to find , , or given , , or and the quadrant of the angle.
33 F-TF8 Identify Pythagorean identities.
Find exact values of , , or using Pythagorean identities.
Prove the Pythagorean identity.
Use the sum, difference, and half-angle identities to find the exact value of a trigonometric function. 27
Find exact values with use of given list of identities
Find exact values of more complex problems with use of given list of identities
Find exact values of more complex problems without given list of identities
Prove the addition and subtraction formulas for sine, cosine, and tangent, and use them to solve problems. 34 F-TF9
Evaluate expressions and solve equations using given identities
Write identities from memory and use them to solve problems
Derive identities and use them to solve problems
Instructional Recommendations / Resources:
Back to top
Unit 6- Matrices Indicators of Proficiency
Standards COS # CCSS # Basic Proficient Advanced Solve systems using augmented matrices, Cramer’s Rule, and inverse matrices.
Hoover Solve systems with aid of graphing calculator
Solve systems by hand and by using graphing calculator
Solve systems by hand and by using graphing calculator and solve word problems using systems
Decompose rational expressions into partial fractions. Hoover Find decompositions involving linear factors in denominator
Find decompositions involving linear and quadratic factors in denominator
Solve problems involving use of partial fraction decomposition
Solve problems using linear programming. Hoover Solve problems when given objective function and constraints
Solve problems when given objective function and constraints
Solve word problems using linear programming

Precalculus Mathematics: 2012-13 to 2017-18 Hoover City Schools
Page 9 of 23
Unit 6- Matrices Indicators of Proficiency
Standards COS # CCSS # Basic Proficient Advanced Add, subtract, and multiply matrices of appropriate dimensions.
Hoover Perform matrix operations involving integers
Perform matrix operations involving any real numbers
Solve word problems involving matrix operations
Work with 2 x 2 matrices as transformations of the plane, and interpret the absolute value of the determinant in terms of area.
11 N-
VM12
Set up a determinant for finding area of a triangle in a plane
Find the area of a triangle in a plane using a determinant
Find areas of polygons in a plane using determinants
Represent a system of linear equations as a single matrix equation in a vector variable. 14 A-REI8
Rewrite a system of linear equations as a matrix equation
Rewrite a system of linear equations as a matrix equation and solve the matrix equation
Solve problems involving matrix equations
Instructional Recommendations / Resources:
Back to top
Unit 7- Analytic Geometry Indicators of Proficiency
Standards COS # CCSS # Basic Proficient Advanced Write equations of parabolas, ellipses, and hyperbolas from data and from a graph.
15
Write equations of conic sections centered at the origin
Write equations of conic sections centered anywhere
Write equations of conic sections that model real life situations
Graph and analyze parabolas, ellipses, and hyperbolas. 15
Graph and analyze conic sections centered at the origin
Graph and analyze conic sections centered anywhere
Graph and analyze conic sections centered anywhere
Convert, graph, and apply parametric equations. Hoover Graph parametric equations and identify type of graph
And convert parametric equations to rectangular form
And solve word problems involving the use of parametric equations
Graph rotated conic sections. (Pre-AP) Hoover Find angle of rotation and rotation formulas
And find new equation using rotation formulas
And graph and analyze the new equation on the rotated coordinate system
Create graphs of conic sections, including parabolas, hyperbolas, ellipses, circles, and degenerate conics, from second-degree equations.
a) Formulate equations of conic sections from their determining characteristics.
15
Graph conic sections centered at the origin and write equations of conic sections from given graph where conic is centered at the origin
Graph conic sections centered anywhere and write equations of conic sections from given graph where conic is centered anywhere
Identify and describe degenerate conic sections
Derive the equations of a parabola given a focus and directrix. 36 G-GPE2
Write the equation of a parabola centered at the origin given focus and directrix
Write the equation of a parabola centered anywhere given focus and directrix
Create word problems that require writing equations of parabolas
Derive the equations of ellipses and hyperbolas given 37 G-GPE3 Write equations of ellipses and hyperbolas centered at
Write equations of ellipses and hyperbolas centered
Create word problems that require writing equations
Precalculus Mathematics: 2012-13 to 2017-18 Hoover City Schools
Page 10 of 23
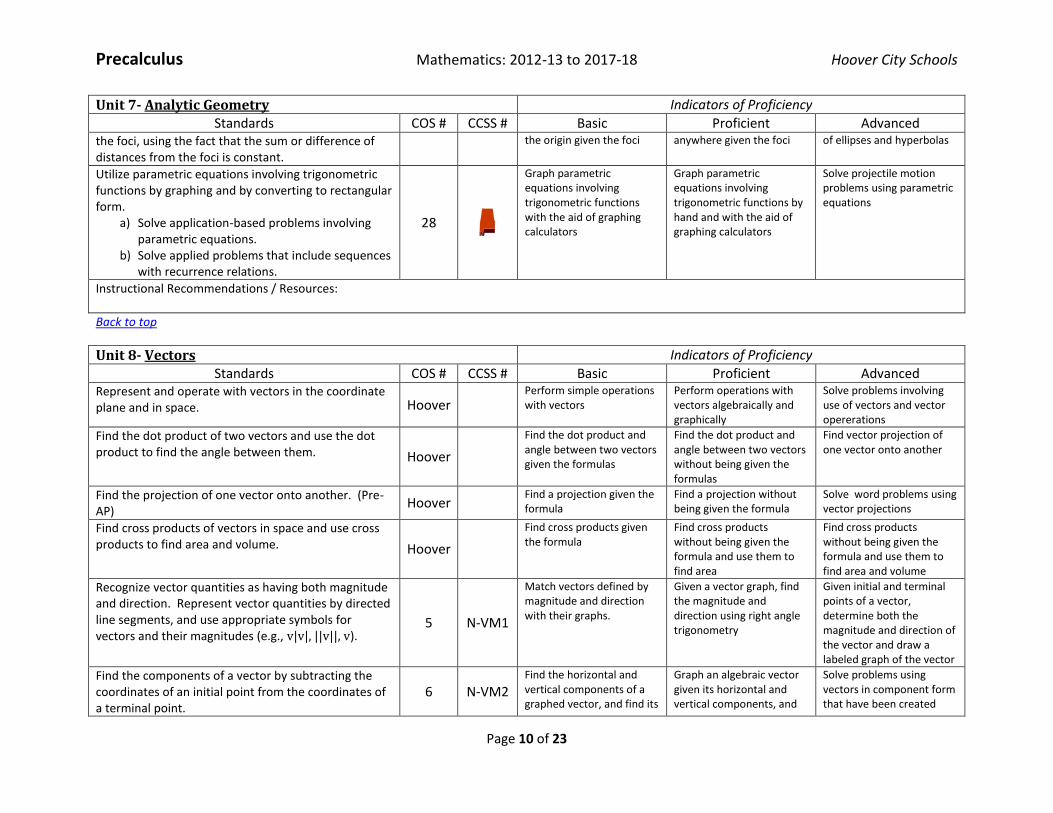
Unit 7- Analytic Geometry Indicators of Proficiency
Standards COS # CCSS # Basic Proficient Advanced the foci, using the fact that the sum or difference of distances from the foci is constant.
the origin given the foci anywhere given the foci of ellipses and hyperbolas
Utilize parametric equations involving trigonometric functions by graphing and by converting to rectangular form.
a) Solve application-based problems involving parametric equations.
b) Solve applied problems that include sequences with recurrence relations.
28
Graph parametric equations involving trigonometric functions with the aid of graphing calculators
Graph parametric equations involving trigonometric functions by hand and with the aid of graphing calculators
Solve projectile motion problems using parametric equations
Instructional Recommendations / Resources:
Back to top
Unit 8- Vectors Indicators of Proficiency
Standards COS # CCSS # Basic Proficient Advanced Represent and operate with vectors in the coordinate plane and in space. Hoover
Perform simple operations with vectors
Perform operations with vectors algebraically and graphically
Solve problems involving use of vectors and vector opererations
Find the dot product of two vectors and use the dot product to find the angle between them. Hoover
Find the dot product and angle between two vectors given the formulas
Find the dot product and angle between two vectors without being given the formulas
Find vector projection of one vector onto another
Find the projection of one vector onto another. (Pre-AP)
Hoover Find a projection given the formula
Find a projection without being given the formula
Solve word problems using vector projections
Find cross products of vectors in space and use cross products to find area and volume. Hoover
Find cross products given the formula
Find cross products without being given the formula and use them to find area
Find cross products without being given the formula and use them to find area and volume
Recognize vector quantities as having both magnitude and direction. Represent vector quantities by directed line segments, and use appropriate symbols for vectors and their magnitudes (e.g., v|v|, ||v||, v).
5 N-VM1
Match vectors defined by magnitude and direction with their graphs.
Given a vector graph, find the magnitude and direction using right angle trigonometry
Given initial and terminal points of a vector, determine both the magnitude and direction of the vector and draw a labeled graph of the vector
Find the components of a vector by subtracting the coordinates of an initial point from the coordinates of a terminal point.
6 N-VM2 Find the horizontal and vertical components of a graphed vector, and find its
Graph an algebraic vector given its horizontal and vertical components, and
Solve problems using vectors in component form that have been created
Precalculus Mathematics: 2012-13 to 2017-18 Hoover City Schools
Page 11 of 23
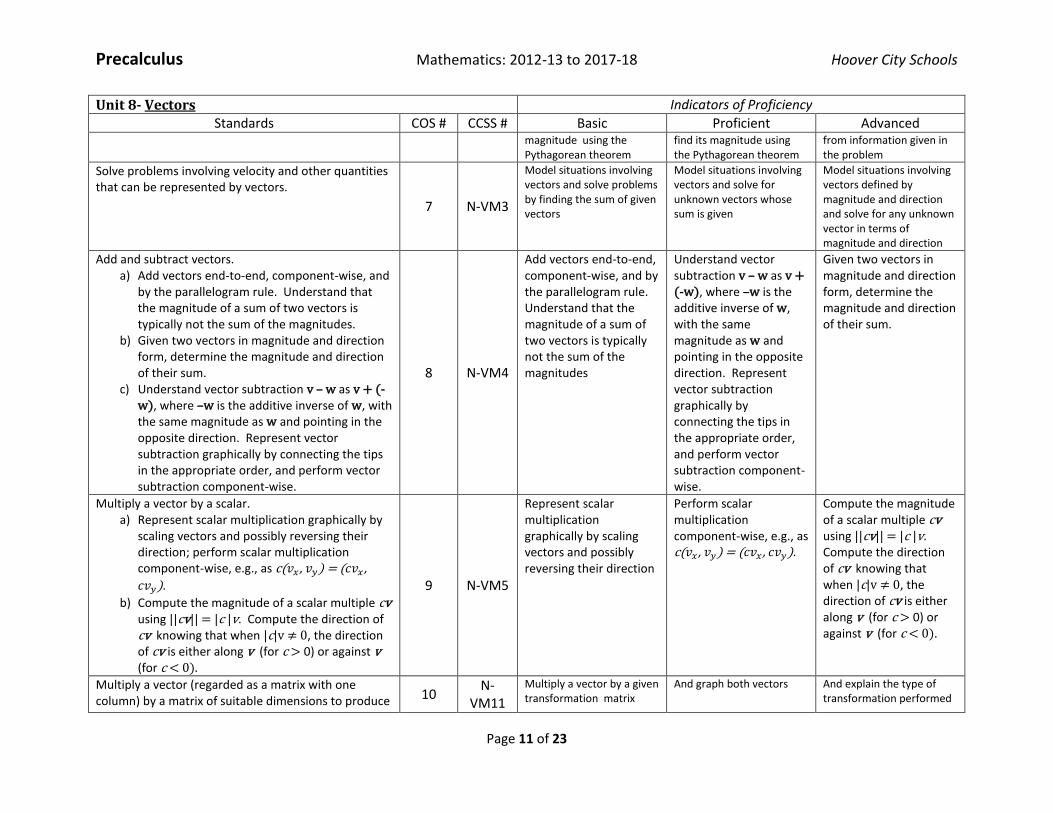
Unit 8- Vectors Indicators of Proficiency
Standards COS # CCSS # Basic Proficient Advanced magnitude using the Pythagorean theorem
find its magnitude using the Pythagorean theorem
from information given in the problem
Solve problems involving velocity and other quantities that can be represented by vectors.
7 N-VM3
Model situations involving vectors and solve problems by finding the sum of given vectors
Model situations involving vectors and solve for unknown vectors whose sum is given
Model situations involving vectors defined by magnitude and direction and solve for any unknown vector in terms of magnitude and direction
Add and subtract vectors. a) Add vectors end-to-end, component-wise, and
by the parallelogram rule. Understand that the magnitude of a sum of two vectors is typically not the sum of the magnitudes.
b) Given two vectors in magnitude and direction form, determine the magnitude and direction of their sum.
c) Understand vector subtraction v – w as v + (-w), where –w is the additive inverse of w, with the same magnitude as w and pointing in the opposite direction. Represent vector subtraction graphically by connecting the tips in the appropriate order, and perform vector subtraction component-wise.
8 N-VM4
Add vectors end-to-end, component-wise, and by the parallelogram rule. Understand that the magnitude of a sum of two vectors is typically not the sum of the magnitudes
Understand vector subtraction v – w as v + (-w), where –w is the additive inverse of w, with the same magnitude as w and pointing in the opposite direction. Represent vector subtraction graphically by connecting the tips in the appropriate order, and perform vector subtraction component-wise.
Given two vectors in magnitude and direction form, determine the magnitude and direction of their sum.
Multiply a vector by a scalar. a) Represent scalar multiplication graphically by
scaling vectors and possibly reversing their direction; perform scalar multiplication component-wise, e.g., as c( , ) = ( , ).
b) Compute the magnitude of a scalar multiple cv using ||cv|| = |c |v. Compute the direction of cv knowing that when |c|v 0, the direction of cv is either along v (for c 0) or against v (for c 0).
9 N-VM5
Represent scalar multiplication graphically by scaling vectors and possibly reversing their direction
Perform scalar multiplication component-wise, e.g., as c( , ) = ( , ).
Compute the magnitude of a scalar multiple cv using ||cv|| = |c |v. Compute the direction of cv knowing that when |c|v 0, the direction of cv is either along v (for c 0) or against v (for c 0).
Multiply a vector (regarded as a matrix with one column) by a matrix of suitable dimensions to produce 10
N-VM11
Multiply a vector by a given transformation matrix
And graph both vectors And explain the type of transformation performed

Precalculus Mathematics: 2012-13 to 2017-18 Hoover City Schools
Page 12 of 23
Unit 8- Vectors Indicators of Proficiency
Standards COS # CCSS # Basic Proficient Advanced another vector. Work with matrices as transformations of vectors.
Instructional Recommendations / Resources:
Back to top
Unit 9- Complex Numbers and Polar Representations Indicators of Proficiency
Standards COS # CCSS # Basic Proficient Advanced Define, convert, and plot polar and rectangular coordinates. Hoover
Match polar and rectangular coordinates with each other and with graphs
Convert polar to rectangular coordinates and vice versa and plot
Solve problems involving the use of polar coordinates
Graph polar equations. Hoover Graph polar equations Write a polar equation
given a polar graph Solve problems using polar graphs
Perform operations with complex numbers. Hoover Add and subtract complex numbers
Add, subtract, and multiply complex numbers
Add, subtract, multiply, and divide complex numbers
Find products, quotients, powers, and roots of complex numbers. Hoover
Work in polar form and leave answers in polar form
Work in polar form and convert answers to complex form
Work in both polar and complex forms and show that answers are equal
Graph and analyze polar equations of conics. (Pre-AP) Hoover
Graph and analyze polar equations of conics
Given characteristics of a conic section, write equation in polar form
Convert polar equation of conic to rectangular form
Represent complex numbers on the complex plane in rectangular and polar form (including real and imaginary numbers), and explain why the rectangular and polar forms of a given complex number represent the same number. (+)
1 N-CN4
Match rectangular and polar forms of a complex number
Convert complex numbers between rectangular and polar forms
Find multiple polar representation of a complex number
Represent addition, subtraction, multiplication, and conjugation of complex numbers geometrically on the complex plane; use properties of this representation for computation.
2 N-CN5
Add and subtract real and imaginary components of complex numbers and graph the results
Multiply complex numbers by FOILing and by converting to polar form
Multiply complex numbers by applying Euler’s formula and the properties of exponents
Calculate the distance between numbers in the complex plane as the modulus of the difference, and the midpoint of a segment as the average of the numbers at its endpoints.
3 N-CN6
Find the midpoint between two points on the complex plane, and find the distance using the Pythagorean theorem
Find the distance between numbers in the complex plane using the modulus of the distance
Show that the modulus of the difference corresponds to the distance found using the Pythagorean theorem

Precalculus Mathematics: 2012-13 to 2017-18 Hoover City Schools
Page 13 of 23
Unit 9- Complex Numbers and Polar Representations Indicators of Proficiency
Standards COS # CCSS # Basic Proficient Advanced Instructional Recommendations / Resources:
Back to top
Unit 10- Sequences and Series Indicators of Proficiency
Standards COS # CCSS # Basic Proficient Advanced Identify and define the components of sequences and series.
Hoover Given a sequence, identify the type, determine the components, and generate the next few terms
Find sums of series and express them in summation notation
Solve problems using sequences and series
Define and apply the Binomial Theorem. 13 A-APR5 Expand binomials using the Binomial Theorem
Find specific terms of binomial expansions using the binomial Theorem
Solve problems using the Binomial Theorem
Prove statements using mathematical induction. (Pre-AP)
Hoover Label the 3 major parts of a mathematical induction proof
Use mathematical induction to prove a statement similar to examples
Use mathematical induction to prove a statement different from examples
Explore applications of power series. (Pre-AP) Hoover Represent rational functions using power series.
Approximate transcendental functions using power series representations
Express complex numbers in exponential form using Euler’s Formula
Derive the formula for the sum of a finite geometric series (when the common ratio is not 1), and use the formula to solve problems.* (Extend to infinite geometric series.) Example: Calculate mortgage payments.
12 A-SSE4 Find sums of finite and infinite geometric series using formulas.
Solve problems using the sum formulas for finite and infinite geometric series.
Derive the formula for the sum of a finite geometric series.
Know and apply the Binomial Theorem for the expansion of ( ) in powers of and for a positive integer , where and are any number, with coefficients determined, for example, by Pascal’s Triangle.
13 A-APR5 Expand binomials using the Binomial Theorem
Find specific terms of binomial expansions using the binomial Theorem
Solve problems using the Binomial Theorem
Give an informal argument using Cavalieri’s principle 38 G- Know Cavalieri’s principle Produce an informal Explain how this relates to

Precalculus Mathematics: 2012-13 to 2017-18 Hoover City Schools
Page 14 of 23
Unit 10- Sequences and Series Indicators of Proficiency
Standards COS # CCSS # Basic Proficient Advanced for the formulas for the volume of a sphere and other solid figures.
GMD2 and that it can be used to explain volume formulas
argument for volume formulas using Cavalieri’s principle
the study of Calculus
Back to top
Unit 11- Statistics and Probability Indicators of Proficiency
Standards COS # CCSS # Basic Proficient Advanced Apply the Central Limit Theorem.
Hoover
Find the mean and standard deviation of a sampling distribution
Find the mean and standard deviation of a sampling distribution and show that the CLT applies
Find the mean and standard deviation of a sampling distribution, show that the CLT applies, and explain the CLT
Find normal approximations of binomial distributions.
Hoover
Find the mean and standard deviation of the normal approximation binomial distribution
Find the mean, standard deviation, and continuity factor for a normal approximation of a binomial distribution
Find the mean, standard deviation, and continuity factor for a normal approximation of a binomial distribution
Use statistics appropriate to the shape of the data distribution to compare center (median, mean) and spread (interquartile range, standard deviation) of two or more different data sets. (Focus on increasing rigor using standard deviation.)
39 S-ID2
Describe and compare dotplots, stemplots, and histograms, and match to summary statistics
Create, describe, and compare dotplots, stemplots, and histograms and calculate summary statistics
Describe and compare raw data using summary statistics
Interpret differences in shape, center, and spread in context of the data sets, accounting for possible effects of extreme data points (outliers). (Identify uniform, skewed, and normal distributions in a set of data. Determine the quartiles and interquartile range for a set of data.)
40 S-ID3
Interpret and compare given boxplots in terms of center, spread, skew, and outliers
Create boxplots given five number summaries and interpret in terms of center, spread, skew and outliers
Create boxplots given raw data and interpret in terms of center, spread, skew and outliers
Use the mean and standard deviation of a data set to fit it to a normal distribution and to estimate population percentages. Recognize that there are data sets for which such a procedure is not appropriate. Use calculators, spreadsheets, and tables to estimate areas under the normal curve.
41 S-ID4
Find probabilities using the empirical rule
Find probabilities using a chart
Find probabilities using a chart
Compute (using technology) and interpret the correlation coefficient of a linear fit. 42 S-ID8
Recognize positive and negative correlation by the sign of correlation
Explain relationship between correlation coefficient and slope
Extend to nonlinear data using transformations

Precalculus Mathematics: 2012-13 to 2017-18 Hoover City Schools
Page 15 of 23
Unit 11- Statistics and Probability Indicators of Proficiency
Standards COS # CCSS # Basic Proficient Advanced coefficient coefficient
Distinguish between correlation and causation. 43 S-ID9
Match with examples Interpret examples in terms of inference
Explain in relation to randomization of selection and assignment
Understand statistics as a process for making inferences about population parameters based on a random sample.
44 S-IC1 Test a Hypothesis with 95% confidence
Test a Hypothesis with any percentage confidence
Test a Hypothesis with any percentage confidence and explain in terms of the CLT
Decide if a specified model is consistent with results from a given data-generating process, e.g. using simulation Example: A models says spinning a coin falls heads up with a probability 0.5. Would a result of 5 tails in a row cause you to question the model?
45 S-IC2
Find the mean and standard deviation of the normal approximation binomial distribution
Find the mean, standard deviation, and continuity factor for a normal approximation of a binomial distribution
Find the mean, standard deviation, and continuity factor for a normal approximation of a binomial distribution
Recognize the purposes of and differences among sample surveys, experiments, and observational studies; explain how randomization relates to each.
46 S-IC3 Match types of studies with examples
Identify and evaluate types of studies
Design and justify types of studies
Use data from a sample survey to estimate a population mean or proportion; develop a margin of error through the use of simulation models for random sampling.
47 S-IC4
Find 95% confidence intervals for means and proportions
Find any percentage confidence interval for means and proportions
Find any percentage confidence interval for means and proportions and explain in terms of the CLT
Use data from a randomized experiment to compare two treatments; use simulations to decide if differences between parameters are significant.
48 S-IC5 Test a hypothesis with 95% confidence
Test a hypothesis with any percentage confidence
Test a hypothesis with any percentage confidence and explain in terms of the CLT
Evaluate reports based on data.
49 S-IC6
Test a hypothesis with 95% confidence or find 95% confidence intervals for means and proportions
Test a hypothesis with any percentage confidence or Find any percentage confidence interval for means and proportions
Test a hypothesis with any percentage confidence or find any percentage confidence interval for means and proportions AND verify inference conditions
Define a random variable for a quantity of interest by assigning a numerical value to each event in a sample space; graph the corresponding probability distribution using the same graphical displays as for data distributions.
50 S-MD1
Construct a probability distribution
Construct a probability distribution and calculate mean
Construct a probability distribution and calculate mean and standard deviation
Calculate the expected value of a random variable; 51 S-MD2 Construct a probability Construct a probability Construct a probability

Precalculus Mathematics: 2012-13 to 2017-18 Hoover City Schools
Page 16 of 23
Unit 11- Statistics and Probability Indicators of Proficiency
Standards COS # CCSS # Basic Proficient Advanced interpret it as the mean of the probability distribution. distribution and calculate
mean distribution and calculate mean
distribution and calculate mean and standard deviation
Develop a probability distribution for a random variable defined for a sample space in which theoretical probabilities can be calculated; find the expected value.
52 S-MD3
Construct a probability distribution and calculate mean
Construct a probability distribution and calculate mean
Construct a probability distribution and calculate mean and standard deviation
Develop a probability distribution for a random variable defined for a sample space in which probabilities are assigned empirically; find the expected value.
53 S-MD4
Construct a probability distribution and calculate mean
Construct a probability distribution and calculate mean
Construct a probability distribution and calculate mean and standard deviation
Weigh the possible outcomes of a decision by assigning probabilities to payoff values and finding expected values.
a) Find the expected payoff for a game of chance. b) Evaluate and compare strategies on the basis
of expected values.
54 S-MD5
Find the expected payoff for a game of chance and determine whether or not it is fair
Find the expected payoff for a game of chance and determine the long term consequences of unfairness (i.e. how much are you likely to owe after a given time)
Find the expected payoff for a game of chance and determine how the long term consequences of unfairness can be mitigated (i.e. when should you quit?)
Back to top
Unit 12- Limits and Derivatives Indicators of Proficiency
Standards COS # CCSS # Basic Proficient Advanced Find instantaneous rates of change by calculating slopes of tangent lines. Hoover
Find the slope of the tangent line to a graph for a specified point and at any point
Find instantaneous rate of change at a point and at any point
Find average and instantaneous velocities
Find instantaneous rates of change by calculating by calculating derivatives. Hoover
Find derivative of a function at any point
Use derivative to find instantaneous rate of change
Use rules for derivatives to find the derivative of a function at any point
Approximate the area under a curve. (Pre-AP)
Hoover
Approximate the area under a curve using rectangles
Approximate the area under a curve using definite integrals and integration.
Solve problems involving definite integrals and integration.
Find antiderivatives. (Pre-AP) Hoover
Find an antiderivative of a function
Find all antiderivatives of a function
Solve real world problems involving the use of antiderivatives
Apply the Fundamental Theorem of Calculus. (Pre-AP) Hoover Evaluate definite integrals Find the area of the Explain the difference

Precalculus Mathematics: 2012-13 to 2017-18 Hoover City Schools
Page 17 of 23
Unit 12- Limits and Derivatives Indicators of Proficiency
Standards COS # CCSS # Basic Proficient Advanced region between the graph of a function and the x-axis on a given interval using definite integrals
between indefinite and definite integrals
Determine numerically, algebraically, and graphically the limits of functions at specific values and at infinity.
a) Apply limits in problems involving convergence and divergence.
4
Find the one or two sided limit of a graphed function at a point of discontinuity, and identify limits that do not exist by their graphs
Find the one or two sided limit of a function expressed algebraically by factoring and canceling
Find the limit of a function squeezed between two other known functions
Instructional Recommendations / Resources:
Back to top
Correlation of Standards Standards Key AL COS # CCSS # HCS Unit #
NUMBER AND QUANTITY: The Complex Number System (+) Represent complex numbers on the complex plane in rectangular and polar form (including real and imaginary numbers), and explain why the rectangular and polar forms of a given complex number represent the same number.
1 [N-CN4] 9
(+) Represent addition, subtraction, multiplication, and conjugation of complex numbers geometrically on the complex plane; use properties of this representation for computation.
2 [N-CN5] 9
(+) Calculate the distance between numbers in the complex plane as the modulus of the difference, and the midpoint of a segment as the average of the numbers at its endpoints.
3 [N-CN6] 9
NUMBER AND QUANTITY: Limits Determine numerically, algebraically, and graphically the limits of functions at specific values and at infinity. a. Apply limits in problems involving convergence and divergence.
4
12
NUMBER AND QUANTITY: Vector and Matrix Quantities (+) Recognize vector quantities as having both magnitude and direction. Represent vector quantities by directed line segments, and use appropriate symbols for vectors and their magnitudes (e.g., v, |v|, ||v||, v).
5 [N-VM1] 8
(+) Find the components of a vector by subtracting the coordinates of an initial point from the coordinates of a terminal point.
6 [N-VM2] 8
(+) Solve problems involving velocity and other quantities that can be represented by vectors. 7 [N-VM3] 8

Precalculus Mathematics: 2012-13 to 2017-18 Hoover City Schools
Page 18 of 23
Standards Key AL COS # CCSS # HCS Unit #
(+) Add and subtract vectors. a. (+) Add vectors end-to-end, component-wise, and by the parallelogram rule. Understand that the magnitude of a sum of two vectors is typically not the sum of the magnitudes. b. (+) Given two vectors in magnitude and direction form, determine the magnitude and direction of their sum. c. (+) Understand vector subtraction v – w as v + (–w), where –w is the additive inverse of w, with the same magnitude as w and pointing in the opposite direction. Represent vector subtraction graphically by connecting the tips in the appropriate order, and perform vector subtraction component-wise.
8 [N-VM4] 8
(+) Multiply a vector by a scalar. a. (+) Represent scalar multiplication graphically by scaling vectors and possibly reversing their direction; perform scalar multiplication component-wise, e.g., as c(vx, vy) = (cvx, cvy). b. (+) Compute the magnitude of a scalar multiple cv using ||cv|| = |c|v. Compute the direction of cv knowing that when |c|v ≠ 0, the direction of cv is either along v (for c > 0) or against v (for c < 0).
9 [N-VM5] 8
(+) Multiply a vector (regarded as a matrix with one column) by a matrix of suitable dimensions to produce another vector. Work with matrices as transformations of vectors.
10 [N-VM11] 8
(+) Work with 2 × 2 matrices as transformations of the plane, and interpret the absolute value of the determinant in terms of area.
11 [N-VM12] 6
ALGEBRA: Seeing Structure in Expressions Derive the formula for the sum of a finite geometric series (when the common ratio is not 1), and use the formula to solve problems.* (Extend to infinite geometric series.)
12 [A-SSE4] 10
ALGEBRA: Arithmetic With Polynomials and Rational Expressions (+) Know and apply the Binomial Theorem for the expansion of (x + y)n in powers of x and y for a positive integer n, where x and y are any numbers, with coefficients determined, for example, by Pascal’s Triangle. (The Binomial Theorem can be proved by mathematical induction or by a combinatorial argument.)
13 [A-APR5] 10
ALGEBRA: Reasoning With Equations and Inequalities (+) Represent a system of linear equations as a single matrix equation in a vector variable. 14 [A-REI8] 6
FUNCTIONS: Conic Sections Create graphs of conic sections, including parabolas, hyperbolas, ellipses, circles, and degenerate conics, from second-degree equations. a. Formulate equations of conic sections from their determining characteristics.
15
7
FUNCTIONS: Interpreting Functions For a function that models a relationship between two quantities, interpret key features of graphs and tables in terms of the quantities, and sketch graphs showing key features given a verbal description of the relationship. (Key features include intercepts; intervals where the function is increasing, decreasing, positive, or negative; relative maximums and minimums; symmetries; end behavior; and periodicity. Determine odd, even, neither.)*
16 [F-IF4] 1

Precalculus Mathematics: 2012-13 to 2017-18 Hoover City Schools
Page 19 of 23
Standards Key AL COS # CCSS # HCS Unit #
Calculate and interpret the average rate of change of a function (presented symbolically or as a table) over a specified interval. Estimate the rate of change from a graph.*
17 [F-IF6] 1
Graph functions expressed symbolically, and show key features of the graph, by hand in simple cases and using technology for more complicated cases.* a. Graph square root, cube root, and piecewise-defined functions, including step functions and absolute value functions. b. Graph polynomial functions, identifying zeros when suitable factorizations are available, and showing end behavior. c. (+) Graph rational functions, identifying zeros and asymptotes when suitable factorizations are available, and showing end behavior. d. Graph exponential and logarithmic functions, showing intercepts and end behavior, and trigonometric functions, showing period, midline, and amplitude.
18 [F-IF7] 1, 2, 3, 4
FUNCTIONS: Building Functions (+) Compose functions. 19 [F-BF1c] 1 Determine the inverse of a function and a relation. 20
1
(+) Verify by composition that one function is the inverse of another. 21 [F-BF4b] 1 (+) Read values of an inverse function from a graph or a table, given that the function has an inverse. 22 [F-BF4c] 1 (+) Produce an invertible function from a non-invertible function by restricting the domain. 23 [F-BF4d] 1 (+) Understand the inverse relationship between exponents and logarithms, and use this relationship to solve problems involving logarithms and exponents.
24 [F-BF5] 3
Compare effects of parameter changes on graphs of transcendental functions 25
3
FUNCTIONS: Trigonometric Functions Determine the amplitude, period, phase shift, domain, and range of trigonometric functions and their inverses.
26
4
Use the sum, difference, and half-angle identities to find the exact value of a trigonometric function.
27
5
Utilize parametric equations by graphing and by converting to rectangular form. a. Solve application-based problems involving parametric equations. b. Solve applied problems that include sequences with recurrence relations.
28
7
(+) Use special triangles to determine geometrically the values of sine, cosine, and tangent for
,
, and
and use the
unit circle to express the values of sine, cosine, and tangent for π – x, π + x, and 2π – x in terms of their values for x, where x is any real number.
29 [F-TF3] 4
(+) Use the unit circle to explain symmetry (odd and even) and periodicity of trigonometric functions.
30 [F-TF4] 4

Precalculus Mathematics: 2012-13 to 2017-18 Hoover City Schools
Page 20 of 23
Standards Key AL COS # CCSS # HCS Unit #
(+) Understand that restricting a trigonometric function to a domain on which it is always increasing or always decreasing allows its inverse to be constructed.
31 [F-TF6] 4
(+) Use inverse functions to solve trigonometric equations that arise in modeling contexts; evaluate the solutions using technology, and interpret them in terms of the context.*
32 [F-TF7] 4
Prove the Pythagorean identity sin2(θ) + cos2(θ) = 1, and use it to find sin(θ), cos(θ), or tan(θ) given sin(θ), cos(θ), or tan(θ) and the quadrant of the angle.
33 [F-TF8 5
(+) Prove the addition and subtraction formulas for sine, cosine, and tangent, and use them to solve problems.
34 [F-TF9] 5
GEOMETRY: Similarity, Right Triangles, and Trigonometry
(+) Derive the formula
for the area of a triangle by drawing an auxiliary line
from a vertex perpendicular to the opposite side. (Apply formulas previously derived in Geometry.)
35 [G-SRT9] 4
GEOMETRY: Expressing Geometric Properties With Equations (+) Derive the equations of a parabola given a focus and directrix. 36 [G-GPE2] 7 (+) Derive the equations of ellipses and hyperbolas given the foci, using the fact that the sum or difference of distances from the foci is constant.
37 [G-GPE3] 7
(+) Give an informal argument using Cavalieri’s principle for the formulas for the volume of a sphere and other solid figures.
38 [G-GMD2] 10
STATISTICS AND PROBABILITY: Interpreting Categorical and Quantitative Data Use statistics appropriate to the shape of the data distribution to compare center (median, mean) and spread (interquartile range, standard deviation) of two or more different data sets. (Focus on increasing rigor using standard deviation.)
39 [S-ID2] 11
Interpret differences in shape, center, and spread in the context of the data sets, accounting for possible effects of extreme data points (outliers). (Identify uniform, skewed, and normal distributions in a set of data. Determine the quartiles and interquartile range for a set of data.)
40 [S-ID3] 11
Use the mean and standard deviation of a data set to fit it to a normal distribution and to estimate population percentages. Recognize that there are data sets for which such a procedure is not appropriate. Use calculators, spreadsheets, and tables to estimate areas under the normal curve.
41 [S-ID4] 11
Compute (using technology) and interpret the correlation coefficient of a linear fit. 42 [S-ID8] 11 Distinguish between correlation and causation. 43 [S-ID9] 11
STATISTICS AND PROBABILITY: Making Inferences and Justifying Conclusions Understand statistics as a process for making inferences about population parameters based on a random sample from that population.
44 [S-IC1] 11
Decide if a specified model is consistent with results from a given data-generating process, e.g., using simulation. 45 [S-IC2] 11 Recognize the purposes of and differences among sample surveys, experiments, and observational studies; explain 46 [S-IC3] 11
Precalculus Mathematics: 2012-13 to 2017-18 Hoover City Schools
Page 21 of 23
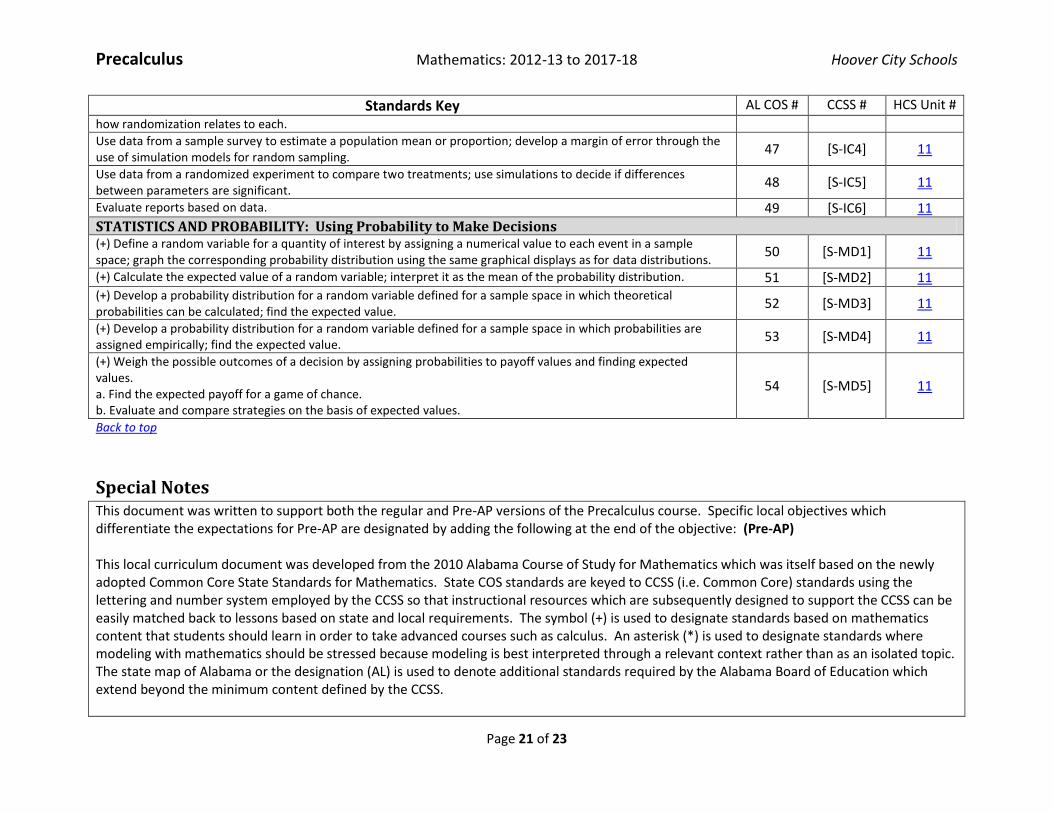
Standards Key AL COS # CCSS # HCS Unit #
how randomization relates to each.
Use data from a sample survey to estimate a population mean or proportion; develop a margin of error through the use of simulation models for random sampling.
47 [S-IC4] 11
Use data from a randomized experiment to compare two treatments; use simulations to decide if differences between parameters are significant.
48 [S-IC5] 11
Evaluate reports based on data. 49 [S-IC6] 11
STATISTICS AND PROBABILITY: Using Probability to Make Decisions (+) Define a random variable for a quantity of interest by assigning a numerical value to each event in a sample space; graph the corresponding probability distribution using the same graphical displays as for data distributions.
50 [S-MD1] 11
(+) Calculate the expected value of a random variable; interpret it as the mean of the probability distribution. 51 [S-MD2] 11 (+) Develop a probability distribution for a random variable defined for a sample space in which theoretical probabilities can be calculated; find the expected value.
52 [S-MD3] 11
(+) Develop a probability distribution for a random variable defined for a sample space in which probabilities are assigned empirically; find the expected value.
53 [S-MD4] 11
(+) Weigh the possible outcomes of a decision by assigning probabilities to payoff values and finding expected values. a. Find the expected payoff for a game of chance. b. Evaluate and compare strategies on the basis of expected values.
54 [S-MD5] 11
Back to top
Special Notes This document was written to support both the regular and Pre-AP versions of the Precalculus course. Specific local objectives which differentiate the expectations for Pre-AP are designated by adding the following at the end of the objective: (Pre-AP) This local curriculum document was developed from the 2010 Alabama Course of Study for Mathematics which was itself based on the newly adopted Common Core State Standards for Mathematics. State COS standards are keyed to CCSS (i.e. Common Core) standards using the lettering and number system employed by the CCSS so that instructional resources which are subsequently designed to support the CCSS can be easily matched back to lessons based on state and local requirements. The symbol (+) is used to designate standards based on mathematics content that students should learn in order to take advanced courses such as calculus. An asterisk (*) is used to designate standards where modeling with mathematics should be stressed because modeling is best interpreted through a relevant context rather than as an isolated topic. The state map of Alabama or the designation (AL) is used to denote additional standards required by the Alabama Board of Education which extend beyond the minimum content defined by the CCSS.

Precalculus Mathematics: 2012-13 to 2017-18 Hoover City Schools
Page 22 of 23
The Standards for Mathematical Practice describe the varieties of expertise that mathematics educators at all levels should seek to develop in their students. These standards were developed with input from the National Council of Teachers of Mathematics and the National Research Council, and math teachers should reinforce these process skills when designing daily instructional lessons for students at all grade levels in the Hoover school system:
1. Make sense of problems and persevere in solving them 2. Reason abstractly and quantitatively 3. Construct viable arguments and critique the reasoning of others 4. Model with mathematics 5. Use appropriate tools strategically 6. Attend to precision 7. Look for and make use of structure 8. Look for and express regularity in repeated reasoning
According to the Alabama Quality Teaching Standards (AQTS), teachers of all grade levels and subjects are required to model and reinforce literacy skills for all students. The Alabama Course of Study for Mathematics defines specific college and career readiness “anchor standards” for grades 6-12 in the areas of reading and writing. Specific grade-appropriate criteria can be found in the state course of study document, but the general anchor standards are defined below:
Reading Key Ideas and Details
1. Read closely to determine what the text says explicitly and to make logical inferences from it; cite specific textual evidence when writing or speaking to support conclusions drawn from the text.
2. Determine central ideas or themes of a text and analyze their development; summarize the key supporting details and ideas.
3. Analyze how and why individuals, events, or ideas develop and interact over the course of a text. Craft and Structure
4. Interpret words and phrases as they are used in a text, including determining technical, connotative, and figurative meanings, and analyze how specific word choices shape meaning or tone.
5. Analyze the structure of texts, including how specific sentences, paragraphs, and larger portions of the text (e.g. a section, chapter, scene, or stanza) relate to each other and the whole.
6. Assess how point of view or purpose shapes the content and style of a text. Integration of Knowledge and Ideas
7. Integrate and evaluate content presented in diverse formats and media, including visually and quantitatively, as well as in words.
8. Delineate and evaluate the argument and specific claims in a text, including the validity of the reasoning as well as the
Precalculus Mathematics: 2012-13 to 2017-18 Hoover City Schools
Page 23 of 23
relevance and sufficiency of the evidence. 9. Analyze how two or more texts address similar themes or topics in order to build knowledge or to compare the
approaches the authors take. Range of Reading and Level of Text Complexity
10. Read and comprehend complex literary and informational texts independently and proficiently. Writing
Text Types and Purposes 1. Write arguments to support claims in an analysis of substantive topics or texts using valid reasoning and relevant and
sufficient evidence. 2. Write informative / explanatory texts to examine and convey complex ideas and information clearly and accurate
through the effective selection, organization, and analysis of content. 3. Write narratives to develop real or imagined experiences or events using effective technique, well-chosen details, and
well-structured event sequences. Production and Distribution of Writing
4. Produce clear and coherent writing in which the development, organization, and style are appropriate to task, purpose, and audience.
5. Develop and strengthen writing as needed by planning, revising, editing, rewriting, or trying a new approach. 6. Use technology, including the Internet, to produce and publish writing and to interact and collaborate with others.
Research to Build and Present Knowledge 7. Conduct short as well as more sustained research projects based on focused questions, demonstrating understanding
of the subject under investigation. 8. Gather relevant information from multiple print and digital sources, assess the credibility and accuracy of each source,
and integrate the information while avoiding plagiarism. 9. Draw evidence form literary or informational texts to support analysis, reflection, and research.
Range of Writing 10. Write routinely over extended time frames (time for research, reflection, and revision) and short time frames (a single
sitting or a day or two) for a range of tasks, purposes, and audiences.
Back to top