Embed Size (px)
Citation preview
2638 | Mol. BioSyst., 2017, 13, 2638--2649 This journal is©The Royal Society of Chemistry 2017
Cite this:Mol. BioSyst., 2017,
13, 2638
Pre-steady-state kinetic analysis of damagerecognition by human single-strand selectivemonofunctional uracil-DNA glycosylase SMUG1†
Alexandra A. Kuznetsova,a Danila A. Iakovlev,a Inna V. Misovets,b
Alexander A. Ishchenko,c Murat K. Saparbaev,c Nikita A. Kuznetsov *ab andOlga S. Fedorova *ab
In all organisms, DNA glycosylases initiate base excision repair pathways resulting in removal of aberrant
bases from DNA. Human SMUG1 belongs to the superfamily of uracil-DNA glycosylases catalyzing
the hydrolysis of the N-glycosidic bond of uridine and uridine lesions bearing oxidized groups at C5:
5-hydroxymethyluridine (5hmU), 5-formyluridine (5fU), and 5-hydroxyuridine (5hoU). An apurinic/
apyrimidinic (AP) site formed as the product of an N-glycosylase reaction is tightly bound to hSMUG1,
thus inhibiting the downstream action of AP-endonuclease APE1. The steady-state kinetic parameters
(kcat and KM; obtained from the literature) correspond to the enzyme turnover process limited by the
release of hSMUG1 from the complex with the AP-site. In the present study, our objective was to carry
out a stopped-flow fluorescence analysis of the interaction of hSMUG1 with a DNA substrate containing
a dU:dG base pair to follow the pre-steady-state kinetics of conformational changes in both molecules.
A comparison of kinetic data obtained by means of Trp and 2-aminopurine fluorescence and Forster
resonance energy transfer (FRET) detection allowed us to elucidate the stages of specific and nonspecific
DNA binding, to propose the mechanism of damaged base recognition by hSMUG1, and to determine the
true rate of the catalytic step. Our results shed light on the kinetic mechanism underlying the initiation of
base excision repair by hSMUG1 using the ‘‘wedge’’ strategy for DNA lesion search.
Introduction
Human SMUG1 (hSMUG1; single-strand selective monofunctionaluracil-DNA glycosylase) is a monofunctional DNA glycosylasebelonging to the highly conserved superfamily of uracil-DNAglycosylases (UDGs) specialized for antimutational uracil removalin the base excision DNA repair pathway (BER).1,2 Initially,hSMUG1 was found to be more selective for single-stranded DNA(ssDNA),3 but later it was found that hSMUG1 has higher affinityfor and activity toward uracil-containing double-stranded DNA(dsDNA) substrates.4,5 Uracil is generated in DNA because ofspontaneous deamination of cytosine or misincorporation ofdUMP instead of dTMP in the course of replication. Aside from
uracil, SMUG1 also excises oxidized 5-hydroxymethyluracil(5hmU), 5-formyluracil (5fU), and 5-hydroxyuracil (5hoU) butis inactive toward thymine (5-methyluracil).6,7 The 5hmU baseis produced via oxidation of thymine.8 Additionally, 5hmU isformed in epigenetic processes via deamination of 5hmCcatalyzed by AID/APOBEC enzymes. This damaged base inducesG:C-A:T mutation by insertion of a noncognate nucleotide,dAMP, opposite 5hmU during DNA replication. Its subsequentoxidation produces 5fU, whose ionized form is coupled withincoming dGTP in an antiwobble pair.9,10
The superfamily of UDGs is classified into six familiesby substrate specificity, sequence homology, and structuralsimilarity.11–13 Alignment of major motifs and structural organi-zation of hSMUG1 and UDGs from other structural familiesrevealed that the C-terminal motif of hSMUG1 contains theconserved histidine residue of UNG family 1. On the other hand,the N-terminal catalytic motif of hSMUG1 contains the asparaginethat is found in MUG family 2. Therefore, hSMUG1 is a memberof structural family 3, which represents the hybrid type of theactive site.12
Mutational and structural analysis together with steady-statekinetic studies have revealed that in hSMUG1 Asn85 and
a Institute of Chemical Biology and Fundamental Medicine (ICBFM), Siberian
Branch of Russian Academy of Sciences, 8 Lavrentyev Ave., Novosibirsk 630090,
Russia. E-mail: [email protected], [email protected];
Fax: +7 383-3635153, +7 383-3635153; Tel: +7 383-3635175, +7 383-3635174b Department of Natural Sciences, Novosibirsk State University (NSU),
2 Pirogova St., Novosibirsk 630090, Russiac Groupe ‘‘Reparation de l’ADN’’, Universite Paris-Sud XI, UMR8200 CNRS,
Institute Gustave Roussy, Villejuif Cedex F-94805, France
† Electronic supplementary information (ESI) available. See DOI: 10.1039/c7mb00457e
Received 25th July 2017,Accepted 11th October 2017
DOI: 10.1039/c7mb00457e
rsc.li/molecular-biosystems
MolecularBioSystems
PAPER
Ope
n A
cces
s A
rtic
le. P
ublis
hed
on 1
1 O
ctob
er 2
017.
Dow
nloa
ded
on 1
2/25
/202
1 6:
41:0
0 A
M.
Thi
s ar
ticle
is li
cens
ed u
nder
a C
reat
ive
Com
mon
s A
ttrib
utio
n 3.
0 U
npor
ted
Lic
ence
.
View Article OnlineView Journal | View Issue
This journal is©The Royal Society of Chemistry 2017 Mol. BioSyst., 2017, 13, 2638--2649 | 2639
His239 catalyze the cleavage of the N-glycosidic bond. Asn163and Phe98 discriminate pyrimidine bases through p–p stackingwith Phe98 and specific hydrogen bonding to the Asn163. TheGly87–Met91 region recognizes the C5 substituent throughwater-bridged (uracil) or direct (hoU, hmU, and fU) hydrogenbonds.14 In hSMUG1, the 239–249 sequence serves as a ‘‘wedge’’penetrating the DNA double helix in the region of a specificsite.5,14–18 Formation of the catalytic complex leads to the dissocia-tive SN1-like cleavage of the N-glycosidic bond of an everteddamaged base placed in the active site.14,19 AP-sites formed asproducts of the N-glycosylase reaction are tightly bound to hSMUG1thereby inhibiting their cleavage by AP-endonucleases.15 Thesame mechanism may be responsible for the catalytic efficiencyof hSMUG1 as determined by enzyme turnover. The steady-statekinetic parameters kcat and KM have been identified for dU:dA(0.05–0.07 s�1 and 4.0–11.3 mM),4,15 dU:dG (0.03–0.05 s�1
and 0.5–1.3 mM)4,15 and single stranded U (0.21–0.29 s�1 and1.7–3.0 mM) oligonucleotide substrates.4,15 For DNA-substratescontaining dU:dG base pairs alternatively it was obtained thatthe values of kcat and KM were equal to 0.014 s�1 and 2.2 nM,respectively.14 Nevertheless, steady-state studies have beenunable to characterize the real catalytic power of hSMUG1and to obtain the values of microscopic rate constants for theseparate steps in the reaction pathway from recognition ofspecific sites to the formation of the final products.
To gain a deeper insight into the damage recognitionmechanism, we performed a pre-steady-state kinetic analysisof conformational transitions of hSMUG1 and DNA in thecourse of the catalytic cycle under conditions when there isno large excess of enzyme or substrate. The conformationaldynamics were directly recorded by the stopped-flow techniquecombined with fluorescence detection. Conformational changes inthe protein were monitored by changes in Trp fluorescenceintensity. To examine the conformational dynamics of DNA, thefluorescent base 2-aminopurine (aPu) and dye–quencher pairFAM/BHQ1 were incorporated into DNA. A DNA duplex containingthe dU:dG base pair served as a ‘‘full enzymatic cycle’’ DNAsubstrate; this cycle includes DNA binding and N-glycosidic bondcleavage. A DNA duplex containing an uncleavable analog of thenatural AP-site (3-hydroxytetrahydrofuran-2-yl)methyl phosphate(F-site) instead of dU was used as a DNA product. The DNA duplexcontaining dC:dG enabled us to follow the conformationalchanges in the enzyme and DNA during the formation of thenonspecific complex. A comparison of fluorescence kinetic dataobtained by Trp, aPu, and FRET detection allowed us to elucidatethe stages of specific and nonspecific DNA binding and to proposethe mechanism of damaged-base recognition by hSMUG1.
Materials and methodsConstruction of hSMUG1 expression vector
Total RNA was isolated from HeLa cells according to theinstruction of an Oligotex Direct mRNA Kit (Qiagen, Hilden,Germany). The quality of RNA was assessed using the A260/A280 ratio, and the integrity was evaluated on 1% agarose gel.
The RNAs were then reverse transcribed into cDNA using aBoehringer Mannheim cDNA synthesis kit (Boehringer MannheimGmbH, Mannheim, Germany), following the manufacturer’sinstructions. The PCR DNA fragment, which contained thehSMUG1 gene and NdeI and BamHI restriction sites, was obtainedusing specific primers GCGGCCTGGTGCCGCGCGGCAGCCATCCCCAGGCTTTCCTGCTGGGG and GCTTGTCGACGGAGCTCGAATTCGGATCTCATTTCAACAGCAGTGGCAGCAGC. The size ofthe DNA fragment was 864 bp. The PCR products were separatedon 1.0% agarose/TAE gels, excised and purified using a QIAquickPCR purification kit (Qiagen, Hilden, Germany). Finally, the geneof hSMUG1 was cloned into the pET28c expression vector usingNdeI and BamHI restriction sites and sequenced.
Protein expression and purification
The full-size hSMUG1 was isolated from Escherichia coli Rosetta2 cells transformed with plasmid pET28c-hSMUG1. Cells ofE. coli Rosetta 2 were grown in Luria-Bertani (LB) medium (1 L)containing 50 mg mL�1 kanamycin at 37 1C to an optical densityof 0.6–0.7 at 600 nm. After that, the temperature was lowered to20 1C, and transcription was induced by addition of isopropyl-b-D-thiogalactopyranoside to 0.2 mM. After the induction, thecells were incubated for 16 h and then centrifuged (12 000 rpm,10 min). A cell suspension was prepared in 30 mL of buffer I(20 mM HEPES-NaOH, pH 7.8) containing 100 mM NaCl and aprotease inhibitor cocktail (Complete, Germany). The cells werelysed using a Thermo French Pressure Cell Press. All the subse-quent procedures were conducted at 4 1C. The cell lysate wascentrifuged (30 000 rpm, 40 min), and the supernatant was loadedonto column I (Q-Sepharose Fast Flow, Amersham Biosciences,Sweden) with subsequent washing with buffer solution I (20 mMHEPES-NaOH, pH 7.8) containing 100 mM NaCl. Fractionscontaining the protein were collected and loaded onto column II(HiTrap-Helatingt, Amersham Biosciences, Sweden) in buffersolution II (20 mM HEPES-NaOH, pH 7.8) containing 500 mMNaCl and 20 mM imidazole. Chromatography was run in buffersolution II and a linear gradient of 20 - 500 mM imidazole. Thesolution’s absorbance was detected at a wavelength of 280 nm.The protein purity was determined by gel electrophoresis.Fractions containing the hSMUG1 protein were dialyzed againsta buffer (20 mM HEPES-NaOH, pH 7.5, 1 mM EDTA, 1 mMdithiothreitol, 250 mM NaCl, 50% glycerol) and stored at�20 1C.The protein concentration was calculated based on the opticaldensity of the protein solution at 280 nm and a molar extinctioncoefficient of 28 460 M�1 cm�1.20
All the experiments on the enzymatic reaction were con-ducted in a buffer consisting of 50 mM Tris–HCl pH 7.5, 50 mMKCl, 1 mM EDTA, 1 mM dithiothreitol, and 7% glycerol at 25 1C.
Oligodeoxynucleotides (ODNs)
The sequences of the DNA substrates used in this work arepresented in Table 1. The oligonucleotides were synthesized bystandard phosphoramidite methods on an ASM-700 synthesizer(BIOSSET Ltd, Novosibirsk, Russia) using phosphoramiditespurchased from Glen Research (Sterling, VA). The syntheticoligonucleotides were uncoupled from the solid support with
Paper Molecular BioSystems
Ope
n A
cces
s A
rtic
le. P
ublis
hed
on 1
1 O
ctob
er 2
017.
Dow
nloa
ded
on 1
2/25
/202
1 6:
41:0
0 A
M.
Thi
s ar
ticle
is li
cens
ed u
nder
a C
reat
ive
Com
mon
s A
ttrib
utio
n 3.
0 U
npor
ted
Lic
ence
.View Article Online

2640 | Mol. BioSyst., 2017, 13, 2638--2649 This journal is©The Royal Society of Chemistry 2017
ammonium hydroxide according to the manufacturer’s protocol.The deprotected oligonucleotides were purified by high-performanceliquid chromatography. The purity of ODNs exceeded 98% asestimated by electrophoresis in a 20% denaturing polyacrylamidegel after staining with the Stains-All dye (Sigma-Aldrich). Concentra-tions of the oligonucleotides were determined by means of A260.The ODN duplexes were prepared by annealing of modified andcomplementary strands in a 1 : 1 molar ratio in a buffer consistingof 50 mM Tris–HCl pH 7.5, 50 mM KCl, 1 mM EDTA, 1 mMdithiothreitol, and 7% glycerol.
Stopped-flow fluorescence measurements
These measurements with fluorescence detection were carriedout mostly as described previously.21,22 In brief, we used aSX.18MV stopped-flow spectrometer (Applied Photophysics Ltd,UK) equipped with a 150 W Xe arc lamp and an optical cell with2 mm path length. The dead time of the instrument is 1.4 ms. Thefluorescence of Trp was excited at lex = 290 nm and monitored atlem 4 320 nm as transmitted by the filter WG-320 (Schott, Mainz,Germany). When we used substrates containing aPu residues,fluorescence was excited at a wavelength of 310 nm and detectedat wavelengths longer than 370 nm (LG-370 filter, Corion, USA). If a6-carboxyfluorescein (FAM) fluorophore was present in the ODNduplex (FRET-X-substrates), the wavelength lex = 494 nm was usedto excite these residues, and their emission was analyzed at lem 4515 nm (Schott filter OG-515). All the experiments were conductedat 25 1C in the buffer 50 mM Tris–HCl pH 7.5, 50 mM KCl, 1.0 mMEDTA, 1.0 mM DDT, and 7% glycerol (v/v).
In a standard procedure, the solution of hSMUG1 was placedin one instrument’s syringe and rapidly mixed in the reactionchamber with the substrate from another syringe. The reportedconcentrations of reactants are those in the reaction chamberafter mixing. Typically, each trace shown in the figures is theaverage of four or more fluorescence traces recorded in individualexperiments. In the figures, if necessary for better presentation,the curves were manually moved apart. This procedure does notaffect the results of fitting because the background fluorescence isfitted separately for each curve.
Polyacrylamide gel electrophoresis (PAGE) time-courseexperiments
The reaction mixture contained 5.0 mM U-substrate, 1.0 mMhSMUG1, 50 mM Tris–HCl, pH 7.5, 50 mM KCl, 1.0 mM EDTA,
1.0 mM DDT, and 7% glycerol (v/v). The U-strand was 50-endlabelled using phage T4 polynucleotide kinase (New EnglandBiolabs, Beverly, MA) and [g-32P]ATP (4500 Ci mol�1) accordingto the manufacturer’s protocol. Labeled oligonucleotide waspurified on Sephadex G-25 columns (GE Healthcare, LittleChalfont, UK). The reaction was initiated by adding the enzyme.Aliquots (2 mL) of the reaction mixture were withdrawn andimmediately quenched with 2 mL of gel-loading dye containing7 M urea solution with 0.1% bromophenol blue and 0.1% xylenecyanole. Then, 1.0 mL of 1.0 M NaOH was added with incubationat 56 1C for 15 min to hydrolyze both 50- and 30-phosphodiesterbonds at AP-sites. Alkali treatment was performed for all samplesbefore gel loading (including zero time point) and resultedin complete splitting of AP-sites generated by hSMUG1. Thesolution was neutralized with an equivalent amount of hydro-chloric acid and loaded on a 20% (w/v) polyacrylamide/7 M ureagel. Conversion of the substrate to the product was analyzed byautoradiography on an Agfa CP-BU X-ray film (Agfa-Geavert,Belgium) and quantified by scanning densitometry in theGel-Pro Analyzer software, v. 4.0 (Media Cybernetics, USA). Themeasurement error commonly did not exceed 20%.
Global fitting of stopped-flow data
The sets of kinetic curves obtained at different concentrationsof the reactants were analyzed in the DynaFit software (BioKin,Pullman, WA)23 as described elsewhere.24–26 This approach isbased on fluorescence intensity variation in the course of thereaction owing to the sequential formation and further trans-formation of the initially formed DNA–enzyme complex and itsconformers. The concentrations of each species in the mecha-nisms are described by a set of differential equations accordingto the kinetic scheme. The stopped-flow fluorescence traceswere directly fitted to the fluorescence intensity (Fc) at anyreaction time point (t) as the sum of the background fluorescence(Fb) and fluorescence intensity values of each i-intermediatecomplex (Fi) formed by the enzyme with DNA.
Fc ¼ Fb þXn
i¼0Fi tð Þ; (1)
Fi(t) = fi � [Ei(t)], (2)
where fi is the coefficient of specific fluorescence for eachdiscernible hSMUG1 conformer (or molar response factor),and Ei(t) is the concentration of the conformer at any giventime t (i = 0 corresponds to the free protein, and i 4 0 to theprotein–DNA complexes). These specific fluorescence coefficientsdescribe only the part of the fluorescence that changes due toDNA binding.
The software performs numerical integration of a systemof ordinary differential equations with subsequent nonlinearleast-squares regression analysis. In the fits, we optimized allrelevant rate constants for the forward and reverse reactionsas well as the specific molar response factors for all the inter-mediate complexes. During the data processing, the kineticinformation was obtained from temporal behavior of the fluores-cence intensity, not from the amplitudes of the specific
Table 1 DNA duplexes used as substrates and ligands of hSMUG1a
Shorthand Sequence
X-substrate, X = U 50-GCTCAXGTACAGAGCTG-30
X-ligand, X = F-site and C 30-CGAGTGCATGTCTCGAC-50
X-aPu-substrate, X = U 50-GCTCAX(aPu)TACAGAGCTG-30
X-aPu-ligand, X = F-site 30-CGAGTGCATGTCTCGAC-50
X-FRET-substrate, X = U 50-FAM-GCTCAXGTACAGAGCTG-30
X-FRET-ligand, X = F-site and C 30-CGAGTGCATGTCTCGAC-BHQ1-50
a aPu is 2-aminopurine, FAM is 6-carboxyfluorescein, BHQ1 is blackhole quencher.
Molecular BioSystems Paper
Ope
n A
cces
s A
rtic
le. P
ublis
hed
on 1
1 O
ctob
er 2
017.
Dow
nloa
ded
on 1
2/25
/202
1 6:
41:0
0 A
M.
Thi
s ar
ticle
is li
cens
ed u
nder
a C
reat
ive
Com
mon
s A
ttrib
utio
n 3.
0 U
npor
ted
Lic
ence
.View Article Online
This journal is©The Royal Society of Chemistry 2017 Mol. BioSyst., 2017, 13, 2638--2649 | 2641
signal contributions. The response factors for different con-formers resulting from the fits were not used for determinationof the equilibrium constants but rather provided additionalinformation on the fluorescence intensity variations in differentcomplexes and conformers.
Homology modeling and sequence alignment
A model of the structure of hSMUG1 was built by homologymodelling in the SWISS-MODEL environment using the structure-based alignment (http://swissmodel.expasy.org).27 Structures ofGmeSMUG1 from Geobacter metallireducens (Protein Data Bankcodes 5H98 and 5H9I)28 and xSMUG1 from Xenopus laevis (ProteinData Bank codes 1OE4 and 1OE5)5 served as templates. For eachmodel generated based on the selected templates SWISS-MODELprovides the model coordinates along with relevant informationto assess the modelling process and to expect the accuracy of themodel: the target-template alignment, a step-by-step modellinglog, information about the oligomeric state, binding the ligandsand cofactors, as well as QMEAN model quality estimation. The‘‘good’’ models, which are comparable to the experimentalstructure, reach QMEAN value �0.65.29 An alignment of aminoacid sequences of hSMUG1, xSMUG1, and GmeSMUG1 wasproduced in Clustal Omega.30
Results and discussionRational approaches to the conformational dynamic analysis
A comparison of pro- and eukaryotic DNA glycosylases that belong todifferent structural families has revealed that all these enzymes havecommon global structural features of DNA lesion recognition.31 Ingeneral, the mechanism of catalytic-complex formation includesinitial DNA binding and formation of a nonspecific complex, DNAbending, damaged base flipping out from the double helix, and itsplacement into the enzyme’s active site.16,21,32–34 Most of the DNAglycosylases insert some amino acids into the resulting void inDNA. Moreover, recent studies suggest that some DNA glyco-sylases diffusively scan DNA using a ‘‘wedge’’ amino acid residueto identify damaged nucleotides.16–18,32,34–37 The function of the‘‘wedge’’ amino acid is to sense damaged DNA bases before theireversion into the enzyme’s active site. Because mutual conforma-tional changes of the enzyme and DNA play an important role inthe damage recognition and in the formation of a catalyticcomplex, in the present work, we performed a pre-steady-statekinetic analysis of protein–DNA interactions with fluorescentdetection to resolve processes of conformational adjustments ofDNA glycosylase and DNA. For this purpose, the intrinsic proteinfluorescence from tryptophan residues and DNA fluorescencefrom the incorporated reporters were recorded by the stopped-flow technique.
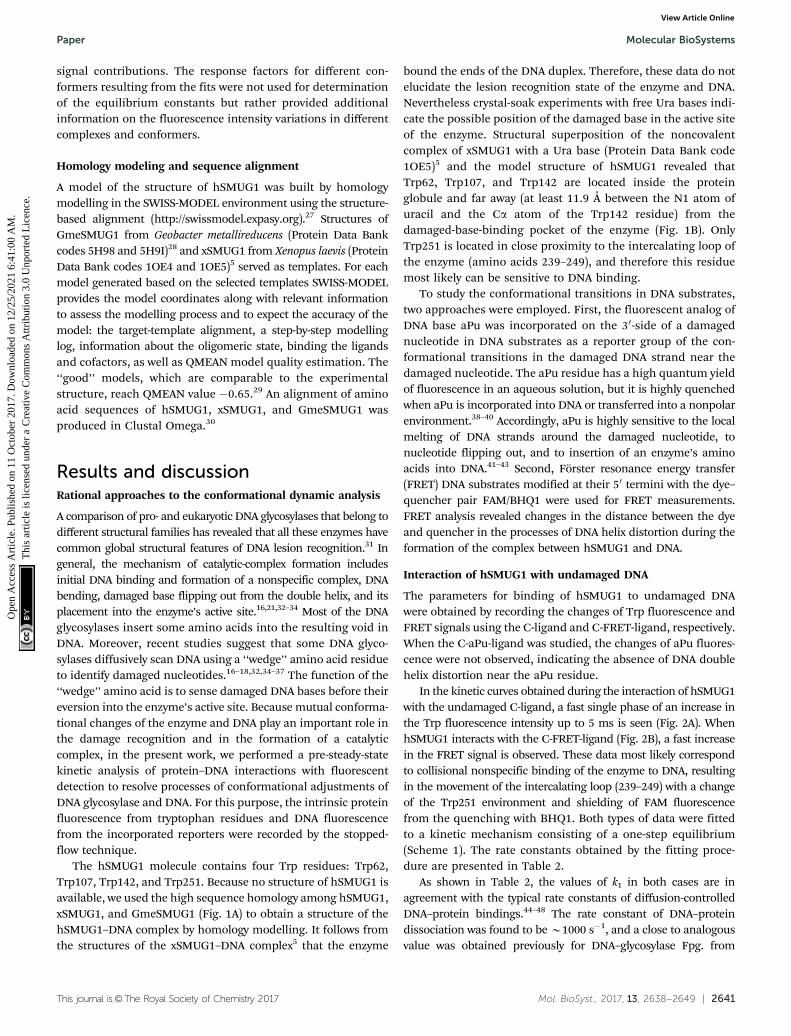
The hSMUG1 molecule contains four Trp residues: Trp62,Trp107, Trp142, and Trp251. Because no structure of hSMUG1 isavailable, we used the high sequence homology among hSMUG1,xSMUG1, and GmeSMUG1 (Fig. 1A) to obtain a structure of thehSMUG1–DNA complex by homology modelling. It follows fromthe structures of the xSMUG1–DNA complex5 that the enzyme
bound the ends of the DNA duplex. Therefore, these data do notelucidate the lesion recognition state of the enzyme and DNA.Nevertheless crystal-soak experiments with free Ura bases indi-cate the possible position of the damaged base in the active siteof the enzyme. Structural superposition of the noncovalentcomplex of xSMUG1 with a Ura base (Protein Data Bank code1OE5)5 and the model structure of hSMUG1 revealed thatTrp62, Trp107, and Trp142 are located inside the proteinglobule and far away (at least 11.9 Å between the N1 atom ofuracil and the Ca atom of the Trp142 residue) from thedamaged-base-binding pocket of the enzyme (Fig. 1B). OnlyTrp251 is located in close proximity to the intercalating loop ofthe enzyme (amino acids 239–249), and therefore this residuemost likely can be sensitive to DNA binding.
To study the conformational transitions in DNA substrates,two approaches were employed. First, the fluorescent analog ofDNA base aPu was incorporated on the 30-side of a damagednucleotide in DNA substrates as a reporter group of the con-formational transitions in the damaged DNA strand near thedamaged nucleotide. The aPu residue has a high quantum yieldof fluorescence in an aqueous solution, but it is highly quenchedwhen aPu is incorporated into DNA or transferred into a nonpolarenvironment.38–40 Accordingly, aPu is highly sensitive to the localmelting of DNA strands around the damaged nucleotide, tonucleotide flipping out, and to insertion of an enzyme’s aminoacids into DNA.41–43 Second, Forster resonance energy transfer(FRET) DNA substrates modified at their 50 termini with the dye–quencher pair FAM/BHQ1 were used for FRET measurements.FRET analysis revealed changes in the distance between the dyeand quencher in the processes of DNA helix distortion during theformation of the complex between hSMUG1 and DNA.
Interaction of hSMUG1 with undamaged DNA
The parameters for binding of hSMUG1 to undamaged DNAwere obtained by recording the changes of Trp fluorescence andFRET signals using the C-ligand and C-FRET-ligand, respectively.When the C-aPu-ligand was studied, the changes of aPu fluores-cence were not observed, indicating the absence of DNA doublehelix distortion near the aPu residue.
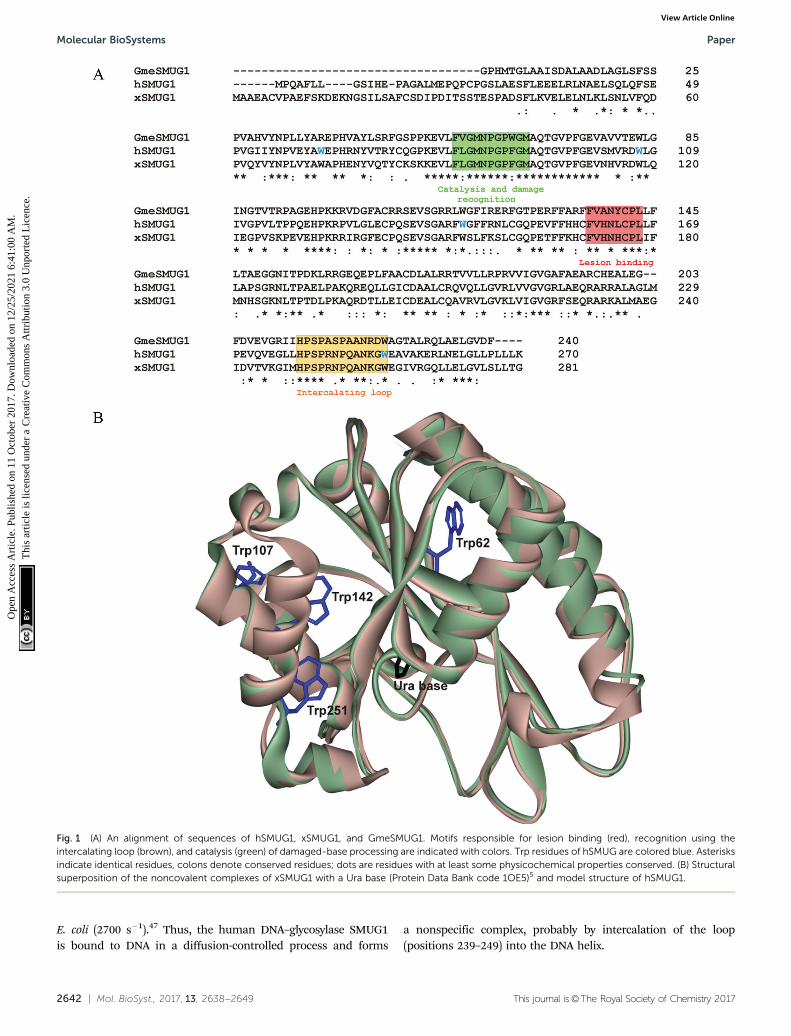
In the kinetic curves obtained during the interaction of hSMUG1with the undamaged C-ligand, a fast single phase of an increase inthe Trp fluorescence intensity up to 5 ms is seen (Fig. 2A). WhenhSMUG1 interacts with the C-FRET-ligand (Fig. 2B), a fast increasein the FRET signal is observed. These data most likely correspondto collisional nonspecific binding of the enzyme to DNA, resultingin the movement of the intercalating loop (239–249) with a changeof the Trp251 environment and shielding of FAM fluorescencefrom the quenching with BHQ1. Both types of data were fittedto a kinetic mechanism consisting of a one-step equilibrium(Scheme 1). The rate constants obtained by the fitting proce-dure are presented in Table 2.
As shown in Table 2, the values of k1 in both cases are inagreement with the typical rate constants of diffusion-controlledDNA–protein bindings.44–48 The rate constant of DNA–proteindissociation was found to be B1000 s�1, and a close to analogousvalue was obtained previously for DNA–glycosylase Fpg. from
Paper Molecular BioSystems
Ope
n A
cces
s A
rtic
le. P
ublis
hed
on 1
1 O
ctob
er 2
017.
Dow
nloa
ded
on 1
2/25
/202
1 6:
41:0
0 A
M.
Thi
s ar
ticle
is li
cens
ed u
nder
a C
reat
ive
Com
mon
s A
ttrib
utio
n 3.
0 U
npor
ted
Lic
ence
.View Article Online
2642 | Mol. BioSyst., 2017, 13, 2638--2649 This journal is©The Royal Society of Chemistry 2017
E. coli (2700 s�1).47 Thus, the human DNA–glycosylase SMUG1is bound to DNA in a diffusion-controlled process and forms
a nonspecific complex, probably by intercalation of the loop(positions 239–249) into the DNA helix.
Fig. 1 (A) An alignment of sequences of hSMUG1, xSMUG1, and GmeSMUG1. Motifs responsible for lesion binding (red), recognition using theintercalating loop (brown), and catalysis (green) of damaged-base processing are indicated with colors. Trp residues of hSMUG are colored blue. Asterisksindicate identical residues, colons denote conserved residues; dots are residues with at least some physicochemical properties conserved. (B) Structuralsuperposition of the noncovalent complexes of xSMUG1 with a Ura base (Protein Data Bank code 1OE5)5 and model structure of hSMUG1.
Molecular BioSystems Paper
Ope
n A
cces
s A
rtic
le. P
ublis
hed
on 1
1 O
ctob
er 2
017.
Dow
nloa
ded
on 1
2/25
/202
1 6:
41:0
0 A
M.
Thi
s ar
ticle
is li
cens
ed u
nder
a C
reat
ive
Com
mon
s A
ttrib
utio
n 3.
0 U
npor
ted
Lic
ence
.View Article Online
This journal is©The Royal Society of Chemistry 2017 Mol. BioSyst., 2017, 13, 2638--2649 | 2643
Interaction of hSMUG1 with the stable analog of a DNA product
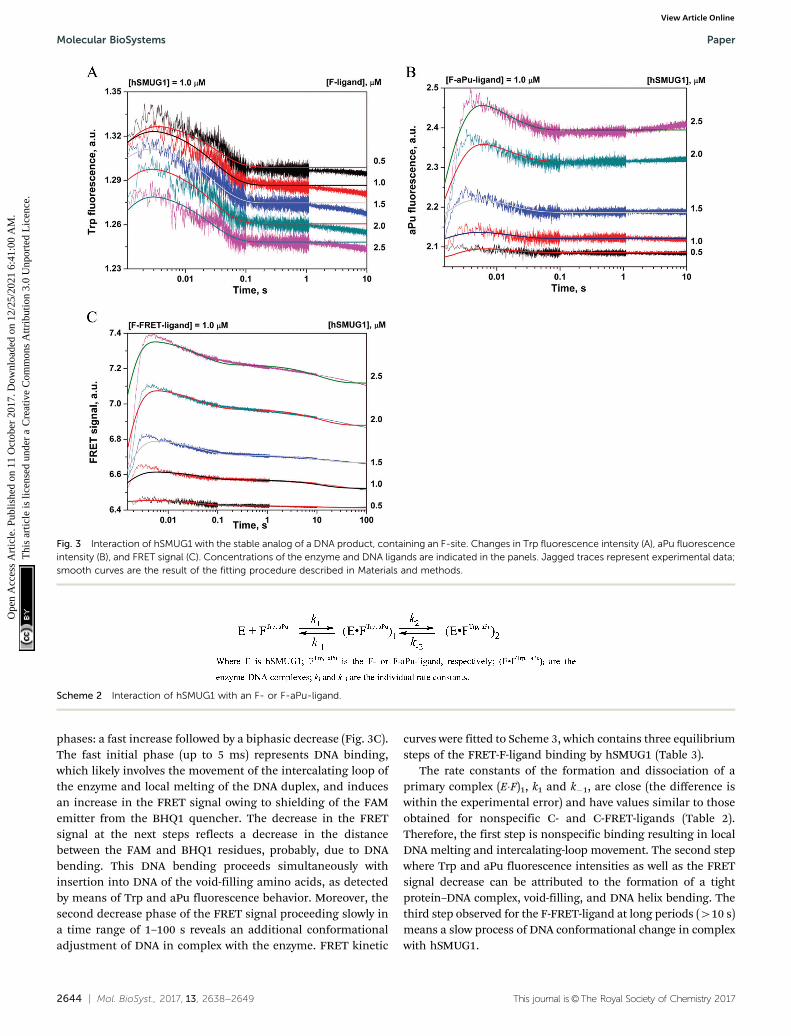
N-Glycosylase reaction catalyzed by hSMUG1 results in theformation of an AP-site as a final product. The AP-siteis chemically unstable; therefore, in many studies, its stableanalog (3-hydroxytetrahydrofuran-2-yl)methyl phosphate (F-site)has been successfully used.49–51 To detect the conformationalchanges of hSMUG1 during binding of an abasic DNA productwe also used the DNA ligand containing an F-site. The inter-action of the enzyme with the F-ligand led to a biphasic changein the Trp fluorescence intensity (Fig. 3A). The initial phase ofthe kinetic curves up to 5 ms represented a small increase in thefluorescence signal. We assumed that this phase corresponds tothe movement of the intercalating loop (positions 239–249) inthe course of nonspecific-complex formation as shown in thecase of a C-ligand. The decrease in the Trp fluorescence intensityin the second phase most likely reflects conformational changesinduced by the formation of new specific contacts between theenzyme’s active site and an F-ligand.
The nature of these specific interactions was elucidated byanalysis of aPu fluorescence because of high sensitivity of an aPuresidue to the microenvironment. Mixing of an F-aPu-ligand withhSMUG1 led to a biphasic change in the aPu fluorescence intensity(Fig. 3B) represented by a humped curve. The initial fast increasein the aPu fluorescence intensity up to 5 ms reveals the increase ofhydrophilicity of the aPu environment and correlates with the firstphase in Trp fluorescence and FRET time courses. In general,these data support the notion about the nature of this phase as theinitial DNA binding: movement of the intercalating loop inducinglocal melting of the DNA helix in the vicinity of the F-site. Ourprevious data on structurally unrelated DNA glycosylases hOGG152
and Fpg53 have revealed that the fast initial increase in the aPufluorescence is caused by eversion of the damaged base from theDNA helix. Therefore, we propose that during this time interval,the F-site can also be flipped out from DNA.
The next phase is characterized by a decrease in the fluores-cence intensity within 0.1 s. It is likely that this phase isassociated with the insertion of intercalating amino acids intothe void in the DNA helix formed by an F-site. The void-fillingprocess leads to transition of the aPu base into a more hydro-phobic environment leading to a decrease in the aPu fluores-cence intensity within 0.1 s. The kinetic curves obtained forboth Trp and aPu fluorescence data were fitted to a two-stepequilibrium mechanism (Scheme 2) resulting in calculation ofrate and equilibrium constants (Table 3).
The time course of a FRET signal obtained during theinteraction of hSMUG1 with the F-FRET-ligand has three visible
Fig. 2 Changes in Trp fluorescence intensity (A) and in the FRET signal (B) during the interaction of hSMUG1 with undamaged DNA. Concentrations ofthe enzyme and C-ligands are indicated in the panels. Jagged traces represent experimental data; smooth curves are the result of the fitting procedure asdescribed in Materials and methods.
Scheme 1 Formation of a nonspecific complex of hSMUG1 with undamaged DNA.
Table 2 Rate and equilibrium constants corresponding to the interactionof hSMUG1 with C- and C-FRET-ligands
Constants Trp FRET
k1, M�1 s�1 (170 � 60) � 106 (120 � 50) � 106
k�1, s�1 1260 � 460 850 � 170K1, M�1 0.13 � 106 0.14 � 106
Ki = ki/k�i, i is the number of a step.
Paper Molecular BioSystems
Ope
n A
cces
s A
rtic
le. P
ublis
hed
on 1
1 O
ctob
er 2
017.
Dow
nloa
ded
on 1
2/25
/202
1 6:
41:0
0 A
M.
Thi
s ar
ticle
is li
cens
ed u
nder
a C
reat
ive
Com
mon
s A
ttrib
utio
n 3.
0 U
npor
ted
Lic
ence
.View Article Online
2644 | Mol. BioSyst., 2017, 13, 2638--2649 This journal is©The Royal Society of Chemistry 2017
phases: a fast increase followed by a biphasic decrease (Fig. 3C).The fast initial phase (up to 5 ms) represents DNA binding,which likely involves the movement of the intercalating loop ofthe enzyme and local melting of the DNA duplex, and inducesan increase in the FRET signal owing to shielding of the FAMemitter from the BHQ1 quencher. The decrease in the FRETsignal at the next steps reflects a decrease in the distancebetween the FAM and BHQ1 residues, probably, due to DNAbending. This DNA bending proceeds simultaneously withinsertion into DNA of the void-filling amino acids, as detectedby means of Trp and aPu fluorescence behavior. Moreover, thesecond decrease phase of the FRET signal proceeding slowly ina time range of 1–100 s reveals an additional conformationaladjustment of DNA in complex with the enzyme. FRET kinetic
curves were fitted to Scheme 3, which contains three equilibriumsteps of the FRET-F-ligand binding by hSMUG1 (Table 3).
The rate constants of the formation and dissociation of aprimary complex (E�F)1, k1 and k�1, are close (the difference iswithin the experimental error) and have values similar to thoseobtained for nonspecific C- and C-FRET-ligands (Table 2).Therefore, the first step is nonspecific binding resulting in localDNA melting and intercalating-loop movement. The second stepwhere Trp and aPu fluorescence intensities as well as the FRETsignal decrease can be attributed to the formation of a tightprotein–DNA complex, void-filling, and DNA helix bending. Thethird step observed for the F-FRET-ligand at long periods (410 s)means a slow process of DNA conformational change in complexwith hSMUG1.
Fig. 3 Interaction of hSMUG1 with the stable analog of a DNA product, containing an F-site. Changes in Trp fluorescence intensity (A), aPu fluorescenceintensity (B), and FRET signal (C). Concentrations of the enzyme and DNA ligands are indicated in the panels. Jagged traces represent experimental data;smooth curves are the result of the fitting procedure described in Materials and methods.
Scheme 2 Interaction of hSMUG1 with an F- or F-aPu-ligand.
Molecular BioSystems Paper
Ope
n A
cces
s A
rtic
le. P
ublis
hed
on 1
1 O
ctob
er 2
017.
Dow
nloa
ded
on 1
2/25
/202
1 6:
41:0
0 A
M.
Thi
s ar
ticle
is li
cens
ed u
nder
a C
reat
ive
Com
mon
s A
ttrib
utio
n 3.
0 U
npor
ted
Lic
ence
.View Article Online
This journal is©The Royal Society of Chemistry 2017 Mol. BioSyst., 2017, 13, 2638--2649 | 2645
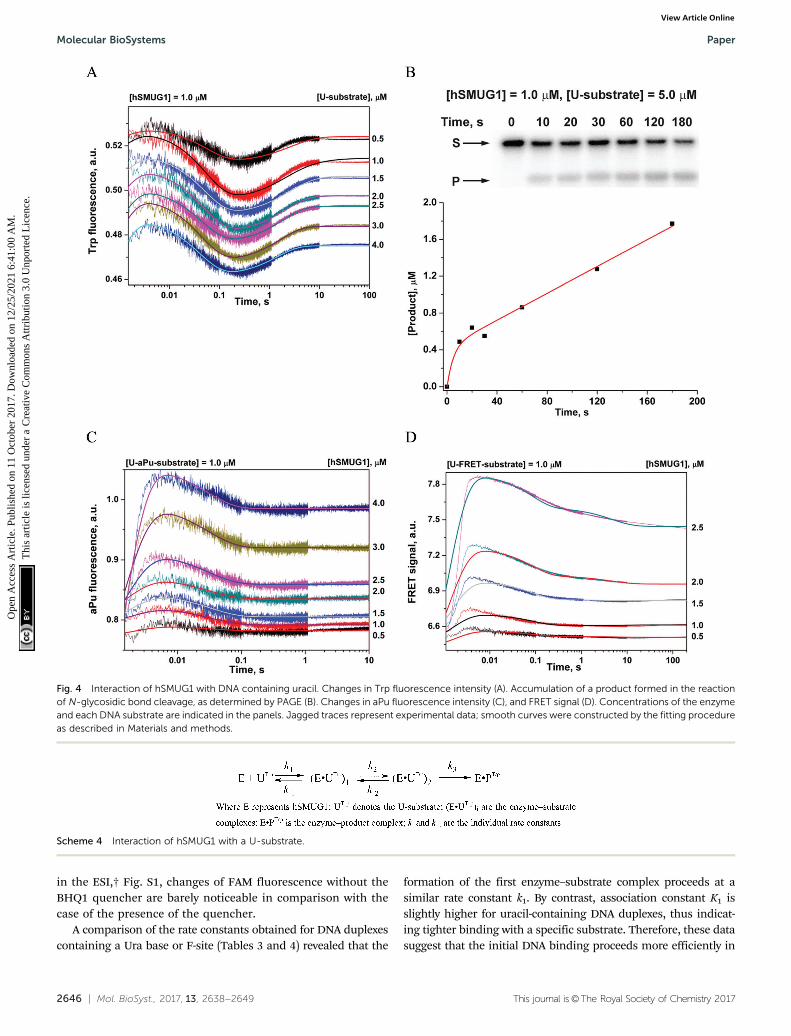
The interaction of hSMUG1 with DNA containing uracil
The full hSMUG1 enzymatic cycle was studied with a DNAsubstrate containing uracil (U-substrate). This process has toproceed through the formation of a catalytically competentcomplex and subsequent hydrolysis of the N-glycosidic bond ofthe uridine nucleotide. Trp fluorescence traces corresponding tohSMUG1 interaction with the U-substrate (Fig. 4A) revealed threephases of the process: (1) a slight increase in fluorescenceintensity up to 5 ms, (2) a decrease phase up to 0.3 s, and (3) afinal increase in the fluorescence intensity over a time range of0.3–10 s. A comparison of the initial parts (up to 0.2 s) of thekinetic curves obtained for an F-ligand and U-substrate revealedthat DNA binding and formation of the catalytic complex leadto similar changes in Trp fluorescence. Therefore, the finalincrease in Trp fluorescence intensity most likely characterizesthe catalytic step of N-glycosidic bond hydrolysis.
The minimal kinetic mechanism describing these fluorescencechanges consists of two reversible binding steps and one irrever-sible step of catalysis (Scheme 4). Given that hSMUG1 binds tightlyto product AP-sites, we hypothesized that the dissociation of theenzyme–product complex does not occur during the registrationtime (10 s), and product P stays tightly associated with the enzymein this period. The rate and equilibrium constants obtained byTrp fluorescence trace fitting are shown in Table 4.
PAGE analysis of the reaction product formation (Fig. 4B)showed that in the initial region of the kinetic curves (up to10 s), a burst is observed. This type of curve indicates the presenceof a rate-limiting step after the catalytic reaction. Indeed, hSMUG1binds tightly to product AP-sites, and steady-state rate constantkcat, which was found to be 0.014–0.05 s�1 as determinedelsewhere,4,14,15 is much less than rate constant k3, whichcharacterizes the catalytic step in Scheme 4. Therefore, webelieve that changes in Trp fluorescence allow us to determinethe ‘‘true’’ value of the catalytic rate constant.
The shape of the kinetic curves recorded by means of aPufluorescence (Fig. 4C) and FRET (Fig. 4D) for U-aPu and U-FRETsubstrates, respectively, was similar to the shapes obtained forDNA containing an F-site. The similarity of kinetic curvesobtained for cleavable (U-substrates) and uncleavable (F-ligands)DNAs supports the idea that catalytic reaction of N-glycosidicbond hydrolysis does not require additional conformationalchanges of DNA. The minimal kinetic schemes describing theobserved changes in aPu fluorescence intensity (Scheme 5) and inthe FRET signal (Scheme 6) were identical to those proposed forDNA containing an F-site (Table 4). It should be noted that theinitial increase phase of the FRET signal is not well fitted to thekinetic scheme due to the fact that the registered process is veryfast. Indeed, the dead time of the device is 1.4 ms, while the endof the growth phase occurs up to 4 ms. Therefore, this phase onthe kinetic curves reflects only the end of the ongoing process.Nevertheless, the proposed mechanism allowed estimation ofthe values of the rate constants of this phase.
It should be noted that hSMUG1 removes uracil from bothssDNA and dsDNA. Control experiments with ssDNA wereperformed to verify the possibility of the influence of enzymebinding to ssDNA on the kinetics of interaction with dsDNA(ESI,† Fig. S1). The obtained data support the conclusion thatinteraction of hSMUG1 with ssDNA cannot be detected usingTrp and aPu fluorescence. In the first case complex formationbetween hSMUG1 and ssU oligonucleotides does not provideenough quenching of Trp fluorescence by nucleic bases, prob-ably, due to different modes of interaction with ssDNA anddsDNA. In the case of ssUaPu oligonucleotides, the aPu base islocated in the aqueous polar environment and has a high levelof fluorescence intensity, which does not allow the process ofUra base eversion to be registered as in the case of a doublestranded U-aPu/G-substrate. Control experiments with theFAM-U/G duplex without BHQ1 were also carried out. As shown
Table 3 Rate and equilibrium constants corresponding to the interaction of hSMUG1 with DNA containing an F-site
Constants Trp aPu FRET
k1, M�1 s�1 (120 � 30) � 106 (130 � 10) � 106 (200 � 50) � 106
k�1, s�1 1000 � 250 490 � 60 650 � 70K1, M�1 0.12 � 106 0.26 � 106 0.31 � 106
k2, s�1 60 � 23 25 � 16 7.7 � 3.5k�2, s�1 24 � 7 55 � 21 18.4 � 0.9K2 2.5 � 1.7 0.45 � 0.46 0.42 � 0.21K1 � K2, M�1 0.3 � 106 0.12 � 106 0.13 � 106
k3, s�1 0.13 � 0.02k�3, s�1 0.067 � 0.004K3 1.9 � 0.4K1 � K2 � K3, M�1 0.25 � 106
Ki = ki/k�i, i is the number of a step.
Scheme 3 Interaction of hSMUG1 with an F-FRET-ligand.
Paper Molecular BioSystems
Ope
n A
cces
s A
rtic
le. P
ublis
hed
on 1
1 O
ctob
er 2
017.
Dow
nloa
ded
on 1
2/25
/202
1 6:
41:0
0 A
M.
Thi
s ar
ticle
is li
cens
ed u
nder
a C
reat
ive
Com
mon
s A
ttrib
utio
n 3.
0 U
npor
ted
Lic
ence
.View Article Online
2646 | Mol. BioSyst., 2017, 13, 2638--2649 This journal is©The Royal Society of Chemistry 2017
in the ESI,† Fig. S1, changes of FAM fluorescence without theBHQ1 quencher are barely noticeable in comparison with thecase of the presence of the quencher.
A comparison of the rate constants obtained for DNA duplexescontaining a Ura base or F-site (Tables 3 and 4) revealed that the
formation of the first enzyme–substrate complex proceeds at asimilar rate constant k1. By contrast, association constant K1 isslightly higher for uracil-containing DNA duplexes, thus indicat-ing tighter binding with a specific substrate. Therefore, these datasuggest that the initial DNA binding proceeds more efficiently in
Fig. 4 Interaction of hSMUG1 with DNA containing uracil. Changes in Trp fluorescence intensity (A). Accumulation of a product formed in the reactionof N-glycosidic bond cleavage, as determined by PAGE (B). Changes in aPu fluorescence intensity (C), and FRET signal (D). Concentrations of the enzymeand each DNA substrate are indicated in the panels. Jagged traces represent experimental data; smooth curves were constructed by the fitting procedureas described in Materials and methods.
Scheme 4 Interaction of hSMUG1 with a U-substrate.
Molecular BioSystems Paper
Ope
n A
cces
s A
rtic
le. P
ublis
hed
on 1
1 O
ctob
er 2
017.
Dow
nloa
ded
on 1
2/25
/202
1 6:
41:0
0 A
M.
Thi
s ar
ticle
is li
cens
ed u
nder
a C
reat
ive
Com
mon
s A
ttrib
utio
n 3.
0 U
npor
ted
Lic
ence
.View Article Online
This journal is©The Royal Society of Chemistry 2017 Mol. BioSyst., 2017, 13, 2638--2649 | 2647
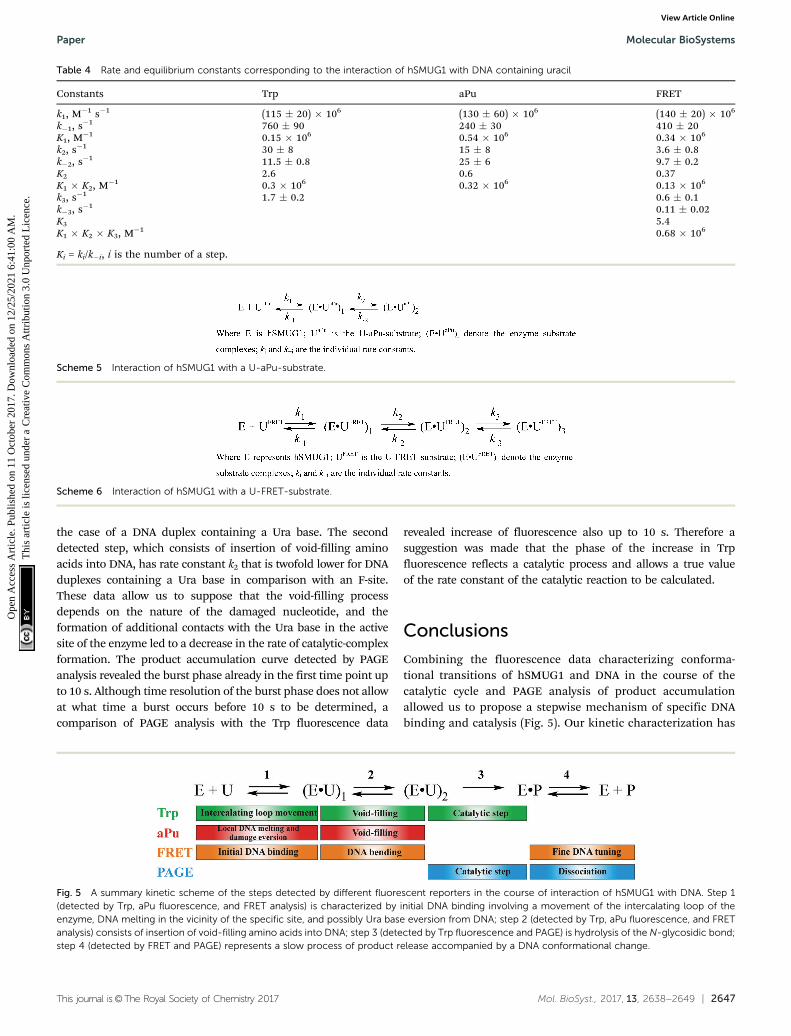
the case of a DNA duplex containing a Ura base. The seconddetected step, which consists of insertion of void-filling aminoacids into DNA, has rate constant k2 that is twofold lower for DNAduplexes containing a Ura base in comparison with an F-site.These data allow us to suppose that the void-filling processdepends on the nature of the damaged nucleotide, and theformation of additional contacts with the Ura base in the activesite of the enzyme led to a decrease in the rate of catalytic-complexformation. The product accumulation curve detected by PAGEanalysis revealed the burst phase already in the first time point upto 10 s. Although time resolution of the burst phase does not allowat what time a burst occurs before 10 s to be determined, acomparison of PAGE analysis with the Trp fluorescence data
revealed increase of fluorescence also up to 10 s. Therefore asuggestion was made that the phase of the increase in Trpfluorescence reflects a catalytic process and allows a true valueof the rate constant of the catalytic reaction to be calculated.
Conclusions
Combining the fluorescence data characterizing conforma-tional transitions of hSMUG1 and DNA in the course of thecatalytic cycle and PAGE analysis of product accumulationallowed us to propose a stepwise mechanism of specific DNAbinding and catalysis (Fig. 5). Our kinetic characterization has
Table 4 Rate and equilibrium constants corresponding to the interaction of hSMUG1 with DNA containing uracil
Constants Trp aPu FRET
k1, M�1 s�1 (115 � 20) � 106 (130 � 60) � 106 (140 � 20) � 106
k�1, s�1 760 � 90 240 � 30 410 � 20K1, M�1 0.15 � 106 0.54 � 106 0.34 � 106
k2, s�1 30 � 8 15 � 8 3.6 � 0.8k�2, s�1 11.5 � 0.8 25 � 6 9.7 � 0.2K2 2.6 0.6 0.37K1 � K2, M�1 0.3 � 106 0.32 � 106 0.13 � 106
k3, s�1 1.7 � 0.2 0.6 � 0.1k�3, s�1 0.11 � 0.02K3 5.4K1 � K2 � K3, M�1 0.68 � 106
Ki = ki/k�i, i is the number of a step.
Scheme 5 Interaction of hSMUG1 with a U-aPu-substrate.
Scheme 6 Interaction of hSMUG1 with a U-FRET-substrate.
Fig. 5 A summary kinetic scheme of the steps detected by different fluorescent reporters in the course of interaction of hSMUG1 with DNA. Step 1(detected by Trp, aPu fluorescence, and FRET analysis) is characterized by initial DNA binding involving a movement of the intercalating loop of theenzyme, DNA melting in the vicinity of the specific site, and possibly Ura base eversion from DNA; step 2 (detected by Trp, aPu fluorescence, and FRETanalysis) consists of insertion of void-filling amino acids into DNA; step 3 (detected by Trp fluorescence and PAGE) is hydrolysis of the N-glycosidic bond;step 4 (detected by FRET and PAGE) represents a slow process of product release accompanied by a DNA conformational change.
Paper Molecular BioSystems
Ope
n A
cces
s A
rtic
le. P
ublis
hed
on 1
1 O
ctob
er 2
017.
Dow
nloa
ded
on 1
2/25
/202
1 6:
41:0
0 A
M.
Thi
s ar
ticle
is li
cens
ed u
nder
a C
reat
ive
Com
mon
s A
ttrib
utio
n 3.
0 U
npor
ted
Lic
ence
.View Article Online
2648 | Mol. BioSyst., 2017, 13, 2638--2649 This journal is©The Royal Society of Chemistry 2017
determined the order of structural rearrangements in the enzymeand DNA substrate in the mechanism of action of DNA glycosylasehSMUG1. From the standpoint of the overall kinetic mechanism(Fig. 5), the first two equilibrium steps coincide with each other forall three types of fluorescence detection, implying synchronousconformational changes both in the enzyme and in the DNAsubstrate. At the first equilibrium binding step, hSMUG1 nonspe-cifically interacts with DNA, thereby causing movement of theintercalating loop of the enzyme, local DNA melting near thespecific site, and probably, damage eversion from DNA. In recentyears, it was reported that DNA glycosylases with different struc-tures and specificity have common structural features of DNAlesion recognition including insertion of ‘‘wedge’’ amino acids intoDNA.17,18,35,54–56 Therefore, the movement of the intercalating loopis probably associated with the ‘‘wedge’’ strategy of hSMUG1 forDNA lesion search. At the second step, the intercalating loop ofSMUG1 is completely inserted into the void in DNA. It should benoted that k2 is twofold higher for DNA duplexes containing anF-site than for duplexes containing a Ura base if we compare onaverage the data obtained by three types of detection. Thisfinding indicates that the rate of interaction of amino acids ofthe intercalating loop with the damaged nucleotide is dependenton the nature of the damage. Isomerization of the enzyme–substrate complex at this step produces a catalytically activeconformation. The catalytic reaction proceeds at the third step ofthe interaction. The ‘‘true’’ value of the rate constant of thecatalytic reaction was determined by Trp fluorescence changes,which is two orders higher than previously published valuesof kcat.
14,15 Rate-limiting dissociation of the enzyme–productcomplex is clearly detectable by PAGE as a slow phase of productaccumulation. Moreover, the third step detected by FRET analy-sis also reflects fine DNA tuning in the course of the productrelease because of a good agreement between the rate constantof this step and the value of steady-state kcat.
14,15
Abbreviations
SMUG1 Human single-stranded selective monofunctionaluracil-DNA glycosylase
AP-site Apurinic/apyrimidinic siteF-site (3-Hydroxytetrahydrofuran-2-yl)methyl phosphateODN OligodeoxyribonucleotidePAGE Polyacrylamide gel electrophoresisBER Base excision repairFRET Forster resonance energy transfer.
Conflicts of interest
The authors declare that they have no conflicts of interest.
Acknowledgements
This work was supported partially by a Russian Government-funded project (No. VI.57.1.2, 0309-2016-0001), SB RAS Compre-hensive Scientific Program (No. II.2P/VI.57-6, 0309-2015-0025),
and grants from the Russian Foundation of Basic Research(numbers 16-04-00037 and 15-04-00467). The part of the workwith Trp, aPu, and FRET detection combined with stopped-flowkinetics was specifically funded by Russian Science Foundationgrant 16-14-10038.
References
1 R. J. Boorstein, A. Cummings, Jr., D. R. Marenstein, M. K.Chan, Y. Ma, T. A. Neubert, S. M. Brown and G. W. Teebor,J. Biol. Chem., 2001, 276, 41991–41997.
2 T. Lindahl, Proc. Natl. Acad. Sci. U. S. A., 1974, 71,3649–3653.
3 K. A. Haushalter, P. T. Stukenberg, M. W. Kirschner andG. L. Verdine, Curr. Biol., 1999, 9, 174–185.
4 B. Kavli, O. Sundheim, M. Akbari, M. Otterlei, H. Nilsen,F. Skorpen, P. A. Aas, L. Hagen, H. E. Krokan andG. Slupphaug, J. Biol. Chem., 2002, 277, 39926–39936.
5 J. E. A. Wibley, T. R. Waters, K. Haushalter, G. L. Verdineand L. H. Pearl, Mol. Cell, 2003, 11, 1647–1659.
6 A. Masaoka, M. Matsubara, R. Hasegawa, T. Tanaka,S. Kurisu, H. Terato, Y. Ohyama, N. Karino, A. Matsudaand H. Ide, Biochemistry, 2003, 42, 5003–5012.
7 S. Bjelland and E. Seeberg, Mutat. Res., 2003, 531, 37–80.8 H. Nilsen, K. A. Haushalter, P. Robins, D. E. Barnes,
G. L. Verdine and T. Lindahl, EMBO J., 2001, 20, 4278–4286.9 H. Terato, A. Masaoka, M. Kobayashi, S. Fukushima,
Y. Ohyama, M. Yoshida and H. Ide, J. Biol. Chem., 1999,274, 25144–25150.
10 A. Masaoka, H. Terato, M. Kobayashi, Y. Ohyama andH. Ide, J. Biol. Chem., 2001, 276, 16501–16510.
11 H. E. Krokan, F. Drablos and G. Slupphaug, Oncogene, 2002,21, 8935–8948.
12 N. Schormann, R. Ricciardi and D. Chattopadhyay, ProteinSci., 2014, 23, 1667–1685.
13 L. H. Pearl, Mutat. Res., 2000, 460, 165–181.14 M. Matsubara, T. Tanaka, H. Terato, E. Ohmae, S. Izumi,
K. Katayanagi and H. Ide, Nucleic Acids Res., 2004, 32,5291–5302.
15 H. S. Pettersen, O. Sundheim, K. M. Gilljam, G. Slupphaug,H. E. Krokan and B. Kavli, Nucleic Acids Res., 2007, 35,3879–3892.
16 N. A. Kuznetsov, C. Bergonzo, A. J. Campbell, H. Li, G. V.Mechetin, C. de los Santos, A. P. Grollman, O. S. Fedorova,D. O. Zharkov and C. Simmerling, Nucleic Acids Res., 2015,43, 272–281.
17 S. R. Nelson, A. R. Dunn, S. D. Kathe, D. M. Warshaw andS. S. Wallace, Proc. Natl. Acad. Sci. U. S. A., 2014, 111,E2091–2099.
18 A. J. Lee and S. S. Wallace, Free Radical Biol. Med., 2017, 107,170–178.
19 R. M. Werner and J. T. Stivers, Biochemistry, 2000, 39,14054–14064.
20 S. C. Gill and P. H. von Hippel, Anal. Biochem., 1989, 182,319–326.
Molecular BioSystems Paper
Ope
n A
cces
s A
rtic
le. P
ublis
hed
on 1
1 O
ctob
er 2
017.
Dow
nloa
ded
on 1
2/25
/202
1 6:
41:0
0 A
M.
Thi
s ar
ticle
is li
cens
ed u
nder
a C
reat
ive
Com
mon
s A
ttrib
utio
n 3.
0 U
npor
ted
Lic
ence
.View Article Online
This journal is©The Royal Society of Chemistry 2017 Mol. BioSyst., 2017, 13, 2638--2649 | 2649
21 D. A. Yakovlev, A. A. Kuznetsova, O. S. Fedorova andN. A. Kuznetsov, Acta Naturae, 2017, 9, 88–98.
22 A. A. Kuznetsova, N. A. Kuznetsov, Y. N. Vorobjev,N. P. Barthes, B. Y. Michel, A. Burger and O. S. Fedorova,PloS One, 2014, 9, e100007.
23 P. Kuzmic, Anal. Biochem., 1996, 237, 260–273.24 N. A. Kuznetsov, Y. N. Vorobjev, L. N. Krasnoperov and
O. S. Fedorova, Nucleic Acids Res., 2012, 40, 7384–7392.25 N. A. Kuznetsov, V. V. Koval, D. O. Zharkov and
O. S. Fedorova, DNA Repair, 2012, 11, 884–891.26 V. V. Koval, N. A. Kuznetsov, A. A. Ishchenko, M. K. Saparbaev
and O. S. Fedorova, Mutat. Res., 2010, 685, 3–10.27 M. Biasini, S. Bienert, A. Waterhouse, K. Arnold, G. Studer,
T. Schmidt, F. Kiefer, T. Gallo Cassarino, M. Bertoni,L. Bordoli and T. Schwede, Nucleic Acids Res., 2014, 42,W252–258.
28 Z. Zhang, J. Shen, Y. Yang, J. Li, W. Cao and W. Xie, ACSChem. Biol., 2016, 11, 1729–1736.
29 P. Benkert, M. Biasini and T. Schwede, Bioinformatics, 2011,27, 343–350.
30 F. Sievers, A. Wilm, D. Dineen, T. J. Gibson, K. Karplus,W. Li, R. Lopez, H. McWilliam, M. Remmert, J. Soding, J. D.Thompson and D. G. Higgins, Mol. Syst. Biol., 2011, 7, 539.
31 S. C. Brooks, S. Adhikary, E. H. Rubinson and B. F. Eichman,Biochim. Biophys. Acta, 2013, 1834, 247–271.
32 O. A. Kladova, A. A. Kuznetsova, O. S. Fedorova andN. A. Kuznetsov, Genes, 2017, 8, 1–13.
33 N. A. Kuznetsov, A. S. Kiryutin, A. A. Kuznetsova, M. S. Panov,M. O. Barsukova, A. V. Yurkovskaya and O. S. Fedorova,J. Biomol. Struct. Dyn., 2017, 35, 950–967.
34 A. A. Kuznetsova, N. A. Kuznetsov, A. A. Ishchenko,M. K. Saparbaev and O. S. Fedorova, Biochim. Biophys. Acta,2014, 1840, 387–395.
35 A. J. Lee and S. S. Wallace, Radiat. Phys. Chem., 2016, 128,126–133.
36 N. A. Kuznetsov, A. A. Kuznetsova, Y. N. Vorobjev, L. N.Krasnoperov and O. S. Fedorova, PloS One, 2014, 9, e98495.
37 N. A. Kuznetsov, O. A. Kladova, A. A. Kuznetsova, A. A.Ishchenko, M. K. Saparbaev, D. O. Zharkov and O. S.Fedorova, J. Biol. Chem., 2015, 290, 14338–14349.
38 E. L. Rachofsky, R. Osman and J. B. A. Ross, Biochemistry,2001, 40, 946–956.
39 J. M. Jean and K. B. Hall, Proc. Natl. Acad. Sci. U. S. A., 2001,98, 37–41.
40 J. M. Jean and K. B. Hall, Biochemistry, 2002, 41, 13152–13161.41 L. C. Sowers, Y. Boulard and G. V. Fazakerley, Biochemistry,
2000, 39, 7613–7620.42 C. A. Dunlap and M. D. Tsai, Biochemistry, 2002, 41,
11226–11235.43 J. T. Stivers, K. W. Pankiewicz and K. A. Watanabe,
Biochemistry, 1999, 38, 952–963.44 O. G. Berg and P. H. Vonhippel, Annu. Rev. Biophys. Biophys.
Chem., 1985, 14, 131–160.45 M. Slutsky and L. A. Mirny, Biophys. J., 2004, 87, 4021–4035.46 S. E. Halford, Biochem. Soc. Trans., 2009, 37, 343–348.47 V. V. Koval, N. A. Kuznetsov, D. O. Zharkov, A. A. Ishchenko,
K. T. Douglas, G. A. Nevinsky and O. S. Fedorova, NucleicAcids Res., 2004, 32, 926–935.
48 N. A. Kuznetsov, V. V. Koval, D. O. Zharkov, G. A. Nevinsky,K. T. Douglas and O. S. Fedorova, Nucleic Acids Res., 2005,33, 3919–3931.
49 A. A. Kuznetsova, N. A. Kuznetsov, A. A. Ishchenko,M. K. Saparbaev and O. S. Fedorova, Biochim. Biophys. Acta,2014, 1840, 3042–3051.
50 N. A. Kuznetsov, V. V. Koval and O. S. Fedorova, Biochem-istry, 2011, 76, 118–130.
51 O. S. Fedorova, N. A. Kuznetsov, V. V. Koval andD. G. Knorre, Biochemistry, 2010, 75, 1225–1239.
52 N. A. Kuznetsov, V. V. Koval, G. A. Nevinsky, K. T. Douglas,D. O. Zharkov and O. S. Fedorova, J. Biol. Chem., 2007, 282,1029–1038.
53 N. A. Kuznetsov, V. V. Koval, D. O. Zharkov, Y. N. Vorobiev,G. A. Nevinsky, K. T. Douglas and O. S. Fedorova,Biochemistry, 2007, 46, 424–435.
54 A. R. Dunn, N. M. Kad, S. R. Nelson, D. M. Warshaw andS. S. Wallace, Nucleic Acids Res., 2011, 39, 7487–7498.
55 A. Prakash, S. Doublie and S. S. Wallace, Prog. Mol. Biol.Transl. Sci., 2012, 110, 71–91.
56 A. J. Lee, D. M. Warshaw and S. S. Wallace, DNA Repair,2014, 20, 23–31.
Paper Molecular BioSystems
Ope
n A
cces
s A
rtic
le. P
ublis
hed
on 1
1 O
ctob
er 2
017.
Dow
nloa
ded
on 1
2/25
/202
1 6:
41:0
0 A
M.
Thi
s ar
ticle
is li
cens
ed u
nder
a C
reat
ive
Com
mon
s A
ttrib
utio
n 3.
0 U
npor
ted
Lic
ence
.View Article Online


![1 d[J] · reversible, consecutive and parallel reactions The rapid pre-equilibrium and steady state approximations, rate determining steps 4 Before kinetic investigations, one should](https://img.pdfslide.us/doc/110x75/5ebae041cff3f75bbf017216/1-dj-reversible-consecutive-and-parallel-reactions-the-rapid-pre-equilibrium.jpg)