Embed Size (px)
Citation preview

Pre-Partner Compensation Report2020

Table of Contents
EVCA 2020 COMPENSATION STUDY 2
Foreword
About EVCA
Executive Summary
Methodology
Compensation by Firm Characteristics
Compensation by Title
Survey Demographics
3
4
5
6
7
11
21
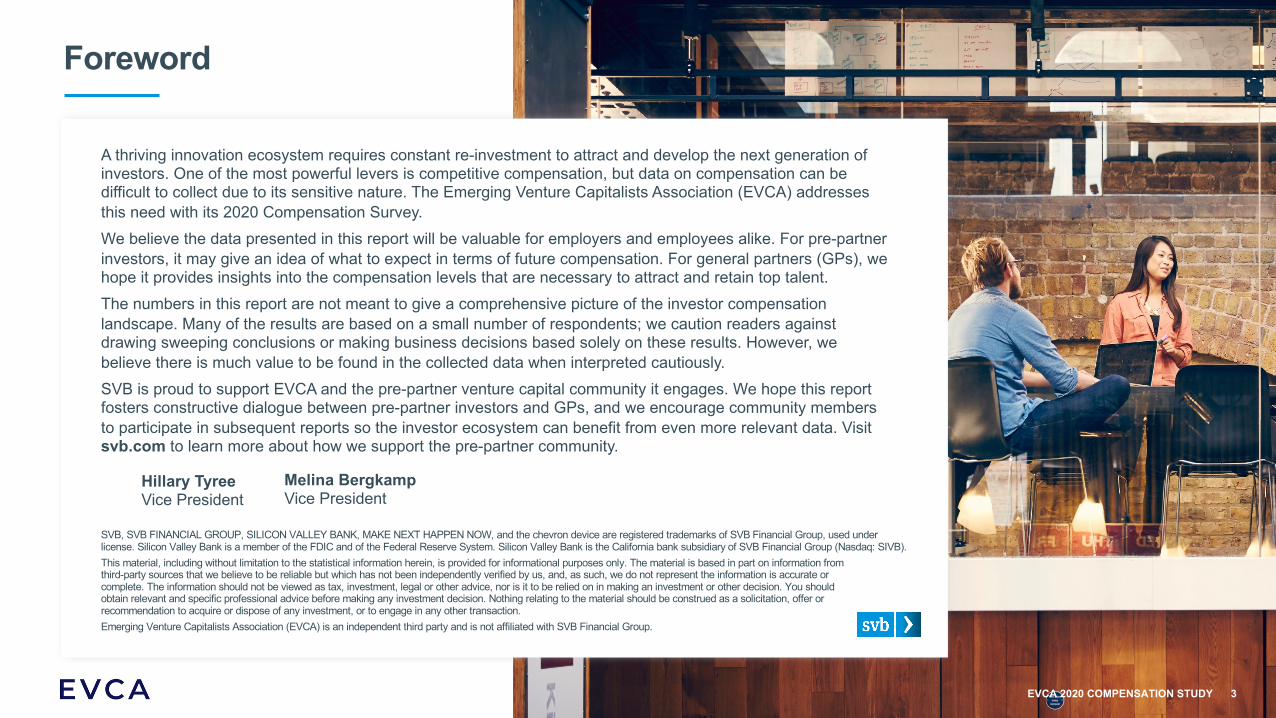
A thriving innovation ecosystem requires constant re-investment to attract and develop the next generation of investors. One of the most powerful levers is competitive compensation, but data on compensation can be difficult to collect due to its sensitive nature. The Emerging Venture Capitalists Association (EVCA) addresses this need with its 2020 Compensation Survey.We believe the data presented in this report will be valuable for employers and employees alike. For pre-partner investors, it may give an idea of what to expect in terms of future compensation. For general partners (GPs), we hope it provides insights into the compensation levels that are necessary to attract and retain top talent.The numbers in this report are not meant to give a comprehensive picture of the investor compensation landscape. Many of the results are based on a small number of respondents; we caution readers against drawing sweeping conclusions or making business decisions based solely on these results. However, we believe there is much value to be found in the collected data when interpreted cautiously.SVB is proud to support EVCA and the pre-partner venture capital community it engages. We hope this report fosters constructive dialogue between pre-partner investors and GPs, and we encourage community members to participate in subsequent reports so the investor ecosystem can benefit from even more relevant data. Visit svb.com to learn more about how we support the pre-partner community.
Foreword
EVCA 2020 COMPENSATION STUDY 3
Hillary TyreeVice President
Melina BergkampVice President
SVB, SVB FINANCIAL GROUP, SILICON VALLEY BANK, MAKE NEXT HAPPEN NOW, and the chevron device are registered trademarks of SVB Financial Group, used under license. Silicon Valley Bank is a member of the FDIC and of the Federal Reserve System. Silicon Valley Bank is the California bank subsidiary of SVB Financial Group (Nasdaq: SIVB).This material, including without limitation to the statistical information herein, is provided for informational purposes only. The material is based in part on information from third-party sources that we believe to be reliable but which has not been independently verified by us, and, as such, we do not represent the information is accurate or complete. The information should not be viewed as tax, investment, legal or other advice, nor is it to be relied on in making an investment or other decision. You should obtain relevant and specific professional advice before making any investment decision. Nothing relating to the material should be construed as a solicitation, offer or recommendation to acquire or dispose of any investment, or to engage in any other transaction.Emerging Venture Capitalists Association (EVCA) is an independent third party and is not affiliated with SVB Financial Group.

The Emerging Venture Capitalists Association (EVCA) was founded in 2017 as the primary community for the pre-partner venture capital investor. Our highly curated membership of over 750 investors represents a diverse group of institutional, micro VCs, and corporate venture funds from across the United States. The community is organized on Slack, with 40+ channels dedicated to discussing industry verticals, co-investment opportunities, career planning, community service, and personal interests.
Our Mission:
As a 501(c)(3) organization, our mission is to be a support system for pre-partner investors and provide various resources that enable them to better succeed at their jobs.
About EVCA
EVCA 2020 COMPENSATION STUDY 4
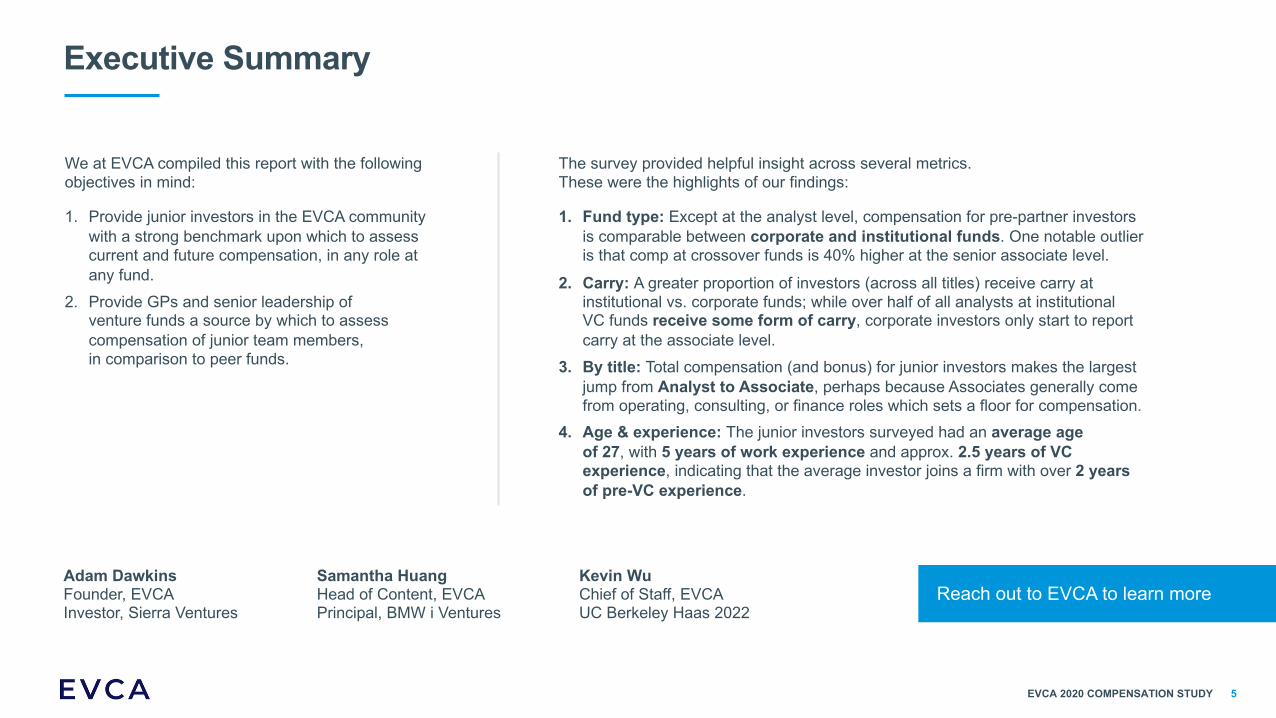
We at EVCA compiled this report with the following objectives in mind:
1. Provide junior investors in the EVCA community with a strong benchmark upon which to assess current and future compensation, in any role at any fund.
2. Provide GPs and senior leadership of venture funds a source by which to assess compensation of junior team members, in comparison to peer funds.
Executive Summary
The survey provided helpful insight across several metrics. These were the highlights of our findings:
1. Fund type: Except at the analyst level, compensation for pre-partner investors is comparable between corporate and institutional funds. One notable outlier is that comp at crossover funds is 40% higher at the senior associate level.
2. Carry: A greater proportion of investors (across all titles) receive carry at institutional vs. corporate funds; while over half of all analysts at institutional VC funds receive some form of carry, corporate investors only start to report carry at the associate level.
3. By title: Total compensation (and bonus) for junior investors makes the largest jump from Analyst to Associate, perhaps because Associates generally come from operating, consulting, or finance roles which sets a floor for compensation.
4. Age & experience: The junior investors surveyed had an average age of 27, with 5 years of work experience and approx. 2.5 years of VC experience, indicating that the average investor joins a firm with over 2 years of pre-VC experience.
Adam DawkinsFounder, EVCA Investor, Sierra Ventures
EVCA 2020 COMPENSATION STUDY 5
Kevin WuChief of Staff, EVCA UC Berkeley Haas 2022
Samantha HuangHead of Content, EVCA Principal, BMW i Ventures
Reach out to EVCA to learn more

The study includes data from 188 respondents drawn from an overall sampling frame of 700+ EVCA members. All respondents are investors at institutional, corporate, or crossover (VC arm of PE / HF) funds, with the large majority working for institutional funds.
Methodology
EVCA 2020 COMPENSATION STUDY 6
The survey was conducted over a 2 week period ending on Dec. 11th 2020, sent to our membership via the private EVCA slack channel and administered via a Google Form.
• Titles were normalized into 4 categories (Analyst / Senior Analyst, Associate, Senior Associate, VP / Principal); Partner data was excluded from analysis to reflect EVCA’s focus on the pre-partner investor community.
• Investors were grouped into 4 stages (Pre-Seed / Seed, Early Stage, Growth Stage, Stage Agnostic), as reported on their survey submission. Early Stage was defined as Seed to Series B, and Growth Stage as Series C to IPO.
• Any buckets (i.e. X title at Y stage firm) with less than 4 data points were removed from display for the sake of anonymity.
• A few data points (significant outliers or extraneous data) were removed from the raw dataset.
• AUM was standardized to millions (M) for all respondents.
*Note that the survey was completed on a voluntary basis, and results should be interpreted accordingly.
Data cleaning:
Compensation by Firm Characteristics
Note: Only categories where n >= 4 are displayed in the following tables*Crossover VC = VC arm of private equity / hedge fund
EVCA 2020 COMPENSATION STUDY 7
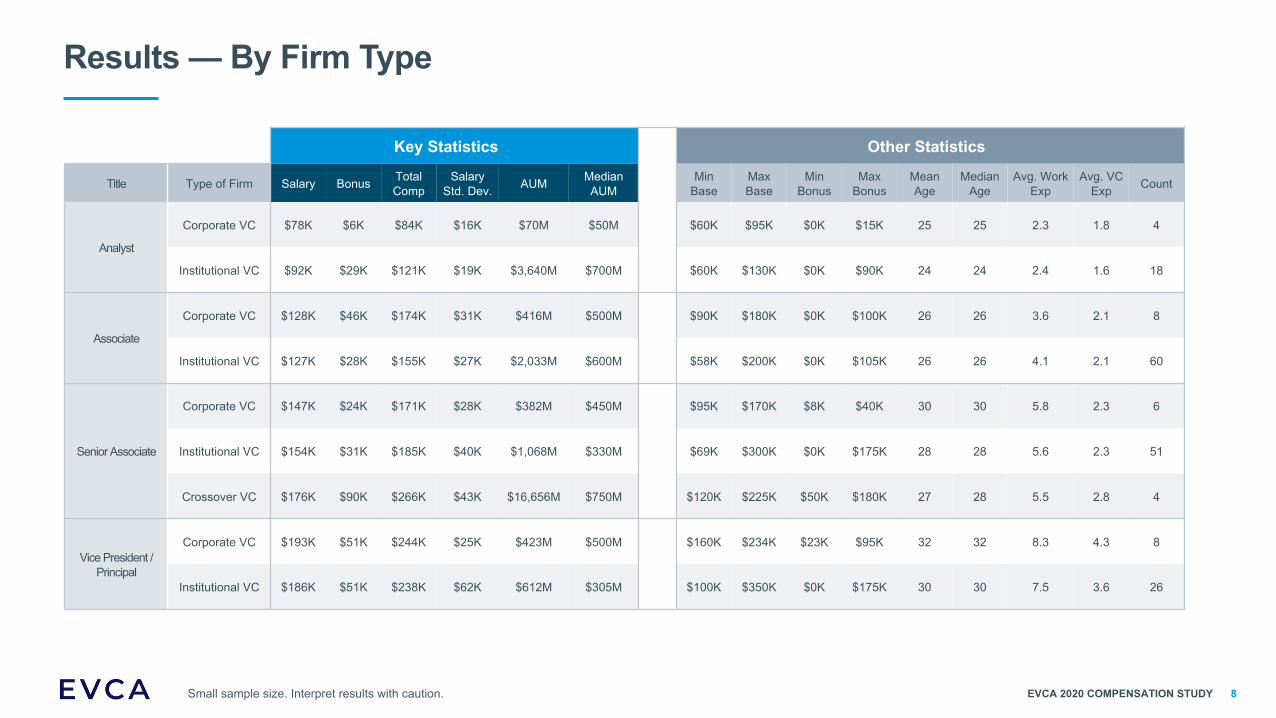
Results — By Firm Type
EVCA 2020 COMPENSATION STUDY
Key Statistics Other Statistics
Title Type of Firm Salary Bonus Total Comp
Salary Std. Dev. AUM Median
AUMMin
BaseMax Base
Min Bonus
Max Bonus
Mean Age
Median Age
Avg. Work Exp
Avg. VC Exp Count
Analyst
Corporate VC $78K $6K $84K $16K $70M $50M $60K $95K $0K $15K 25 25 2.3 1.8 4
Institutional VC $92K $29K $121K $19K $3,640M $700M $60K $130K $0K $90K 24 24 2.4 1.6 18
Associate
Corporate VC $128K $46K $174K $31K $416M $500M $90K $180K $0K $100K 26 26 3.6 2.1 8
Institutional VC $127K $28K $155K $27K $2,033M $600M $58K $200K $0K $105K 26 26 4.1 2.1 60
Senior Associate
Corporate VC $147K $24K $171K $28K $382M $450M $95K $170K $8K $40K 30 30 5.8 2.3 6
Institutional VC $154K $31K $185K $40K $1,068M $330M $69K $300K $0K $175K 28 28 5.6 2.3 51
Crossover VC $176K $90K $266K $43K $16,656M $750M $120K $225K $50K $180K 27 28 5.5 2.8 4
Vice President /Principal
Corporate VC $193K $51K $244K $25K $423M $500M $160K $234K $23K $95K 32 32 8.3 4.3 8
Institutional VC $186K $51K $238K $62K $612M $305M $100K $350K $0K $175K 30 30 7.5 3.6 26
Small sample size. Interpret results with caution. 8

Results — By Firm Stage
Key Statistics Other Statistics
Title Firm Stage Salary Bonus Total Comp
Salary Std. Dev. AUM Median
AUMMin
BaseMax Base
Min Bonus
Max Bonus
Mean Age
Median Age
Avg. Work Exp
Avg. VC Exp Count
Analyst
Growth and Late Stage $93K $58K $151K $9K $9,483M $6,500M $80K $105K $20K $90K 23 23 1.3 1.1 6
Early Stage $93K $14K $107K $20K $776M $425M $60K $130K $0K $40K 25 25 2.9 1.9 11
Pre-Seed / Seed $78K $7K $85K $24K $72M $56M $60K $119K $0K $15K 25 24 2.4 1.6 5
Associate
Growth and Late Stage $138K $65K $203K $25K $3,766M $975M $100K $180K $0K $150K 26 26 3.7 2.2 12
Stage Agnostic $120K $46K $166K $19K $8,733M $4,500M $100K $140K $0K $90K 26 25 4.1 2.3 8
Early Stage $130K $25K $155K $27K $912M $500M $66K $200K $0K $90K 27 27 4.2 1.9 43
Pre-Seed / Seed $105K $7K $112K $26K $149M $100M $58K $135K $0K $30K 25 25 3.6 2.0 7
Senior Associate
Growth and Late Stage $171K $60K $231K $57K $9,206M $1,500M $120K $300K $0K $180K 27 27 5.2 2.1 8
Stage Agnostic $172K $42K $213K $47K $2,988M $1,750M $95K $250K $0K $175K 27 26 3.9 2.5 8
Early Stage $158K $33K $191K $26K $726M $365M $110K $230K $0K $90K 29 29 6.1 2.4 34
Pre-Seed / Seed $120K $13K $133K $35K $105M $56M $69K $175K $0K $85K 27 28 5.5 2.4 11
Vice President /Principal
Growth and Late Stage $209K $133K $341K $78K $1,075M $1,000M $160K $325K $40K $175K 29 29 6.3 3.3 4
Stage Agnostic $252K $83K $336K $67K $1,725M $1,500M $200K $350K $25K $150K 29 29 6.6 3.4 4
Early Stage $186K $41K $226K $42K $379M $500M $100K $300K $0K $100K 31 30 8.1 4.0 21
Pre-Seed / Seed $141K $21K $162K $14K $54M $35M $130K $165K $0K $55K 30 30 7.5 2.9 6
EVCA 2020 COMPENSATION STUDY 9Small sample size. Interpret results with caution.

Results — By Firm Region
Key Statistics Other Statistics
Title Firm Region Salary Bonus Total Comp
Salary Std. Dev. AUM Median
AUMMin
BaseMax Base
Min Bonus
Max Bonus
Mean Age
Median Age
Avg. Work Exp
Avg. VC Exp Count
Analyst
Silicon Valley $96K $24K $120K $18K $2,724M $50M $70K $119K $0K $90K 25 23 2.8 1.4 5
New York $95K $28K $123K $19K $6,035M $2,000M $70K $130K $0K $80K 24 24 1.8 1.2 8
Boston $82K $23K $105K $17K $596M $135M $60K $100K $6K $60K 24 24 2.0 1.8 4
Associate
Silicon Valley $136K $30K $167K $25K $2,837M $700M $90K $200K $0K $150K 26 26 4.2 2.0 42
Los Angeles $132K $53K $185K $30K $672M $261M $100K $170K $0K $105K 27 28 4.2 2.8 5
New York $118K $45K $164K $19K $1,879M $400M $80K $150K $0K $90K 25 25 3.6 1.6 14
Senior Associate
Silicon Valley $165K $45K $210K $42K $2,894M $550M $69K $300K $0K $180K 29 28 6.0 2.5 35
New York $141K $18K $160K $29K $1,078M $300M $90K $200K $0K $90K 27 27 4.4 2.0 15
Austin $159K $25K $184K $33K $243M $175M $120K $200K $0K $50K 30 30 6.5 2.0 4
Chicago $114K $0K $114K $34K $148M $80M $85K $150K $0K $K 28 27 4.8 2.8 4
Vice President /Principal
Silicon Valley $200K $57K $256K $49K $657M $500M $135K $325K $0K $150K 31 30 7.8 3.9 18
New York $166K $68K $234K $34K $415M $400M $100K $220K $10K $175K 30 30 7.0 3.5 11
EVCA 2020 COMPENSATION STUDY 10Small sample size. Interpret results with caution.

Compensation by Title
EVCA 2020 COMPENSATION STUDY 11
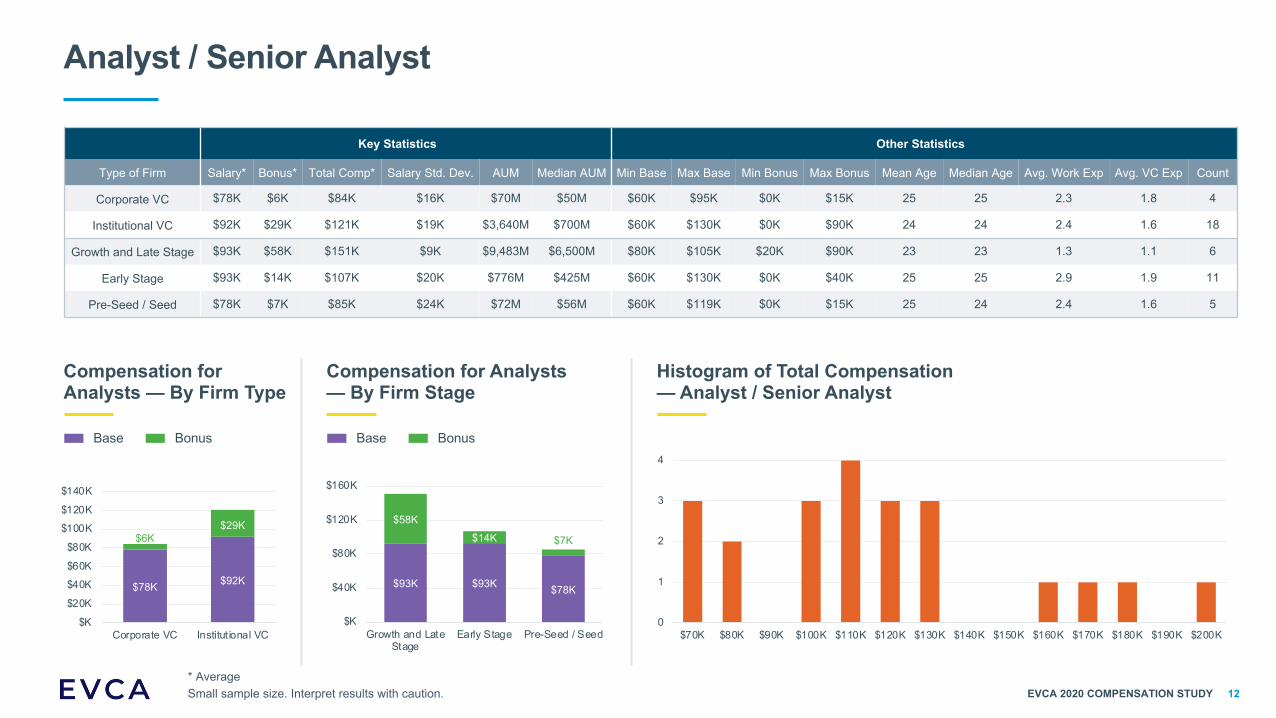
Analyst / Senior Analyst
Key Statistics Other Statistics
Type of Firm Salary* Bonus* Total Comp* Salary Std. Dev. AUM Median AUM Min Base Max Base Min Bonus Max Bonus Mean Age Median Age Avg. Work Exp Avg. VC Exp Count
Corporate VC $78K $6K $84K $16K $70M $50M $60K $95K $0K $15K 25 25 2.3 1.8 4
Institutional VC $92K $29K $121K $19K $3,640M $700M $60K $130K $0K $90K 24 24 2.4 1.6 18
Growth and Late Stage $93K $58K $151K $9K $9,483M $6,500M $80K $105K $20K $90K 23 23 1.3 1.1 6
Early Stage $93K $14K $107K $20K $776M $425M $60K $130K $0K $40K 25 25 2.9 1.9 11
Pre-Seed / Seed $78K $7K $85K $24K $72M $56M $60K $119K $0K $15K 25 24 2.4 1.6 5
$78K $92K
$6K$29K
$K
$20K
$40K
$60K
$80K
$100K
$120K
$140K
Corporate VC Institut ional VC
Compensation for Analysts — By Firm Type
BonusBase
Compensation for Analysts — By Firm Stage
BonusBase
$93K $93K $78K
$58K
$14K $7K
$K
$40K
$80K
$120K
$160K
Growth and LateStage
Early Stage Pre-Seed / Seed
Histogram of Total Compensation — Analyst / Senior Analyst
0
1
2
3
4
$70K $80K $90K $100K $110K $120K $130K $140K $150K $160K $170K $180K $190K $200K
EVCA 2020 COMPENSATION STUDY 12Small sample size. Interpret results with caution.* Average
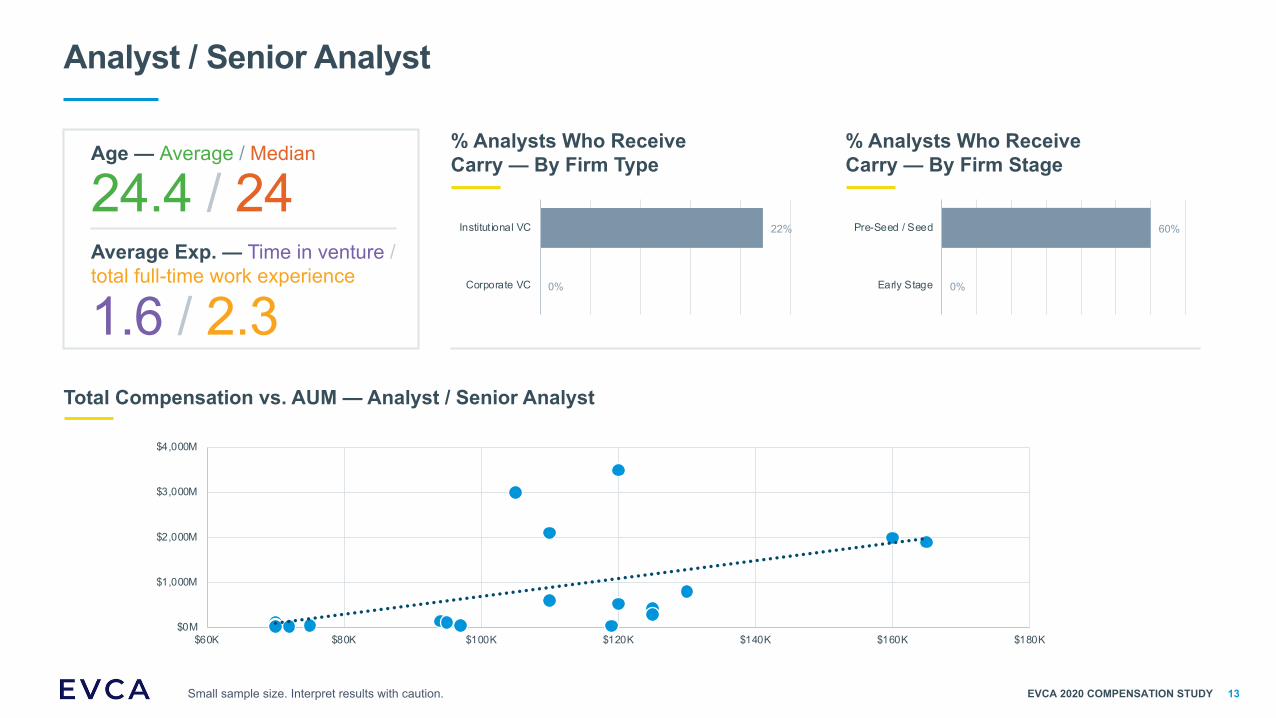
% Analysts Who Receive Carry — By Firm TypeAge — Average / Median
24.4 / 24Average Exp. — Time in venture / total full-time work experience
1.6 / 2.30%
22%
Corporate VC
Institut ional VC
% Analysts Who Receive Carry — By Firm Stage
0%
60%
Early Stage
Pre-Seed / Seed
Total Compensation vs. AUM — Analyst / Senior Analyst
$0M
$1,000M
$2,000M
$3,000M
$4,000M
$60K $80K $100K $120K $140K $160K $180K
Analyst / Senior Analyst
EVCA 2020 COMPENSATION STUDY 13Small sample size. Interpret results with caution.
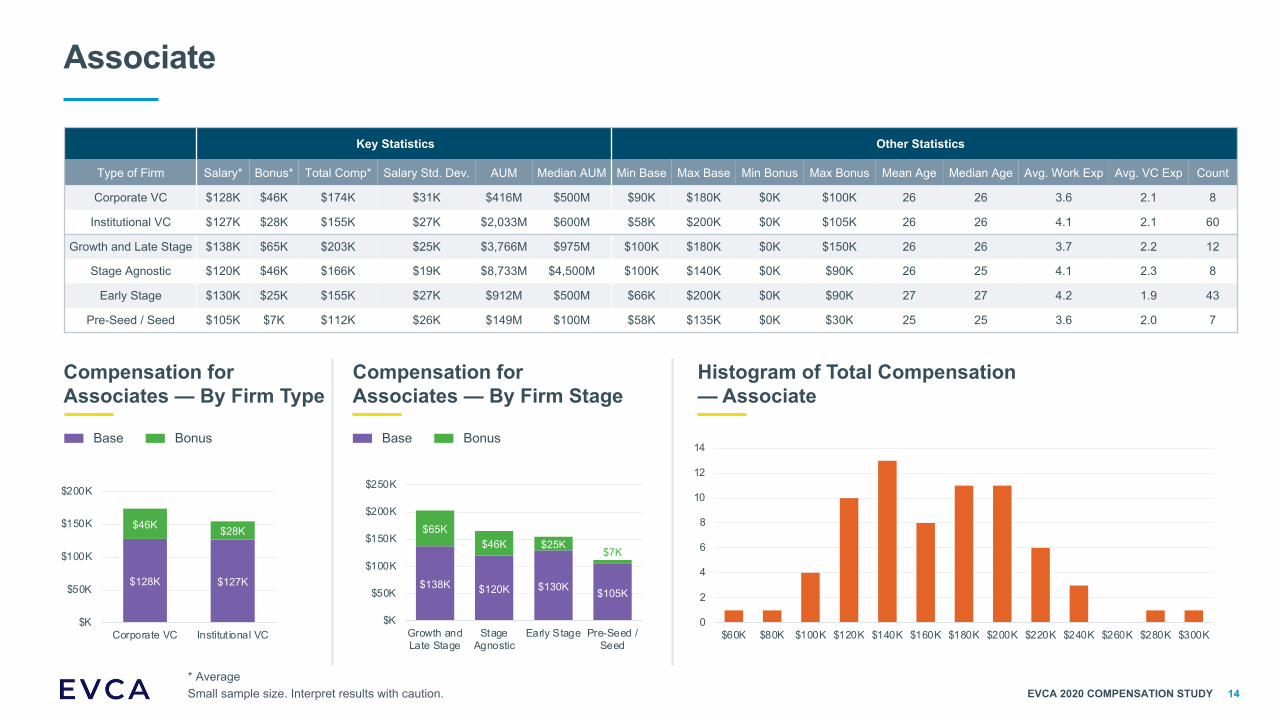
Associate
Compensation for Associates — By Firm Type
Compensation for Associates — By Firm Stage
Histogram of Total Compensation — Associate
$128K $127K
$46K $28K
$K
$50K
$100K
$150K
$200K
Corporate VC Institut ional VC
$138K $120K $130K $105K
$65K$46K $25K
$7K
$K
$50K
$100K
$150K
$200K
$250K
Growth andLate Stage
StageAgnostic
Early Stage Pre-Seed /Seed
0
2
4
6
8
10
12
14
$60K $80K $100K $120K $140K $160K $180K $200K $220K $240K $260K $280K $300K
Key Statistics Other Statistics
Type of Firm Salary* Bonus* Total Comp* Salary Std. Dev. AUM Median AUM Min Base Max Base Min Bonus Max Bonus Mean Age Median Age Avg. Work Exp Avg. VC Exp Count
Corporate VC $128K $46K $174K $31K $416M $500M $90K $180K $0K $100K 26 26 3.6 2.1 8
Institutional VC $127K $28K $155K $27K $2,033M $600M $58K $200K $0K $105K 26 26 4.1 2.1 60
Growth and Late Stage $138K $65K $203K $25K $3,766M $975M $100K $180K $0K $150K 26 26 3.7 2.2 12
Stage Agnostic $120K $46K $166K $19K $8,733M $4,500M $100K $140K $0K $90K 26 25 4.1 2.3 8
Early Stage $130K $25K $155K $27K $912M $500M $66K $200K $0K $90K 27 27 4.2 1.9 43
Pre-Seed / Seed $105K $7K $112K $26K $149M $100M $58K $135K $0K $30K 25 25 3.6 2.0 7
BonusBase BonusBase
EVCA 2020 COMPENSATION STUDY 14Small sample size. Interpret results with caution.* Average
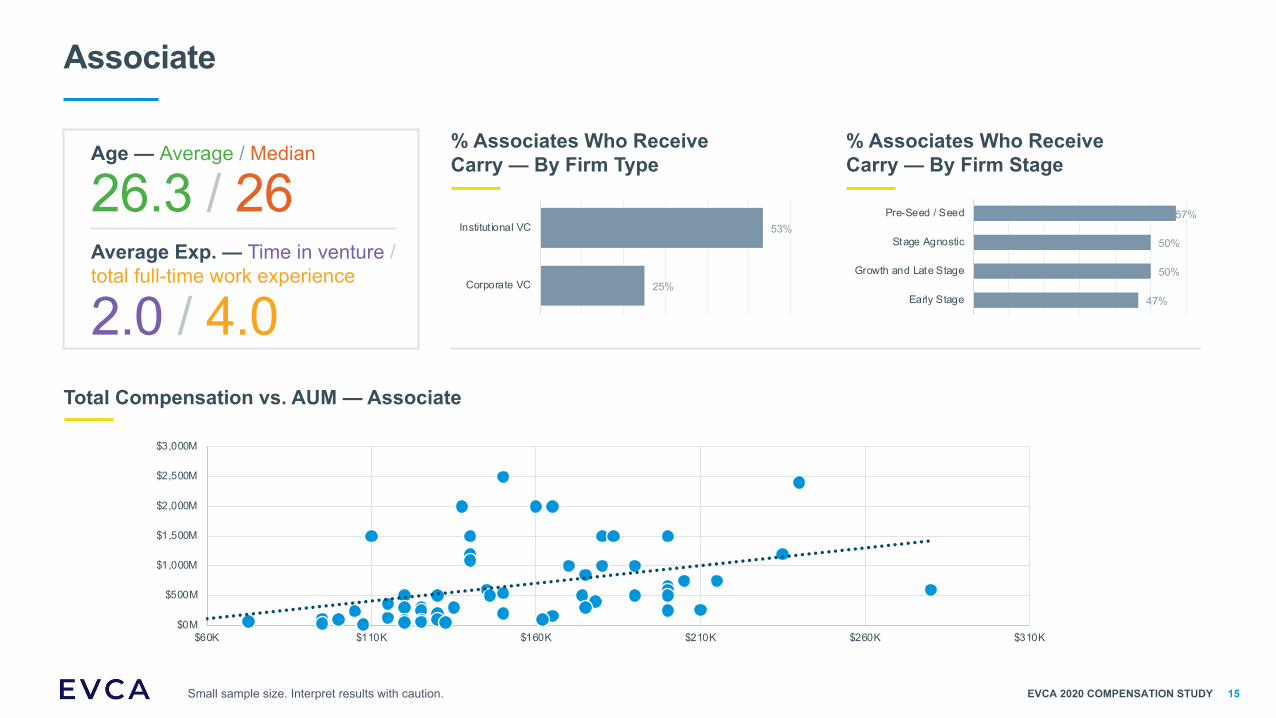
% Associates Who Receive Carry — By Firm Type
% Associates Who Receive Carry — By Firm Stage
Total Compensation vs. AUM — Associate
25%
53%
Corporate VC
Institut ional VC
47%
50%
50%
57%
Early Stage
Growth and Late Stage
Stage Agnostic
Pre-Seed / Seed
$0M
$500M
$1,000M
$1,500M
$2,000M
$2,500M
$3,000M
$60K $110K $160K $210K $260K $310K
EVCA 2020 COMPENSATION STUDY
Associate
15Small sample size. Interpret results with caution.
Age — Average / Median
26.3 / 26Average Exp. — Time in venture / total full-time work experience
2.0 / 4.0
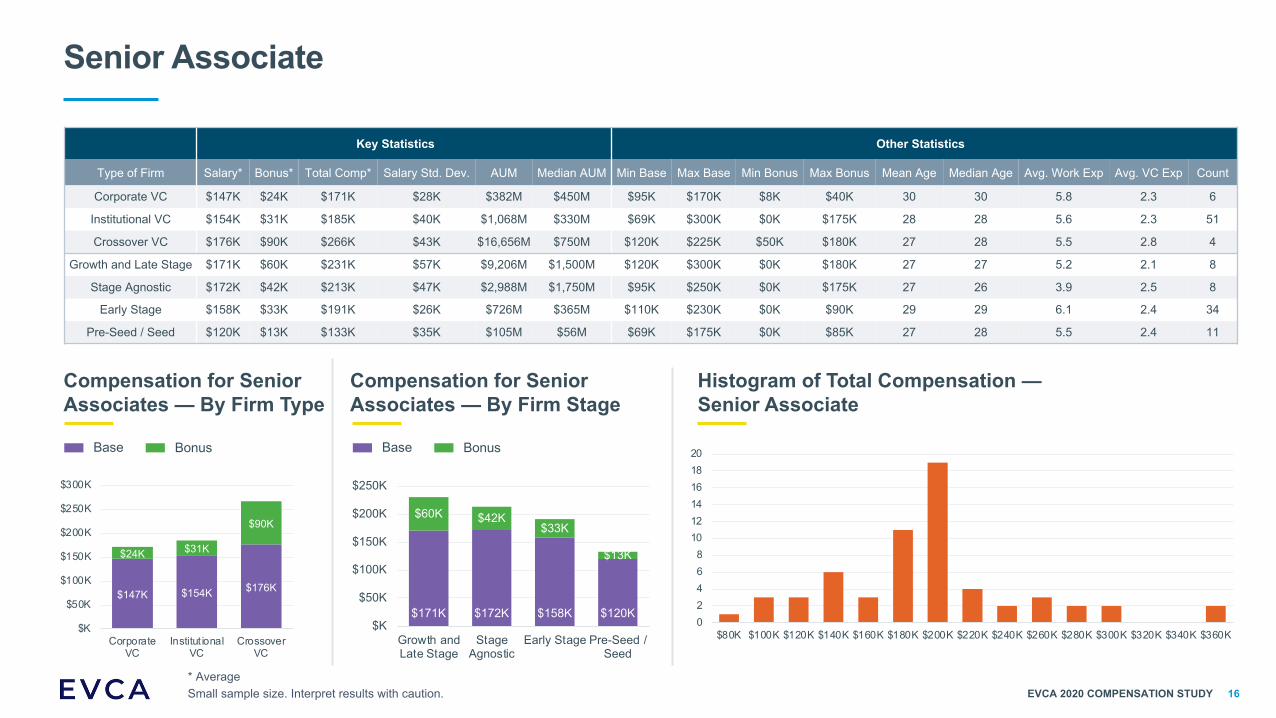
Senior Associate
Key Statistics Other Statistics
Type of Firm Salary* Bonus* Total Comp* Salary Std. Dev. AUM Median AUM Min Base Max Base Min Bonus Max Bonus Mean Age Median Age Avg. Work Exp Avg. VC Exp Count
Corporate VC $147K $24K $171K $28K $382M $450M $95K $170K $8K $40K 30 30 5.8 2.3 6
Institutional VC $154K $31K $185K $40K $1,068M $330M $69K $300K $0K $175K 28 28 5.6 2.3 51
Crossover VC $176K $90K $266K $43K $16,656M $750M $120K $225K $50K $180K 27 28 5.5 2.8 4
Growth and Late Stage $171K $60K $231K $57K $9,206M $1,500M $120K $300K $0K $180K 27 27 5.2 2.1 8
Stage Agnostic $172K $42K $213K $47K $2,988M $1,750M $95K $250K $0K $175K 27 26 3.9 2.5 8
Early Stage $158K $33K $191K $26K $726M $365M $110K $230K $0K $90K 29 29 6.1 2.4 34
Pre-Seed / Seed $120K $13K $133K $35K $105M $56M $69K $175K $0K $85K 27 28 5.5 2.4 11
Histogram of Total Compensation —Senior Associate
Compensation for Senior Associates — By Firm Stage
Compensation for Senior Associates — By Firm Type
$147K $154K $176K
$24K $31K
$90K
$K
$50K
$100K
$150K
$200K
$250K
$300K
CorporateVC
Institut ionalVC
CrossoverVC
$171K $172K $158K $120K
$60K $42K$33K
$13K
$K
$50K
$100K
$150K
$200K
$250K
Growth andLate Stage
StageAgnostic
Early Stage Pre-Seed /Seed
02468
101214161820
$80K $100K $120K $140K $160K $180K $200K $220K $240K $260K $280K $300K $320K $340K $360K
BonusBase BonusBase
EVCA 2020 COMPENSATION STUDY 16Small sample size. Interpret results with caution.* Average
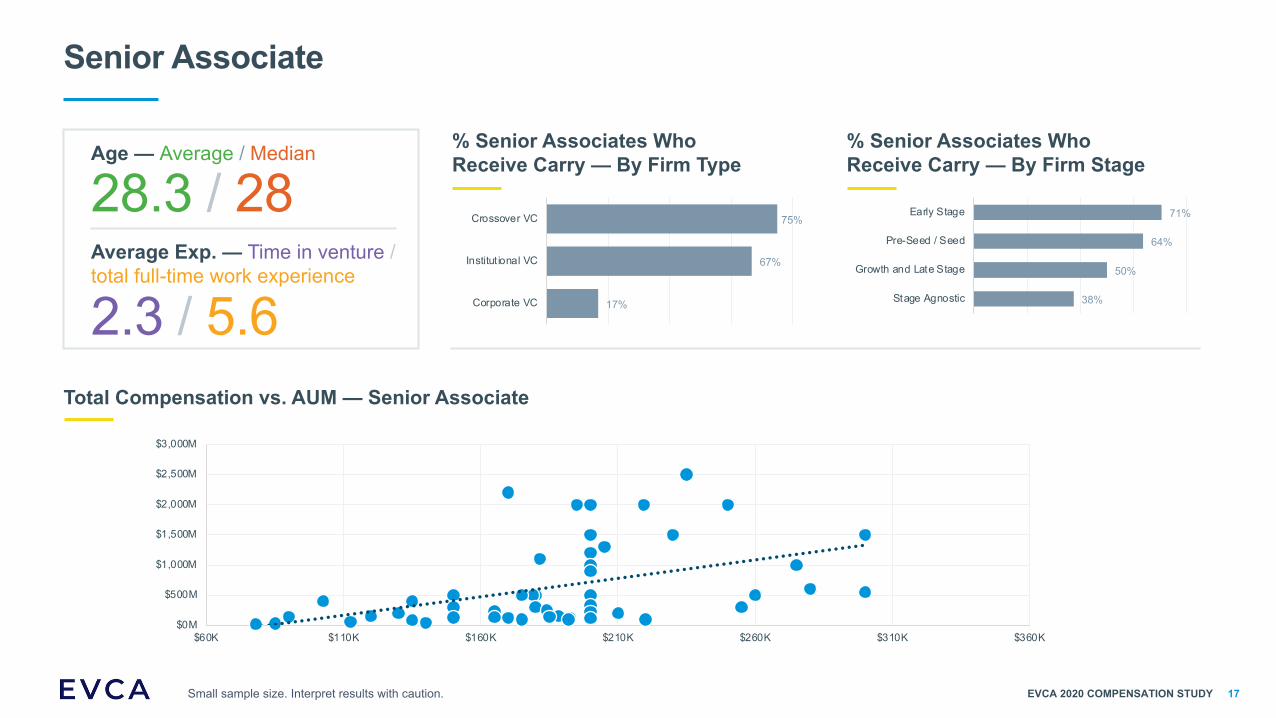
% Senior Associates Who Receive Carry — By Firm Type
% Senior Associates Who Receive Carry — By Firm Stage
Total Compensation vs. AUM — Senior Associate
EVCA 2020 COMPENSATION STUDY
Senior Associate
17%
67%
75%
Corporate VC
Institut ional VC
Crossover VC
38%
50%
64%
71%
Stage Agnostic
Growth and Late Stage
Pre-Seed / Seed
Early Stage
$0M
$500M
$1,000M
$1,500M
$2,000M
$2,500M
$3,000M
$60K $110K $160K $210K $260K $310K $360K
17Small sample size. Interpret results with caution.
Age — Average / Median
28.3 / 28Average Exp. — Time in venture / total full-time work experience
2.3 / 5.6
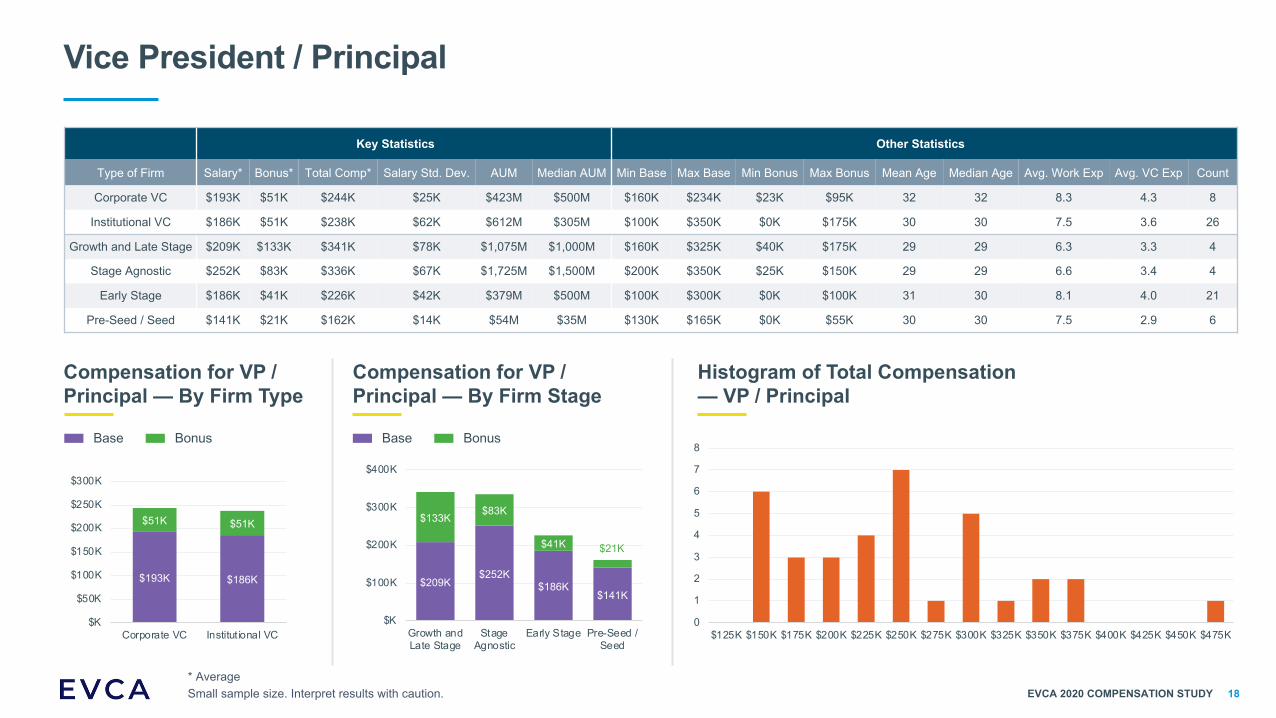
Vice President / Principal
Compensation for VP / Principal — By Firm Type
Compensation for VP / Principal — By Firm Stage
Histogram of Total Compensation — VP / Principal
Key Statistics Other Statistics
Type of Firm Salary* Bonus* Total Comp* Salary Std. Dev. AUM Median AUM Min Base Max Base Min Bonus Max Bonus Mean Age Median Age Avg. Work Exp Avg. VC Exp Count
Corporate VC $193K $51K $244K $25K $423M $500M $160K $234K $23K $95K 32 32 8.3 4.3 8
Institutional VC $186K $51K $238K $62K $612M $305M $100K $350K $0K $175K 30 30 7.5 3.6 26
Growth and Late Stage $209K $133K $341K $78K $1,075M $1,000M $160K $325K $40K $175K 29 29 6.3 3.3 4
Stage Agnostic $252K $83K $336K $67K $1,725M $1,500M $200K $350K $25K $150K 29 29 6.6 3.4 4
Early Stage $186K $41K $226K $42K $379M $500M $100K $300K $0K $100K 31 30 8.1 4.0 21
Pre-Seed / Seed $141K $21K $162K $14K $54M $35M $130K $165K $0K $55K 30 30 7.5 2.9 6
BonusBase BonusBase
EVCA 2020 COMPENSATION STUDY
$193K $186K
$51K $51K
$K
$50K
$100K
$150K
$200K
$250K
$300K
Corporate VC Institut ional VC
$209K$252K
$186K$141K
$133K$83K
$41K $21K
$K
$100K
$200K
$300K
$400K
Growth andLate Stage
StageAgnostic
Early Stage Pre-Seed /Seed
0
1
2
3
4
5
6
7
8
$125K $150K $175K $200K $225K $250K $275K $300K $325K $350K $375K $400K $425K $450K $475K
18Small sample size. Interpret results with caution.* Average
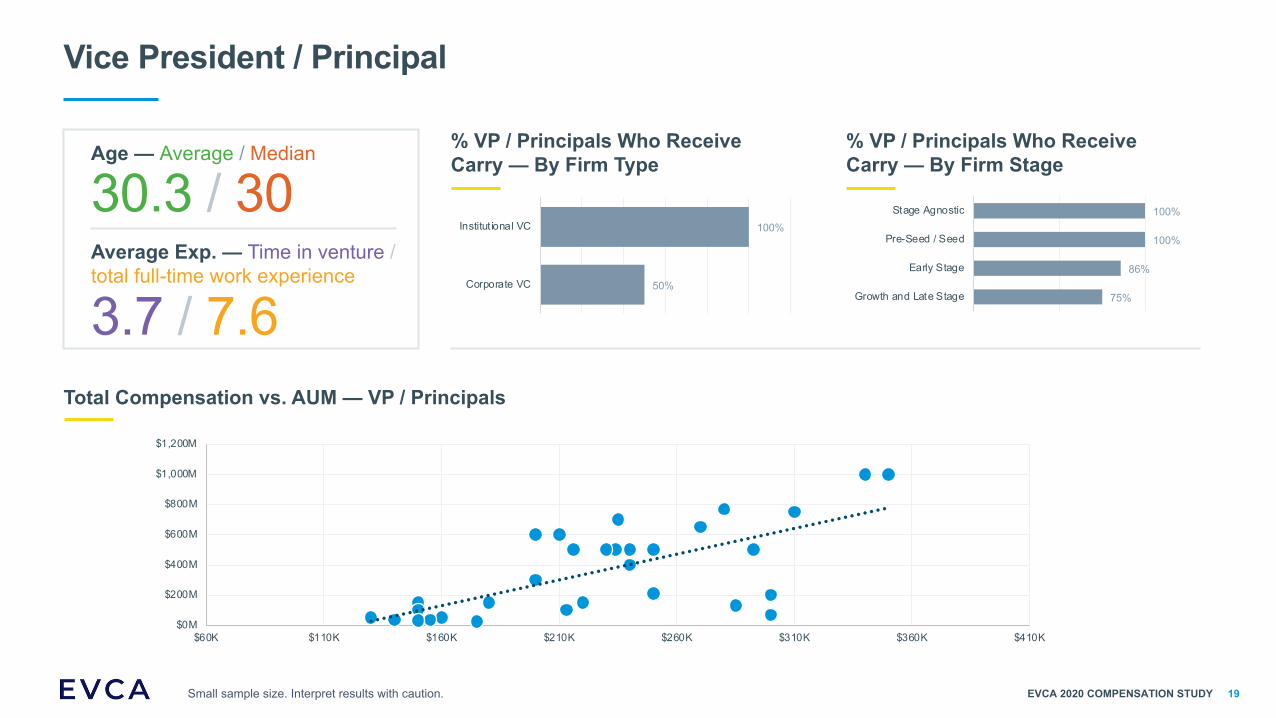
% VP / Principals Who Receive Carry — By Firm Type
% VP / Principals Who Receive Carry — By Firm Stage
Total Compensation vs. AUM — VP / Principals
EVCA 2020 COMPENSATION STUDY
Vice President / Principal
50%
100%
Corporate VC
Institut ional VC
75%
86%
100%
100%
Growth and Late Stage
Early Stage
Pre-Seed / Seed
Stage Agnostic
$0M
$200M
$400M
$600M
$800M
$1,000M
$1,200M
$60K $110K $160K $210K $260K $310K $360K $410K
19Small sample size. Interpret results with caution.
Age — Average / Median
30.3 / 30Average Exp. — Time in venture / total full-time work experience
3.7 / 7.6
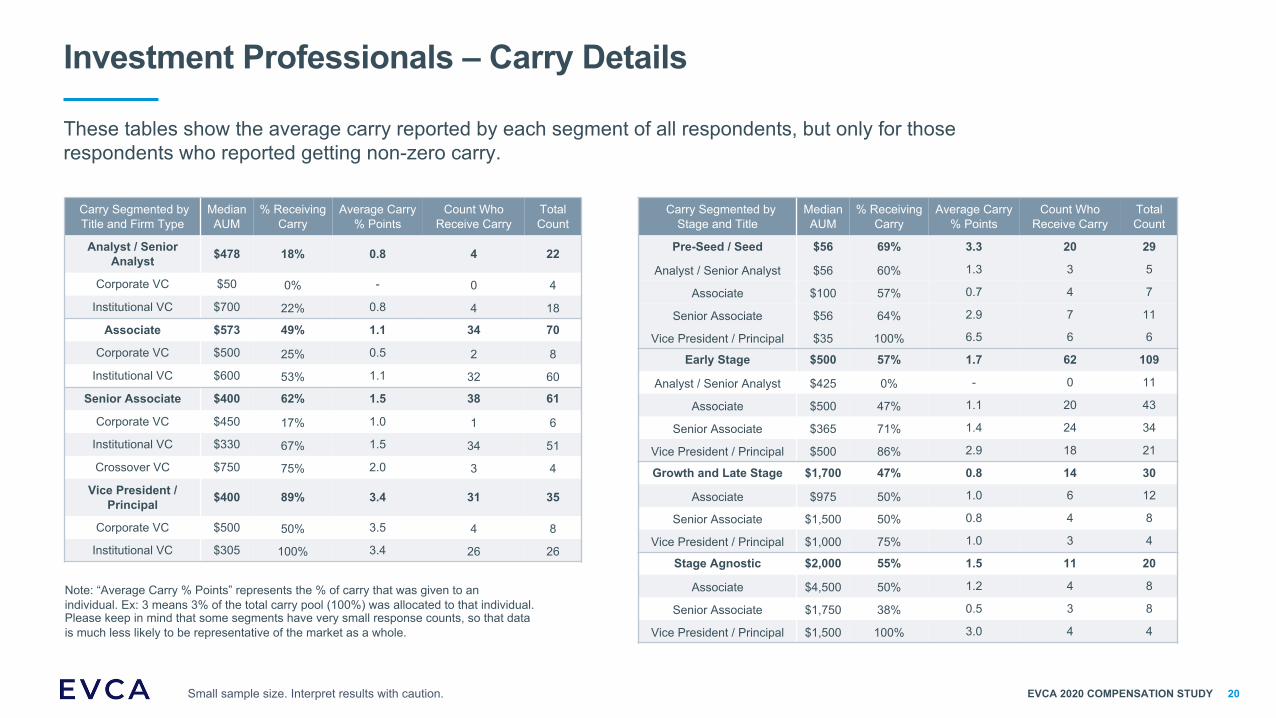
Investment Professionals – Carry Details
Carry Segmented by Title and Firm Type
Median AUM
% Receiving Carry
Average Carry % Points
Count Who Receive Carry
Total Count
Analyst / Senior Analyst $478 18% 0.8 4 22
Corporate VC $50 0% - 0 4
Institutional VC $700 22% 0.8 4 18
Associate $573 49% 1.1 34 70
Corporate VC $500 25% 0.5 2 8
Institutional VC $600 53% 1.1 32 60
Senior Associate $400 62% 1.5 38 61
Corporate VC $450 17% 1.0 1 6
Institutional VC $330 67% 1.5 34 51
Crossover VC $750 75% 2.0 3 4
Vice President / Principal $400 89% 3.4 31 35
Corporate VC $500 50% 3.5 4 8
Institutional VC $305 100% 3.4 26 26
EVCA 2020 COMPENSATION STUDY
These tables show the average carry reported by each segment of all respondents, but only for those respondents who reported getting non-zero carry.
Carry Segmented by Stage and Title
Median AUM
% Receiving Carry
Average Carry % Points
Count Who Receive Carry
Total Count
Pre-Seed / Seed $56 69% 3.3 20 29
Analyst / Senior Analyst $56 60% 1.3 3 5
Associate $100 57% 0.7 4 7
Senior Associate $56 64% 2.9 7 11
Vice President / Principal $35 100% 6.5 6 6
Early Stage $500 57% 1.7 62 109
Analyst / Senior Analyst $425 0% - 0 11
Associate $500 47% 1.1 20 43
Senior Associate $365 71% 1.4 24 34
Vice President / Principal $500 86% 2.9 18 21
Growth and Late Stage $1,700 47% 0.8 14 30
Associate $975 50% 1.0 6 12
Senior Associate $1,500 50% 0.8 4 8
Vice President / Principal $1,000 75% 1.0 3 4
Stage Agnostic $2,000 55% 1.5 11 20
Associate $4,500 50% 1.2 4 8
Senior Associate $1,750 38% 0.5 3 8
Vice President / Principal $1,500 100% 3.0 4 4
Note: “Average Carry % Points” represents the % of carry that was given to an individual. Ex: 3 means 3% of the total carry pool (100%) was allocated to that individual.Please keep in mind that some segments have very small response counts, so that data is much less likely to be representative of the market as a whole.
20Small sample size. Interpret results with caution.

Survey Demographics
EVCA 2020 COMPENSATION STUDY 21
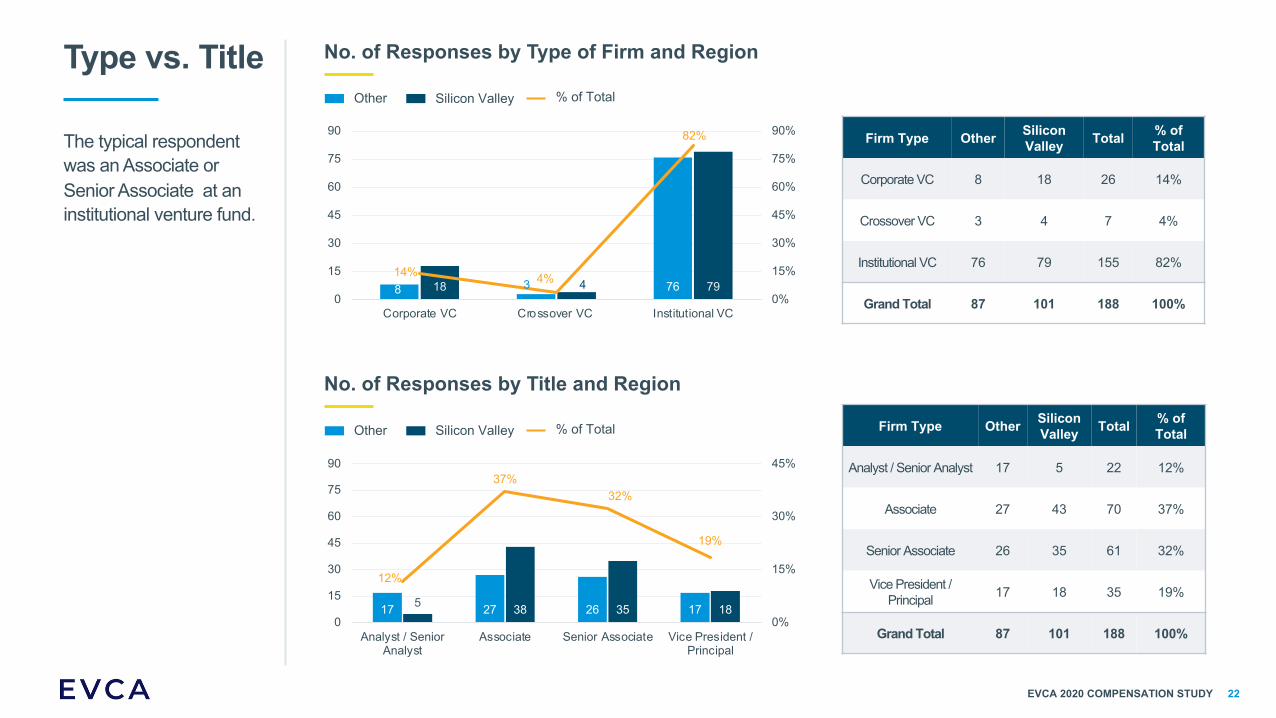
Type vs. Title
The typical respondent was an Associate or Senior Associate at an institutional venture fund.
No. of Responses by Type of Firm and Region
8 3 7618 4 7914% 4%
82%
0%
15%
30%
45%
60%
75%
90%
0
15
30
45
60
75
90
Corporate VC Crossover VC Institutional VC
Silicon Valley % of TotalOther
No. of Responses by Title and Region
Silicon Valley % of TotalOther
17 27 26 175 38 35 18
12%
37%32%
19%
0%
15%
30%
45%
0
15
30
45
60
75
90
Analyst / SeniorAnalyst
Associate Senior Associate Vice President /Principal
Firm Type Other Silicon Valley Total % of
Total
Corporate VC 8 18 26 14%
Crossover VC 3 4 7 4%
Institutional VC 76 79 155 82%
Grand Total 87 101 188 100%
Firm Type Other Silicon Valley Total % of
Total
Analyst / Senior Analyst 17 5 22 12%
Associate 27 43 70 37%
Senior Associate 26 35 61 32%
Vice President / Principal 17 18 35 19%
Grand Total 87 101 188 100%
EVCA 2020 COMPENSATION STUDY 22

Regional Breakdown
No. of Responses by Region
Region Total % of Total
Silicon Valley 101 54%
New York 48 26%
Boston 10 5%
Los Angeles 9 5%
Austin 8 4%
Chicago 4 2%
Canada 3 2%
Other 5 3%
Grand Total 188 100%
Breakdown of Responses by Region
Silicon Valley101
New York48
Boston10
Los Angeles9
Austin8
Chicago4
Canada3
Other5
EVCA 2020 COMPENSATION STUDY 23
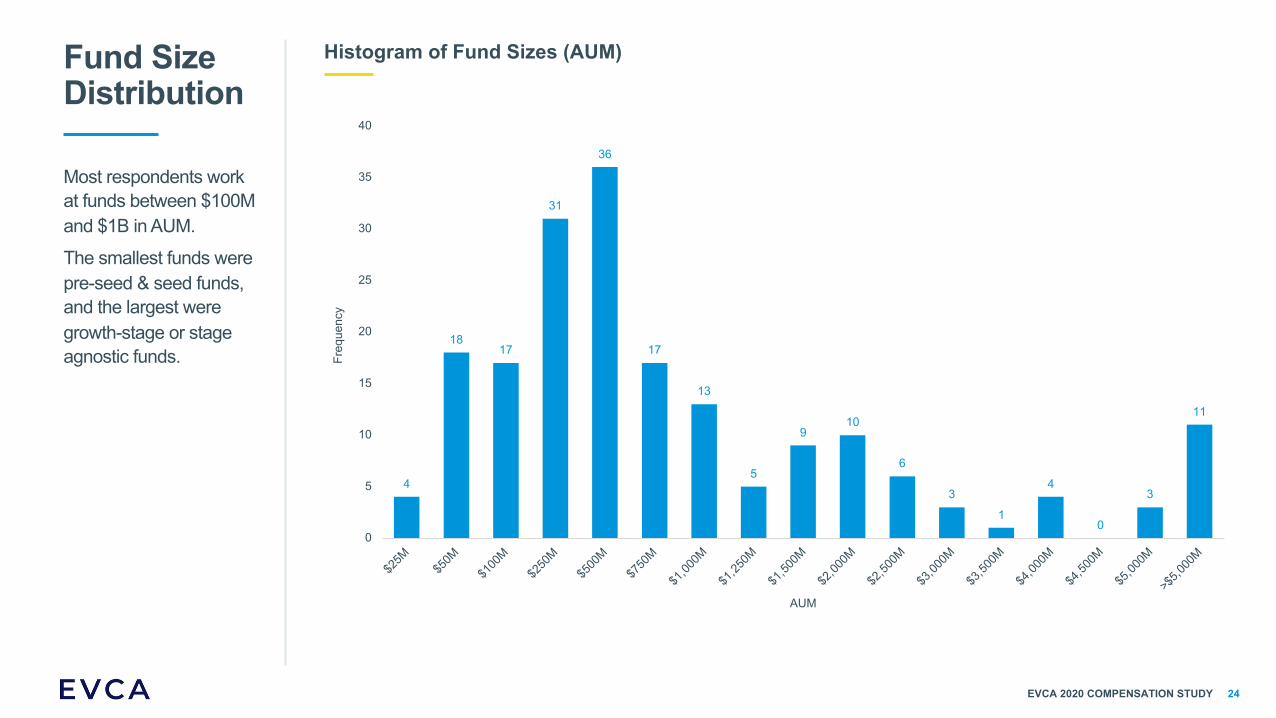
Fund SizeDistribution
Most respondents work at funds between $100M and $1B in AUM.
The smallest funds were pre-seed & seed funds, and the largest were growth-stage or stage agnostic funds.
Histogram of Fund Sizes (AUM)
4
1817
31
36
17
13
5
910
6
3
1
4
0
3
11
0
5
10
15
20
25
30
35
40
$25M
$50M
$100
M$2
50M
$500
M$7
50M
$1,00
0M
$1,25
0M
$1,50
0M
$2,00
0M
$2,50
0M
$3,00
0M
$3,50
0M
$4,00
0M
$4,50
0M
$5,00
0M
>$5,0
00M
Freq
uenc
y
AUM
EVCA 2020 COMPENSATION STUDY 24

4
7
17
26
24
27
21
18
16
98
7
10
10 0
2
00
5
10
15
20
25
30
22 23 24 25 26 27 28 29 30 31 32 33 34 35 36 37 38 39 40
Note: Majority of the respondents were under the age of 30 (min = 22, max = 39)
Investment Professionals — Age Distribution
Histogram of Age Distribution
EVCA 2020 COMPENSATION STUDY 25

Note: There are slight positive correlations between both Total Compensation vs. Age and Total Compensation vs. AUM
Total Compensation vs. AUM & Age
Total Compensation vs. Age —All Investment Professionals
Total Compensation vs. AUM —All Investment Professionals
20
22
24
26
28
30
32
34
36
38
40
$K $100K $200K $300K $400K $500K$0M
$500M
$1,000M
$1,500M
$2,000M
$2,500M
$3,000M
$3,500M
$4,000M
$4,500M
$60K $110K $160K $210K $260K $310K $360K $410K $460K $510K
Correlation = +0.31 Correlation = +0.24
EVCA 2020 COMPENSATION STUDY 26