Embed Size (px)
Citation preview
Pre-industrial and contemporary fluxes of nitrogenthrough rivers: a global assessment basedon typology
PAMELA A. GREEN1,*, CHARLES J. VOROSMARTY1,2,
MICHEL MEYBECK3, JAMES N. GALLOWAY4, BRUCE J.
PETERSON5 and ELIZABETH W. BOYER6
1Water Systems Analysis Group, Institute for the Study of Earth, Oceans, and Space, University of New
Hampshire, Durham, New Hampshire, USA; 2Department of Earth Sciences, University of New
Hampshire, Durham, New Hampshire, USA; 3UMR Sisyphe, Universite de Paris VI, Paris, France;4Department of Environmental Sciences, University of Virginia, Charlottesville, VA, USA; 5Ecosystems
Center, Marine Biological Laboratory, Woods Hole, MA, USA; 6State University of New York, College of
Environmental Science and Forestry, Syracuse, NY, USA; *Author for correspondence (e-mail:
[email protected]; phone: þ1-44-603-862-4208; fax: þ1-44-603-862-0587)
Received 24 March 2003; accepted in revised form 11 August 2003
Key words: Anthropogenic loading, Global, Nitrogen, Nitrogen budget, Nitrogen yields, Rivers,
Watershed
Abstract. This paper provides a global synthesis of reactive nitrogen (Nr) loading to the continental
landmass and subsequent riverine nitrogen fluxes under a gradient of anthropogenic disturbance, from
pre-industrial to contemporary. A mass balance model of nitrogen loading to the landmass is employed to
account for transfers of Nr between atmospheric input sources (as food and feed products) and sub-
sequent consumer output loads. This calculation produces a gridded surface of nitrogen loading ulti-
mately mobilizable to aquatic systems (Nmob). Compared to the pre-industrial condition, nitrogen
loading to the landmass has doubled from 111 to 223 Tg/year due to anthropogenic activities. This is
particularly evident in the industrialized areas of the globe where contemporary levels of nitrogen
loading have increased up to 6-fold in many areas. The quantity of nitrogen loaded to the landscape has
shifted from a chiefly fixation-based system (89% of total loads) in the pre-industrial state to a het-
erogeneous mix in contemporary times where fertilizer (15%), livestock (24%) and atmospheric de-
position (15%) dominate in many parts of the industrialized and developing world. A nitrogen transport
model is developed from a global database of drainage basin characteristics and a comprehensive
compendium of river chemistry observations. The model utilizes constituent delivery coefficients based
on basin temperature and hydraulic residence times in soils, rivers, lakes and reservoirs to transport
nitrogen loads to river mouths. Fluxes are estimated for total nitrogen, dissolved inorganic nitrogen, and
total organic nitrogen. Model results show that total nitrogen fluxes from river basins have doubled from
21 Tg/year in the pre-industrial to 40 Tg/year in the contemporary period, with many industrialized areas
of the globe showing an increase up to 5-fold. DIN fluxes from river basins have increased 6-fold from
2.4 Tg/year in the pre-industrial to 14.5 Tg/year in the contemporary period. The amount of nitrogen
loading delivered to river mouth as flux is greatly influenced by both basin temperatures and hydraulic
residence times suggesting a regional sensitivity to loading. The global, aggregate nitrogen retention on
the continental land mass is 82%, with a range of 0–100% for individual basins. We also present the first
seasonal estimates of riverine nitrogen fluxes at the global scale based on monthly discharge as the
primary driver.
# 2004 Kluwer Academic Publishers. Printed in the Netherlands.
Biogeochemistry 71–105, 2004.68:

Introduction
A wide array of human activities is accelerating the natural fluxes of reactive
nitrogen (Nr) through river basins and over the continuum of aquatic transport
routes into the coastal zone where land-based activities generating point and non-
point sources in upstream watersheds have been implicated (Jordan et al. 1997;
Russell et al. 1998; Pionke et al. 1999; Hession et al. 2000; Goolsby and Battaglin
2001). The evidence of nitrogen pollution is ubiquitous and can be seen in in-
dividual small watersheds (Hopkinson and Vallino 1995), regional to continental
drainage systems (Howarth et al. 1996; Jordan et al. 1997; Russell et al. 1998;
Pionke et al. 1999; Hession et al. 2000; Goolsby and Battaglin 2001), and now even
global-scales (Seitzinger et al. 2002a; Galloway et al. 2003). Associated with these
elevated Nr fluxes are enhanced coastal eutrophication and anoxia (Turner and
Rabelais 1994), changes in nutrient stoichiometry (Mackenzie et al. 1993; Ver et al.
1999) that possibly favor toxic phytoplankton (Justic et al. 1995), and increases in
the production of greenhouse gases (Kroeze and Seitzinger 1999). Human induced
changes to the nitrogen cycle therefore have far-field impacts with respect to
pollution and public health, protein supply for humans, and planetary heat balance.
At the same time, land-to-ocean fluxes in earth system models have remained
poorly articulated and we are only now beginning to develop the synthetic per-
spective necessary to address the complex outcomes of the acceleration of Nr
loading (Hobbie 2000; Vorosmarty and Peterson 2000). There is a major need for
data sets and models to understand the primary factors regulating mobilization,
processing, and transport of constituents through the full continuum of airshed–
land–inland aquatic systems from source area to ocean (Billen and Garnier 1999;
Alexander et al. 2000).
This paper is a contribution to emerging work that simulates the distribution of
fluxes of geochemical constituents across river basins to receiving waters (e.g.,
Ludwig and Probst 1996, 1998; Vorosmarty et al. 1997a,c, 2003; Seitzinger et al.
2002a; Galloway et al. 2003) in a consistent and geographically-specific manner.
Such studies have combined a number of geospatial, global, biogeophysical data
sets with relatively simple models to predict a spatially varying flux of material
delivered from the land to the coastal zones of the world. Many of these studies
have estimated total nitrogen loading within a river basin as the sum of the at-
mospheric inputs (deposition, fixation, industrial fertilizer) as well as land based
consumer loads (human and livestock emissions), but without accounting for in-
termediate transfers of Nr between atmospheric input sources, essentially as food
and feed products, and subsequent consumer output loads (Caraco and Cole 1999;
Seitzinger et al. 2002a). This approach results in a double counting of Nr loading
available for transport to river outlets. In those cases where an accounting of mass
balance has been applied (Howarth 1998; Boyer et al. 2002; Howarth et al. 2002),
adjustments where made for net import or export of Nr in food and feed on a
watershed basis but were not articulated as a spatially distributed surface of ni-
trogen loading. A few recent studies have begun to include an accounting of mass
balance of Nr inputs to the landscape at the global scale including all major at-
72
mospheric inputs (fixation, deposition, industrial fertilizer), denitrification, am-
monia volatilization, losses due to biomass burning and natural soils emissions, and
transfers through food and feed import/export (Van Drecht et al. 2001; Galloway et
al. 2003). The current analysis presents a consistent and mass balanced metho-
dology to estimate Nr loading to the landmass and aquatic systems in a spatially
distributed and detailed manner. The method accounts for the major losses, trans-
fers and storages of Nr for the discharging landmass of the globe. Comprehensive
work including detailed components of the nitrogen cycle has also been carried out
at the individual basin and smaller regional domains (Jordan et al. 1997); however,
these analyses were not designed to be scalable to the global domain and are of
limited use outside of the regions to which they were originally applied. The
analysis presented in our paper provides a methodology for estimating nitrogen
loads and fluxes at the global scale that can be directly used in global change
studies.
The overall objective of this study is to provide a global synthesis of our current
understanding of Nr loading to the continental landmass and subsequent riverine Nr
fluxes under a gradient of anthropogenic disturbance, from pristine to highly in-
dustrialized. We consider separately atmospheric Nr deposition, industrial fertili-
zation, and fixation and their subsequent redistribution across the continental
landmass. This redistribution results from the interception of atmospheric Nr inputs
by (a) the growth, harvesting and transport of crops for human consumption, (b) the
growth, harvesting and transport of feed and forage for livestock, (c) the production
and transport of animal products, and the losses of Nr through (i) ammonia vola-
tilization from fertilizer, (ii) emission from livestock, (iii) removal by sewage
treatment systems, and (iv) natural emissions from soils and biomass burning. We
have assumed for this work that potential exports are equal to atmospheric inputs
across natural ecosystems and managed forests though we recognize that this needs
further elaboration (Jaworski et al. 1997). Losses due to denitrification and se-
questration in soils and plants are estimated by difference using a basin-scale
constituent transport model. Our goal is to develop a global database of Nr loading
to the landmass that preserves mass balance while at the same time allowing us to
map with a high degree of spatial specificity reflecting the distributed nature of
these loadings.
A constituent transport model is developed using a newly assembled global data
base of drainage basin characteristics together with a comprehensive compendium
of river chemistry observations analyzed in the context of a river basin typology
scheme which permits us to extrapolate nitrogen river flux estimates from a set of
well-monitored rivers to unmonitored rivers. Our method presented here includes
coefficients for transport of nitrogen through river networks, lakes, reservoirs and
soils at the global scale based on basin temperature and water residence time
providing a comparison of the differentiated transport mechanisms within river
basins. Some previous studies have included analysis of nitrogen retention along
flow paths but these have been for individual basins or regions (Alexander et al.
2000; Seitzinger et al. 2002b). We provide flux estimates for the entire discharging
portion of the continental landmass at 300 spatial resolution (longitude� latitude)
73

for Nr partitioned into dissolved inorganic nitrogen (DIN), total organic nitrogen
(TON), and total nitrogen (TN). We also provide estimates of global, continental,
regional, and coastline-specific estimates of Nr loadings onto the continental
landmass, the efficiency of transformation of land-based loadings into riverine flux
for different parts of the world, the riverine nitrogen fluxes themselves, and an
estimate of the errors associated with these fluxes. Finally, we produce the first
global, time-varying inputs of TN to the world’s coastal zone, simulating a seasonal
climatology that is of potential value in improving our understanding of coastal
ecosystem dynamics. Nitrogen river fluxes are developed for the pre-industrial and
contemporary (mid-1990) conditions.
Methods
Overall strategy
A global database of nitrogen loading to the landmass is developed which pre-
serves mass balance against all known, major inputs while at the same time
mapping the distributed nature of the nitrogen inputs with a high degree of spatial
specificity. Derivation of the distinct sources of mobilizable nitrogen loads and
their redistribution across the landmass are described in ‘Nitrogen loading to the
landmass’. The mobilizable loads of nitrogen to the landmass in conjunction with
key river basin characteristics are used as inputs to a Constituent Transport Model
(CTM) to develop estimates of TN, DIN and TON fluxes at river mouths for the
globe. The CTM described in ‘Estimation of nitrogen fluxes at basin mouth’ is
based on statistical relationships linking biophysical characteristics of drainage
basins to observed constituent fluxes providing global, continental, regional and
coastline-specific estimates of organic and inorganic mouth-of-basin fluxes in
both pre-industrial and contemporary conditions. The statistical relations attempt
to incorporate both hydrologic and metabolic controls on the nitrogen riverine
fluxes.
Nitrogen loading to the landmass
The mass balance model of Nr loading depicted in Figure 1 introduces the concept
of atmospherically derived sources of Nr that are spatially distributed across the
landmass including water bodies and ultimately mobilizable to aquatic systems
(Nmob). In the contemporary state the mass balance model accounts for the at-
mospheric inputs of Nr in the form of deposition, industrial fertilizer application
and fixation and their subsequent lateral redistribution across the landmass as a
function of the growth, harvesting and transport of feed and forage for livestock
production and of crops and livestock for human consumption. This redistributed
atmospheric Nr is reintroduced to the landmass at the receiving point in the form of
animal and human waste products. At any point on the landmass, Nmob is de-
74

termined by the addition of Nr atmospheric sources, but decremented by the lateral
redistribution of Nr that takes the form of subsequent human and animal waste
loading in the contemporary state. For the pre-industrial state (conditions prior to
1800 c.e.) we consider all atmospheric sources of Nmob to be loaded and trans-
formed to animal and human wastes locally within each grid cell, assuming long
distance lateral transports of food and feed products for this period are negligible.
Therefore, we regard the atmospheric loads of nitrogen in the form of fixation and
deposition within in each grid cell to serve as the net Nmob loading to the land
mass for the pre-industrial state. We have assumed for this work that potential
exports are equal to Nr atmospheric inputs at the grid cell scale across natural
ecosystems and managed forests for both the pre-industrial and contemporary
states. Sequestration and losses due to denitrification will therefore be articulated
by difference from the basin-scale semi-empirical CTM of Nmob flux described in
‘Estimation of nitrogen fluxes at basin mouth’. Both pre-industrial and con-
temporary loads of nitrogen to the landmass are considered and described in the
following section.
Figure 1. Overall computation scheme showing the major sources of reactive nitrogen (Nr) loaded onto
the continental landmass locally that are then redistributed spatially through food and feed trade. A mass-
conserving approach is applied with initial loadings tracked and reconstituted as mobilizable loads
(Nmob) to inland aquatic systems. Mobilizable loads are diminished relative to the original Nr due to
denitrification losses on land and in aquatic systems and potential sequestration. These inferences on loss
are derived from non-linear statistical models of TN and DIN that simulate a sequential efficiency of
transport based on hydraulic residence time and temperature.
75

Spatially distributed data sets
Table 1 lists the sources of the spatially distributed, nitrogen load estimates used in
this analysis. All fields for Nr loading and Nmob were derived from original source
resolutions (1 km to 18 grids and country level statistics), and then redistributed
based on a rule-based system described in the following sections to individual 1 km
calculation units. They were then resampled onto a 1 km grid resolution for pro-
cessing, with the final products resampled to 300 (longitude� latitude) spatial scale.
Following is a detailed description of the derivation of these data sets.
Pre-industrial data sets
Atmospheric nitrogen deposition
Atmospheric inputs for pre-industrial nitrogen deposition were based on modeled
estimates of total (wetþ dry) inorganic (NOy plus NHx) deposition based on a
global atmospheric transport model described in Dentener and Crutzen (1994).
Original data sets at 18 resolution were resampled to 1 km and 300 resolution using
bilinear interpolation to maintain consistency with other data sets.
Nitrogen fixation
The pre-industrial Nr fixation field was developed from potential rates defined for
undisturbed vegetation classes (Cleveland et al. 1999; A. Townsend, personal
communication). These rates were applied to a 300 resolution gridded data set of
undisturbed vegetation (Mellilo et al. 1993) to create the distributed pre-industrial
Nr fixation data layer.
Contemporary data sets
Atmospheric nitrogen deposition
Atmospheric inputs for contemporary nitrogen deposition were based on modeled
estimates of total (wetþ dry) inorganic (NOy plus NHx) deposition estimates from
Dentener and Crutzen (1994). Original data sets at 18 resolution were resampled to
1 km and 300 resolution using bilinear interpolation to maintain consistency with
other data sets.
Nitrogen fixation
The contemporary Nr fixation field includes natural rates for undisturbed systems
derived from the pre-industrial Nr fixation layer overlaid by rates for crop, culti-
vated grasslands and urban areas (Smil 1999 and our own assessment). The crop
fixation geospatial field was based on country-level estimates of crop area (FAO
2001) and fixation rates for the predominant Nr fixing crops (seed legumes, open
fields, rice, and sugar cane) (Smil 1999). These rates were evenly applied across a
1 km data set of contemporary cropland (EDC 2000) within each country. Since
76

Tab
le1
.S
pat
iall
yd
istr
ibu
ted
,b
iop
hy
sica
ld
ata
sets
use
din
this
anal
ysi
s.A
llfi
eld
sw
ere
resa
mple
dto
300
(lo
ng
itu
de�
lati
tud
e)sp
atia
lsc
ale.
Bio
physi
cal
par
amet
erO
rigin
alsp
atia
lre
solu
tion
Sourc
e/ar
chiv
e
Nit
rog
enlo
adin
g(c
onv
erte
din
toN
equ
ival
ents
)fr
om
:
Nd
epo
siti
on
(NO
yan
dN
Hx)
58
Den
ten
eret
al.
(19
94)1
Nfi
xat
ion
Pre
-ind
ust
rial
300
Cle
vel
and
etal
.(1
99
9);
A.
Tow
nse
nd
(per
son
alco
mm
.)1,2
;
Mel
illo
etal
.(1
99
3)3
Conte
mpora
ry1
km
,co
untr
yst
atis
tics
,300
ED
C(2
00
0);
FA
O(2
00
1)4
;N
atu
ral
fix
atio
nfr
om
pre
-in
du
stri
al
Fer
tili
zer
use
/input
1km
,co
untr
yst
atis
tics
ED
C(2
000);
FA
O(2
001)4
;
Liv
esto
ck18,
countr
yst
atis
tics
Ler
ner
etal
.(1
989);
FA
O(2
001)5
Hum
anpopula
tion
1km
,co
untr
yst
atis
tics
Voro
smar
tyet
al.
(20
00
);FA
O(2
00
1);
WR
I(1
99
8);
UN
(19
98);
OE
CD
(19
99)6
Su
rfac
eh
yd
rolo
gy
attr
ibu
tes
Riv
ernet
work
san
dw
ater
shed
boundar
ies
(ST
N30
v5.1
2)
300
Voro
smar
tyet
al.
(20
00
)
Dis
char
ge
and
run
off
(ann
ual
and
mo
nth
ly)
300
Fek
ete
etal
.(1
99
9)7
So
ilm
ois
ture
(ann
ual
and
mo
nth
ly)
300
Fek
ete
etal
.(1
99
9)7
Lak
ed
ensi
tyan
dvo
lum
eV
ecto
r(1
:1M
)E
SR
I(1
99
2)
Res
ervo
irin
du
ced
agin
gB
asin
scal
eV
oro
smar
tyet
al.
(19
97
)8
77

Ta
ble
1.
(co
nti
nued
)
Bio
phy
sica
lp
aram
eter
Ori
gin
alsp
atia
lre
solu
tio
nS
ou
rce/
arch
ive
La
nd
surf
ace
att
ribu
tes
Air
tem
per
atu
re3
00
Wil
lmo
ttan
dM
atsu
ura
(19
99)
Pre
cip
itat
ion
300
Wil
lmo
ttan
dM
atsu
ura
(19
99)
Po
ten
tial
veg
etat
ion
300
Mel
illo
etal
.(1
99
3)3
Con
tem
pora
ryla
nd
cover
1k
mE
DC
(20
00)
1F
or
bo
thp
re-i
nd
ust
rial
and
con
tem
po
rary
con
dit
ions.
2R
ate
of
fixat
ion
giv
enas
funct
ion
of
veg
etat
ion
type.
3F
or
pre
-in
du
stri
alco
nd
itio
n.
4C
om
pute
dfr
om
Nap
pli
cati
on
rate
san
ddis
trib
uti
on
of
cult
ivat
edla
nd
(ED
C2000;
FA
O2001).
5L
ives
tock
load
sb
ased
on
FA
O(2
00
1).
6C
alcu
late
do
nth
eb
asis
of
ap
erca
pit
aN
load
ing
and
rem
oval
by
sew
erag
etr
eatm
ent
(UN
19
98;
WR
I1
99
8;
OE
CD
19
99;
FA
O2
00
1).
Th
islo
adin
gw
asas
soci
ated
wit
hu
rban
and
rura
lp
op
ula
tio
ns
fro
mV
oro
smar
tyet
al.
(20
00).
7C
om
pu
ted
fro
m6
79
dis
char
ge
ob
serv
ing
stat
ion
sover
73
%o
fth
eac
tivel
yd
isch
arg
ing
po
rtio
no
fth
eco
nti
nen
tal
lan
dm
ass.
Rem
ain
ing
frac
tio
no
fla
nd
sim
ula
ted
usi
ng
the
wat
erb
alan
cem
od
elo
fV
oro
smar
tyet
al.
(19
98).
8A
gin
gat
the
bas
insc
ale
calc
ula
ted
asth
en
etst
ora
ge
of
imp
ou
nd
edw
ater
div
ided
by
mea
nan
nu
ald
isch
arg
eat
river
mo
uth
.
78
little information was available on the spatial distribution of leguminous ground
cover on forage and crop lands a global estimate of 12 Tg nitrogen fixation (Smil
1999) was distributed uniformly across a 1 km data set of grazing lands assumed to
contain leguminous crop cover and green manures (EDC 2000). We judge the error
in this assignment to be small given the relatively minor contribution of this ele-
ment to the global flux and the generally good visual correlation between cropland
and animal population distributions. Where crop and/or leguminous ground cover
were present these values were superimposed on the pre-industrial fixation layer.
Any pixels containing predominantly urban areas as defined by a city lights data set
(Elvidge et al. 1997) were assigned a fixation value of 0. Because an estimate of net
fixation is sought here, soil emissions of nitrogen in the form of ammonia (NH3)
were deducted from the fixation estimates for both the natural and contemporary
states (1.9 TgN/year globally) (Bouwman et al. 1997). In addition, nitrogen losses
from biomass burning, where known to occur, were also deducted from the con-
temporary fixation field (3.5 TgN/year globally) (Bouwman et al. 1997). The
contemporary nitrogen fixation data set was resampled to 300.
Industrial nitrogen fertilizer application
We computed net fertilizer inputs for the contemporary state accounting for vola-
tilization losses from field-application and manufacturer losses. Fertilizer loads are
considered for industrial sources only and no estimation was made for animal
manure fertilizers which are included as a part of the livestock waste layer.
Country-level nitrogenous fertilizer consumption totals for 1995 were taken from
the FAOSTAT Statistical Databases (FAO 2001) to represent the contemporary
state. These country-level values were evenly distributed among a 1 km resolution
cropland data set (EDC 2000). Each 1 km cropland pixel within a country received
an equal fraction of the total fertilizer consumption for that country. We recognize
that using a constant fertilizer application rate within a country may introduce
errors, particularly in larger countries such as China, Russia, USA, and Brazil,
where cropland extent and type may greatly vary. Ammonia volatilization losses
from fertilizers can be substantial and were therefore deducted from the fertilizer
Nr loads using the regression equation put forth by Bouwman and Boumans (2002).
The net fertilizer consumption data set was then resampled to 300.
Distribution of human waste loads of nitrogen.
Point source loads of nitrogen directly input to river systems were associated with
sewered urban population alone. Human loads of nitrogen from rural and urban
populations not serviced by sewers were considered as non-point source loads and
applied directly to the land. Human waste loads were calculated using total nitrogen
intake estimates applied to a 1 km spatially distributed global data set of urban and
rural population (Vorosmarty et al. 2000c) and country based sewage rates (WRI
1998). The amount of nitrogen excreted was linked to nitrogen intake in diet
derived from protein per capita estimates based on specific crop and animal product
type by country in the FAOSTAT database (FAO 2001). Nitrogen intake ranged
from 1.7 kg N/person/year in the Democratic Republic of the Congo to 6.9 kg N/
79

person/year in Iceland with a global average of 4.2 kg N/person/year. Countries
lacking dietary protein intake information were assigned an average per capita
intake value from a neighboring country of similar economic and dietary make-up.
Nitrogen sequestration in growing human populations was estimated by the per-
centage of nitrogen intake retained for growth using country population growth
rates between 1990 and 1995 (FAO 2001).
For populations with access to sewage treatment, the percentage of urban po-
pulation connected to sewer systems was obtained from WRI statistics and the
United Nations Human Settlements Programme on populations connected to public
sewage systems (UN 1998; WRI 1998). The level of wastewater treatment for these
sewered populations was derived from the OECD statistics for selected countries
(OECD 1999). Sewage treatment levels for countries not in the OECD database
were extrapolated from data listed for the OECD countries based on a statistical
relationship between treatment level and GDP (WRI 1998). Sewered urban popu-
lations were assumed to have a 60% removal of total nitrogen through wastewater
treatment processes for tertiary treatment (Steel and McGhee 1979; Caraco and
Cole 1999), 25% for secondary treatment, and 10% for primary treatment (Steel
and McGhee 1979). Globally, 58% of the world’s population is connected to sewer
systems with 24% receiving some level of sewage treatment (4% primary, 15%
secondary and 5% tertiary). Rural and non-sewered urban populations were as-
sumed to have no reduction in nitrogen content of excretion. The point source and
non-point source human waste data sets were then resampled to 300.
Distribution of animal intake and excretion of nitrogen.
A 18 spatial resolution map of domesticated animals (Lerner et al. 1988) was used
to derive the extent of animal uptake of Nr by applying average nitrogen required
per animal type based on a range of protein requirements for all animal ages (NRC
1985; Smil 1999). Animal waste load distribution was derived by applying species-
specific Nr emission units based on animal intake (NRC 1985; Smil 1999) minus
ammonia volatilization (Smil 1999) yielding the following effective nitrogen loads
to the land per livestock head: dairy cattle 43.2 kgN/year industrial world and
24.3 kgN/year developing world, non-dairy cattle 30.4 kgN/year industrial world
and 18.2 kgN/year developing world, swine 8 kgN/year, sheep and goats 6.5 kgN/
year, horses 34.2 kgN/year, caribou and camels 30.6 kgN/year, and water buffalo
28.8 kgN/year (NRC 1985; Smil 1999). Ammonia volatilization rates were taken
from Smil (1999) and are 36% for cows and pigs; 28% for goats, sheep, horses,
caribou and water buffalo. The cattle classes (dairy and non-dairy) were subdivided
into developing and industrialized world classes to reflect differences in lower body
weights and poorer feeds in low-income countries. Other livestock animals, such as
poultry, were not included in this analysis due to a lack of spatial information at the
global scale. However, these excluded animals represent only *5% of the total
global nitrogen loads from livestock (Smil 1999).
We assumed there was a steady state between the harvest and growth of animal
stock over the time period. Livestock numbers for domestic livestock animals were
updated from the 1984 baseline (Lerner et al. 1988) to 1995 values by determining
80
the percent increase by country in livestock populations for horses, cattle, pigs,
sheep, goats and buffalo from the FAOSTAT database (FAO 2001). It was assumed
that no significant change in either camel or caribou populations have occurred over
this time frame. Animal intake and excretion were then resampled to the 1 km grid
cell scale by distributing the animal equivalents evenly among crop and grazing
land (EDC 2000) within each 18 cell. Nitrogen content in the intake and excretion
of wild animals was considered to be very small and was not considered in this
analysis. The livestock excretion data set was then resampled to 300.
Distribution of nitrogen in crops.
The nitrogen content in crops was determined from the country-level production
statistics from the FAOSTAT database for 1995. An estimate of the percent of
nitrogen in major crop classes was taken from estimates of nitrogen in harvested
crops and fresh weight harvest. This was done for seven harvested types globally
(cereals, legumes, sugar crops, roots and tubers, vegetables and fruits, forages, and
other crops) (Smil 1999). Total nitrogen in crops for each country was calculated as
the sum of nitrogen in the individual crops per year for the respective countries.
Crop nitrogen content was spatially distributed across all cropland within each
country (EDC 2000) weighted by atmospheric inputs to the cropland assuming
areas with higher nitrogen input will support greater sequestration in crops. The
cropland nitrogen content data set was then resampled to 300 resolution.
Distribution of nitrogen in forage and feed for livestock.
Following the determination of estimated livestock intake, a comparison was made
between (a) the amount of intake required locally by the animals and (b) what was
available both locally through grazing and silage as well as through consumed
feeds. The nitrogen content in livestock feed was determined from country level
feed statistics based on specific feed crop type in the FAOSTAT database (FAO
2001). Nitrogen content in feed crop classes was defined according to the seven
crop group types listed in Smil (1999). Animals on grazing land were given ni-
trogen in a hierarchical manner by first using locally available grazing land and
secondly taking any additional nitrogen sources from the remaining country level
feed. Areas where nutritional needs of livestock were not met occur predominantly
in developing nations. Since our model does not account for other important feed
resources that are difficult to model at the global scale such as animal products
(milk mainly), road-side grazing, and household wastes, the amount of nitrogen
available for intake may be underestimated in some areas, particularly in devel-
oping nations that typically utilize these resources. Noted nutritional deficits may
also be due to an overestimation of the nitrogen intake required for livestock in
these countries. A single global value was used to represent average intake for each
type of animal; therefore, estimations of intake for some countries may be over-
estimated. In addition, deficits in some countries may be a function of inaccurate
reporting of total livestock numbers for the country or incorrect assignment of
nitrogen intake values for animals in these areas.
81
Redistribution of nitrogen loading to the terrestrial and aquatic systems
The mass balance of nitrogen inputs and transfers at the grid cell level yields a
spatially distributed surface of nitrogen loadings to the landmass that are potentially
mobilizable into river networks. We refer to these loadings, collectively, as Nmob.
Nitrogen loads onto the continental landmass are described in the previous section
and developed for both pre-industrial and contemporary conditions. Pre-industrial
Nmob loadings are considered solely a function of the pre-industrial atmospheric
inputs deposition and fixation with no adjustments for lateral transports. The
sources of the contemporary ‘vertical’ nitrogen loading to the landscape include
deposition, fixation, fertilizer application, livestock loadings and human loadings.
A ‘horizontal’ component is also present for the contemporary condition, re-
presenting the amount of nitrogen taken from grazing lands and harvested crop-
lands and transported as feed (and forage) and as human food consumption. To
compute a potentially mobilizable load of atmospheric nitrogen available for
aquatic transport, the amount of Nr in food and feed transported out of each grid
cell was deducted from the atmospheric inputs of Nr into that grid cell. Where food
and feed nitrogen exports from the grid cell exceed inputs into that grid cell, the net
mobilizable nitrogen load is set to zero. The adjusted Nmob atmospheric inputs are
then added to the gridded distribution of livestock and human Nmob waste load-
ing to derive a spatially distributed surface of contemporary Nmob loadings to
the terrestrial and aquatic systems that are potentially mobilizable into river
networks.
Estimation of nitrogen fluxes at basin mouth
Much of the globe is unmonitored for both river discharge and water quality. Data
from less than 50% of entire landmass and only 72% of the actively discharging
portion of the continents provides reliable estimates of river flow (Fekete et al.
1999). For nitrogen these numbers are even more limited with only about 40% of
the landmass with relatively reliable data for DIN and 33% for TON (Meybeck and
Ragu 1995). To achieve global coverage of nitrogen riverine flux a practical means
of extrapolation is necessary.
Our analysis for estimating riverine nitrogen fluxes is based on the typological
approach presented by Meybeck (1993) for constituents in river systems. Typology
as used here is a means for first characterizing drainage basins based on spatially
distributed, geophysical attributes and then applying nutrient flux models to make
estimates over unmonitored drainage systems. The flux models are based on re-
lationships linking the biogeophysical characteristics of drainage basins to observed
constituent fluxes. Good examples of such an approach using simple multiple re-
gression equations can be found in Kroeze and Seitzinger (1998) for DIN, Ludwig
and Probst (1996) for carbon flux, Syvitski et al. (2000) for suspended sediments.
The work reported here will explore a statistical model to predict mouth-of-basin
fluxes based on full-basin characteristics. The following sections describe the
model inputs and derivation.
82
Data sets
Chemical constituent data
The data set for observed nitrogen flux was taken from the United Nations En-
vironment Program’s Global Environmental Monitoring System Global River In-
puts (GEMS/GLORI) data set for rivers exceeding 10 000 km2 drainage area,
10 km3/year discharge or a population of 5 million people (Meybeck and Ragu
1995, 1997). GEMS/GLORI represents the single largest compendium on global
river chemistry and attributes of which we are aware. For the purposes of tabulating
land-to-ocean fluxes, the data have already been organized to represent conditions
at river mouth. Drainage basins smaller than 25 000 km2 were not included in the
analysis due to geomorphometric constraints associated with the 30 min river
network described in ‘Spatially distributed data sets’. A total of 281 and 58 sites
provided concentration data to this study on DIN and TN, respectively. An original
small number of DIN and TN sites (n¼ 112 and 13, respectively) was available
through GEMS/GLORI. We augmented this data by combining other nitrogen
elements (i.e., total nitrogen¼ total Kjeldhal Nþ nitrate) and by inferring re-
lationships between nitrogen and carbon elements provided in the GEMS/GLORI
database (i.e., DON derived from DOC, etc.). Area-specific fluxes or yields were
calculated based on constituent concentrations and reported runoff values.
The majority of GEMS/GLORI rivers are from the temperate zone although
many additional climatic regions are represented, including sub-tropical, desert,
and alpine/tundra systems. Rivers in GEMS/GLORI span the full range of nitrogen
status from pristine through highly eutrophic. Concentration values range from 0.01
and 5.3 mg l�1 for DIN, with export rates from 0.05 to 2 132 kg N km2/year. TN
concentration values range from 0.35 and 6.09 m l�1, with export rates from 0.95 to
2 443 kg N km2/year. Though not strictly representing an identical time period, in-
dividual data entries within GEMS/GLORI represent yearly average concentrations
and are reasonably well harmonized with respect to time domain to depict condi-
tions over the recent past. The data for DIN span 1962 through 1996 with 80% of
the entries falling between 1980 and 1992. The TN data set spans 1986 through
1996 with 50% of the entries falling between 1993 and 1995.
Spatially-distributed data sets
A total of 14 individual data sets were assembled or constructed as part of this study
(Table 1) including the mobilizable Nmob land loads described in ‘Nitrogen loading
to the landmass’. All were geographically co-registered to a 300 spatial resolution
grid and organized into distinct river basins using drainage divides represented in the
Simulated Topological Network for potential river flow paths (STN-30p) (Vorosmarty
et al. 2000a,b). A total of 6 152 basins was potentially available for land-derived
fluxes across 133.1� 106 km2 of non-glacierized land area. The actively discharging
portion of the landmass constitutes 95.1� 106 km2 and 5 362 basins. This river
network (STN-30a) was determined using STN-30p flow paths and a threshold of
83

3 mm/year representing the long-term average minimum upstream runoff required
to sustain any significant discharge in river channels over a several year period
(Vorosmarty and Meybeck 2003). The STN-30a was then used to derive basin-scale
attributes for active drainage systems ranging in size from 25 000 km2 to
>6� 106 km2 for the Amazon basin. The 25 000 km2 threshold was chosen based on
earlier assessment of the limits to using a 300 resolution river networking system to
depict the geomorphometry of drainage basins (Vorosmarty et al. 2000b). This
yielded a discharging landmass of 73.6� 106 km2 comprising 387 drainage basins.
Water residence time (t) and temperature were employed to calculate the effi-
ciency of nitrogen processing within and hence transport through drainage basins.
Similar recent studies have also employed residence times as a proxy for estimating
nitrogen processing efficiency within river basins and stream reaches (Alexander et
al. 2000; Peterson et al. 2001; Wolheim et al. 2001). For each drainage basin, a
series of t values was assigned based on the mean duration of time that water
spends within soils and shallow groundwater, river channels, lakes, and reservoirs;
deeper groundwater is not considered in this analysis due to lack of information at
the global scale. Residence time for nitrogen on the landmass was estimated as the
sum of the mean annual volume of water stored as soil moisture and shallow
groundwater (from 12 monthly estimates) divided by mean annual basin runoff,
based on a global-scale water balance model (WBM) (Vorosmarty et al. 1998;
Fekete et al. 2002). Residence time in river channels was calculated as the total
volume of channel water (i.e., rectangular cross-section assumed; volume¼width� depth� length) derived from the geomorphometric attributes of STN-30
(Vorosmarty et al. 2000b) and theory (Leopold et al. 1964). The volume was then
divided by the mean annual discharge at the mouth of each basin. For the globe, we
obtained a mean, discharge-weighted residence time in the actively discharging
channels of the STN-30a of approximately 14 days, in good agreement to estimates
which vary from 16 to 26 days (Covich 1993; Vorosmarty et al. 2000a). In basins
with large dams and reservoirs an incremental residence time was computed as the
accumulated, effective storage volume divided by the mean annual discharge at the
mouth (Vorosmarty et al. 1997a,b, 2003). A total of 633 large reservoirs were
employed which yielded a global incremental t of 31 days; in individual basins
incremental t can exceed years. Likewise, incremental residence time in lakes was
calculated as the total volume of lakes contained in a basin divided by mean annual
discharge at the mouth of the basin. Documented lake volumes were identified for
87 out of the total natural 6 392 georeferenced lakes with known area used in this
study (ESRI 1995; Lerman et al. 1995). The small number of known lake volumes
actually corresponds to approximately 90% of the total volume of global fresh
water lakes since the largest lakes (Baikal, Tanganyika, North American Great
Lakes, Victoria) are well documented. For the remaining lakes lacking documented
volume information, average lake depth was estimated as a function of lake area
class (ESRI 1995) depending on glacial, non-glacial or tectonic origin (Meybeck
1995). Lake volume was calculated as the product of estimated lake depth and
surface area. For the globe, we obtained a mean residence time in lakes of ap-
proximately 1.2 years.
84

All residence times are expressed in units of years. The calculations for t re-
present theoretical hydraulic residence times and we recognize that they do not
yield absolute residence times. t for soil does not explicitly track nitrogen pathways
in vegetation or soil organic matter. As we will see, it does, however, give a relative
measure of leaching and potential nitrogen throughput that can be used to distin-
guish the transport behavior of individual drainage basins.
Basin-scale nitrogen flux model formulation
We developed independent statistical relationships linking present-day DIN and TN
area-specific fluxes from GEMS/GLORI to the contemporary Nmob loadings and
drainage basin attributes, based on non-linear least squares regression equations
(JMP; SAS, Inc., Durham, NC) to yield estimates of riverine nitrogen flux (Nrf).
Each equation was developed by exploring links between GEMS/GLORI specific
yields (kg N km2/year), basin-wide Nmob loads for actively flowing areas, and the
additional drainage basin attributes listed in Table 1. The core of the Nrf flux
equations resides in a set of nitrogen delivery coefficients (efficiencies E), which
define the fraction of the total basin Nmob load that is delivered to the mouth.
Delivery coefficients are represented as fractions between 0 and 1 of the Nmob
mass transported through each of the following pathways: (a) soils and ground-
water, (b) natural lakes, (c) reservoirs and (d) river networks.
Combining the delivery coefficients and Nmob loads the TN and DIN Nrf flux
equations take the form:
Nrf ¼ ErivEresElakeðPtS þ NonPtSorg Esoil-org þ NonPtSinorg Esoil-inorgÞ ð1Þ
where PtS is the specific point source loading, NonPtSorg is the organic non-point
source loading weighted by runoff, NonPtSinorg is the inorganic non-point source
load weighted by runoff. The Nmob loadings were specifically assigned as
follows:
PtS ¼ Nmob load from sewered urban population
NonPtSorg ¼ ðNmob fixation þ Nmob livestockload
þ Nmob NPS human loadÞðrunoff=precipitationÞNonPtSinorg ¼ ðNmob deposition þ Nmob fertilizerÞðrunoff=precipitationÞ ð2Þ
where precipitation and runoff values are in mm/year and all Nmob loadings are
in kg N km2/year. Non-point source loads are weighted by available runoff to limit
transport as a function of dryness. Non-point source loads were multiplied by the
ratio of runoff to precipitation to represent an effective non-point source load to
the land thereby weighting wetter basins with greater transport capacities than
drier basins. Point sources as defined in this paper were not weighted by available
water flow since they are assumed to be directly input into flowing river systems
sufficient in size to transport the materials downstream. Eriv, Eres, Elake, Esoil-org
and Esoil-inorg are the delivery coefficients defining the fraction of incident Nmob
85

load transported through each system (river channels, reservoirs, lakes, and soils/
groundwater, respectively). The non-point source loads were partitioned into or-
ganic and inorganic sources of Nmob to account for the different transformation
processes associated with each. We recognize that some non-point source loads
many contain a mixture of organic and inorganic forms, however we have chosen
to assign each source load to their predominant component. The delivery coeffi-
cients take the form of:
Eriv ¼ eð��rivTadjarivÞ; Eres ¼ eð��resTadjaresÞ; Elake ¼ eð��lakeTadjalakeÞ;
Esoil-org ¼ eð��soilTadjasoil-orgÞ; Esoil-inorg ¼ eð��soilTadjasoil-inorgÞ ð3Þ
where triv, tres, tlake, and tsoil are the specified residence times for river channels,
reservoirs, lakes, and soils, respectively, Tadj (8C) is the average basin temperature
normalized by adding 30 8C to eliminate the occurrence of negative values in the
exponent, and the variables ariv, ares, alake, asoil-org, and asoil-inorg are tunable
parameters which define the shape of the respective constituent delivery functions.
The delivery curves generally behave in an exponentially decreasing manner with
increases in temperature and residence times. For example, with DIN we expect
that higher temperatures will increase rates of denitrification and therefore de-
crease the delivery of Nmob downstream. Longer residence times increase the
opportunity for nitrogen processing in the drainage basin landscape and aquatic
systems via settling, uptake, and transformation and are also expected to decrease
the delivery of DIN downstream. The tunable parameters were developed using a
non-linear least squares regression analysis to find the best-fit values minimizing
errors for the proposed model. We make estimates of TON by subtracting DIN
from the TN estimates. Estimation algorithms for TN and DIN each converged in
an objective function with a specified convergence criterion of 0.05. Coefficients
and model performance measures for the TN and DIN nonlinear regression ana-
lysis are given in Table 2. Comparison of observed TN to the regression predicted
values yielded a predicted/observed slope of 0.99 where the predicted TN values
explained 88% of the variation in the observed TN values. The DIN regression
predictions explained 68% of the variation in the observed DIN values and gave a
predicted/observed slope of 0.94.TN and DIN fluxes for the pre-industrial state
were generated using pre-industrial basin Nmob loadings and the resulting maps
are thus fully simulated. Changes in climate were not considered for the pre-
industrial state due to inaccuracies in currently available GCM’s (National As-
sessment Synthesis Team 2001; Vorosmarty et al. 2000c) and their minor im-
portance relative to the major forcings of the anthropogenic nitrogen loadings
which increase considerably from pre-industrial to contemporary conditions. For
the contemporary setting we made predictions for the more than 5 300 STN-30a
basins. Our aim is to provide an accurate contemporary picture of loading. Thus,
we ‘burned-in’ GEMS/GLORI observations of basin exports whenever available.
Standard error estimates on mean annual fluxes were generated using JMP (SAS,
Inc., Durham, NC). Statistical summaries for the globe, individual continents, and
ocean basins were prepared.
86

Seasonal basin-scale nitrogen fluxes
Finally, we produce global, time-varying inputs of TN to the world’s coastal zone,
simulating a seasonal climatology of Nrf riverine flux. Monthly estimates of Nrf
flux were derived as a function of the intra-annual variability in monthly water
discharge acting as the predominant mechanism for transporting Nmob through the
river system. Previous global studies have emphasized the correlation between
runoff and Nrf export (Caraco and Cole 1999) and more current regional studies
have illustrated the importance of hydrologic control over seasonal or intra-annual
changes in leaching and export of Nrf at river mouths (Donner et al. 2002). For this
analysis a monthly climatology of runoff (Fekete et al. 1999) was used to apportion
the annual Nrf river flux according to simulated monthly discharge fields. Each
month was assigned a percentage of the annual Nrf flux according to the amount of
annual discharge represented in that month. The Nrf monthly river fluxes were
summarized into four seasons.
A preliminary analysis of the discharge-apportioned Nrf river flux was carried
out for rivers in the USGS National Stream Water Quality Monitoring Networks
(WQN) database (Alexander et al. 1995) using monthly average discharge from
daily observations and daily nitrogen concentrations to produce monthly and sea-
Table 2. Non-linear least squares regression equation results and parameters.
Parameter Estimate ApproxStdErr Lower CL Upper CL
TN non-linear regression equationa
ariv 0.0858618033 0.04779342 �0.0178481 0.23250514
ares 0.050900997 0.01298088 0.02593498 0.092499
asoil-org 0.000164579 0 �0.0041304 0.0017604
asoil-inorg 0.0149043286 0.00423667 0.00680154 0.04067316
alake 0.0004263108 0.00042079 �0.0001996 0.00408298
NrfTN¼ErivEresElake(PtSþNonPtSorgEsoil-orgþNonPtSinorgEsoil-inorg)
DIN non-linear regression equationb
ariv 0.398674261 0.08455365 0.21962927 0.55705911
ares 0.0337858888 0.01851732 0.0060824 –
asoil-org 0.1104082556 0.04051463 0.06355603 –
asoil-inorg 0.0011524393 0.00140753 �0.0007241 0.00503864
alake 0.0100626882 0.00250364 0.00572282 0.01538738
NrfDIN¼ErivEresElake(PtSþNonPtSorgEsoil-orgþNonPtSinorgEsoil-inorg)
TON equation
NrfTON¼NrfTN�NrfDIN
aNumber of rivers¼ 58; variation explained by predicted TN¼ 1� [sum(x� y)2/sum(y� ymean)2]¼0.88; slope¼ 0.99; SSE¼ 1273456; DFE¼ 54; MSE¼ 23582; RMSE¼ 153.bNumber of rivers¼ 281; variation explained by predicted DIN¼ 1� [sum(x� y)2/sum(y� ymean)2]¼0.68; slope¼ 0.94; SSE¼ 2099561; DFE¼ 121; MSE¼ 17351; RMSE¼ 131.
87
sonal estimates of DIN flux. The WQN database was comprised of 679 rivers
spanning the US covering 33 years of daily monitoring observations from 1962
through 1995. Basins ranged in size from 10 000 km2 to 3� 106 km2. This analysis
showed that 76% of the observed seasonal DIN flux was accounted for by using the
monthly discharge-apportioned method. Based on these results we consider the Nrf
seasonal river flux model presented here adequate to represent a sufficient portion
of the intra-annual variability in nitrogen flux at river outlets.
Results: a geography of global Nmob loading and Nrf basin flux
The maps and figures in this section summarize results for the loading of reactive
Nr onto the landmass, the resulting local nitrogen loads mobilizable to inland
aquatic systems (Nmob), the transport through inland waters, and eventual delivery
to receiving waters. Data is presented for both the pre-industrial and contemporary
states at grid cell and basin scale resolutions for TN, DIN, and TON. An estimate of
the percent change in nitrogen loading and flux from pre-industrial to the con-
temporary time frame is given, as is a geography of the overall efficiency of
transport. The key determinants of nitrogen loads across the landmass are identified
to help understand the role of present-day anthropogenic loading on the global
nitrogen cycle. We also present seasonal fluxes of TN for the globe.
Nmob loading to the continental landmass
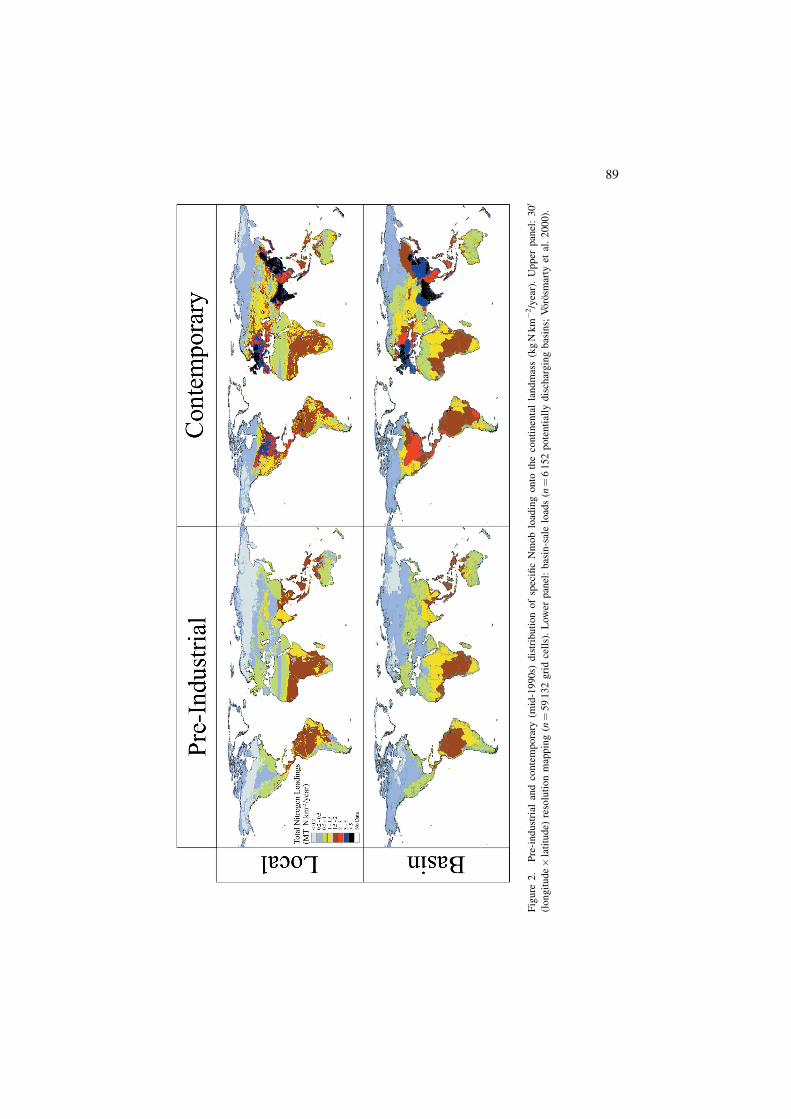
Mobilizable nitrogen loading for the pre-industrial and contemporary landmass is
shown in Figure 2. For the pre-industrial state, the largest amounts of Nmob loads
are seen in the tropics, a reflection of substantial amounts of Nr fixation (Figure
3(A)). Large increases in the amount of Nmob loaded to the landmass are seen in
the contemporary state with the greatest increases occurring in the temperate and
sub-tropical zones. In the pre-industrial state Nmob loading does not exceed
2 MT Nr km�2/year whereas in the contemporary state values in excess of
5 MT Nr km�2/year are common. Largest contemporary loads are seen in central
and eastern North America, throughout Europe, and in southern and southeastern
Asia. There are increases in Nmob loading in tropical areas in the contemporary
relative to the pre-industrial state but for the most part the ranges are similar.
Distribution of the Nmob loads relative to the Koppen climate zone classifi-
cation system is illustrated in Figure 3(A). The horizontal lines superimposed on
the contemporary loading bars represent the level of uncorrected Nr atmospheric
loading of contemporary deposition and fixation. Under contemporary conditions
the uncorrected Nr fixation and deposition levels show an increase for all climate
classes relative to the pre-industrial state. However, the mass balance corrected
Nmob fixation and deposition levels, shown as yellow bars, are similar to the pre-
industrial with minor net gains in the cold and temperate zones and a slight net
88
Fig
ure
2.
Pre
-in
du
stri
alan
dco
nte
mp
ora
ry(m
id-1
990
s)d
istr
ibu
tio
no
fsp
ecifi
cN
mo
blo
adin
go
nto
the
con
tin
enta
lla
nd
mas
s(k
gN
km
�2/y
ear)
.U
pp
erp
anel
:3
00
(lo
ngit
ud
e�
lati
tud
e)re
solu
tio
nm
app
ing
(n¼
59
132
gri
dce
lls)
.L
ow
erpan
el:
bas
in-s
ale
load
s(n¼
61
52
po
ten
tial
lyd
isch
argin
gb
asin
s;V
oro
smar
tyet
al.
20
00).
89
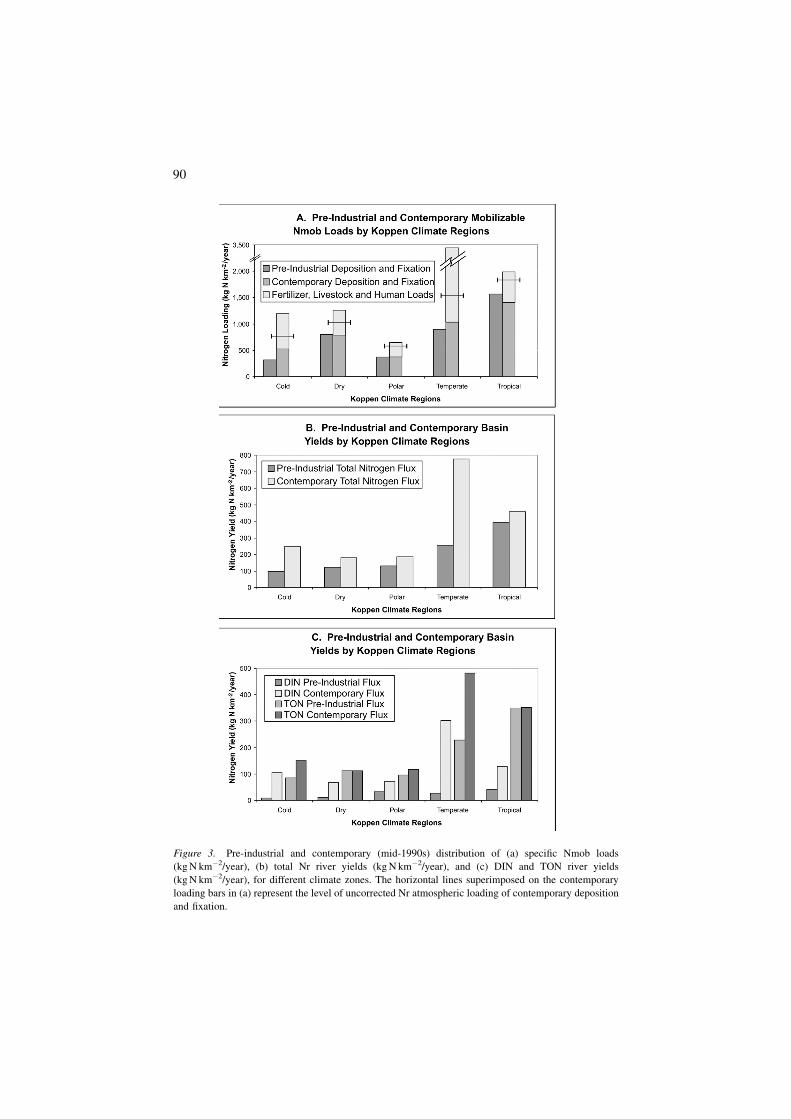
Figure 3. Pre-industrial and contemporary (mid-1990s) distribution of (a) specific Nmob loads
(kg N km�2/year), (b) total Nr river yields (kg N km�2/year), and (c) DIN and TON river yields
(kg N km�2/year), for different climate zones. The horizontal lines superimposed on the contemporary
loading bars in (a) represent the level of uncorrected Nr atmospheric loading of contemporary deposition
and fixation.
90

Tab
le3
.P
re-i
nd
ust
rial
and
con
tem
po
rary
mob
iliz
able
nit
rog
enlo
adin
g.
Pre
-in
du
stri
alN
mo
bC
on
tem
po
rary
Nm
ob
Dep
osi
tio
n
(Tg
/yea
r)
Fix
atio
n
(Tg
/yea
r)
To
tal
(Tg
/yea
r)
Dep
osi
tio
n
(Tg
/yea
r)
Fix
atio
n
(Tg
/yea
r)
Fer
tili
zer
(Tg
/yea
r)
Liv
esto
cklo
ad
(Tg
/yea
r)
Peo
ple
load
(Tg
/yea
r)
To
tal
(Tg
/yea
r)
(A)
Co
nti
nen
t
Afr
ica
3.6
33
1.9
93
5.6
16
.58
25
.02
0.9
46
.43
2.2
54
1.2
2
Asi
a3
.29
25
.45
28
.73
11
.21
22
.62
20
.21
22
.41
12
.70
89
.15
Au
stra
lia
0.4
66
.99
7.4
50
.46
5.7
00
.19
1.4
80
.09
7.9
1
Eu
rope
0.6
23
.92
4.5
44
.40
3.0
65
.48
10
.13
3.0
92
6.1
6
No
rth
Am
eric
a1
.27
9.8
11
1.0
76
.16
8.7
65
.48
5.8
51
.95
28
.21
Oce
ania
0.0
20
.34
0.3
50
.03
0.1
70
.07
0.5
80
.02
0.8
7
So
uth
Am
eric
a2
.75
20
.16
22
.91
3.5
11
6.1
21
.59
6.6
31
.21
29
.06
(B)
Oce
anb
asin
Arc
tic
Su
bo
cean
0.6
13
.41
4.0
22
.11
3.2
60
.24
0.9
00
.31
6.8
3
Atl
anti
cO
cean
5.6
54
1.6
24
7.2
71
3.6
83
4.4
71
0.3
11
7.6
94
.79
80
.94
Bla
ckS
ea0
.16
1.0
71
.24
1.0
10
.79
0.8
33
.19
0.8
96
.72
Ind
ian
Oce
an1
.96
20
.03
21
.99
4.8
01
6.3
66
.28
13
.64
5.2
64
6.3
4
Lan
d1
.12
11
.82
12
.94
3.3
71
0.1
20
.96
4.5
01
.56
20
.52
Med
iter
ran
ean
Sea
0.6
25
.83
6.4
51
.90
4.4
51
.56
2.9
11
.33
12
.15
Pac
ific
Oce
an1
.91
14
.89
16
.80
5.4
81
2.0
11
3.7
81
0.6
77
.18
49
.11
Glo
bal
tota
ls1
29
91
11
32
81
34
54
21
22
3
Ori
gin
alat
mo
sph
eric
Nr
sou
rces
44
11
2*
71
**
*F
ixat
ion
corr
ecte
dfo
rN
rlo
ssd
ue
tob
iom
ass
bu
rnin
gan
dn
atura
lso
ils
emis
sio
ns.
**
Fer
tili
zer
corr
ecte
dfo
rN
rlo
ssd
ue
toN
H3
vo
lati
liza
tio
n.
91

Figure 4. Predominant source of Nmob loading under the contemporary setting. Categories represent
one of the five contemporary nitrogen sources (deposition, fixation, fertilizer, livestock, and human
loads) based on total Nmob load to the grid cell.
Figure 5. Fluvial TN fluxes, showing pre-industrial mouth-of-river fluxes and the relative change for
contemporary conditions (n¼ 387 actively discharging basins <25 000 km2).
92

decrease in the tropical zone. Additional anthropogenic contemporary loads in
the form of fertilizer, livestock and human emissions (red bars) are substantial in
each climate zone. In relative terms they are largest for cold and temperate cli-
mates. The largest relative and absolute increase has occurred in the temperate
zone.
Table 3(A) and (B) shows global, continental, and coastline-specific estimates of
mobilizable nitrogen loadings onto the continental landmass, contrasting pre-in-
dustrial and contemporary conditions. Nmob loading to the landmass for the pre-
industrial state is 111 Tg/year. Pre-Industrial deposition and fixation global esti-
mates are similar to previously reported estimates (Dentener and Crutzen 1994;
Smil 1999) and are lower but still consistent with those recently reported by
Galloway et al. (2003) (Galloway estimates 17 Tg/year deposition and 125 Tg/year
fixation). In the contemporary state the Nmob loading is increased to 223 Tg/year
due to the introduction of additional anthropogenic sources, from industrial de-
position, managed crop associated fixation and industrial fertilizers. Global totals
for the original contemporary net atmospheric Nr sources are provided at the
bottom of Table 3 for comparison to the redistributed contemporary Nmob loads.
The undistributed contemporary net atmospheric Nr deposition, fixation, and fer-
tilizer global totals are all similar to previously reported estimates (Dentener and
Crutzen 1994; Smil 1999; Seitzinger et al. 2002a) and lower but still consistent with
those recently reported by Galloway et al. (2003) (Galloway estimates 63 Tg/year
deposition, *139 Tg/year naturalþ cultivated fixation, and 100 Tg/year industrial
fertilizer with 86 Tg/year accounting for process losses).
In the pre-industrial state the single largest contributor of Nmob to the land-
scape is fixation, which holds across all continents and receiving ocean basins. For
the contemporary state the largest Nmob contributors continue to be fixation
followed by livestock, fertilizer, deposition and human loading, in that order. Asia
and the Atlantic Ocean river basins receive the greatest total amount of Nmob
loading to the landscape (89 and 81 Tg/year, respectively) while Oceania and the
Black Sea basins show the lowest total loading of Nmob (0.87 and 6.72 Tg/year,
respectively). The European continent and the Black Sea drainage basins receive
the greatest Nmob load per contributing basin area (3 043 and 3 296 kg N km�2/
year, respectively) while North America and the Arctic Subocean river basins
have the lowest loading of Nmob per basin area (1 756 and 640 kg N km�2/year,
respectively).
Figure 4 represents the contemporary distribution of Nmob loads to the landmass
mapped by the predominant contributor of nitrogen within each 300 grid cell. It can
be seen that fixation is the primary source of Nmob load throughout South America,
Africa, Australia, and the northernmost reaches of Asia and North America. De-
position plays a dominant role throughout the northern temperate zones of Europe,
Asia and North America. Fertilizer Nmob load is predominant in the agricultural
areas of the world including, the ‘bread basket’ of the US and Canada, throughout
continental Europe, and eastern China. Livestock loading is the most important
Nmob source in Eastern Europe and India and plays an important role in South
America, Africa, and Australia. Human Nmob loadings can be seen as single grid
93

Ta
ble
4.
Pre
-in
du
stri
alan
dco
nte
mpo
rary
nit
rog
enfl
uxes
.
Pre
-ind
ust
rial
Co
nte
mp
ora
ry
To
tal
Nm
ob
load
s
(Tg
/yea
r)
To
tal
N
flu
x
(Tg
/yea
r)
Tra
nsp
ort
effi
cien
cy
(%)
To
tal
Nm
ob
load
s
(Tg
/yea
r)
To
tal
N
flu
x
(Tg
/yea
r)
Tra
nsp
ort
effi
cien
cy
(%)
Med
iant
(yea
rs)
Mea
n
tem
per
atu
re
(8C
)
(A)
Co
nti
nen
t
Afr
ica
35
.61
3.1
49
41
.22
2.4
26
1.3
82
3.1
Asi
a2
8.7
37
.39
26
89
.15
18
.71
21
0.8
28
.5
Au
stra
lia
7.4
50
.29
47
.91
0.3
34
2.2
21
9.9
Eu
rope
4.5
41
.17
26
26
.16
6.1
92
41
.13
4.9
No
rth
Am
eric
a1
1.0
72
.63
24
28
.21
4.5
31
61
.47
�3
.4
Oce
ania
0.3
50
.18
51
0.8
70
.37
42
0.6
01
5.5
So
uth
Am
eric
a2
2.9
16
.24
27
29
.06
7.5
12
60
.65
17
.1
(B)
Oce
anb
asin
Arc
tic
Oce
an4
.02
1.3
03
26
.83
2.6
43
91
.50
�1
1.6
Atl
anti
cO
cean
47
.27
9.7
72
18
0.9
41
5.1
01
91
.18
11
.4
Ind
ian
Oce
an2
1.9
93
.23
15
46
.34
7.4
31
61
.02
23
.5
Lan
d1
2.9
40
.89
72
0.5
21
.43
76
.72
7.4
Med
iter
ran
eanþ
Bla
ckS
ea7
.69
0.5
88
18
.87
2.2
51
21
.65
12
.9
Pac
ific
Oce
an1
6.8
05
.30
32
49
.11
11
.23
23
0.6
31
3.3
Glo
bal
tota
ls1
11
21
19
22
34
01
81
.13
6.1
94
cell localized ‘hotspots’ primarily associated with large urban settlements (i.e.,
New York City, USA; Mexico City, Mexico; Sao Paolo, Brazil; London, UK, etc.).
Nitrogen flux at river mouths
Figure 5 shows the spatial distribution of riverine nitrogen fluxes for the globe. The
figure compares pre-industrial Nrf fluxes at river mouths and the percent change
from the pre-industrial to the contemporary state. The largest pre-industrial Nrf
riverine fluxes are associated with the biggest rivers where the Amazon has the
largest Nrf flux exceeding 3.3 million MT N/year. In the contemporary state the
largest increases in Nrf riverine flux are evident in the industrialized world of North
America and continental Europe as well as southern and southeast Asia. As seen in
Figure 2 these areas also receive the largest increase in contemporary Nmob loads
to the landmass and aquatic systems. There are relative increases in Nrf riverine
flux in some tropical rivers for the contemporary state, particularly in South
America, however they are not as evident as the temperate zone impacts.
Table 4(A) and (B) presents global, continental, and ocean basin estimates of
riverine fluxes for TN from the continental landmass, contrasting pre-industrial and
contemporary conditions. Median residence times (Tau) and mean annual tem-
peratures are provided for basins organized by continent and receiving ocean basin.
TN flux for the pre-industrial state is 21 Tg/year representing a 19% transport
efficiency of nitrogen from land to river outlet. In the contemporary state the TN
flux increases to 40 Tg/year but overall transport efficiency is virtually identical
(18%). These values are similar to previously reported estimates of Nrf riverine flux
(*44 Tg/year TN from Seitzinger et al. 2002a) and transport efficiencies (*20%
from Howarth 1998; Seitzinger et al. 2002a) and are lower but still consistent with
the 25% transport efficiency estimate recently reported by Galloway et al. (2003)
for the globe and Howarth et al. (2002) and Boyer et al. (2002) for the northeastern
US. Each of the continents shows slight to moderate decreases in their con-
temporary efficiencies relative to pre-industrial. The largest emitter of total riverine
nitrogen is Asia (19 Tg/year) while the lowest is Australia (0.3 Tg/year). The largest
continental yields of total riverine Nrf flux are in Oceania (895 kg N km�2/year)
whereas the lowest are in Australia (43 kg N km�2/year). The continents with the
lowest transport efficiencies are Africa and Australia, which are also the driest
continents. Both continents have very high mean annual temperatures coupled with
high (Australia) to moderate (Africa) residence times suggesting an enhanced ca-
pacity to process nitrogen in basin resulting in less Nrf flux delivered to the river
mouth. The highest efficiency of transport is associated with Oceania, a region
characterized by small rivers with low residence times suggesting a diminished
capacity to process nitrogen in basin and therefore a greater throughput of nitrogen
to river mouth. Next highest is South America, which also has low residence times
reflecting lower nitrogen processing capabilities. In both these cases, the shorter
residence times may predominate over the potential metabolic effects of moderate
to high mean temperatures in these basins yielding greater transport efficiencies.
95

In the pre-industrial state the Arctic and Pacific Ocean basins show the highest
transport efficiencies for TN. In the contemporary state the Arctic Ocean draining
basins show by far the largest transport efficiency. We hypothesize that the Arctic
basins are characterized by very low temperatures which limit biological nitrogen
processing within basin and therefore support greater throughput of Nrf flux to river
mouth. In some areas we see a sensitivity to anthropogenic loads related to the
product of residence time and temperature. The transport efficiency for the Pacific
Ocean draining basins decreases from 32% pre-industrial to 23% for the con-
temporary state. Moderate to high mean annual temperatures in many of these basins
may support a greater biological processing capacity and hence reduce the amount of
additional contemporary Nmob loading reaching the ocean as Nrf flux. The lowest
transport efficiencies are associated with the endorheic (Land) basins which exhibit
very high residence times providing a greater time period over which to process
loaded nitrogen in basin hence reducing the amount reaching river mouth as Nrf flux.
Figure 6 shows the contemporary spatial distribution of Nmob transport effi-
ciency. Transport efficiencies range from 0 to 100% with a global mean of 18%.
The largest efficiencies are evident in the colder regions of the globe with effi-
ciencies exceeding 60% for many of the Arctic draining rivers. As seen in Table 4
these high efficiencies arise from low temperatures which reduce the capacity for
biotic processing of the transported Nmob. Typically, the tropics have lower
transport efficiencies seldom exceeding 20% attesting to their ability to optimally
process Nmob within most basins despite high hydraulic throughput. However,
there are some rivers in Africa, South America, and most notably, over much of
Indonesia which have efficiencies exceeding 40%. These higher efficiencies arise in
relatively smaller basins, typically mountainous areas with very high runoff, re-
sulting in very short residence times and reduced opportunities for processing of
Nmob. Some of the lowest transport efficiencies are seen for rivers with altered flow
Figure 6. Total N transport efficiencies for drainage basins (n¼ 387 actively discharging basins
>25 000 km2). Mean transport is 18% globally, with a range from 0 to 100%. The range and geography
can be explained by variations in temperature and residence time (see Eq. (1)).
96

receiving little to no discharge at river mouth such as the Colorado, Rio Grande,
Nile, Indus and Amu-Darya.
Distribution of the nitrogen riverine specific yields, aggregate transport, and
transport efficiency with respect to the Koppen climate zone classification system is
illustrated in Figure 3(B) for TN. Similar to the Nmob loading from Figure 3(A) the
largest Nrf riverine fluxes from the landmass in the pre-industrial state occur in the
tropical zone in Figure 3(B). For the contemporary state Nrf fluxes in the tropical,
polar and dry zones increase only slightly. More pronounced increases are seen in
the cold and temperate zones. Nrf riverine fluxes in the temperate zone dominate
the contemporary state, mirroring the excess anthropogenic loads seen in Figure
3(A) for the temperate zone.
Figure 3(C) shows Nrf riverine fluxes by Koppen climate zone classification
system for DIN and TON. The general trend of DIN and TON river fluxes across
climate zones generally follows that seen in Figure 3(B) for TN. DIN river fluxes
show large increases from the pre-industrial to contemporary state in all classes
with the greatest increases evident in the temperate and cold zones. TON fluxes
show little change from pre-industrial to contemporary for the dry and tropical
zones and minor to moderate increases in the polar and cold zones, respectively.
The greatest increases in TON river flux are seen in the temperate zone where TON
fluxes show a near doubling from pre-industrial conditions. This increase in TON
flux is consistent with the very large increases in contemporary TN and DIN fluxes
evident for the temperate zone (Figure 3(B) and (C)). Globally, DIN river fluxes are
highest in the temperate zone while TON river fluxes play a dominant role in both
the temperate and tropical zones.
Figure 7 shows the cumulative frequency histogram of accumulated discharge
and residence times in basins occurring in 10% transport efficiency groupings. This
figure demonstrates the majority of the discharge occurs in basins transporting 40%
Figure 7. Accumulated discharge (km3/year) and residence time (years) grouped by Nr transport
efficiency class (Nrf flux at river mouth/Nmob load in river basin).
97

Nrf or less. Very little discharge is associated with efficiencies exceeding 70%.
Although both temperature and residence time control overall efficiency of trans-
port, a clear inverse relationship is apparent between computed transport effi-
ciencies and basin residence times. Comparison of transport efficiencies with basin
residence times shows basins with higher residence times exhibit lower transport
efficiencies; as mean residence times decrease transport efficiencies increase.
Figure 8. Pre-industrial and contemporary (mid-1990s) cumulative riverine flux for (a) TN and (b) DIN
and TON ranked by basin discharge. Basins were ranked from largest to smallest discharge starting with
the Amazon at rank¼ 1.
98

Fig
ure
9.
Sea
son
ald
istr
ibu
tio
no
fN
rfri
ver
ine
flu
xat
bas
inm
ou
ths
repre
sen
ted
by
colo
red
dis
ks
illu
stra
tin
gth
em
agn
itu
de
of
Nrf
flu
xan
dti
me
per
iod
of
max
imu
m
dis
char
ge.
Th
eco
lor
of
the
dis
kco
rres
po
nds
toth
em
on
thly
tim
ep
erio
dsh
ow
nin
the
leg
end
;th
esi
zeo
fth
ed
isk
rela
tes
toth
eto
tal
amou
nt
of
Nrf
flu
xd
isch
argin
gfr
om
the
river
inth
ep
resc
rib
edse
aso
nal
tim
eb
lock
(n¼
38
7ac
tivel
yd
isch
arg
ing
bas
ins>
25
00
0k
m2).
99
Figure 8(A) and (B) shows saturating curves for the accumulated TN, DIN and
TON fluxes for pre-industrial and contemporary conditions as a function of basin
ranked by descending water discharge. In all cases the contemporary Nrf flux for TN,
DIN and TON quickly exceeds the Pre-Industrial Nrf river flux and asymptotes after
approximately the 3 000 highest discharging basins. Total accumulated contemporary
Nrf river flux is nearly twice as large as the pre-industrial flux for TN. Pre-industrial
DIN river flux is low compared to TON flux, however, these fluxes increase by 3-fold
in the contemporary condition. Pre-industrial TON river fluxes comprise the bulk of
the total Nrf fluxes and continue to increase 1.5 times in the contemporary state.
Seasonal transport of nitrogen
Figure 9 shows the seasonal distribution of Nrf riverine flux at basin mouths for the
globe. The Nrf riverine flux is represented by colored disked illustrating the
magnitude of Nrf flux and time period of maximum discharge. The color of the disk
corresponds to the monthly time period shown in the legend; the size of the disk
relates to the total amount of Nrf flux discharging from the river in the prescribed
monthly time block (larger disks¼ larger fluxes).
Temperate zone rivers generally peak in the March through May monthly period
reflecting a spring thaw flux of nitrogen in rivers for this region. The Nrf flux wave
is delayed in the northern temperate and polar zones reaching its peak in the June
through August time period corresponding with a later snowmelt. Rivers in the
tropical regions typically exhibit a longer peak discharging period and peak in the
December through May time period for the equatorial regions of South America,
Africa, Indonesia and Northern Australia. Sub-tropical rivers farther north of the
equator in Central America and the Sahel region of Africa exhibit later peaks
beginning in June and lasting through November. Much of Asia sees peak Nrf
fluxes from March through August with the monsoon influenced regions of
southern Asia peaking in June through August.
From a regional coastline perspective, land-to-ocean fluxes in many areas occur
as sequential pulses of Nrf delivery (e.g., red/green mixes in east Asia, blue/red
mixes in equatorial Africa and South America). This represents the impact of
differential runoff source areas and travel time variations (Vorosmarty et al. 2000).
This in turn represents the spatial distribution of Nmob loads within these different
sized basins and the time required to move the bulk of these loads through the basin
to the river mouth. Thus, while in aggregate more Nmob may be loaded onto large
basins (>500 000 km2), small basins (<100 000 km2) are typically more effective at
transporting those loads that they receive and maintain a relatively shorter flux
period. For example, in eastern China all large basins show Nmob¼ 18 Tg/year and
Nrf riverine flux¼ 3 Tg/year whereas all small basins have Nmob¼ 4 Tg/year and
Nrf riverine flux¼ 5 Tg/year. Thus, for the entire coastline of eastern China, we see
17% transport for large basins and 37% transport for small basins, with an overall
average of 23% transport efficiency for the entire coastline. In addition, due to
shorter travel times, smaller basins show Nrf riverine flux peaks occurring earlier in
100
the season (March through May for smaller basins in eastern China) coincident with
peak precipitation where larger basins in the same region can exhibit a temporal
delay in peak fluxes (June through August for larger basins in this same region).
Summary and conclusions
A model of nitrogen export to the coastal zone requires a comprehensive knowl-
edge of the spatial distribution and magnitude of Nr sources loaded to the land and
aquatic systems coupled with an understanding of the processes for removal and
transformation of this Nr as it moves through various systems along its journey to
the river mouth. A basin explicit, empirical modeling approach is used here de-
veloped from subsidiary input loading at a much finer gridded resolution to estimate
TN, DIN and TON export to coastal systems for the globe. The statistical Nrf
riverine flux model utilizes a set of transport coefficients to move mobilizable
source nitrogen loads through the land and aquatic systems accounting for Nr losses
due to transformations and sinks. The results of the Nrf riverine flux model indicate
that large increases in anthropogenic loads of nitrogen to the landmass and aquatic
systems influence fluxes of both TN and DIN at river mouths for the global and
regional–continental scales. An analogous paradigm is also reflected in the TON
flux estimates which are a product of the model estimated TN and DIN fluxes. The
impacts of increased loading in the industrialized world in the contemporary era are
clearly evident in the subsequent increases in riverine Nrf flux at basin mouths.
Model results also demonstrate the spatial heterogeneity of changes in loading and
responses to load increases throughout the world. Variations in transport capacities
for different parts of the world suggest that certain areas of the globe are more
sensitive to increasing loads where other areas are better able to process excess
loads within basin and hence mitigate increasing fluxes at river mouth.
Although the current model addresses nitrogen processes and transformations
within the river basin in a lumped fashion, we do not claim to provide an exhaustive
accounting of the individual processes on a spatially distributed level. A greater
understanding of the sequestration and storage of nitrogen in regrowing systems as
well as the spatially explicit nature of denitrification across the landscape and
within aquatic systems is needed, neither of which is expressly addressed in the
current model. We are also limited by the non-specificity of currently available
global crop assignment data sets. In addition, seasonal aspects of land based and
aquatic processes and activities including seasonal cropping and fertilizer appli-
cation as well as variations in natural and crop fixation throughout the year require
further analysis.
Central to a comprehensive understanding of the dynamics of nitrogen transport
in river systems is the increased availability of monitoring data which is not uni-
formly available for all parts of the global. An increase in the availability of in-
stream measurements at river mouths and along reaches for constituents will greatly
facilitate future modeling initiatives by providing a known baseline for calibration
and comparison of model results. Lack of observed data is expressly crucial for the
101

developing world where a limited amount of information is currently available. Of
particular importance is the availability of monitoring data for intra-annual time
series and/or climatologies to enhance our understanding and modeling of seasonal
variations of nutrients throughout the world. The current analysis is an important
first step towards modeling of monthly and seasonal nitrogen fluxes to the coastal
zone at the global scale.
Acknowledgements
This work was supported by funding (to UNH) from NASA SeaWIFS Project
(NAG5-10260, NAG5-12451), Office of Naval Research (ONR) (N00014-01-1-
0357), and NASA Interdisciplinary Science (IDS) (NAG5-10135). This work was
initially spearheaded as a part of the International SCOPE Nitrogen Project, which
received support from both the Mellon Foundation and from the National Center for
Ecological Analysis and Synthesis (NCEAS) in Santa Barbara, California. Special
thanks to Joe Salisbury, Janet Campbell, Dave Meeker, Mark Dowell, Bill
McDowell, Ernst Linder, Balazs Fekete, Richard Lammers and Bob Howarth for
useful discussion during the development of this project and Stanley Glidden for his
continued support. We appreciate the input of the two anonymous reviewers and
recognize their contribution to the publication of this paper.
References
Alexander R.B., Slack J.R., Ludtke A.S., Fitzgerald K.K. and Schertz T.L. 1995. US Geological Survey
National Stream Water-Quality Monitoring Networks (WQN), USGS Digital Data Series DDS-37.
Alexander R.B., Smith R.A. and Schwarz G.E. 2000. Effect of stream channel size on the delivery of
nitrogen to the Gulf of Mexico. Nature 403(6771): 758–761.
Billen G. and Garnier J. 1999. Nitrogen transfers through the Seine drainage network: a budget based on
the application of the ‘Riverstrahler’ model. Hydrobiologia 410: 139–150.
Bouwman A.F. and Boumans L.J.M. 2002. Estimation of Global NH3 volatilization loss from synthetic
fertilizers and animal manure to arable lands and grasslands. Biogeochem. Cy. (in press).
Bouwman A.F., Lee D.S., Asman W.A.H., Dentener F.J., Van Der Hoek K.W. and Olivier J.G.J. 1997. A
Global High-Resolution Emission Inventory for Ammonia. Global Biogeochemical Cycles 11(4):
561–587.
Boyer E.W., Goodale C.L., Jaworsk N.A. and Howarth R.W. 2002. Anthropogenic nitrogen sources and
relationships to riverine nitrogen export in the northeastern USA. Biogeochemistry 57(1): 137–169.
Caraco N. and Cole J. 1999. Human impact on nitrate export: an analysis using major world rivers.
Ambio 28: 167–170.
Cleveland C.C., Townsend A.R., Schimel D.S., Fisher H., Howarth R.W., Hedin L.O., Perakis S.S., Latty
E.F., Von Fischer J.C., Elseroad A. and Wasson M.F. 1999. Global patterns of terrestrial biological
nitrogen (N2) fixation in natural systems. Global Biogeochem. Cy. 13: 623–645.
Covich A.P. 1993. Water and ecosystems. In: Gleick P.H. (ed) Water in Crisis: A Guide to the World’s
Fresh Water Resources. Oxford University Press, Oxford, pp. 40–55.
Dentener F.J. and Crutzen P.J. 1994. A three dimensional model of the global ammonia cycle. J. Atmos.
Chem. 19: 331–369.
Donner S.D., Coe M.T., Lenters J.D., Twine T.E. and Foley J.A. 2002. Modeling the impact of hydro-
logical changes on nitrate transport in the Mississippi River Basin from 1955 to 1994. Global Bio-
geochem. Cy. 16(3): 1043.
102

Elvidge C.D., Baugh K.E., Kihn E.A., Kroehl H.W. and Davis E.R. 1997. Mapping city lights with
nighttime data from the DMSP operational linescan system. Photogrammetric Eng. Remote Sensing
63(6): 727–734.
(EDC) Earth Resources Observation Systems (EROS) Data Center 2000. Global Land Cover Char-
acterization. EROS Data Center Distributed Active Archive Center. http://edcdaac.usgs.gov/.
Environmental Systems Research Institute, Inc. (ESRI) 1995. Arc World Supplement, 1:3 M scale digital
map. Environmental Systems Research Institute, Inc., Redlands, CA.
Food and Agriculture Organization of the United Nations (FAO) 2001. FAOSTAT: FAO Statistical
Databases. Accessible through the Food and Agriculture Organization of the United Nations. http://
apps.fao.org/.
Fekete B.M., Vorosmarty C.J. and Grabs W. 1999. Global, Composite Runoff Fields Based on Observed
River Discharge and Simulated Water Balances. WMO-Global Runoff Data Center Report #22.
Koblenz, Germany.
Fekete B.M., Vorosmarty C.J. and Grabs W. 2002. High-resolution fields of global runoff combining
observed river discharge and simulated water balances. Global Biogeochem. Cy. 16(3): 1042.
Galloway J.N., Dentener F.J., Capone D.G., Boyer E.W., Howarth R.W., Seitzinger S.P., Asner G.,
Cleveland C., Green P.A., Holland E., Karl D.M., Michaels A.F., Porter J., Townsend A. and Vor-
osmarty C.J. 2003. Global and regional nitrogen cycles: past, present and future. Biogeochemistry
(submitted).
Goolsby D.A. and Battaglin W.A. 2001. Long-term changes in concentrations and flux of nitrogen in the
Mississippi River Basin, USA. Hydrol. Process 15(7): 1209–1226.
Hession W.C., McBride M. and Bennett M. 2000. Statewide non-point-source pollution assessment
methodology. J. Water Res. PL-ASCE 126(3): 146–155.
Hobbie J.E. (ed) 2000. Estuarine Science: A Synthetic Approach to Research and Practice. Island Press,
Washington, DC, 539 pp.
Hopkinson C.S. and Vallino J.J. 1995. The relationships among mans activities in watersheds and
estuaries – a model of runoff effects on patterns of estuarine community metabolism. Estuaries 18(4):
598–621.
Howarth R.W. 1998. An assessment of human influences on fluxes of nitrogen from the terrestrial
landscape to the estuaries and continental shelves of the North Atlantic Ocean. Nutr. Cy. Agroecosyst.
52(2–3): 213–223.
Howarth R.W., Billen G., Swaney D., Townsend A., Jaworski N., Lajtha K., Downing J.A., Elmgren R.,
Caraco N., Jordan T., Berendse F., Freney J., Kudeyarov V., Murdoch P. and Zhu Z.L. 1996. Regional
nitrogen budgets and riverine N&P fluxes for the drainages to the North Atlantic Ocean: natural and
human influences. Biogeochemistry 35(1): 75–139.
Howarth R.W., Boyer E.W., Pabich W.J., andGalloway J.N. 2002. Nitrogen use in the United States from
1961–2000 and potential future trends. AMBIO 31(2): 88–96.
Jaworski N.A., Howarth R.W. and Hetling L.I. 1997. Atmospheric deposition of nitrogen oxides onto the
landscape contributes to coastal eutrophication in the northeast United States. Environ. Sci. Technol.
31(7): 1995–2004.
Jordan T.E., Correll D.L. and Weller D.E. 1997. Nonpoint source discharges of nutrients from Piedmont
watersheds of Chesapeake Bay. J. Am. Water Resour. As. 33(3): 631–645.
Justic D., Rabelais N.N., Turner R.E. and Dortch Q. 1995. Stoichiometric nutrient balance and origin of
coastal eutrophication. Marine Pollut. Bull. 30: 41–46.
Kroeze C. and Seitzinger S.P. 1998. The impact of land use on N2O emissions from watersheds draining
into the Northeastern Atlantic Ocean and European Seas. Environ. Pollut. 102(Suppl.): 149–158
Lerman A., Imboden D.M. and Gat J.R. 1995. Physics and Chemistry of Lakes. Springer-Verlag, Berlin
and Heidelberg GmbH and Co. KG.
Lerner J., Matthews E. and Fung I. 1988. Methane emissions from animals: a global high-resolution data
base. Global Biogeochem. Cy., 2: 139–156.
Leopold L.B., Wolman M.G. and Miller J.P. 1964. Fluvial Processes in Geomorphology. Freeman, New York.
Ludwig W. and Probst J.L. 1996. Predicting the oceanic input of organic carbon by continental erosion.
Global Biogeochem. Cy. 10: 23–41.
103
Ludwig W. and Probst J.L. 1998. River sediment discharge to the oceans: present-day controls and global
budgets. Am. J. Sci. 298: 265–295.
Mackenzie F.T., Ver L.M., Sabine C., Lane M. and Lerman A. 1993. C, N, P, S biogeochemical cycles
and modeling of global change. In: Wollast R., Mackenzie T., Chou L. (eds) Interactions of C, N, P
and S Biogeochemical Cycles and Global Change. NATO ASI Series I, 4, Springer-Verlag, New York,
pp. 1–62.
McEvedy C. and Jones R. 1978. Atlas of World Population History. Penguin, New York.
Melillo J.M., McGuire A.D., Kicklighter D.W., Moore III B., Vorosmarty C.J. and Schloss A.L. 1993.
Global climate change and terrestrial net primary production. Nature 363: 234–240.
Meybeck M. 1993. Riverine transport of atmospheric carbon – sources, global typology and budget.
Water Air Soil Pollut. 70(1–4): 443–463.
Meybeck M. 1995. Global distribution of lakes. In: Lerman A. (ed) Physics and Chemistry of Lakes.
Springer-Verlag, Berlin and Heidelberg GmbH and Co. KG.
Meybeck M. and Ragu A. 1995. River discharges to the Ocean: an assessment of suspended solids, major
ions and nutrients. Laboratoire de Geologie Appliquee, Universite P. et M. Curie, Paris, France.
Meybeck M. and Ragu A. 1997. River discharges to the oceans: an assessment of suspended solids,
major ions, and nutrients.UNEP/WHO/GEMS-Water, 245 pp.
Meybeck M., Green P.A., andVorosmarty C.J. 2001. A new typology for mountains and other relief
classes. An application to global continental water resources and population distribution. Mountain
Res. Dev. 21(1): 34–45.
National Assessment Synthesis Team 2001. Climate Change Impacts on the United States: The Potential
Consequences of Climate Variability and Change. Report for the US Global Change Research Pro-
gram, Cambridge University Press, Cambridge, UK. http://www.usgcrp.gov/ or http://www.cam-
bridge.org/.
National Research Council (NRC) 1985. Nutrient Requirements of Domestic Animals Series. Committee
on Animal Nutrition. National Academy Press, Washington, DC.
Organization for Economic Co-Operation and Development (OECD) 1999. OECD Environmental Data –
Compendium 1999, OECD, Paris.
Peterson B.J., Wollheim W.M., Mulholland P.J., Webster J.R., Meyer J.L., Tank J.L., Marti E., Bowden
W.B., Valett M., Hershey A.E., McDowell W.H., Dodds W.K., Hamilton S.K., Gregory S. and Morrall
D.D. 2001. Control of nitrogen export from watersheds by headwater streams. Science 292: 86–90.
Pionke H.B., Gburek W.J., Schnabel R.R., Sharpley A.N., andElwinger G.F. 1999. Seasonal flow, nu-
trient concentrations and loading patterns in stream flow draining an agricultural hill-land watershed.
J. Hydrol. 220(1–2): 62–73.
Russell M.A., Walling D.E., Webb B.W. and Bearne R. 1998. The composition of nutrient fluxes from
contrasting UK river basins. Hydrol. Process 12(9): 1461–1482.
Seitzinger S.P., Kroeze C., Bouwman A.F., Caraco N., Dentener F. and Stylkes R.V. 2002a. Global
patterns of dissolved inorganic and particulate nitrogen inputs to coastal systems: recent conditions
and future projections. Estuaries 25(4b): 640–655.
Seitzinger S.P., Styles R.V., Boyer E.W., Alexander R.B., Billen G., Howarth R.W., Mayer B. and van
Breemen N. 2002b. Nitrogen retention in rivers: model development and application to watersheds in
the northeastern USA. Biogeochemistry 57/58: 199–237.
Smil V. 1999. Nitrogen in crop production: an account of global flows. Global Biogeochem. Cy. 13:
647–662.
Steel E.W. and McGhee T.J. 1979. Water Supply and Sewerage. McGraw-Hill, New York.
Syvitski J.P., Morehead M.D., Bahr D.B. and Mulder T. 2000. Estimating fluvial sediment transport: the
rating parameters. Water Resour. Res. 36(9): 2747–2760.
Turner R.E. and Rabelais N.N. 1994. Coastal eutrophication near the Mississippi river delta. Nature 368:
619–621
(UN-Habitat) United Nations Human Settlements Programme 2001. Global Urban Indicators Version 2
(Year of Reference – 1998). http://www.unhabitat.org/programmes/guo.
Van Dretch G., Bouwman A.F., Knoop J.M., Meinardi C. and Beusen A. 2001. Global pollution of
surface waters from point and nonpoint sources of nitrogen. In: Optimizing Nitrogen Management in
104

Food and Energy Production and Environmental Protection: Proceedings of the 2nd International
Nitrogen Conference on Science Policy The Scientific World 1(S2), pp. 632–641.
Ver L.M., Mackenzie F.T. and Lerman A. 1999. Carbon cycle in the coastal zone: effects of global
perturbations and change in the past three centuries. Chem. Geol. 159: 283–304.
Vorosmarty C.J. and Meybeck M. 2003. Responses of continental aquatic systems at the global scale:
new paradigms, new methods. In: Kabat P., Claussen M., Dirmeyer P.A., Gash J.H.C., Bravo de
Guenni L., Meybeck M., Pielke Sr. R.A., Vorosmarty C.J., Hutjes R.W.A. and Lutkemeier S. (eds)
Vegetation, Water, Humans and the Climate. IGBP BAHC, Potsdam, Germany, pp. 517–572.
Vorosmarty C.J. and Peterson B.J. 2000. Macro-scale models of water and nutrient flux to the coastal
zone. In: Hobbie J.E. (ed) Estuarine Science: A Synthetic Approach to Research and Practice. Island
Press, Washington, DC.
Vorosmarty C.J., Federer C.A. and Schloss A.L. 1998. Evaporation functions compared on US water-
sheds: Possible implications for global-scale water balance and terrestrial ecosystem modeling. J.
Hydrol. 207(3–4): 147–169.
Vorosmarty C.J., Fekete B.M., Meybeck M. and Lammers R.B. 2000a. Global system of rivers: its role in
organizing continental landmass and defining land-to-ocean linkages. Global Biogeochem. Cy. 14(2):
599–621.
Vorosmarty C.J., Fekete B.M., Meybeck M. and Lammers R.B. 2000b. Geomorphometric attributes of
the global system of rivers at 30-minute spatial resolution. J. Hydrol. 237(1–2): 17–39.
Vorosmarty C.J., Green P.A., Salisbury J. and Lammers R.B. 2000c. Global water resources: vulner-
ability from climate change and population growth. Science 289: 284–288.
Wollheim W.M., Peterson B.J., Deegan L.A., Hobbie J.E., Hooker B., Bowden W.B., Edwardson K.J.,
Arscott D.B., Hershey A.E. and Finlay J. 2001. Influence of stream size on ammonium and suspended
particulate nitrogen processing. Limnol. Oceanogr. 46(1): 1–13.
World Resources Institute (WRI) 1998. World Resources: A Guide to the Global Environment 1998–
1999. World Resources Institute, Washington, DC.
105