Embed Size (px)
Citation preview
Journal of Multidisciplinary Engineering Science and Technology (JMEST)
ISSN: 2458-9403
Vol. 7 Issue 8, August - 2020
www.jmest.org
JMESTN42353493 12555
Pre And Post Privatisation Assessment Of Transcorp Power Gas Turbine Plants Using
Standard Key Performance Indicators
Okoye, Arinze. E. Department of Mechanical Engineering
University of Benin
Benin City, Nigeria
Abstract— This research work aims at assessing, using Key
Performance Indicators as recommended by The Nigerian
Electricity Regulatory Commission, (NERC), the performance
of Transcorp Power Limited Power Plants, Ughelli, Delta State,
for the period 2008-2015, to determine if the Privatisation of the
PHCN has been effective.
Parameters for assessing the gas turbine units and the overall
station performance were collected from the power station.
These data which includes installed and available capacity of
plants, Number of hours run, Peak load values, Average
generation in (MW), Number of trip records, Heat Supplied
and Energy generated by each gas turbine and the overall
station, pre and post privatisation of the facility, were collated
and analysed with the aid of Microsoft Excel Spreadsheet to
obtain the needed results.
Result shows that pre-privatisation (2008 -2012), Total Energy
generated by the station were valued at 1,510,988.0 MWh and
1,582,696.90MWh in 2008 and 2009 respectively as against 2014
and 2015 that were estimated at 2,804,067.20MWh and
2,894,031.80MWh respectively. Energy exported to the grid,
pre-privatisation was estimated at 1,486,338.02MWh and
1,539,157.35MWh for 2008 and 2009 respectively, and post-
privatisation values were 2,671,872.20MWh and
2804575.94MWh in 2014 and 2015 respectively. The capacity
factor peak values were 73.53% in 2008 and 71.60% in 2009
while 2014 and 2015 recorded all-time peak values of 89.24%
and 81.23% by GTs 16 and 17 respectively. Generation
Utilization Index in 2008, 2009 and 2010 averaged at 77.77%,
76.73% and 66.14% respectively whereas, it averaged at 85.34
% and 76.74% for 2014 and 2015 respectively. There were also
better performances in peak load values, Number of hours run,
etc, post-privatisation than it was pre-privatisation of
Transcorp Power Limited, Ughelli. From these results, it can be
inferred that the generating units were underutilized pre-
privatisation period.
Keywords—Transcorp Power Limited; Nigeria Power Sector;
Gas turbine; Privatisation; Thermal efficiency; Power
Generation; Gas consumption; Power Privatisation
I. INTRODUCTION
Substantial expansion in quantity, quality, and access to
infrastructure services, especially electricity, is fundamental
to rapid and sustained economic growth and poverty
reduction. Yet, for the past four decades, inadequate
quantity, quality and access to electricity services have been
a regular feature in Nigeria [1].
In Nigeria, access to reliable and stable supply of electricity
is a major challenge for both the urban and rural dwellers.
The challenge, however, is more significant in the rural areas
where only about 10% of the population has access to
electricity [2]. Nigeria’s electricity demand far outstrips the
supply, which is epileptic in nature. The acute electricity
supply hinders the country’s development and not only
restricts socio-economic activities to basic human needs; it
adversely affects quality of life [4].
The objective of the electric energy system is to provide the
needed energy services [3]. Energy services are the desired
and useful products, processes or indeed services that result
from the use of electricity, such as for lighting, powering of
electrical appliances etc. [5].
The electricity consumption in Nigeria is extremely low due
to inadequate supply. As of 2011, electricity consumption
stood at just 149kwh per capita [6] and dropped to 144kWh
by 2014 [7]. At 149kWh per capita, Nigeria’s electricity
consumption is one of the lowest in the world, about 4times
less than the African average (563kWh per capita) and 17
times less than the world’s average of 2596kWh per capita
[8].
Most of Nigeria’s Power Facilities were being managed by
the defunct Power Holding Company of Nigeria (PHCN), a
public sector charged by law for the generation,
transmission, distribution, or marketing and sales of
electricity to the public in Nigeria [9]. until the Electric
Power Sector Reform (EPSR) Act of 2005 and the
consequent unbundling and privatisation of the sector that
has permitted Independent Power Producers (IPPs) to obtain
licenses to generate electricity.
Prior to privatisation and unbundling process, Nigeria’s
electricity generation has always hovered between 2000 to
4000MW of available capacity, not much has changed after
the privatisation process. This forms the background of study
for this research work: to overview the power sector and
assess with some performance indicators associated with the
gas turbine power plants, the Performance Of Transcorp
Power Limited, Ughelli, pre and post privatisation,
ascertaining if the unbundling process was a step in the right
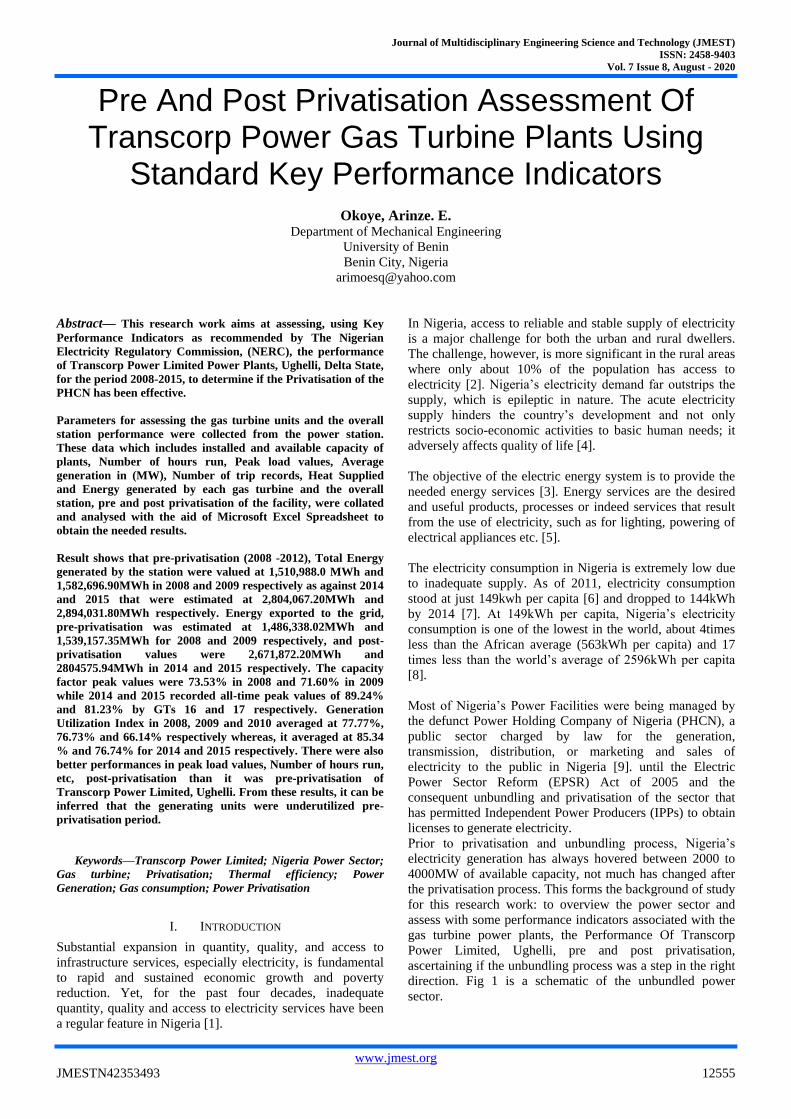
direction. Fig 1 is a schematic of the unbundled power
sector.
Journal of Multidisciplinary Engineering Science and Technology (JMEST)
ISSN: 2458-9403
Vol. 7 Issue 8, August - 2020
www.jmest.org
JMESTN42353493 12556
Fig 1: Structure of the Nig. Power Sector Post-Privatisation
II. GAS TURBINES IN TRANSCORP POWER
LIMITED, UGHELLI, DELTA STATE
The station was built in 1964 with an installed capacity of
2X36MW (72MW), from two Stal-Laval gas turbines. Then,
the station was called Delta I under Electricity Corporation
of Nigeria (ECN).
In 1975, six units of General Electric (GE) Frame 5 gas
turbines (20MW each) were installed in the station known as
Delta II, after the merger of Niger Dam Authority (NDA),
Kainji and the ECN to form the National Electric Power
Authority (NEPA).
In 1978, additional six units of GE Frame 5 gas turbines, like
the ones installed in 1975, were added, (Known as Delta III)
to boost the installed capacity to a total of 312MW, as
follows:
Delta I, 2X36 72MW
Delta II, 6X20 120MW
Delta III, 6X20 120MW
Total 312MW
The station was upgraded in 1991 with the addition of 6 X
100MW (600MW) GE Frame 9 gas turbines. From 2000 to
2008, Delta II and Delta III GE units were upgraded to
150MW station each: built by Hitachi of Japan. The control
systems were upgraded to Mark V, a fully computerized
control system for Delta II and III. While Delta I was
scrapped. Delta IV control system was also upgraded to
Mark V by GE of USA which built the station. Today, the
installed generation capacity of Transcorp Power stands at
900MW. Most of the electricity produced by Transcorp
Power is transported through a network of conductors, to the
national grid.
A. Generators in Transcorp Power Limited, Ughelli
Delta II and Delta III are Horizontal Shaft types and have
ratings of 11/11.5kv from original manufacturers. (Siemens
and Maidensha) with an operating speed of 3000rpm. Delta
IV generator is a horizonatal shaft with torque adjuster and
coupling.
B. Raw Materials for production
Transcorp Power Ughelli gets supply of natural gas from
Shell Petroleum Development Company (SPDC) for Delta II
& III at a gas pressure of 21 – 22bars and Nigeria Gas
Company (NGC) for Delta IV at a gas pressure of 19 –
21bars, but both SPDC and NGC can complement each other
in times of emergency through a tripartite gas line valve.
The other major raw material is the atmospheric air that is
filtered and compressed. Part of the air is used for cooling
and atomization of the diesel fuel (where need be) for
combustion during operation. Most part of the compressed
air is used for the combustion in the combustion chambers,
with the natural gas.
Hydrogen is used in cooling the heavy generators at Delta IV
because of the enormous heat that the generator windings
emit. Hydrogen cools ten times better than air, hence its
preference for air despite its high inflammability. The
hydrogen is generated locally, from the electrolysis of water.
Lube oil or lubricant oil is used in the gas turbine station for
lubrication of the bearings, for hydraulic pressure and heat
extraction.
C. Components and Auxiliaries of the Gas Tubine Plants at
Transcorp Power Limited, Ughelli
i. The starting device – a 3.3kV starting motor or
prime mover in a black start system.
ii. The air-filter arrangement
iii. The compressor
iv. The combustion chambers
v. The turbines
vi. The expansion below or exhaust
vii. The generator
viii. The exciter
D. The Piping Arrangement at Transcorp Power Limited,
Ughelli, Delta State
Piping arrangement is as follows:
i. The gas supply piping
ii. The lube oil piping
Journal of Multidisciplinary Engineering Science and Technology (JMEST)
ISSN: 2458-9403
Vol. 7 Issue 8, August - 2020
www.jmest.org
JMESTN42353493 12557
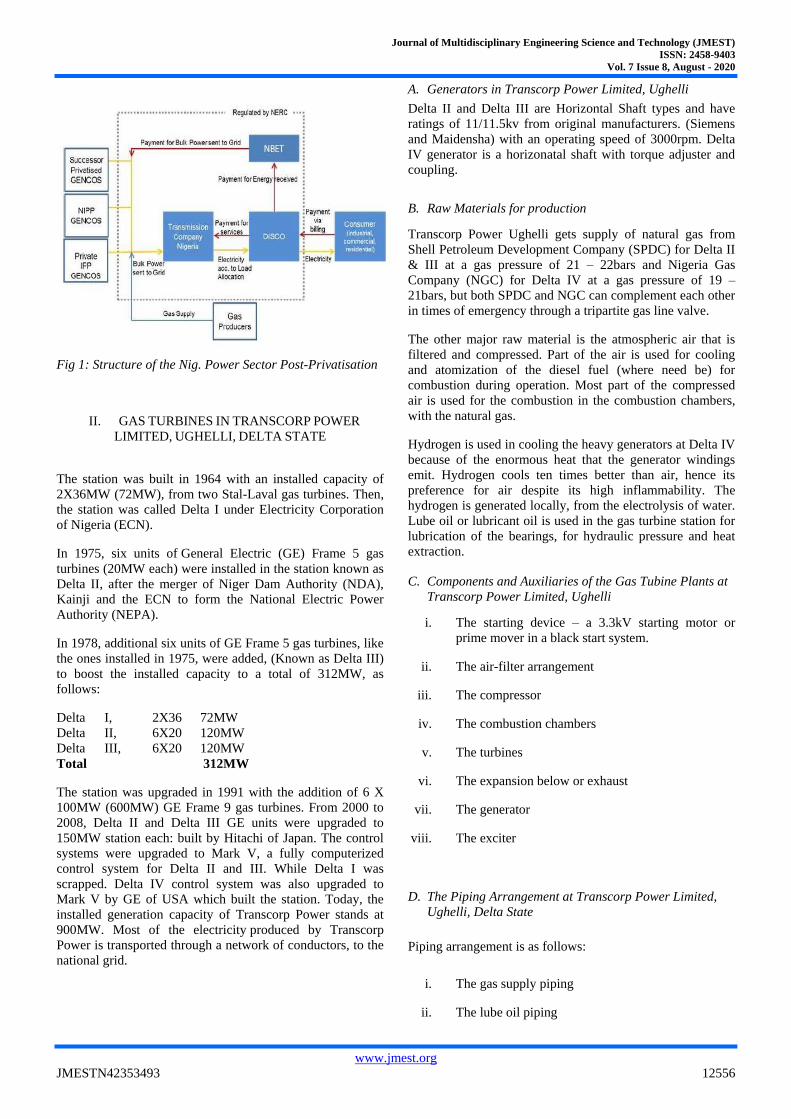
iii. The hydraulic oil piping
iv. The cooling water piping
v. The air piping
vi. The hydrogen piping
vii. The CO2 piping
Fig 2: Piping Arrangement in Transcorp Power, Ughelli
E. Method of Electricity Production
The gas turbine use natural gas and compressed air as fuel to
burn and rotate the shaft that turns the generator thereby
generating electricity. Excitation is necessary to produce the
required magnetic flux. Most of the electricity is transported
through step up transformers and network of conductors to
various location around the country in the form of grid.
Some parts of the electricity are utilized locally within and
outside the plant.
F. Hydrogen Gas Production Plant
Hydrogen gas (H2) is produced in the station for cooling the
heaven General Electronics (GE) turbine generators of Delta
IV.
Plant Details:
Model: 00700
Capacity: 2 x 15Nm3/h
Frequency: 50Hz
Date of Commissioning: 1998/1999
G. Antifire System
The plant is equipped with sprinkler and hydrant fire fighting
systems with automatic CO2 high sensitive flame detector
and combating mechanics for fire emergency.
H. The Station’s Switchyard
The Delta IV 330kV Highyard is configured to 1 1/2 breaker
system to evacuate generated electricity from six (6) units of
6 x 100 Megawatts (600MW) of the plant into the national
grid for onward distribution to power consumers [10].
III. MATERIALS AND METHODS
Ughelli Power, now Transcorp Power Limited, Ughelli,
Delta State is among the 18 electricity successor companies
unbundled from Power Holding Company of Nigeria
(PHCN). Owing to various changes in the Federal
Government policies in the electricity industry from 1973 to
2009, Transcorp Power has on various occasions changed its
name and outlook.
3.1. OVERVIEW OF TRANSCORP POWER
LIMITED
i. Over 52 years of Service.
ii. Transcorp Power has four (4) power plants, Delta I,
Delta II, Delta III & Delta IV with the “Delta I
retired”.
iii. Transcorp power has an installed capacity of
900MW.
iv. Custom fitted Engine starters in Delta II and Delta
III turbines enables the station to black start the
National Grid in case of emergency or cases of total
or partial system collapses.
v. Transcorp Power provides auxiliary facilities for
staff, such as: Staff Housing, Medicare, School and
Recreational Club.
vi. Transcorp Power Limited has five major
departments: The Operations Department, The
Efficiency Department, Performance Management
and Planning Department, Health, Safety and
Environment Departs, Plant Maintenance
Department which includes Mechanical
Maintenance Department, Electrical and Control
Department, Protection, Communication and
Metering Department, Workshop Services
Department, Civil and Estate Department.
.
3.2 DESCRIPTION OF EACH STATION
DELTA I
Journal of Multidisciplinary Engineering Science and Technology (JMEST)
ISSN: 2458-9403
Vol. 7 Issue 8, August - 2020
www.jmest.org
JMESTN42353493 12558
This station used to house the two numbers stal-laval units of
36MW each. These units have since been scrapped. Plans
existed for fresh packaged gas turbines installation in the
spaces provided.
The main blocks of Delta 1 serve as offices of the two
Assistant General Managers (Plant Services and production),
some other principal managers and mechanical/vehicle
workshops.
The operational switchings in Delta 1 and 2 (132/33kV) Hi-
yard are performed by the TCN operators, while the local
lightings for the offices in Delta 1 and around are powered
from the switchyard through the 33/0.415kV transformer.
The radiating feeders in Delta 1 switch yard include:
i. Benin 132kV Line 1 and 2
ii. Effurun 132kV Line
iii. Ughelli Old Road 33kV feeder
iv. Isoko/Ughelli 33kV feeder
v. Agbarho/Eku 33kV feeder
vi. Aladja 33kV feeder
vii. Shell 33kV feeders 1 and 2.
These 33 kV feeders are served through 2Nos 132/33kV
(45/30 MVA) transformers.
DELTA II
This station comprises of 6x25MW (H25 Hitachi) units, on a
total installed capacity of 150MW; (GTs 3, 4, 5, 6, 7, 8) The
station is served gas mainly from SPDC-Ughelli East Gas
Plant at pressure ranging from 20-22 bars. Some of these
GTs often trip on faults involving compressor, bleed valve
position problem, exciter problem, starting (diesel) problems
etc.
GTs 3 and 5 has been out of service since 2007 due to
generator fault caused by wrong phase termination between
the 132kV main bus, transformer and units generators.
GT 4 was out of service due to starting device problems and
confirmation of 81MVA transformer (T3) status from TCN
since 2007 but came into operation in 2011.
DELTA III
This station also comprises of 6x25MW (H125 Hitachi) units
on a total installed capacity of 150MW. The units operate on
natural gas pressure range of 20-22bars from mainly SPDC-
Ughelli East Gas Plant.
The main problems that occur on the Delta 3 units are similar
to that of Delta 2. Such problems include inadequate gas
supplies from SPDC, Major excitation problems, Mark V,
Uninterrupted Power Supply (UPS) and monitor failures,
vibration; oil leaks etc. the source of supply to the units on
cranking motor on 3.3kV is still on temporary facility from
Delta IV (132/3.3kV) starting transformer. Efforts should be
made to install a separate and permanent source from Delta 3
switchyard as originally designed.
Lack of statutory inspections on the units based on exceeded
Expected Operating Hours (EOH) is likely to cause
unpredicted outages on these units with time.
DELTA IV
This is a station of 6x100MW (GE) units on a total installed
capacity of 600MW. Common problems in Delta 4 pre-
privatisation include:
i. Cooling water pump failures
ii. Cranking motor failures
iii. Accessory gear box failures
iv. Hot exciter/PCC rooms
v. Torque converter failure
vi. Flame detector/ignition failures
vii. Hydrogen leaks problems
viii. Oil ingress to the generator due to oil seal damages
ix. Seal oil differential failure
x. Air inlet filter problems
xi. Exhaust system failure [10]
3.2 OPERATION DATA USED FOR ANALYSIS
With the ongoing government effort to boost power
generation in the country, it is very important to monitor the
performance of operating generation companies in the
country and assess whether they are making use of their
resources efficiently and effectively towards electricity
generation.
The parameters used for this assessment and comparative
analysis of Transcorp Power Limited are the recommended
Key Performance Indicators (KPI) from National Electricity
Regulatory Commission [11].
The monthly/annual generation performances are dependent
on these factors:
i. Energy Generated (MWh): This gives account of
the daily, monthly and annual energy production
from the available plants for the periods under
consideration. It is a measure of the energy
generated in MW and the number of hours, run (h).
ii. Energy Consumed (MWh): Energy consumed in
MWh is an account of energy that is used in-house
at Transcorp Power Limited for powering major
equipments, facilities and offices.
iii. Energy Exported (MWh): This gives account of the
value of energy sent out in MWh to the national
grid for onward transmission and distribution. Most
of the electricity is evacuated through step-up
transformers and network of conductors through
various locations around the country. Energy
exported to the grid is simply Energy Generated
(MWh) less Energy consumed in the stations.
iv. Running Hours: This denotes the recorded time in
hours run by each plant for the periods under
consideration.
v. Unit Trip Records: Trip records show how much
frequency each unit was not under operation due to
several reasons ranging, from maintenance to
damage. Higher trip records for a unit plant would
contribute to poor performance and low percentage
contribution of the plant to the station’s generation.
vi. Gas Supplied and Consumed By the Station:
Transcorp Power Limited, Ughelli gets supply of
natural gas from Shell Petroleum Development
Journal of Multidisciplinary Engineering Science and Technology (JMEST)
ISSN: 2458-9403
Vol. 7 Issue 8, August - 2020
www.jmest.org
JMESTN42353493 12559
Company (SPDC) for Delta II and III at a gas
pressure of 21-22bars, and from Nigeria Gas
Company (NGC) for Delta IV at a gas pressure of
19-21bars. Both SPDC and NGC can complement
each other in times of emergency through a
tripartite gas line valve.
3.3 METHODOLOGY
The following parameters were used in assessing individual
units and overall station performance within the periods
under review; 2008-2015. These Key Performance Indicators
(KPIs) provide a useful measure of how well a power plant is
operated and managed.
Data for this study were obtained from Transcorp Power gas
turbine power station’s data bank via the assistance of the
company’s Efficiency Department. These are inventory
records of monthly energy generation between 2008 and
2015 and operational statistics showing the period when each
of the plant units had major outages. Data collected includes:
i) Energy Generated in MWh
ii) Energy Consumed in MWh
iii) Energy Exported to the Grid MWh
iv) Gas consumed in Standard Cubic Foot (SCF)
v) Unit Trip Records
vi) Load Factor
vii) Installed Capacity & Available Capacity in MW
Equations employed for this work are as contained in [12].
3.3.1 Capacity Factor (CF): The extent of use of the
generating plant is measured by the Capacity Factor (CF)
which is the ratio of the average energy output of a unit plant
for a given period of time to the plant capacity.
Thus, the characteristic behavior of generating plant depends
substantially on the capacity factor and utilization factor.
High capacity factor is desired for economic operation of the
plant. Values of capacity factors are normally expressed in
percentages
3.3.2 Availability Factor (AF): This is the ratio of the
actual time the unit was in service to the total interval under
consideration. The more the availability factor, the better
the total output and performance. Values are best expressed
in percentages.
3.3.3 Load Factor (LF): This is the ratio of the average
load to the maximum demand for a particular period. Since
the average load is always less than the maximum demand,
load factor is always less than unity. Load factor values are
expressed in percentages.
Since facilities likely never operate at full capacity for the
duration of an entire 24-hour day. A high load factor means
power usage is relatively constant.
3.3.4 Generation Utilization Index (GUI): Otherwise
known as the utilization factor is the ratio of the maximum
demand to the rated capacity of the power plant. The
utilization factor measures the use of the total installed
capacity of the plant. Values of GUI are best expressed in
percentages. Higher values indicate a better performance and
effective utilization of plants.
3.3.5 Units Contribution to Station’s Total Output
(UCT): This is the ratio of the total energy generated by a
unit (plant) in a given time to the total energy generated by
the station in the same period. A higher percentage
contribution to the total output by a plant means a desirable
performance of that plant. These values are normally
expressed in percentages.
3.3.6 Thermal Efficiency: This simply represents the
fraction of heat in terms of gas supplied that is converted to
work (Energy generated). It is a dimensionless performance
measure of a heat engine that uses thermal energy. In
general, efficiency of even the best heat engines is quite low.
Best Thermal efficiency usually is less than 40% due to
several reasons ranging from power required to drive the
compressor, friction and heat losses, design inefficiency etc.
ASSUMPTIONS I Each unit is allowed 10days for combustion
inspection, therefore the total running hours in a year is:
24hours x (365-10) = 8520hours
2. Each unit is expected to operate at its installed
capacity [12].
RESULTS AND DISCUSSION
The summary of the data obtained is shown in the figures
below:
Journal of Multidisciplinary Engineering Science and Technology (JMEST)
ISSN: 2458-9403
Vol. 7 Issue 8, August - 2020
www.jmest.org
JMESTN42353493 12560
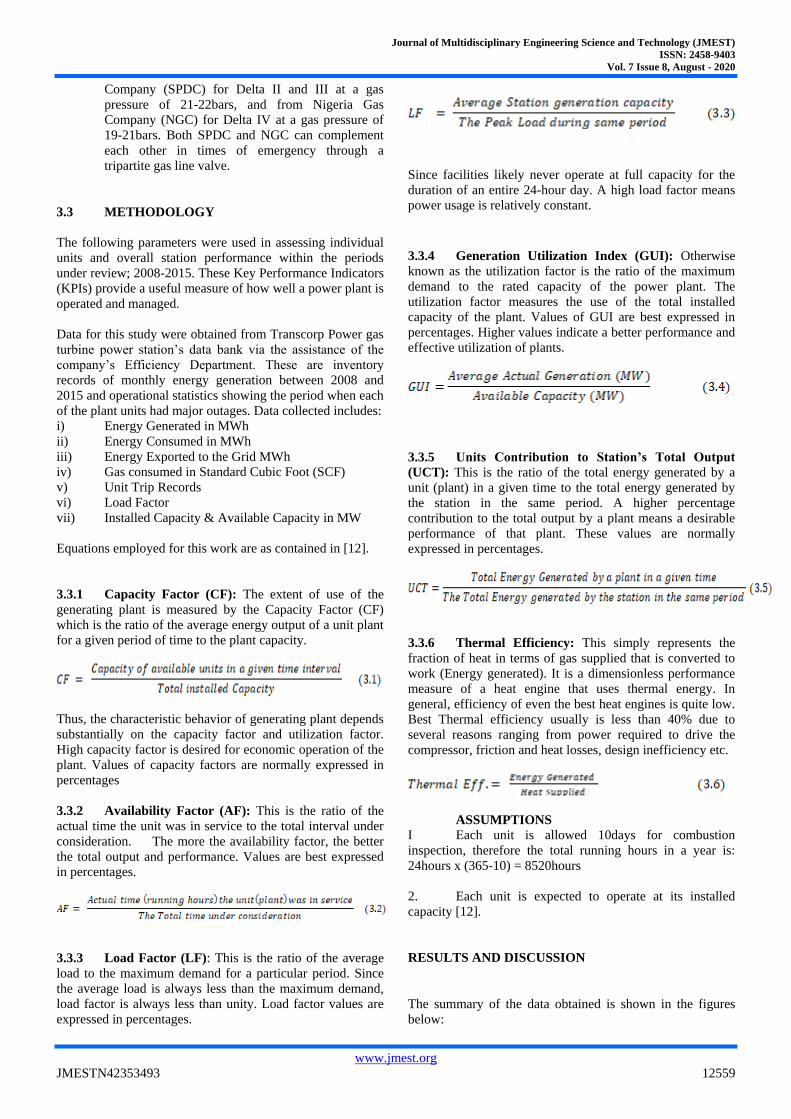
RESULTS AND DISCUSSION:
Table 1: UNIT CONTRIBUTION TO THE STATION, HOURS ROUN IN, CAPACITY FACTOR, AVAILABILITY
FACTOR (%) FOR 2008 AND 2009
INST.
Capacity
Available
Capacity
Energy Generated
(MWh)
Unit
Contribution
to Station
(%)
Hours Run Capacity
Factor (%)
Availability
Factor (%)
UNITS MW MW 2009 2008 2009 2008 2009 2008 2009 2008 2009 2008
GT 3 25 20 0 0 0.00 0.00 0.00 0.00 0.00 0.00 0.00 0.00
GT 4 25 20 0 0 0.00 0.00 0.00 0.00 0.00 0.00 0.00 0.00
GT 5 25 20 0 0 0.00 0.00 0.00 0.00 0.00 0.00 0.00 0.00 GT 6 25 20 49856 144091 3.15 9.54 3243.60 8294.30 25.44 73.53 38.07 97.35
GT 7 25 20 18799 0 1.19 0.00 1227.20 0.00 9.59 0.00 14.40 0.00
GT 8 25 20 54038 121772 3.41 8.06 3088.80 6737.20 27.58 62.14 36.25 79.08
GT 9 25 23 70692 142372 4.47 9.42 4286.30 7421.90 33.19 66.84 50.31 87.11
GT 10 25 23 66766 95950 4.22 6.35 3815.00 5039.90 31.35 45.05 44.78 59.15
GT 11 25 23 85515 90054 5.40 5.96 4665.50 7373.10 40.15 42.28 54.76 86.54
GT 12 25 23 75505 60640 4.77 4.01 5594.40 6187.10 35.45 28.47 65.66 72.62
GT 13 25 23 0 0 0.00 0.00 0.00 0.00 0.00 0.00 0.00 0.00
GT 14 25 23 85714 148607 5.42 9.84 5183.20 7803.60 40.24 69.77 60.84 91.59
GT 15 100 100 0 239889 0.00 15.88 0.00 2844.20 0.00 28.16 0.00 33.38
GT 16 100 95 0 0 0.00 0.00 0.00 0.00 0.00 0.00 0.00 0.00
GT 17 100 100 0 0 0.00 0.00 0.00 0.00 0.00 0.00 0.00 0.00
GT 18 100 100 465797 49667 29.43 3.29 5675.50 552.90 54.67 5.83 66.61 6.49
GT19 100 100 0 0 0.00 0.00 0.00 0.00 0.00 0.00 0.00 0.00
GT 20 100 100 610015 417946 38.54 27.66 7073.10 5124.30 71.60 49.05 83.02 60.14
Total 1582697 1510988 43853 57377
Ave. 20.51 26.17
Journal of Multidisciplinary Engineering Science and Technology (JMEST)
ISSN: 2458-9403
Vol. 7 Issue 8, August - 2020
www.jmest.org
JMESTN42353493 12561
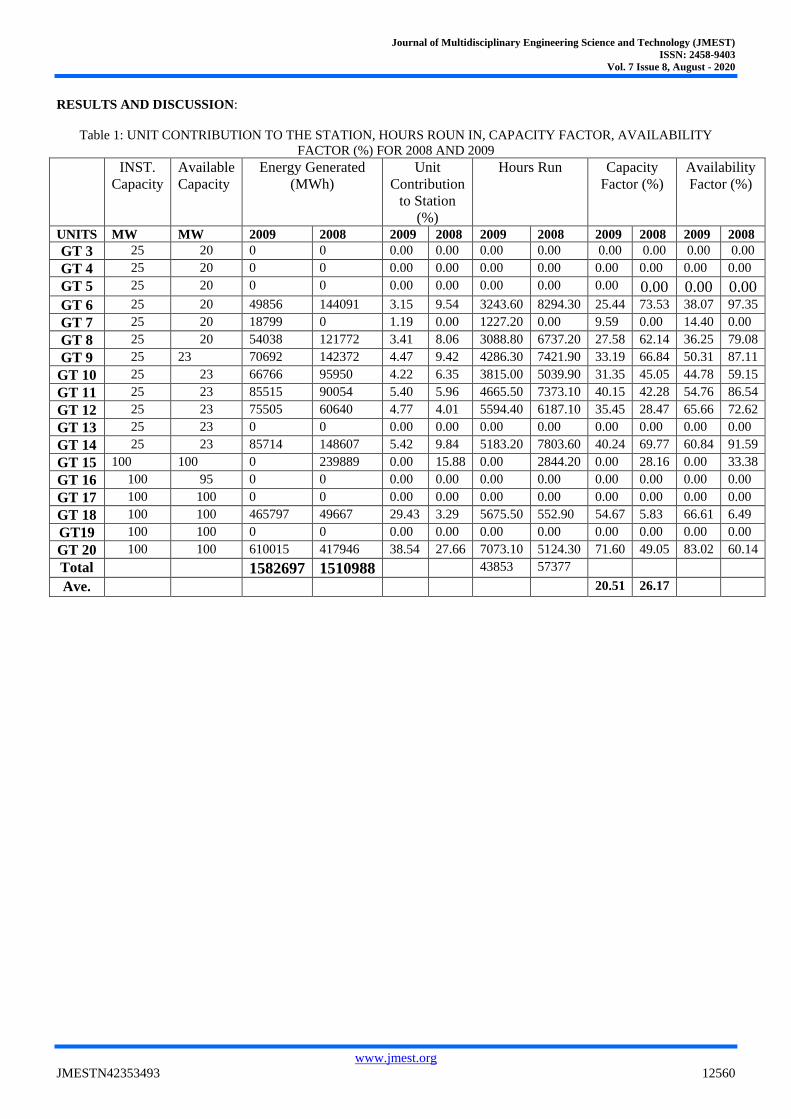
Table 2: UNIT CONTRIBUTION TO THE STATION, HOURS ROUN IN, CAPACITY FACTOR, AVAILABILITY
FACTOR (%) FROM 2010 TO 2015
INST.
Cap.
Ava
Cap.
Energy Generated (MWh) Unit Contribution to
Station (%)
Hours Run Capacity
Factor (%)
Availability
Factor (%)
UNIT
S
MW MW 2015 2014 2013 2015 2014 2013 201
5
201
4
201
3
2015 2014 2013 2015 2014 2013
GT 3 25 20 0 0 0 0.00 0.00 0.00 0 0 0 0 0 0 0 0 0
GT 4 25 20 115043 151512 62423 3.98 5.40 3.69 707
2
843
0
820
5
58.7
1
77.3
2
31.8
5
83.0
1
98.9
4
96.3
0
GT 5 25 20 0 0 0 0.00 0.00 0.00 0 0 0 0 0 0 0 0 0
GT 6 25 20 109206 13804 0 3.77 0.49 0.00 661
6
720 0 55.7
3
7.04 0 77.6
5
8.45 0
GT 7 25 20 111125 81764 0 3.84 2.92 0.00 679
7
452
5
0 56.7
1
41.7
3
0 79.7
8
53.1
1
0
GT 8 25 20 107176 135173 101901 3.70 4.82 6.02 693
7
784
2
712
0
54.6
9
68.9
8
52.0
0
81.4
2
92.0
4
83.5
7
GT 9 25 23 78343 0 0 2.71 0.00 0.00 455
7
0 0 36.7
8
0 0 53.4
9
0 0
GT 10 25 23 130203 131219 0 4.50 4.68 0.00 752
5
733
2
0 61.1
3
61.6
1
0 88.3
2
86.0
6
0
GT 11 25 23 124260 108181 0 4.29 3.86 0.00 752
5
615
3
730
6
58.3
4
50.7
9
0 88.3
2
72.7
1
85.7
6
GT 12 25 23 114876 148494 72419 3.97 5.30 4.28 707
0
839
0
702
8
53.9
3
69.7
2
34.0
0
82.9
8
98.4
8
82.4
9
GT 13 25 23 121811 44009 0 4.21 1.57 0.00 696
8
228
9
0 57.1
9
20.6
6
0 81.7
8
26.8
6
0
GT 14 25 23 0 0 0 0.00 0.00 0.00 0 0 0 0 0 0 0.00 0.00 0.00
GT 15 100 100 0 0 0 0.00 0.00 0.00 0 0 0 0 0 0 0.00 0.00 0.00
GT 16 100 95 579260 616262 414827 20.02 21.98 24.5
0
720
0
760
3
0 67.9
9
72.3
3
48.6
9
84.5
1
89.2
3
0.00
GT 17 100 100 570250 692038 242198 19.70 24.68 14.3
1
712
8
824
4
0 66.9
3
81.2
3
28.4
3
83.6
6
96.7
6
0.00
GT 18 100 100 13608 0 5874 0.47 0.00 0.35 212 0 165
6
1.6 0 0.69 2.49 0.00 19.4
3
GT19 100 100 488108 5466 107474 16.87 0.19 6.35 613
4
60 601
6
57.2
9
0.64 12.6
1
71.9
9
0.70 70.6
1
GT 20 100 100 230763 676145 685717 7.97 24.11 40.5
1
309
2
780
3
683
1
27.0
8
79.3
6
80.4
8
36.2
9
91.5
8
80.1
8
Total 289403
2
2804067 1692833
Ave 39.6
7
35.0
8
16.0
4
Insta.
Cap.
Ava.Cap Energy Generated (MWh) Unit Contribution to
Station (%)
Hours Run Capacity
Factor (%)
Availability
Factor (%)
UNITS MW MW 2012 2011 2010 2012 2011 2010 2012 2011 2010 2012 2011 2010 2012 2011 2010
GT 3 25 20 0 0 0 0.00 0.00 0.00 0 0 0 0.00 0.00 0.00 0.00 0.00 0.00
GT 4 25 20 62423 4017 0 3.69 0.27 0.00 8205 300 0 31.85 2.05 0.00 96.30 3.52 0.00
GT 5 25 20 0 0 0 0.00 0.00 0.00 0 0 0 0 0.00 0.00 0.00 0.00 0.00
GT 6 25 20 0 597 67032 0.00 0.04 3.43 0 100 5095 0 0.30 34.21 0.00 1.17 59.80
GT 7 25 20 0 0 106537 0.00 0.00 5.45 0 0 7042 0 0.00 54.37 0.00 0.00 82.65
GT 8 25 20 101901 9814 23432 6.02 0.66 1.20 7120 755 1624 52 5.01 11.96 83.57 8.86 19.06
GT 9 25 23 0 71685 116857 0.00 4.82 5.98 0 4863 8211 0 33.65 54.86 0.00 57.08 96.38
GT 10 25 23 0 0 35901 0.00 0.00 1.84 0 0 2325 0 0.00 16.85 0.00 0.00 27.29
GT 11 25 23 0 97225 106519 0.00 6.53 5.45 7306 6940 7983 0 45.65 50.01 85.76 81.45 93.70
GT 12 25 23 72,419 80895 110181 4.28 5.44 5.64 7028 5554 8263 34 37.98 51.73 82.49 65.19 96.99
GT 13 25 23 0 0 0 0.00 0.00 0.00 0 0 0 0 0.00 0.00 0.00 0.00 0.00
GT 14 25 23 0 28,193 75883 0.00 1.89 3.88 0 2811 6434 0 13.24 35.63 0.00 32.99 75.52
GT 15 100 100 0 0 0 0.00 0.00 0.00 0 0 0 0 0.00 0.00 0.00 0.00 0.00
GT 16 100 95 414827 479355 409981 24.50 32.21 20.97 0 6575 5626 48.69 56.26 48.12 0.00 77.17 86.03
GT 17 100 100 242198 0 0 14.31 0.00 0.00 0 0 0 28.43 0.00 0.00 0.00 0.00 0.00
GT 18 100 100 5,874 9186 485468 0.35 0.62 24.83 1656 132 6803 0.69 1.08 56.98 19.43 1.55 79.84
GT19 100 100 107474 291003 269097 6.35 19.56 13.77 6016 4775 4088 12.61 34.16 31.58 70.61 56.04 47.98
GT 20 100 100 685717 416146 147907 40.51 27.96 7.57 6831 6214 2115 80.48 48.84 17.36 80.18 72.94 24.82
Total 1328220 1488116 1954795 Ave 17.44 15.46 25.76
Journal of Multidisciplinary Engineering Science and Technology (JMEST)
ISSN: 2458-9403
Vol. 7 Issue 8, August - 2020
www.jmest.org
JMESTN42353493 12562
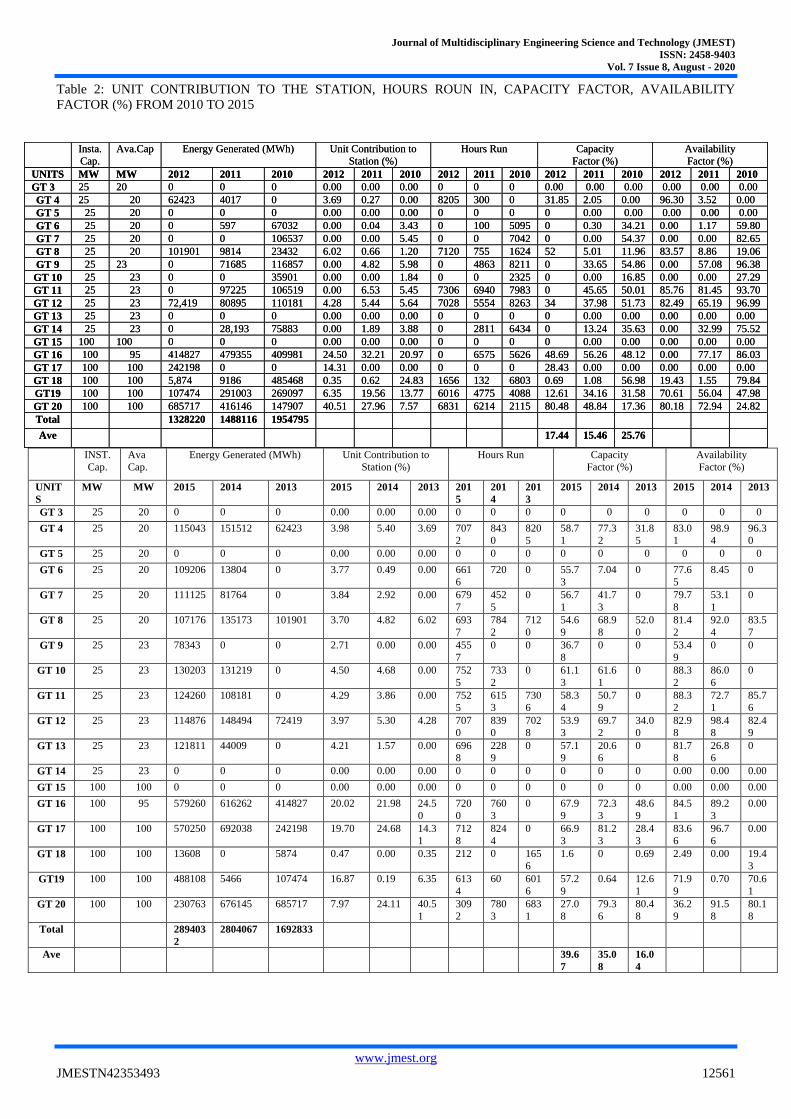
Fig 3: COMPARISON OF TOTAL ENERGY GENERATED: PRE & POST PRIVATISATION
Fig 4: COMPARISON OF TOTAL ENERGY CONSUMED: PRE & POST PRIVATISATION
Journal of Multidisciplinary Engineering Science and Technology (JMEST)
ISSN: 2458-9403
Vol. 7 Issue 8, August - 2020
www.jmest.org
JMESTN42353493 12563
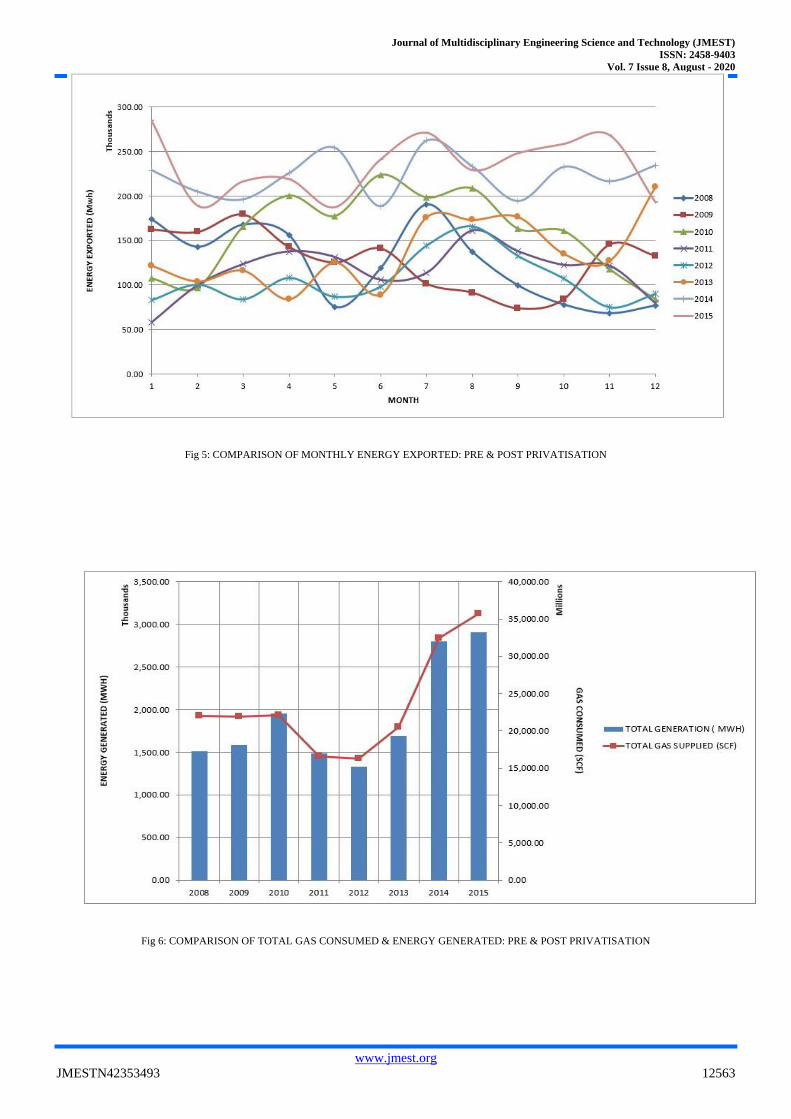
Fig 5: COMPARISON OF MONTHLY ENERGY EXPORTED: PRE & POST PRIVATISATION
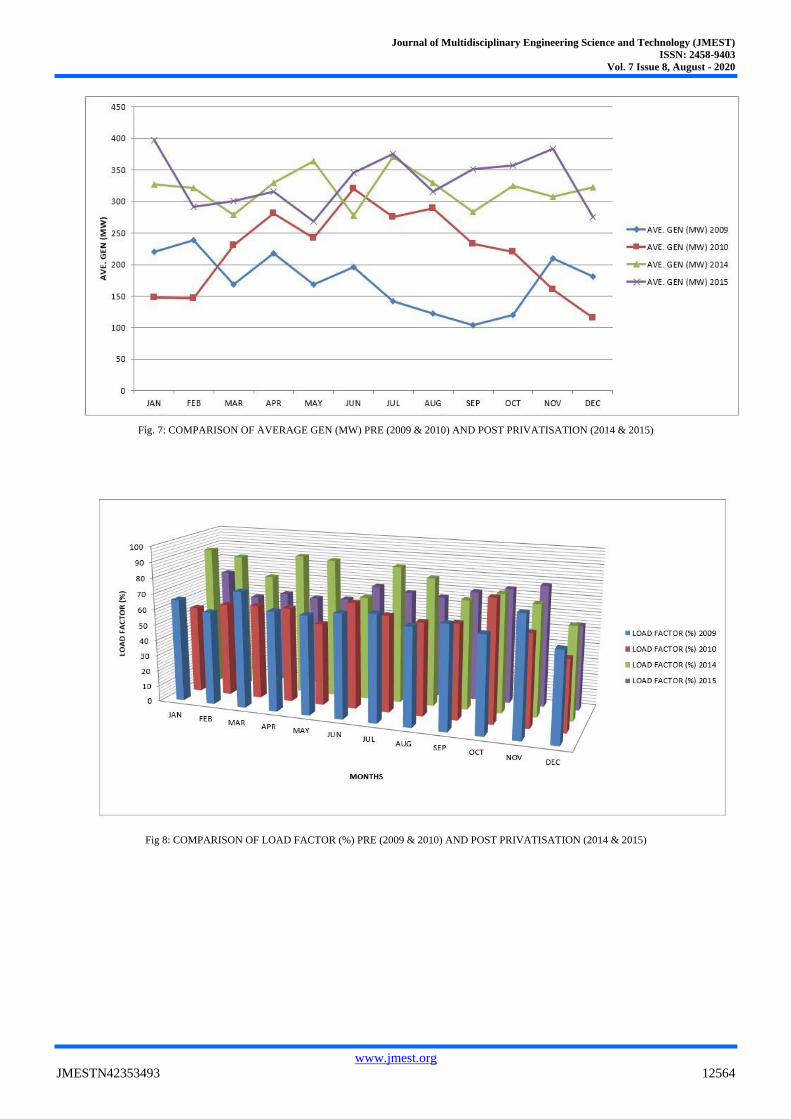
Fig 6: COMPARISON OF TOTAL GAS CONSUMED & ENERGY GENERATED: PRE & POST PRIVATISATION
Journal of Multidisciplinary Engineering Science and Technology (JMEST)
ISSN: 2458-9403
Vol. 7 Issue 8, August - 2020
www.jmest.org
JMESTN42353493 12564
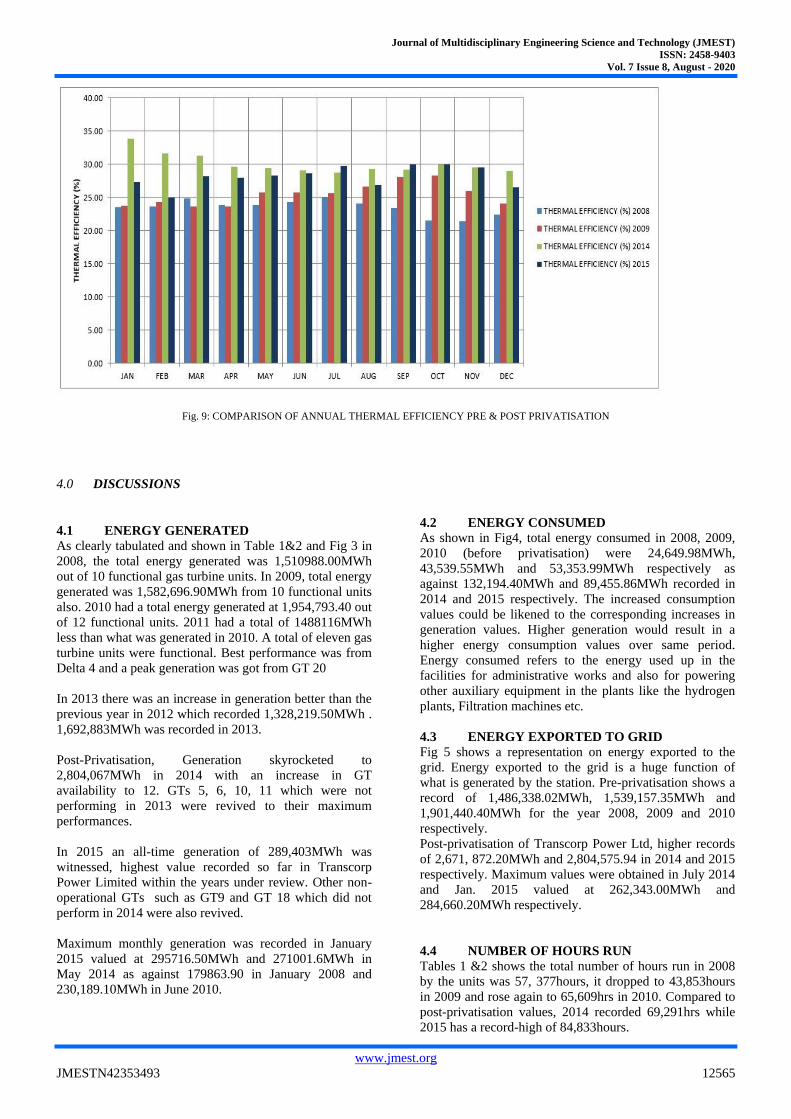
Fig. 7: COMPARISON OF AVERAGE GEN (MW) PRE (2009 & 2010) AND POST PRIVATISATION (2014 & 2015)
Fig 8: COMPARISON OF LOAD FACTOR (%) PRE (2009 & 2010) AND POST PRIVATISATION (2014 & 2015)
Journal of Multidisciplinary Engineering Science and Technology (JMEST)
ISSN: 2458-9403
Vol. 7 Issue 8, August - 2020
www.jmest.org
JMESTN42353493 12565
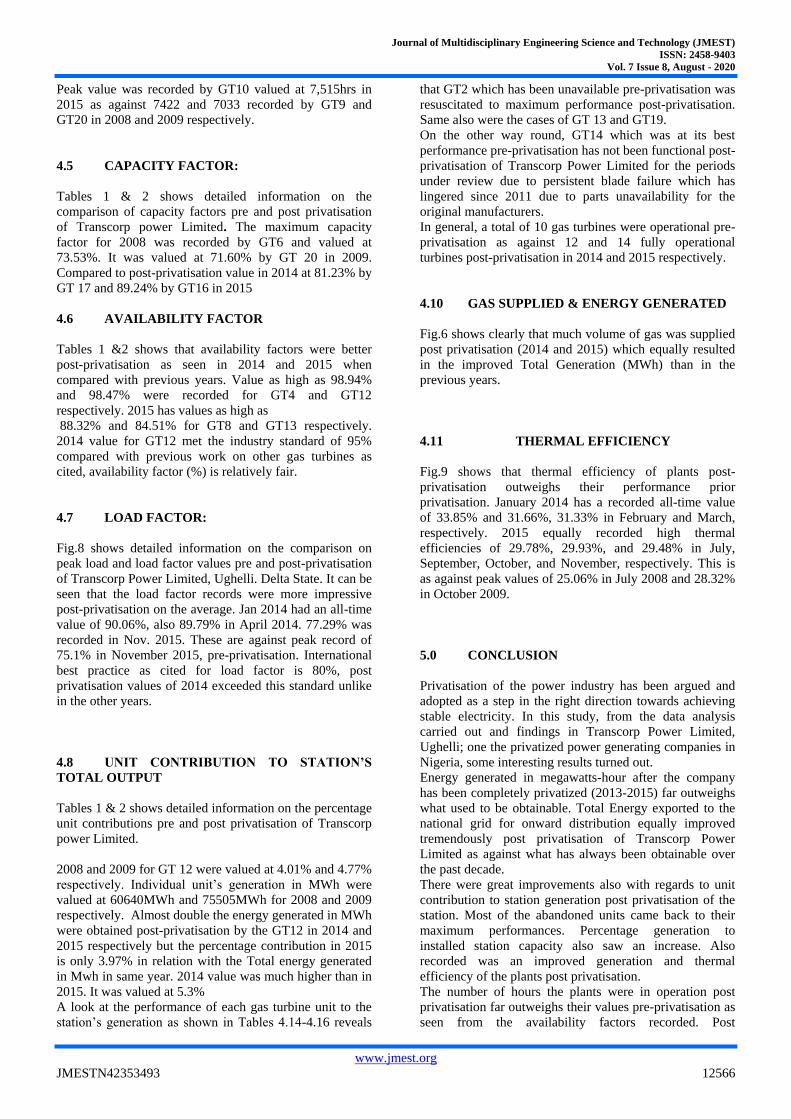
Fig. 9: COMPARISON OF ANNUAL THERMAL EFFICIENCY PRE & POST PRIVATISATION
4.0 DISCUSSIONS
4.1 ENERGY GENERATED
As clearly tabulated and shown in Table 1&2 and Fig 3 in
2008, the total energy generated was 1,510988.00MWh
out of 10 functional gas turbine units. In 2009, total energy
generated was 1,582,696.90MWh from 10 functional units
also. 2010 had a total energy generated at 1,954,793.40 out
of 12 functional units. 2011 had a total of 1488116MWh
less than what was generated in 2010. A total of eleven gas
turbine units were functional. Best performance was from
Delta 4 and a peak generation was got from GT 20
In 2013 there was an increase in generation better than the
previous year in 2012 which recorded 1,328,219.50MWh .
1,692,883MWh was recorded in 2013.
Post-Privatisation, Generation skyrocketed to
2,804,067MWh in 2014 with an increase in GT
availability to 12. GTs 5, 6, 10, 11 which were not
performing in 2013 were revived to their maximum
performances.
In 2015 an all-time generation of 289,403MWh was
witnessed, highest value recorded so far in Transcorp
Power Limited within the years under review. Other non-
operational GTs such as GT9 and GT 18 which did not
perform in 2014 were also revived.
Maximum monthly generation was recorded in January
2015 valued at 295716.50MWh and 271001.6MWh in
May 2014 as against 179863.90 in January 2008 and
230,189.10MWh in June 2010.
4.2 ENERGY CONSUMED
As shown in Fig4, total energy consumed in 2008, 2009,
2010 (before privatisation) were 24,649.98MWh,
43,539.55MWh and 53,353.99MWh respectively as
against 132,194.40MWh and 89,455.86MWh recorded in
2014 and 2015 respectively. The increased consumption
values could be likened to the corresponding increases in
generation values. Higher generation would result in a
higher energy consumption values over same period.
Energy consumed refers to the energy used up in the
facilities for administrative works and also for powering
other auxiliary equipment in the plants like the hydrogen
plants, Filtration machines etc.
4.3 ENERGY EXPORTED TO GRID
Fig 5 shows a representation on energy exported to the
grid. Energy exported to the grid is a huge function of
what is generated by the station. Pre-privatisation shows a
record of 1,486,338.02MWh, 1,539,157.35MWh and
1,901,440.40MWh for the year 2008, 2009 and 2010
respectively.
Post-privatisation of Transcorp Power Ltd, higher records
of 2,671, 872.20MWh and 2,804,575.94 in 2014 and 2015
respectively. Maximum values were obtained in July 2014
and Jan. 2015 valued at 262,343.00MWh and
284,660.20MWh respectively.
4.4 NUMBER OF HOURS RUN
Tables 1 &2 shows the total number of hours run in 2008
by the units was 57, 377hours, it dropped to 43,853hours
in 2009 and rose again to 65,609hrs in 2010. Compared to
post-privatisation values, 2014 recorded 69,291hrs while
2015 has a record-high of 84,833hours.
Journal of Multidisciplinary Engineering Science and Technology (JMEST)
ISSN: 2458-9403
Vol. 7 Issue 8, August - 2020
www.jmest.org
JMESTN42353493 12566
Peak value was recorded by GT10 valued at 7,515hrs in
2015 as against 7422 and 7033 recorded by GT9 and
GT20 in 2008 and 2009 respectively.
4.5 CAPACITY FACTOR:
Tables 1 & 2 shows detailed information on the
comparison of capacity factors pre and post privatisation
of Transcorp power Limited. The maximum capacity
factor for 2008 was recorded by GT6 and valued at
73.53%. It was valued at 71.60% by GT 20 in 2009.
Compared to post-privatisation value in 2014 at 81.23% by
GT 17 and 89.24% by GT16 in 2015
4.6 AVAILABILITY FACTOR
Tables 1 &2 shows that availability factors were better
post-privatisation as seen in 2014 and 2015 when
compared with previous years. Value as high as 98.94%
and 98.47% were recorded for GT4 and GT12
respectively. 2015 has values as high as
88.32% and 84.51% for GT8 and GT13 respectively.
2014 value for GT12 met the industry standard of 95%
compared with previous work on other gas turbines as
cited, availability factor (%) is relatively fair.
4.7 LOAD FACTOR:
Fig.8 shows detailed information on the comparison on
peak load and load factor values pre and post-privatisation
of Transcorp Power Limited, Ughelli. Delta State. It can be
seen that the load factor records were more impressive
post-privatisation on the average. Jan 2014 had an all-time
value of 90.06%, also 89.79% in April 2014. 77.29% was
recorded in Nov. 2015. These are against peak record of
75.1% in November 2015, pre-privatisation. International
best practice as cited for load factor is 80%, post
privatisation values of 2014 exceeded this standard unlike
in the other years.
4.8 UNIT CONTRIBUTION TO STATION’S
TOTAL OUTPUT
Tables 1 & 2 shows detailed information on the percentage
unit contributions pre and post privatisation of Transcorp
power Limited.
2008 and 2009 for GT 12 were valued at 4.01% and 4.77%
respectively. Individual unit’s generation in MWh were
valued at 60640MWh and 75505MWh for 2008 and 2009
respectively. Almost double the energy generated in MWh
were obtained post-privatisation by the GT12 in 2014 and
2015 respectively but the percentage contribution in 2015
is only 3.97% in relation with the Total energy generated
in Mwh in same year. 2014 value was much higher than in
2015. It was valued at 5.3%
A look at the performance of each gas turbine unit to the
station’s generation as shown in Tables 4.14-4.16 reveals
that GT2 which has been unavailable pre-privatisation was
resuscitated to maximum performance post-privatisation.
Same also were the cases of GT 13 and GT19.
On the other way round, GT14 which was at its best
performance pre-privatisation has not been functional post-
privatisation of Transcorp Power Limited for the periods
under review due to persistent blade failure which has
lingered since 2011 due to parts unavailability for the
original manufacturers.
In general, a total of 10 gas turbines were operational pre-
privatisation as against 12 and 14 fully operational
turbines post-privatisation in 2014 and 2015 respectively.
4.10 GAS SUPPLIED & ENERGY GENERATED
Fig.6 shows clearly that much volume of gas was supplied
post privatisation (2014 and 2015) which equally resulted
in the improved Total Generation (MWh) than in the
previous years.
4.11 THERMAL EFFICIENCY
Fig.9 shows that thermal efficiency of plants post-
privatisation outweighs their performance prior
privatisation. January 2014 has a recorded all-time value
of 33.85% and 31.66%, 31.33% in February and March,
respectively. 2015 equally recorded high thermal
efficiencies of 29.78%, 29.93%, and 29.48% in July,
September, October, and November, respectively. This is
as against peak values of 25.06% in July 2008 and 28.32%
in October 2009.
5.0 CONCLUSION
Privatisation of the power industry has been argued and
adopted as a step in the right direction towards achieving
stable electricity. In this study, from the data analysis
carried out and findings in Transcorp Power Limited,
Ughelli; one the privatized power generating companies in
Nigeria, some interesting results turned out.
Energy generated in megawatts-hour after the company
has been completely privatized (2013-2015) far outweighs
what used to be obtainable. Total Energy exported to the
national grid for onward distribution equally improved
tremendously post privatisation of Transcorp Power
Limited as against what has always been obtainable over
the past decade.
There were great improvements also with regards to unit
contribution to station generation post privatisation of the
station. Most of the abandoned units came back to their
maximum performances. Percentage generation to
installed station capacity also saw an increase. Also
recorded was an improved generation and thermal
efficiency of the plants post privatisation.
The number of hours the plants were in operation post
privatisation far outweighs their values pre-privatisation as
seen from the availability factors recorded. Post
Journal of Multidisciplinary Engineering Science and Technology (JMEST)
ISSN: 2458-9403
Vol. 7 Issue 8, August - 2020
www.jmest.org
JMESTN42353493 12567
privatisation values of the Generation Utilization Index,
Capacity Factors and Thermal Efficiencies of plants were
equally more desirable than it were pre-privatisation.
From the aforementioned findings, it suffices to say that
privatisation has really paid off in Transcorp Power. It
could be inferred that management under the private sector
is way better than it was with the government.
5.1 ACKNOWLEDMENTS
I appreciate the management of Transcorp Power Limited,
Ughelli for their unwavering support to academic research.
Special thanks to the Operations Manager; Engr. Clifford
Agu, and the Efficiency dept-in-charge; Engr. Ndubuisi
Alozie.
I will extend my regards to Prof. A. I. Obanor, Engr.
Henry Egware and Dr. E.G. Sadjere of the University of
Benin, Edo State, Nigeia for their guidance towards
achieving this research feat.
My sincere appreciation also goes to all the staff of WOG
Allied Services, Nigeria Limited, and also my family and
friends for all forms of courage and support.
REFERENCES
[1] Oseni, M.O., (2012), Improving household’s access to electricity
and energy consumption pattern in Nigeria: Renewable Energy Alternative. Journal of Sustainable Renewable Energy Rev 2012; 16:3967-74.
[2] Adaramola, M.S., Oyewola,O.M., and Paul, SS., (2012), Technical and Economic Assessment of Hybrid Energy Systems in South-West Nigeria, Energy Explor Exploit, 2012; 30 (4):533-52
[3] Sule, B.F., Ajao, K.R., Ajimotokan, H.A., and Garba, M.K., (2011), Compact Flourescent Lamps and Electricity Consumption Trend in Residential Buildings in Ilorin, Nigeria. Energy Sector Management 2011; 5(2):162-8
[4] Masjuki HH., Mahlia TMI., and Choudhury I.A., (2001), Potential Electricity Savings by implementing minimum energy efficiency standards for room air conditioners in Malaysia. Journal of Energy Conversion and Management 2001; 42(4): 439-50
[5] Sambo, A.S., (2005), Renewable Energy for Rural Development: The Nigerian Perspective. ISESCO Journal of Science & Technology Vision 2005: 1:12-22
[6] World Bank, (2010), World Development Indicators, Available From: http://data.worldbank.org/data/world-development-indicators/wdi-2010 [Accessed: 16th June, 2016]
[7] Iseolorunkanmi, O.J., (2014), Issues and challenges in the privatized power sector in Nigeria, Journal of Sustainable Development Studies, Vol. 16, No. 1. (November 1 2014), 161-174
[8] Epiphany, A., (2012), Communiqué at the round table on power, infrastructure, investment and transformation agenda, Available From:http://www.nials-nigeria.org/round_tables/communique_on-power.pdf [Accessed 20th July, 2016]
[9] Emovon, I., Kareem, B., and Adeyeri, M.K., (2011), Performance Evaluation of Egbin Thermal Station, Nigeria In: Proceedings of the world congress on engineering and computer science 2011, WCECS 2011, vol. II, San Francisco, USA, October 19-21, 2011.
[10] Transcorp Power Limited (2014), About us., Available From: http://www.transcorppower.com/about [Accessed: 16th June, 2016]
[11] Nigerian Electricity Regulatory Commission, NERC, (2010), Report on the Analysis of Key Performance Indicators (KPIs) of Generation and Distribution Companies”
[12] Power Holding Company of Nigeria (2010), Annual Report on Ughelli Power Plc; Pp18-25


![Privatisation of public spaces [pre final] 1.docx](https://img.pdfslide.us/doc/110x75/55cf8efc550346703b97bc64/privatisation-of-public-spaces-pre-final-1docx.jpg)