Embed Size (px)
Citation preview
Pre-amplification critically analysed
Jo Vandesompele
professor, Ghent University
co-founder and CEO, Biogazelle
Advanced Methods in RNA quantification (London, UK)
May 21, 2009
outline
introduction
450 miRNA pre-amplification
Mestdagh et al., Nucleic Acids Research, 2008
[Mestdagh et al., Genome Biology, in press]
whole mRNAome pre-amplification
prognostic gene signature in cancer patients
Vermeulen et al., The Lancet Oncology, accepted
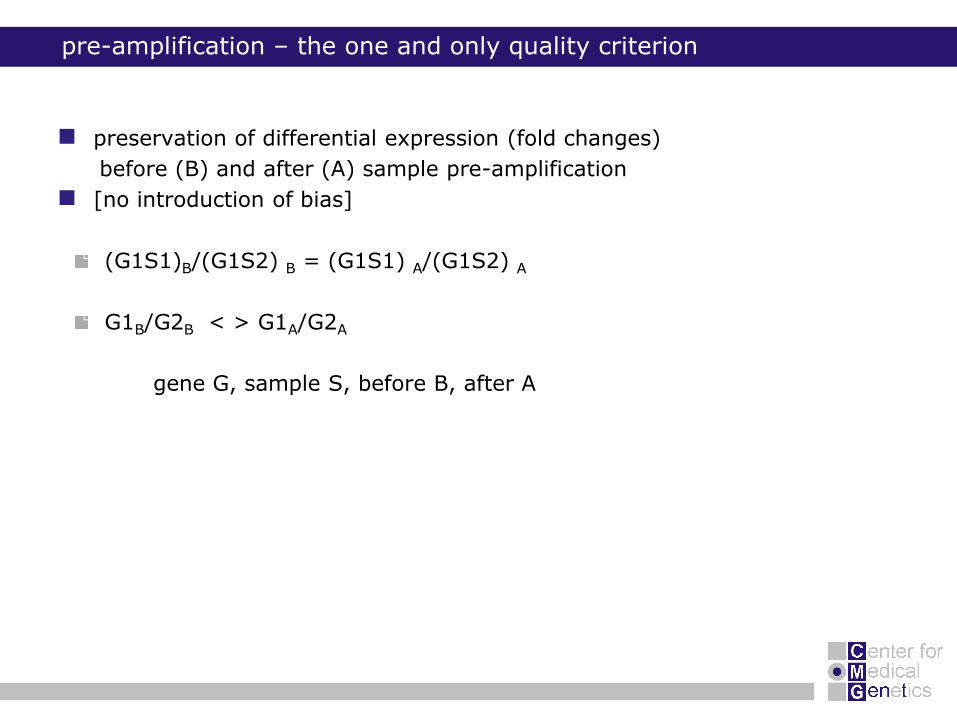
pre-amplification – the one and only quality criterion
preservation of differential expression (fold changes)
before (B) and after (A) sample pre-amplification
[no introduction of bias]
(G1S1)B/(G1S2) B = (G1S1) A/(G1S2) A
G1B/G2B < > G1A/G2A
gene G, sample S, before B, after A
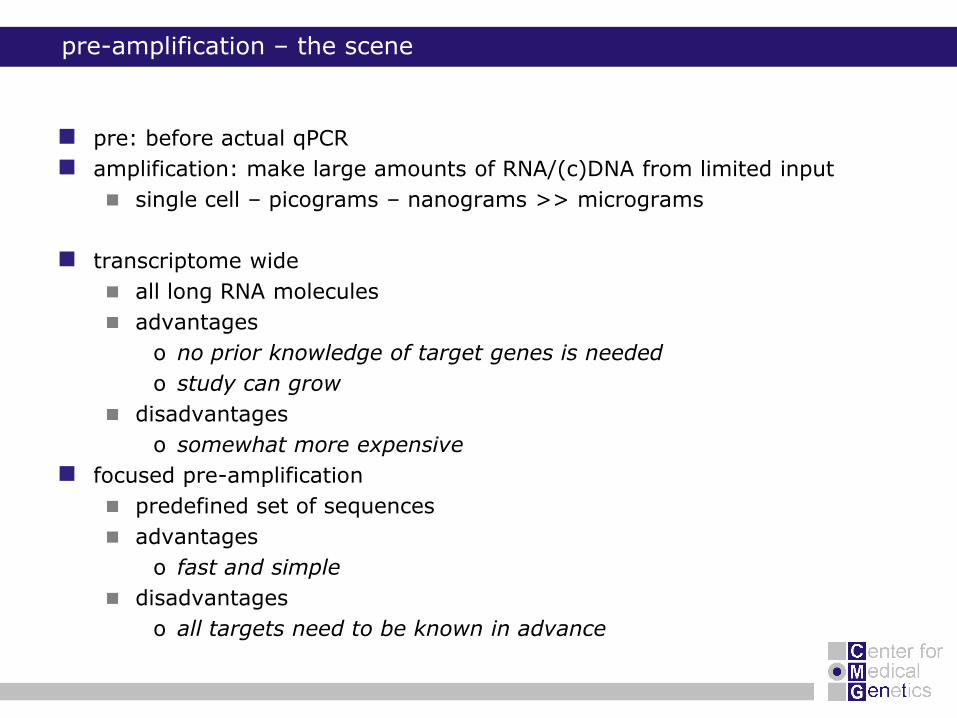
pre-amplification – the scene
pre: before actual qPCR
amplification: make large amounts of RNA/(c)DNA from limited input
single cell – picograms – nanograms >> micrograms
transcriptome wide
all long RNA molecules
advantages
o no prior knowledge of target genes is needed
o study can grow
disadvantages
o somewhat more expensive
focused pre-amplification
predefined set of sequences
advantages
o fast and simple
disadvantages
o all targets need to be known in advance
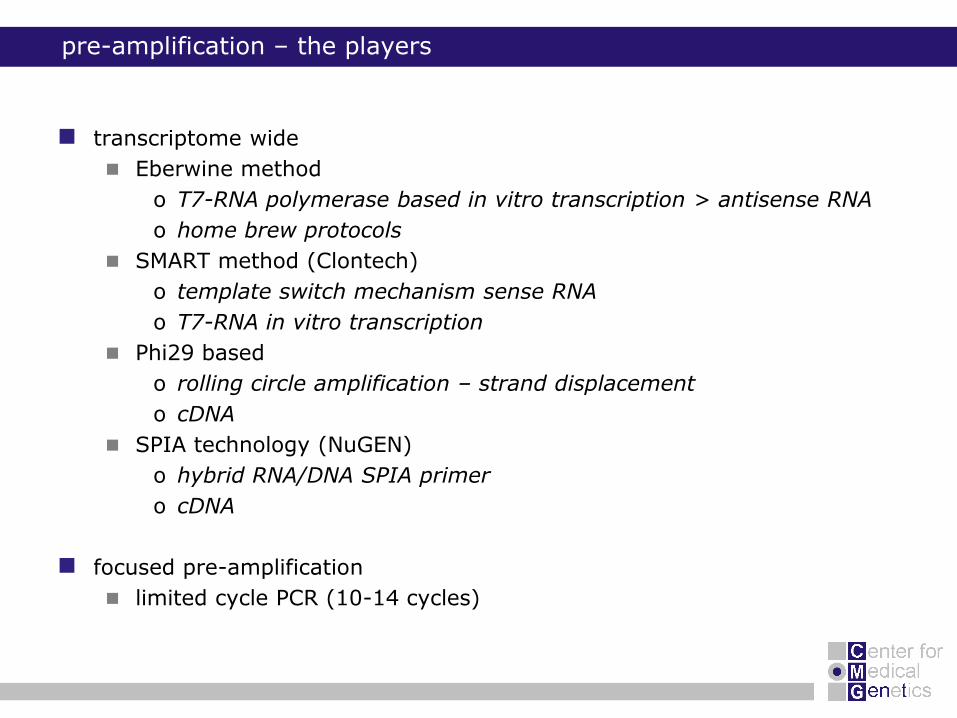
pre-amplification – the players
transcriptome wide
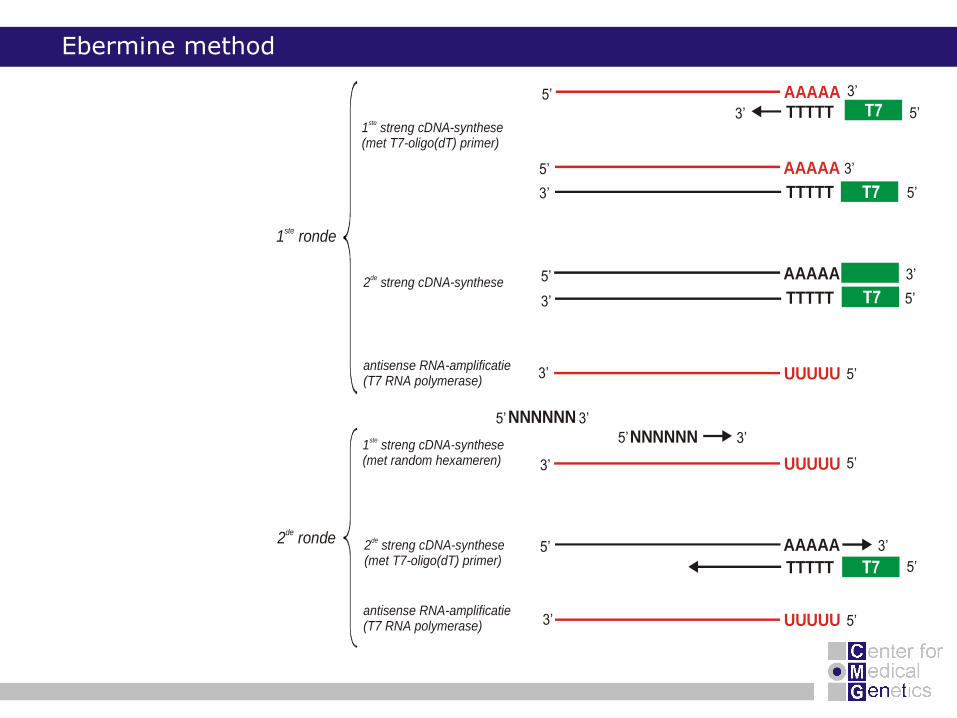
Eberwine method
o T7-RNA polymerase based in vitro transcription > antisense RNA
o home brew protocols
SMART method (Clontech)
o template switch mechanism sense RNA
o T7-RNA in vitro transcription
Phi29 based
o rolling circle amplification – strand displacement
o cDNA
SPIA technology (NuGEN)
o hybrid RNA/DNA SPIA primer
o cDNA
focused pre-amplification
limited cycle PCR (10-14 cycles)
5’ 3’
5’ 3’
5’
5’3’
AAAAA
UUUUU
UUUUU
AAAAA
AAAAA
TTTTT1 streng cDNA-synthese (met T7-oligo(dT) primer)
ste
1 streng cDNA-synthese(met random hexameren)
ste
2 streng cDNA-synthesede
antisense RNA-amplificatie(T7 RNA polymerase)
TTTTT
TTTTT
5’
3’
3’
5’
3’
5’3’
5’
5’ 3’AAAAA
TTTTT 5’
5’3’
3’
5’UUUUUantisense RNA-amplificatie(T7 RNA polymerase) 3’
2 streng cDNA-synthese(met T7-oligo(dT) primer)
de
NNNNNNNNNNNN
5’ 3’
1 rondeste
2 rondede
Ebermine method
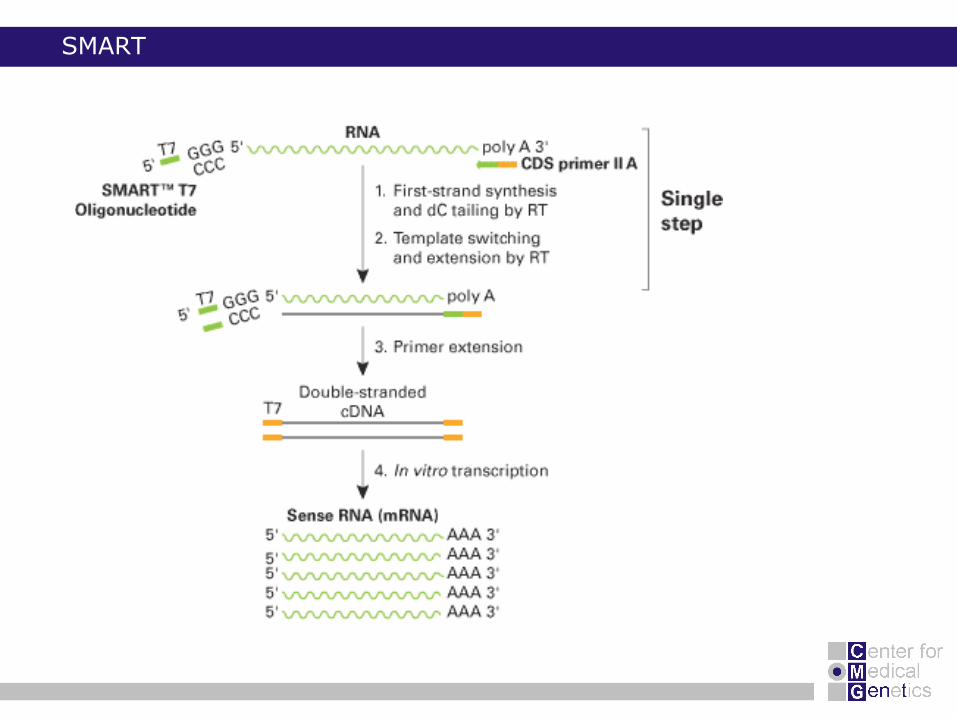
SMART
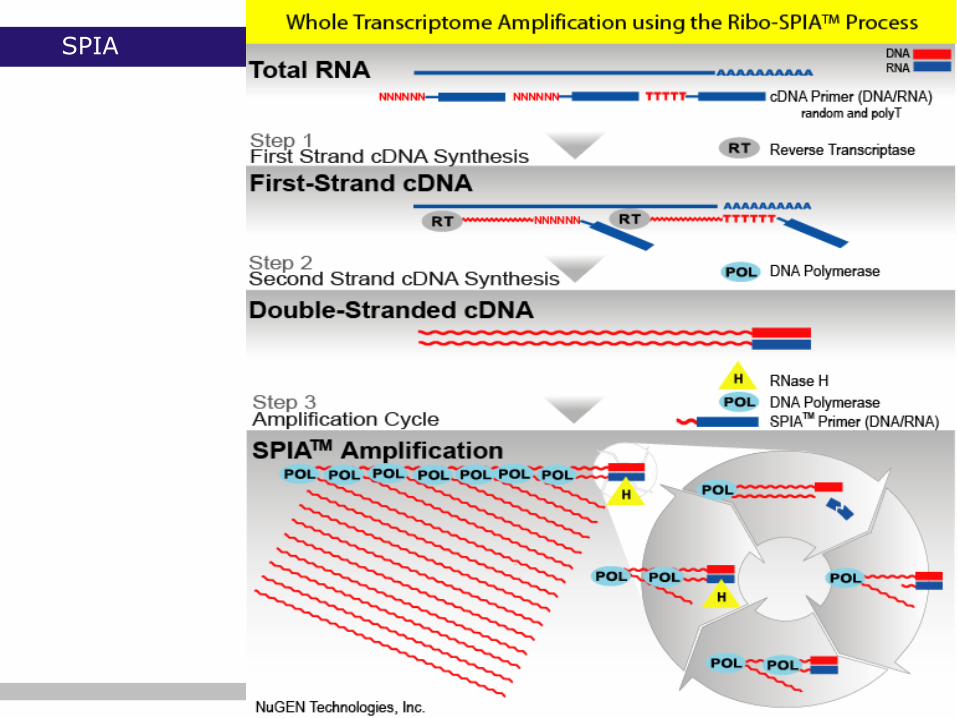
SPIA
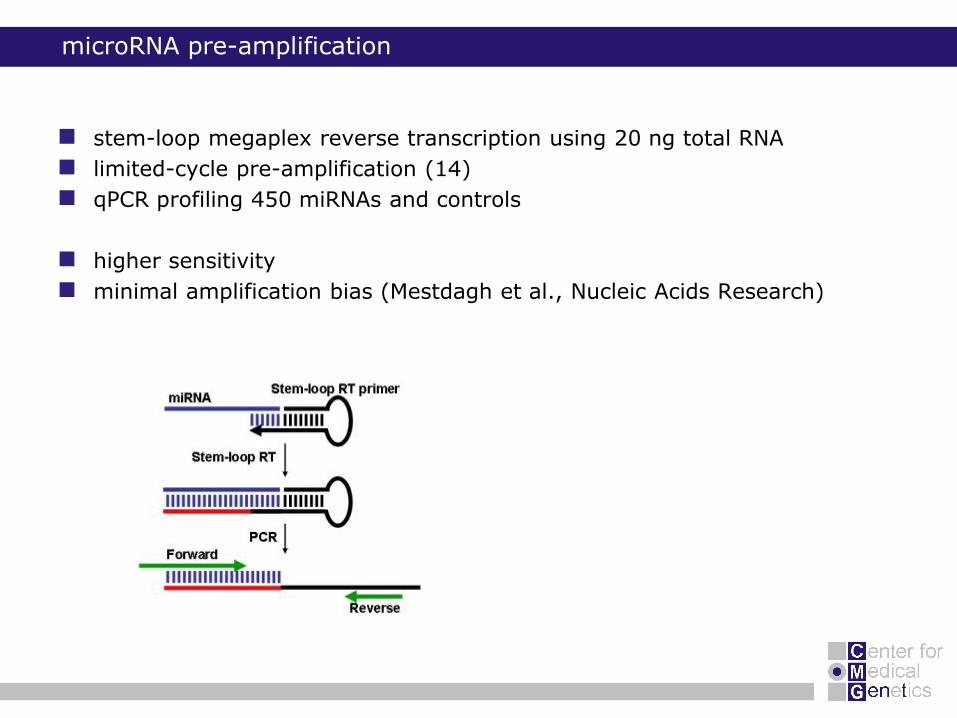
microRNA pre-amplification
stem-loop megaplex reverse transcription using 20 ng total RNA
limited-cycle pre-amplification (14)
qPCR profiling 450 miRNAs and controls
higher sensitivity
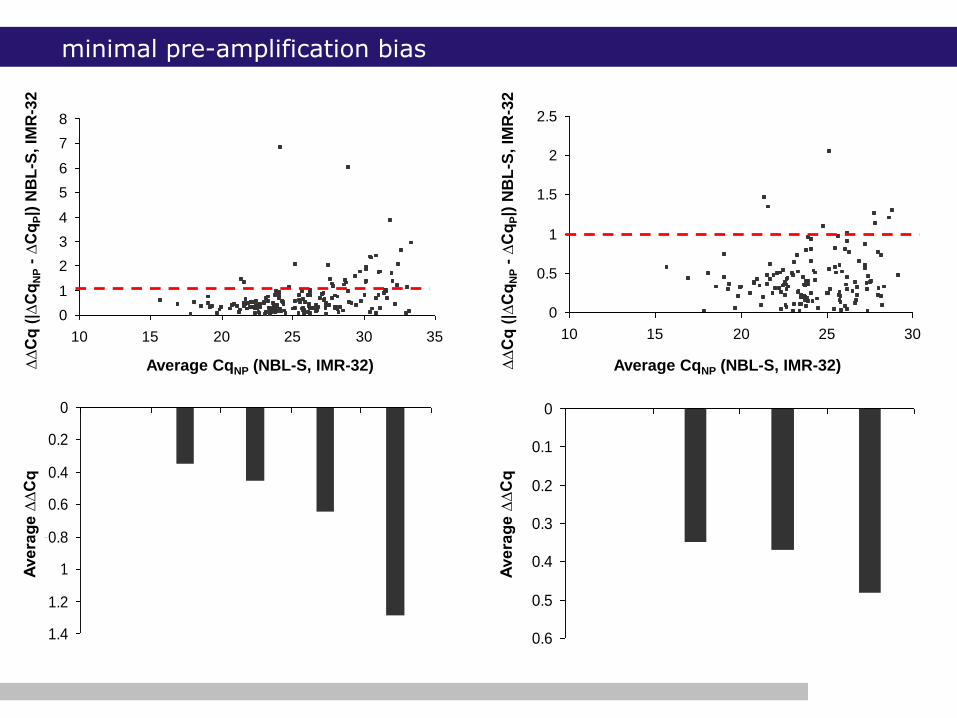
minimal amplification bias (Mestdagh et al., Nucleic Acids Research)
0
1
2
3
4
5
6
7
8
10 15 20 25 30 35
0
0.5
1
1.5
2
2.5
10 15 20 25 30
-0.6
-0.5
-0.4
-0.3
-0.2
-0.1
0
-1.4
-1.2
-1
-0.8
-0.6
-0.4
-0.2
0
0
1
2
3
4
5
6
7
8
10 15 20 25 30 35
Average CqNP (NBL-S, IMR-32) Average CqNP (NBL-S, IMR-32)∆∆
Cq
(|∆
Cq
NP
-∆
Cq
P|)
NB
L-S
, IM
R-3
2A
ve
rag
e ∆
∆C
q
∆∆
Cq
(|∆
Cq
NP
-∆
Cq
P|)
NB
L-S
, IM
R-3
2A
ve
rag
e ∆
∆C
q
minimal pre-amplification bias
0
5
10
15
20
25
30
0 2 4 6 8 10 12 14
0
5
10
15
20
25
30
35
0 2 4 6 8 10 12 14
0
5
10
15
20
25
30
0 2 4 6 8
0
5
10
15
20
25
30
35
0 2 4 6 8
Cq
-va
lue
Cq
-va
lue
Cq
-va
lue
Cq
-va
lue
total cell number total RNA input (pg)
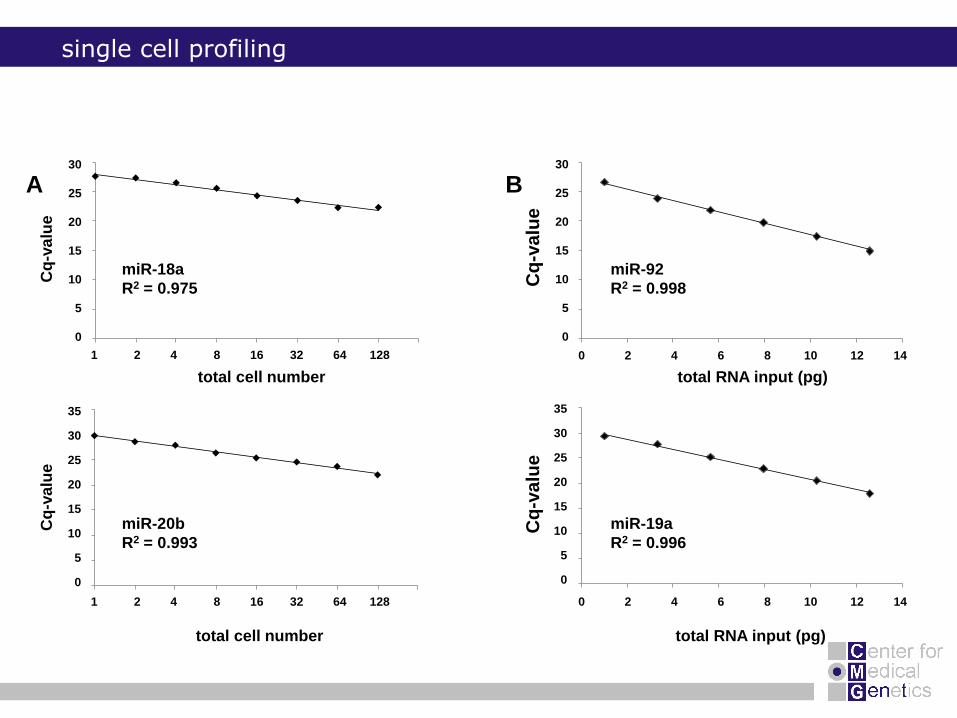
miR-18a
R2 = 0.975
miR-20b
R2 = 0.993
miR-92
R2 = 0.998
miR-19a
R2 = 0.996
A B
1 2 4 8 16 32 64 128
1 2 4 8 16 32 64 128
0 2 4 6 8 10 12 14
0 2 4 6 8 10 12 14
30
25
20
15
10
5
0
30
25
20
15
10
5
0
35
30
25
20
15
10
5
0
35
30
25
20
15
10
5
0
single cell profiling
total cell number total RNA input (pg)
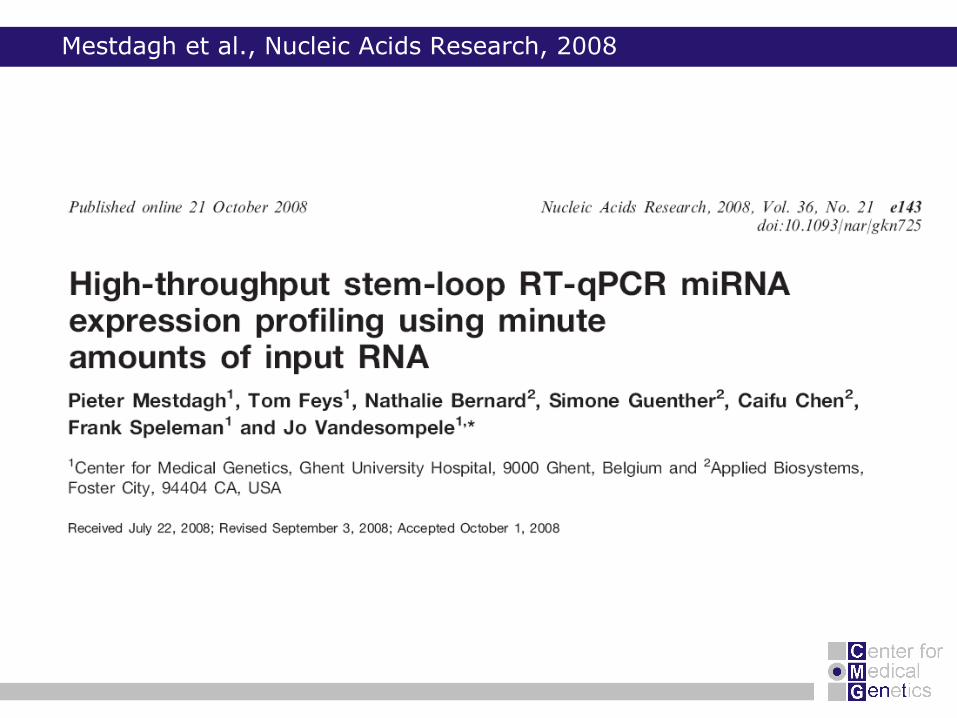
Mestdagh et al., Nucleic Acids Research, 2008
outline
background research & goals
neuroblastoma
prognostic marker selection
study design and workflow
RNA quality control
sample pre-amplification
normalization
data-analysis and results
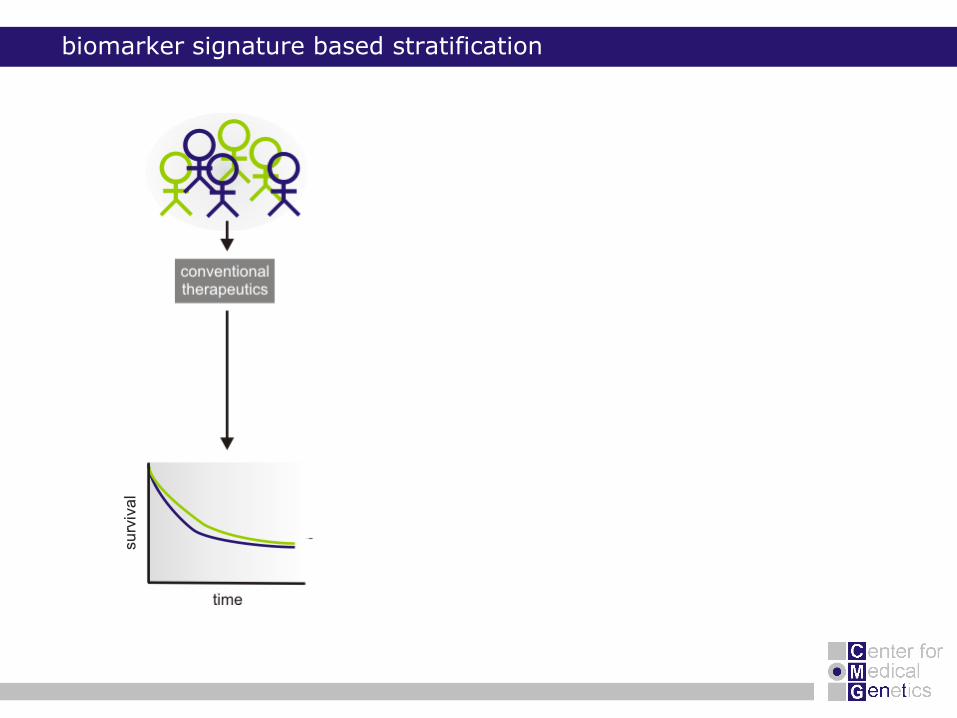
biomarker signature based stratification
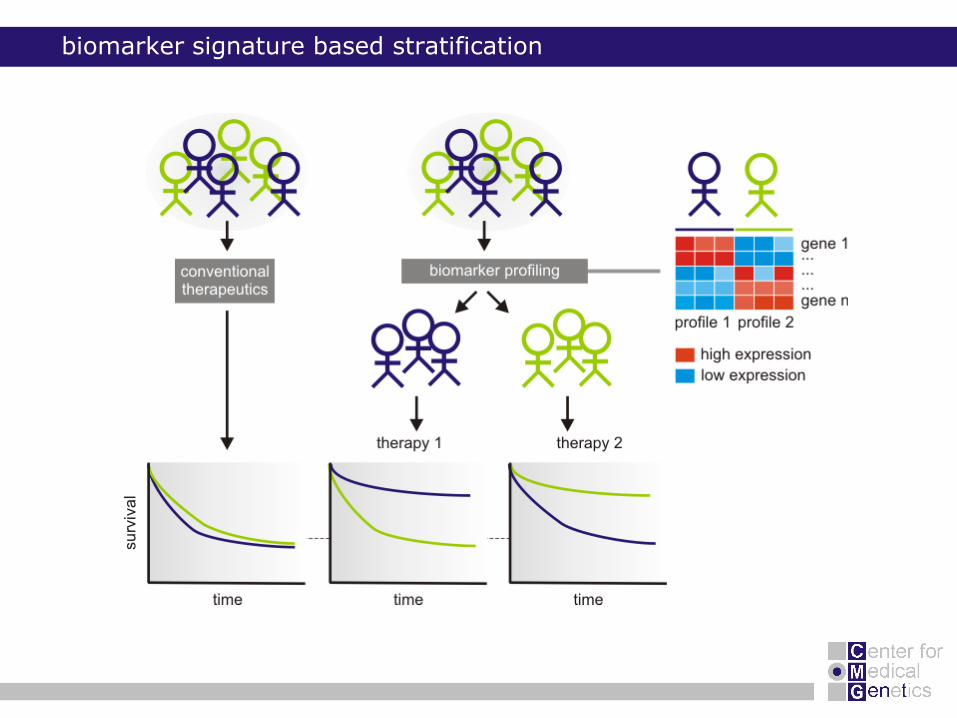
biomarker signature based stratification
aim
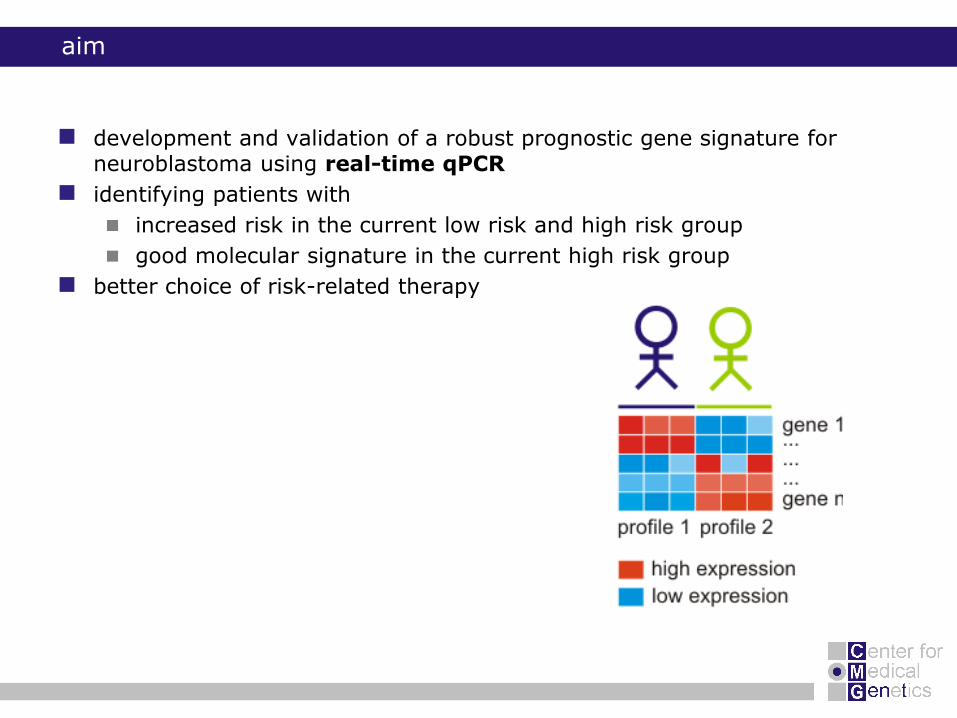
development and validation of a robust prognostic gene signature for neuroblastoma using real-time qPCR
identifying patients with
increased risk in the current low risk and high risk group
good molecular signature in the current high risk group
better choice of risk-related therapy
neuroblastoma
most frequent extra-cranial solid tumor in children
originates from primitive (immature) sympathetic nervous system cells
1:100,000 children (< 15 years)
20 cases/year Belgium | 700 cases/year USA
15% of childhood cancer deaths
prognosis is dependent on
tumor stage (localized vs. metastatic disease)
age at diagnosis (< or > 1 year)
genetic defects: amplification MYCN, ploidy, loss of 1p, gain of 17q
prognostic classification
misclassifications resulting in overtreatment or undertreatment
need for additional tumor-specific prognostic markers
current microarray gene expression studies
data overfitting
unstable gene lists
lack of overlap
biological & technical noise
much more genes than samples
probe annotation / platform
different risk definition
different data processing and analysis
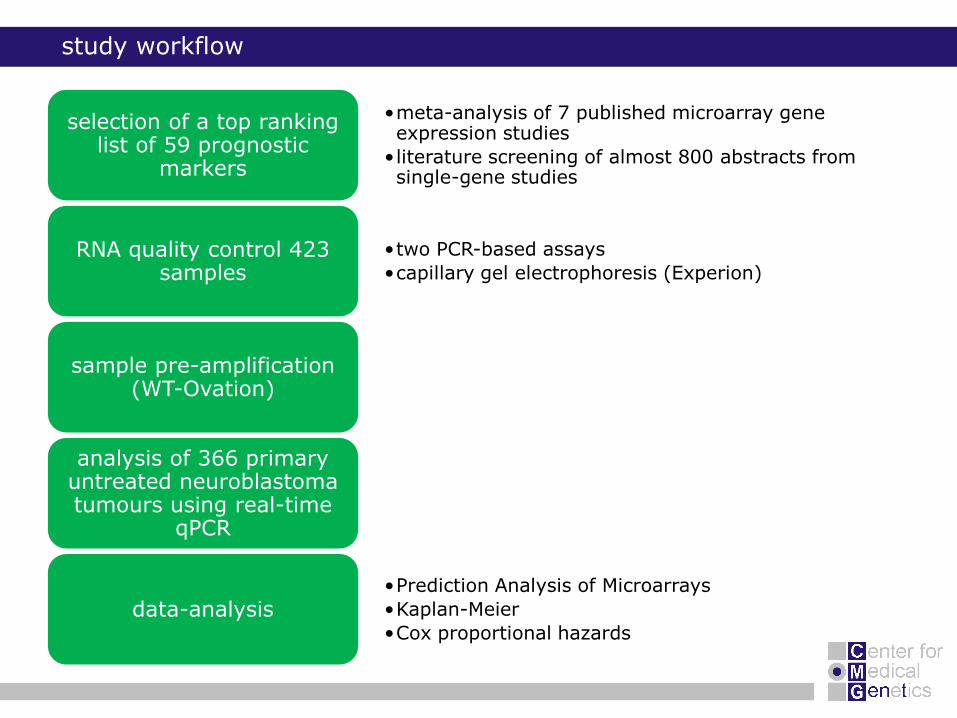
•meta-analysis of 7 published microarray gene expression studies
• literature screening of almost 800 abstracts from single-gene studies
selection of a top ranking list of 59 prognostic
markers
•two PCR-based assays
•capillary gel electrophoresis (Experion)RNA quality control 423
samples
sample pre-amplification (WT-Ovation)
analysis of 366 primary untreated neuroblastoma tumours using real-time
qPCR
•Prediction Analysis of Microarrays
•Kaplan-Meier
•Cox proportional hazards
data-analysis
study workflow
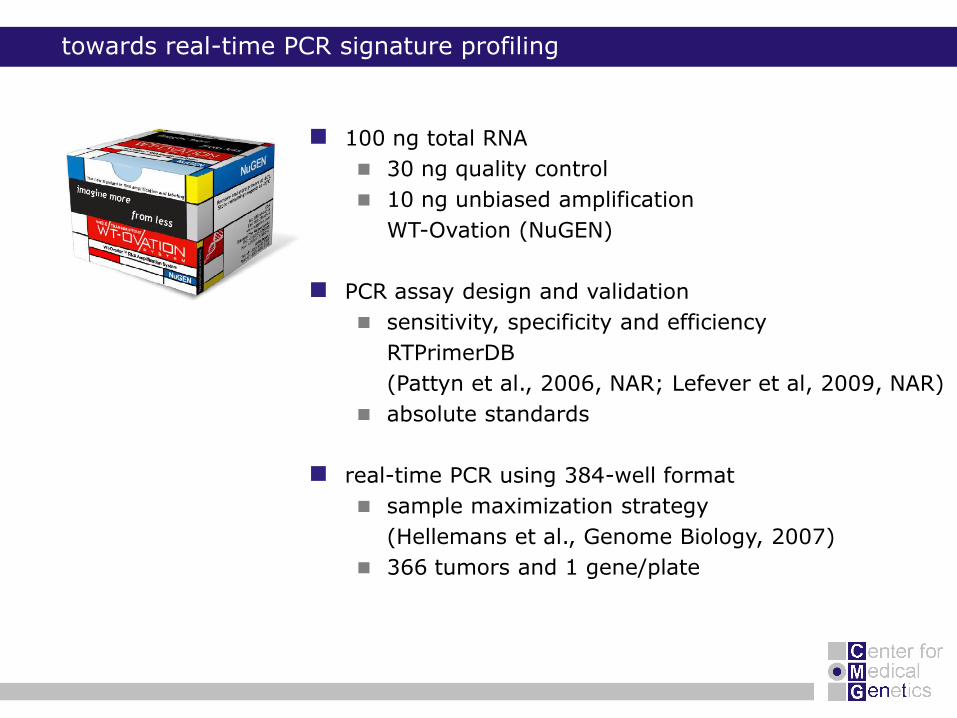
towards real-time PCR signature profiling
100 ng total RNA
30 ng quality control
10 ng unbiased amplification
WT-Ovation (NuGEN)
PCR assay design and validation
sensitivity, specificity and efficiency
RTPrimerDB
(Pattyn et al., 2006, NAR; Lefever et al, 2009, NAR)
absolute standards
real-time PCR using 384-well format
sample maximization strategy
(Hellemans et al., Genome Biology, 2007)
366 tumors and 1 gene/plate
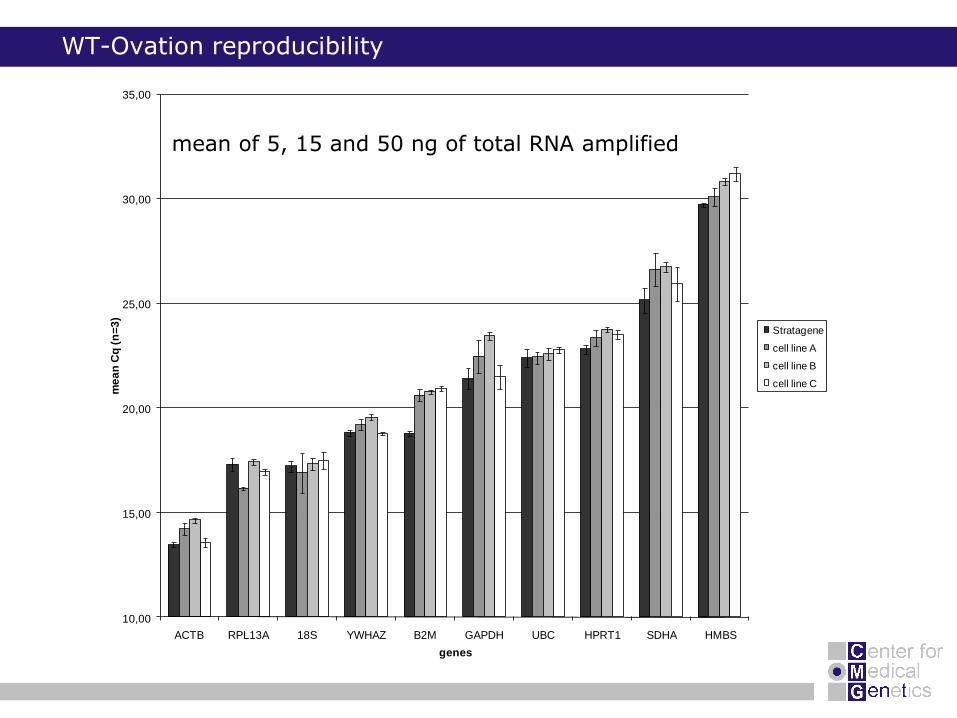
WT-Ovation reproducibility
10,00
15,00
20,00
25,00
30,00
35,00
ACTB RPL13A 18S YWHAZ B2M GAPDH UBC HPRT1 SDHA HMBS
me
an
Cq
(n
=3
)
genes
Stratagene
cell line A
cell line B
cell line C
mean of 5, 15 and 50 ng of total RNA amplified
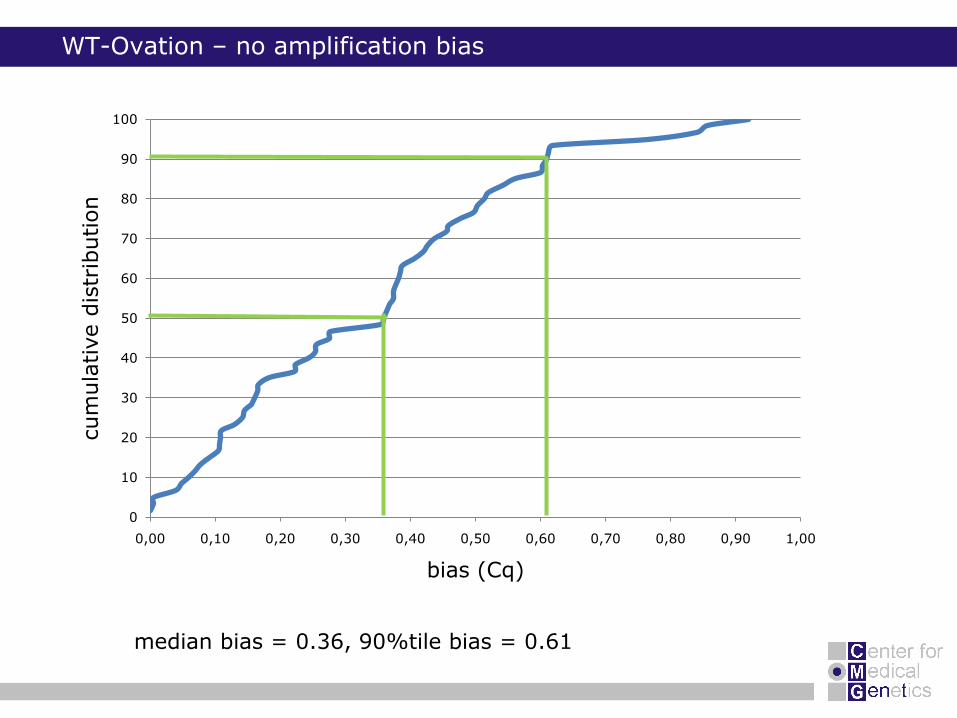
WT-Ovation – no amplification bias
median bias = 0.36, 90%tile bias = 0.61
0
10
20
30
40
50
60
70
80
90
100
0,00 0,10 0,20 0,30 0,40 0,50 0,60 0,70 0,80 0,90 1,00
cum
ula
tive
dis
trib
ution
bias (Cq)
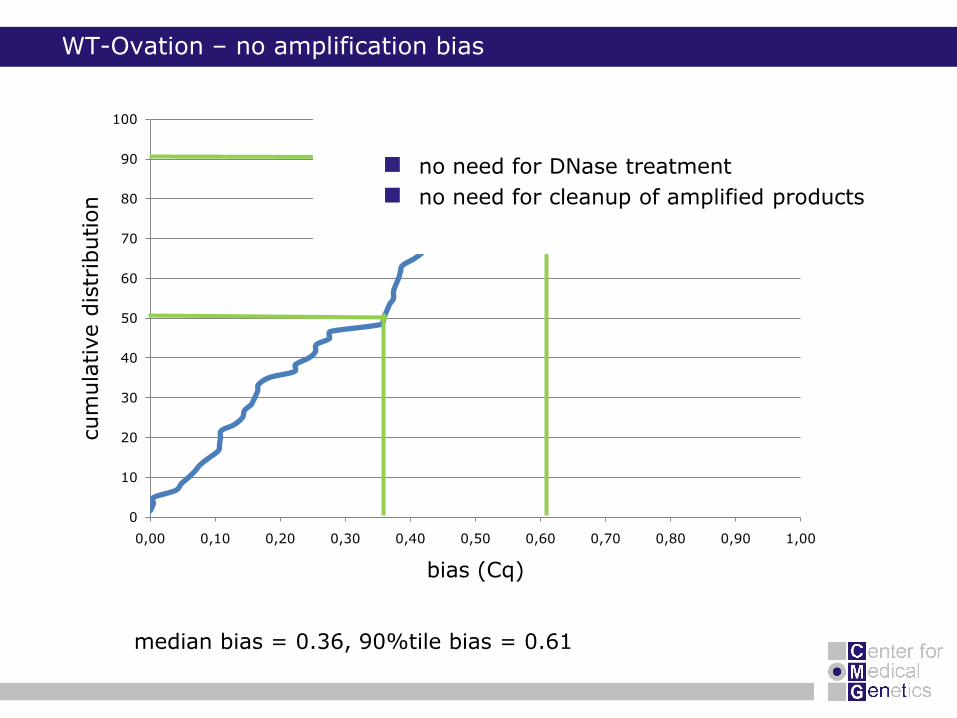
WT-Ovation – no amplification bias
median bias = 0.36, 90%tile bias = 0.61
0
10
20
30
40
50
60
70
80
90
100
0,00 0,10 0,20 0,30 0,40 0,50 0,60 0,70 0,80 0,90 1,00
cum
ula
tive
dis
trib
ution
bias (Cq)
no need for DNase treatment
no need for cleanup of amplified products
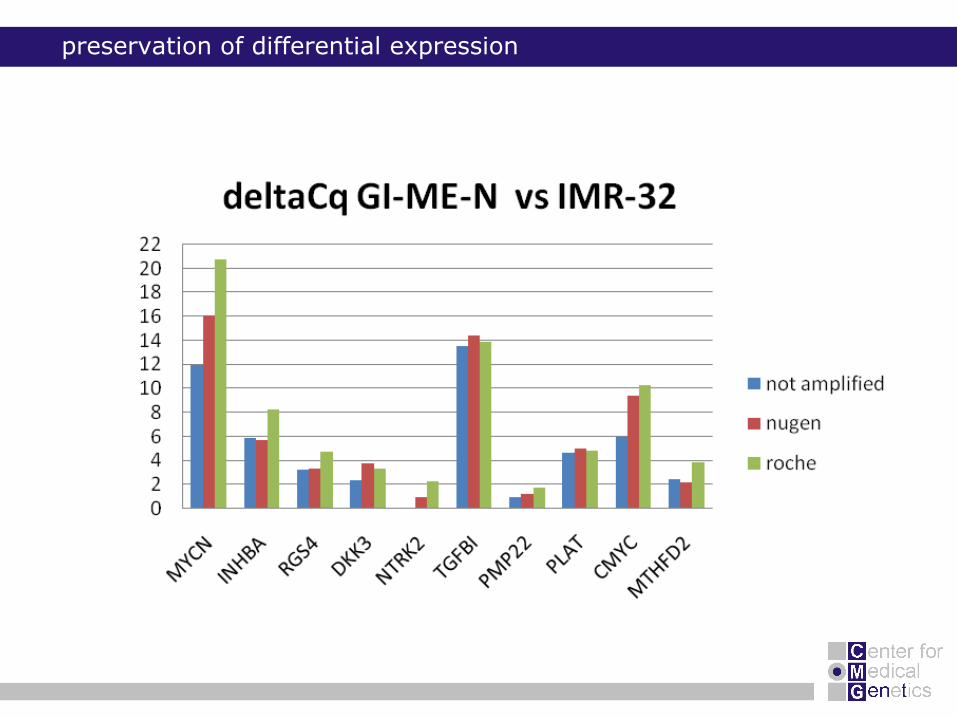
preservation of differential expression
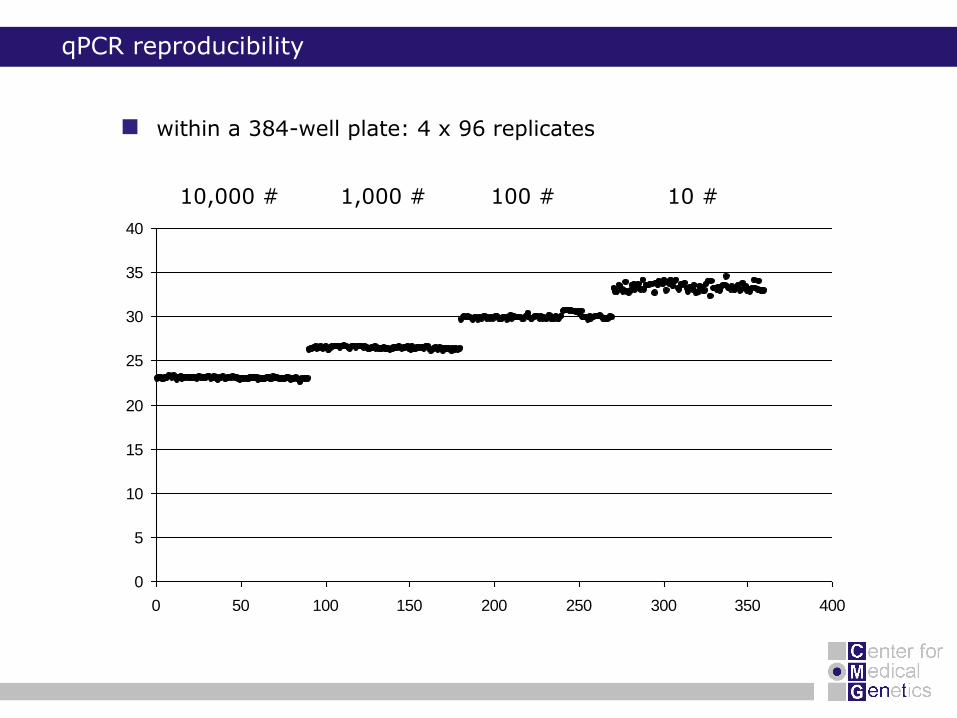
qPCR reproducibility
0
5
10
15
20
25
30
35
40
0 50 100 150 200 250 300 350 400
10 #100 #1,000 #10,000 #
within a 384-well plate: 4 x 96 replicates
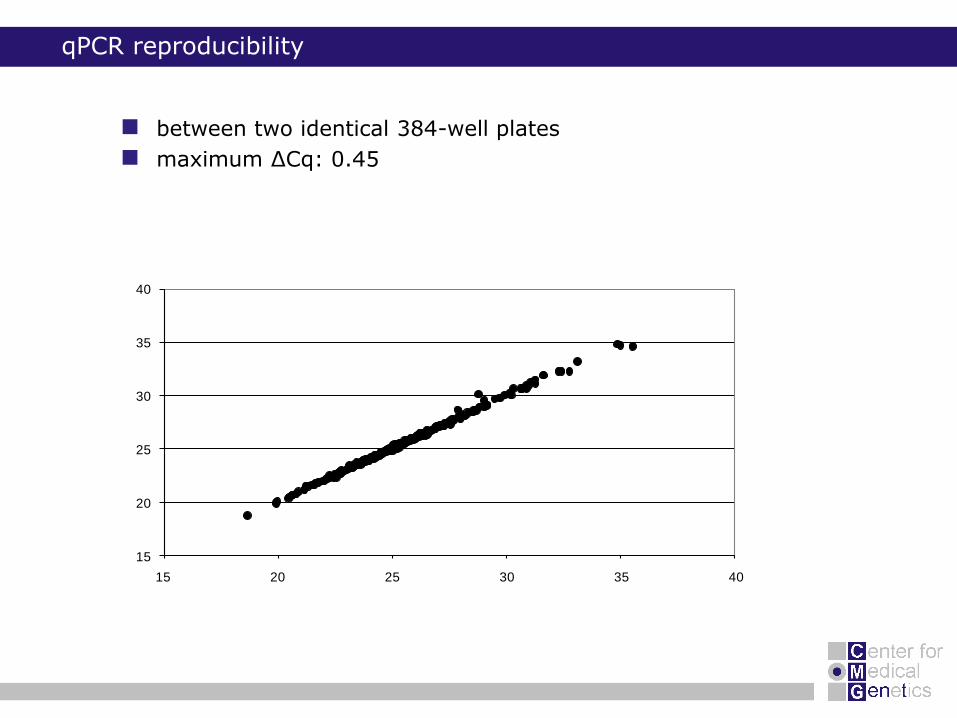
qPCR reproducibility
between two identical 384-well plates
maximum ΔCq: 0.45
15
20
25
30
35
40
15 20 25 30 35 40
synthetic control
55 nucleotides
PAGE purification
blocking group
5 points dilution series: 15 molecules > 150.000 molecules
RCRP
absolute standards
stufferFP
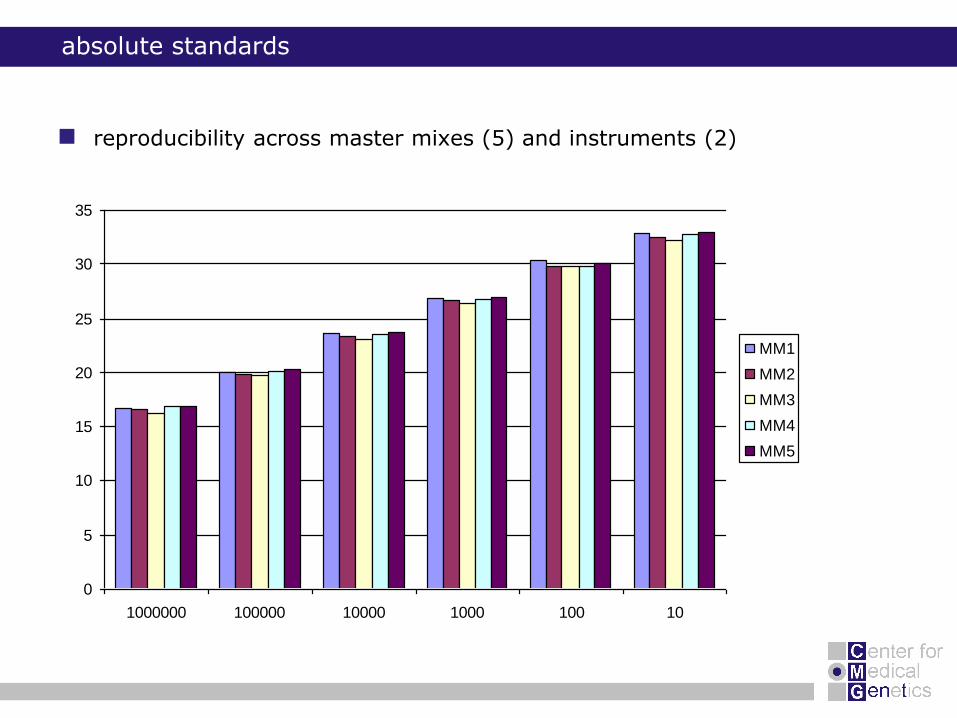
absolute standards
reproducibility across master mixes (5) and instruments (2)
0
5
10
15
20
25
30
35
1000000 100000 10000 1000 100 10
MM1
MM2
MM3
MM4
MM5
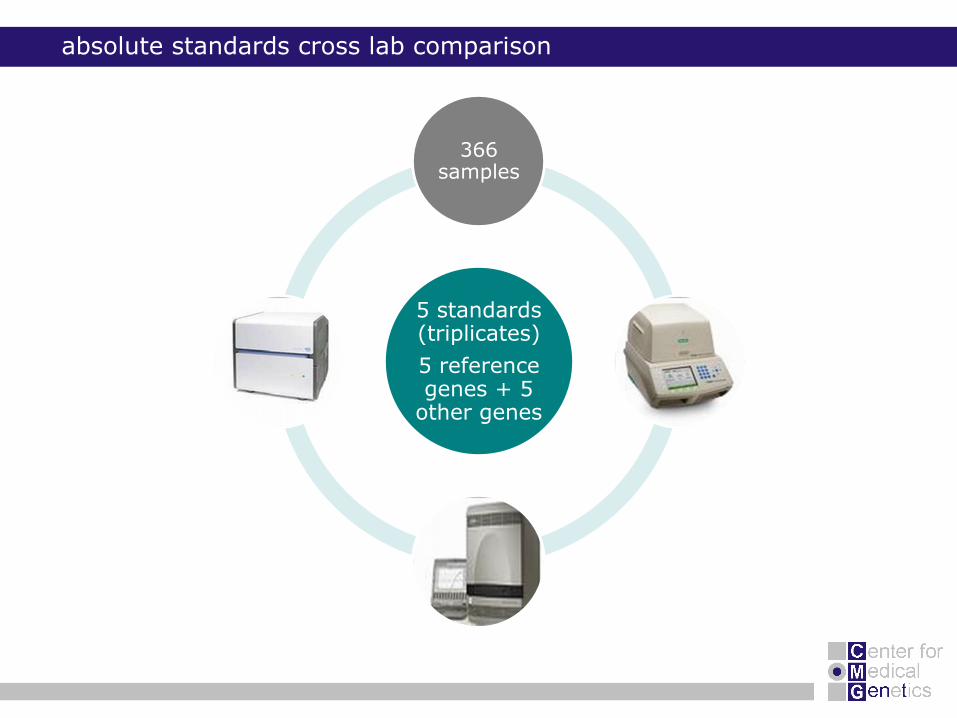
absolute standards cross lab comparison
5 standards (triplicates)
5 reference genes + 5
other genes
366 samples
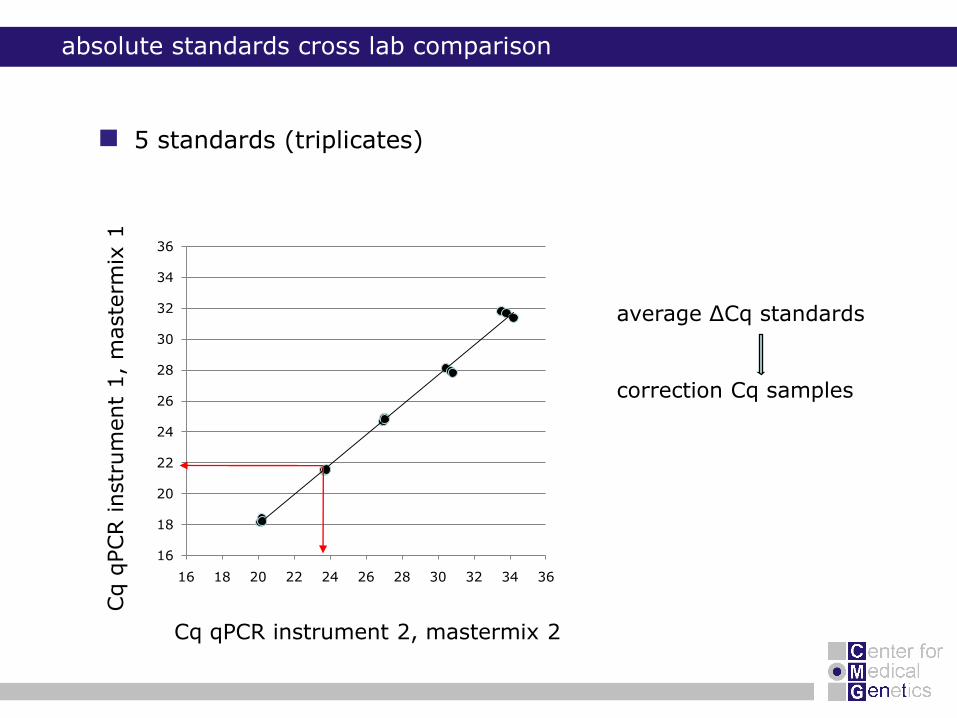
5 standards (triplicates)
absolute standards cross lab comparison
average ΔCq standards
correction Cq samples
Cq
qPCR
instr
um
ent
1,
maste
rmix
1
Cq qPCR instrument 2, mastermix 2
16
18
20
22
24
26
28
30
32
34
36
16 18 20 22 24 26 28 30 32 34 36
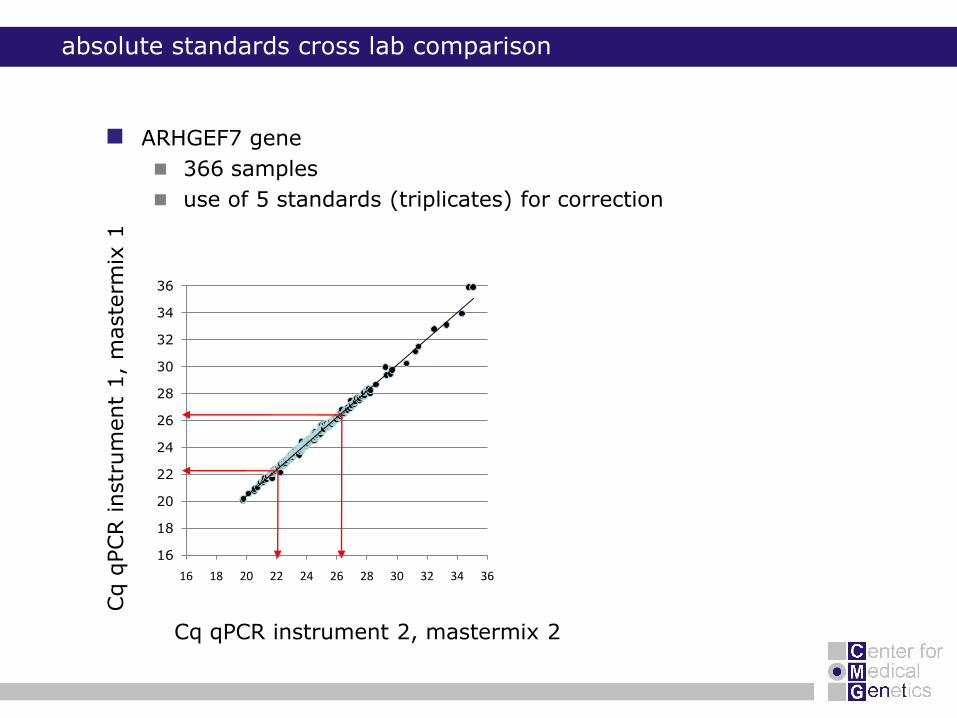
ARHGEF7 gene
366 samples
use of 5 standards (triplicates) for correction
absolute standards cross lab comparison
Cq
qPCR
instr
um
ent
1,
maste
rmix
1
Cq qPCR instrument 2, mastermix 2
16
18
20
22
24
26
28
30
32
34
36
16 18 20 22 24 26 28 30 32 34 36
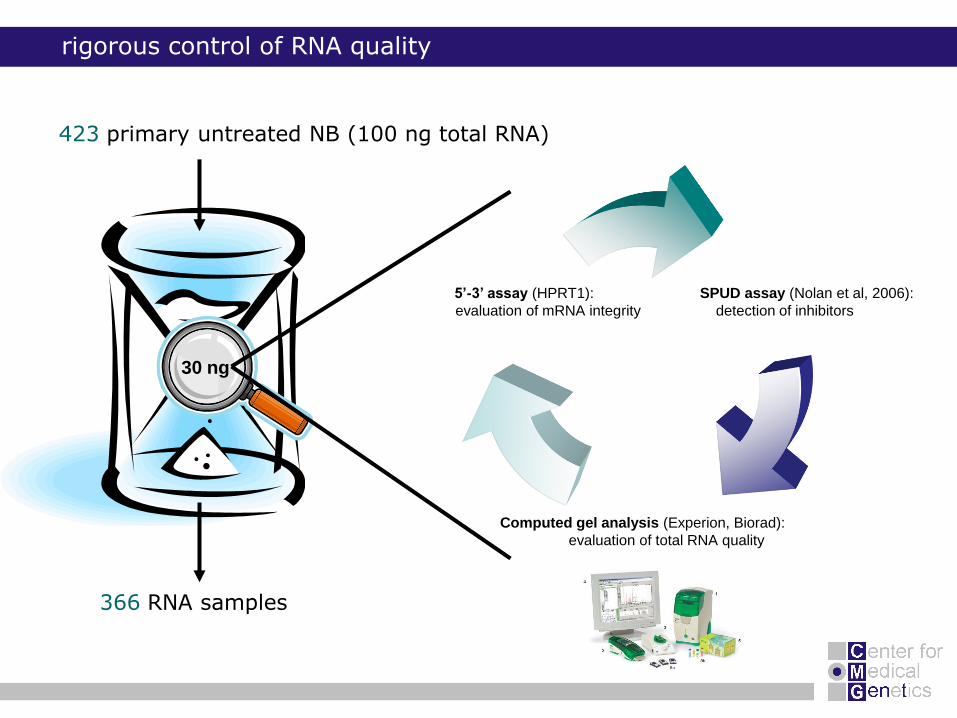
SPUD assay (Nolan et al, 2006):
detection of inhibitors
Computed gel analysis (Experion, Biorad):
evaluation of total RNA quality
5’-3’ assay (HPRT1):
evaluation of mRNA integrity
rigorous control of RNA quality
423 primary untreated NB (100 ng total RNA)
30 ng
366 RNA samples
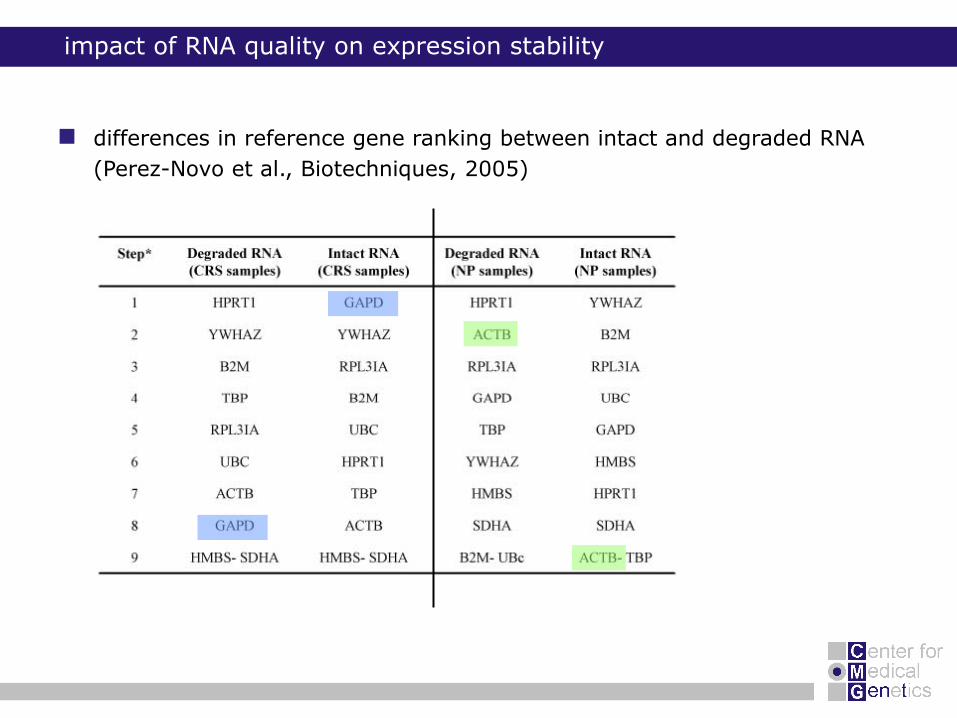
differences in reference gene ranking between intact and degraded RNA
(Perez-Novo et al., Biotechniques, 2005)
impact of RNA quality on expression stability
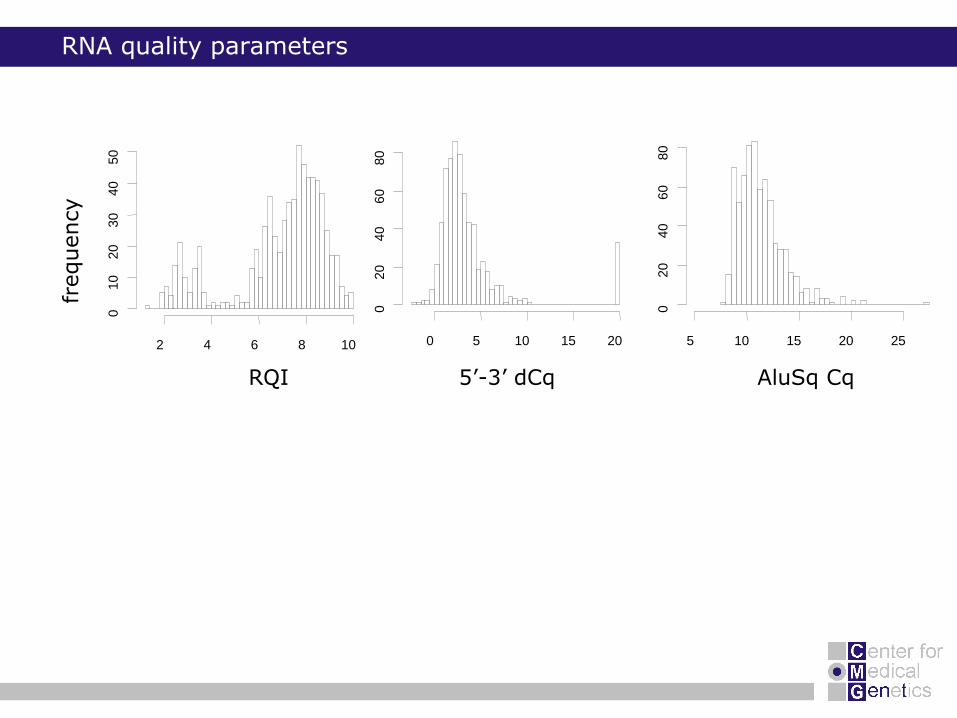
RNA quality parameters
2 4 6 8 10
010
20
30
40
50
0 5 10 15 20
020
40
60
80
5 10 15 20 25
020
40
60
80
RQI 5’-3’ dCq AluSq Cq
frequency
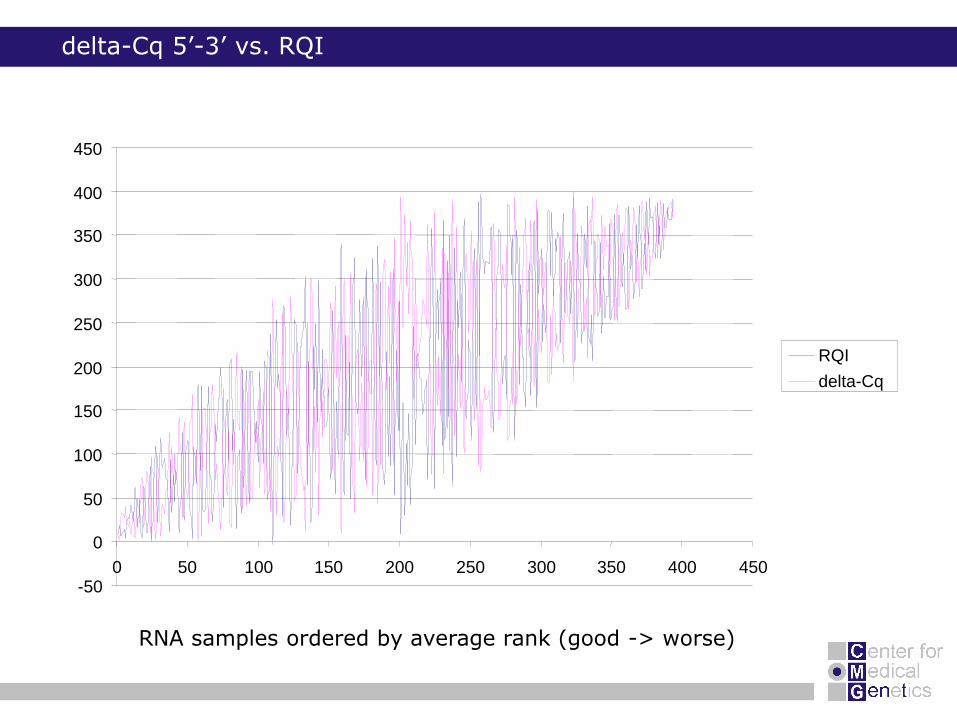
delta-Cq 5’-3’ vs. RQI
RNA samples ordered by average rank (good -> worse)
-50
0
50
100
150
200
250
300
350
400
450
0 50 100 150 200 250 300 350 400 450
RQI
delta-Cq
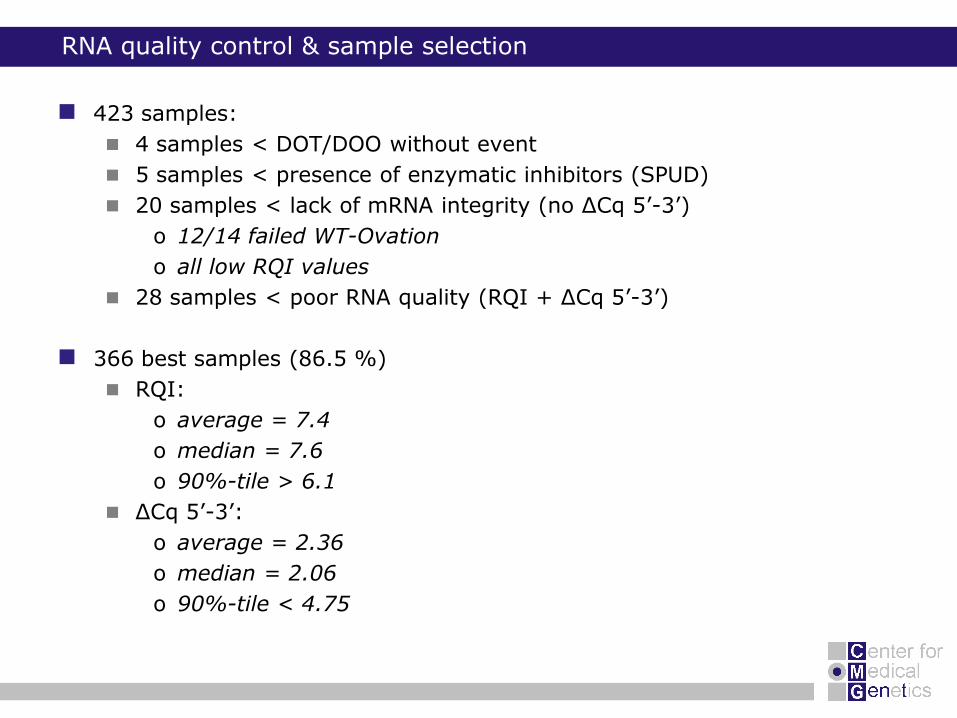
RNA quality control & sample selection
423 samples:
4 samples < DOT/DOO without event
5 samples < presence of enzymatic inhibitors (SPUD)
20 samples < lack of mRNA integrity (no ΔCq 5’-3’)
o 12/14 failed WT-Ovation
o all low RQI values
28 samples < poor RNA quality (RQI + ΔCq 5’-3’)
366 best samples (86.5 %)
RQI:
o average = 7.4
o median = 7.6
o 90%-tile > 6.1
ΔCq 5’-3’:
o average = 2.36
o median = 2.06
o 90%-tile < 4.75
normalisation using geNorm technology
framework for qPCR gene expression normalisation using the reference gene concept:
quantified errors related to the use of a single reference gene
(> 3 fold in 25% of the cases; > 6 fold in 10% of the cases)
developed a robust algorithm for assessment of expression stability of candidate reference genes
proposed the geometric mean of at least 3 reference genes for accurate and reliable normalisation
Vandesompele et al., Genome Biology, 2002
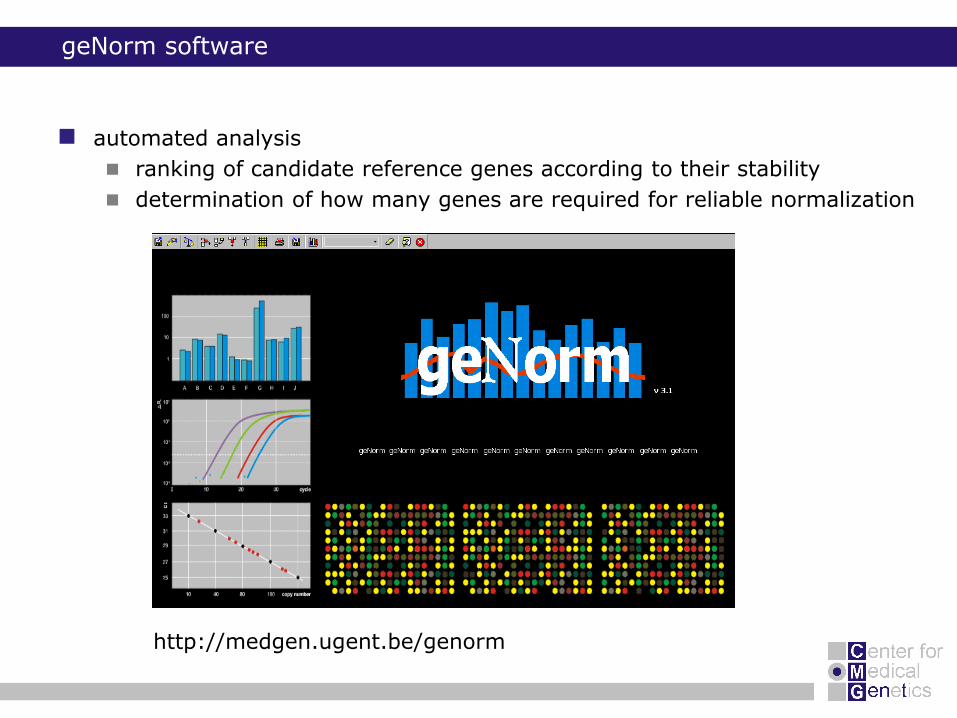
http://medgen.ugent.be/genorm
geNorm software
automated analysis
ranking of candidate reference genes according to their stability
determination of how many genes are required for reliable normalization
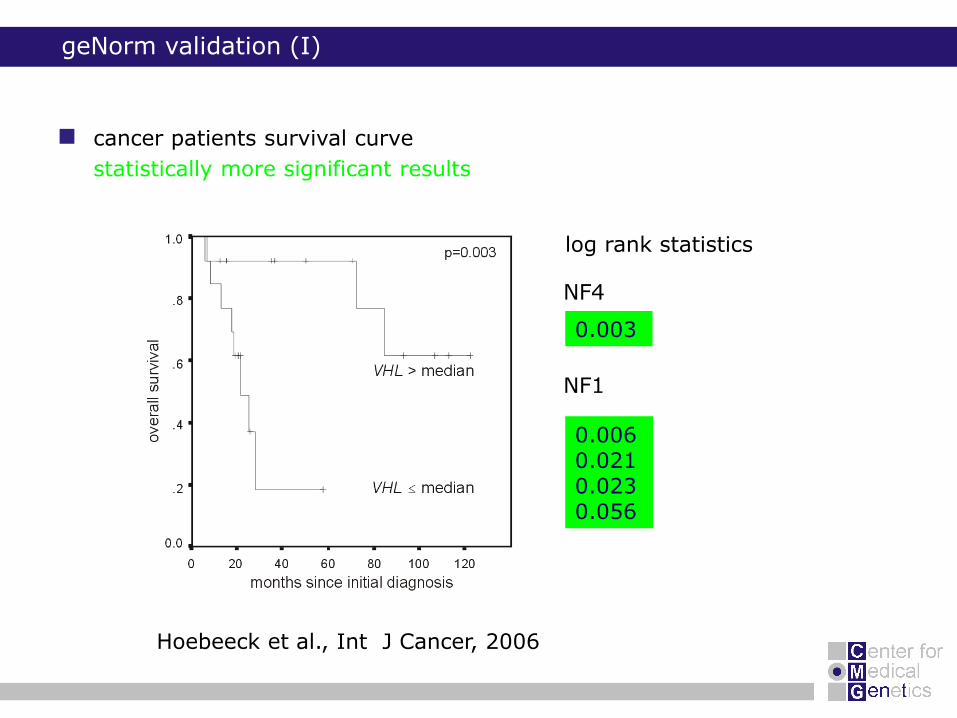
0.003
0.0060.0210.0230.056
NF4
NF1
cancer patients survival curve
statistically more significant results
geNorm validation (I)
log rank statistics
Hoebeeck et al., Int J Cancer, 2006
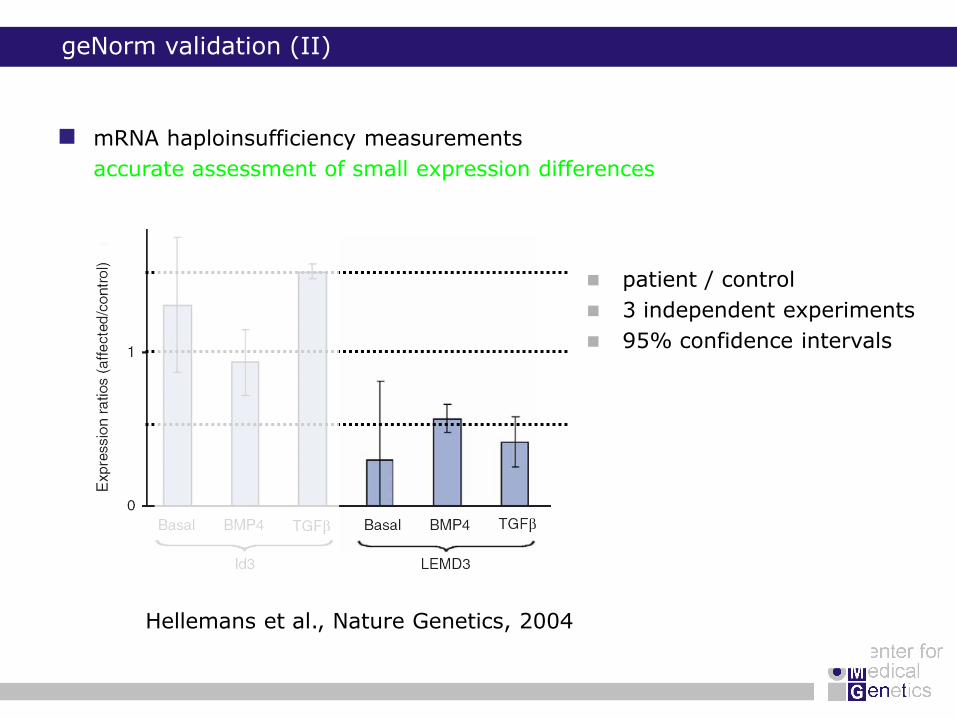
mRNA haploinsufficiency measurements
accurate assessment of small expression differences
geNorm validation (II)
Hellemans et al., Nature Genetics, 2004
patient / control
3 independent experiments
95% confidence intervals
use of multiple references is now well established
> 1250 citations of our geNorm technology in PubMed
> 8000 geNorm downloads in 100 countries
normalisation using multiple stable reference genes
data analysis using qbasePLUS
based on Ghent University’s geNorm and qBase technology
up to fifty 384-well plates
multiple reference genes for accurate normalization
detection and correction of inter-run variation
dedicated error propagation
automated analysis; no manual interaction required
data analysis
http://www.qbaseplus.com
data analysis using qbasePLUS
based on Ghent University’s geNorm and qBase technology
up to fifty 384-well plates
multiple reference genes for accurate normalization
detection and correction of inter-run variation
dedicated error propagation
automated analysis; no manual interaction required
59 prognostic markers + 5 reference genes
366 samples
hierarchical clustering
survival analysis
Prediction Analysis of Microarrays
Cox proportional hazards modeling
Kaplan-Meier
data analysis
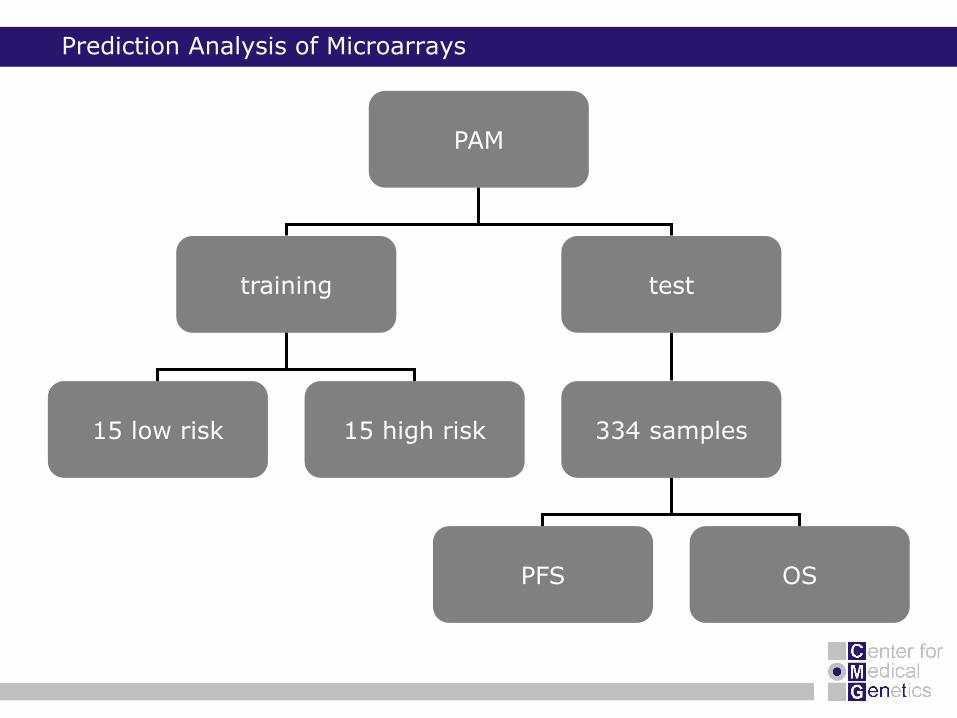
Prediction Analysis of Microarrays
PAM
training test
15 low risk 15 high risk 334 samples
PFS OS
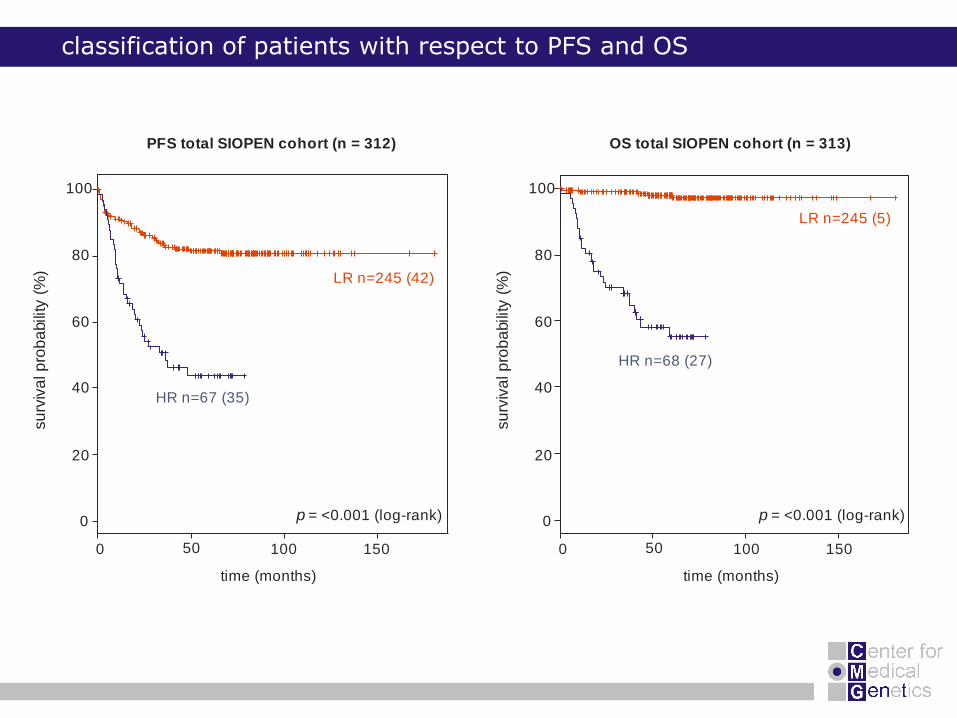
classification of patients with respect to PFS and OS
0 50 100 150
OS total SIOPEN cohort (n = 313)
su
rviv
al p
rob
abili
ty (
%)
LR n=245 (5)
HR n=68 (27)
p = <0.001 (log-rank)0
20
40
60
100
80
time (months)
0 50 100 150
PFS total SIOPEN cohort (n = 312)
su
rviv
al p
rob
abili
ty (
%) LR n=245 (42)
HR n=67 (35)
p = <0.001 (log-rank)0
20
40
60
100
80
time (months)
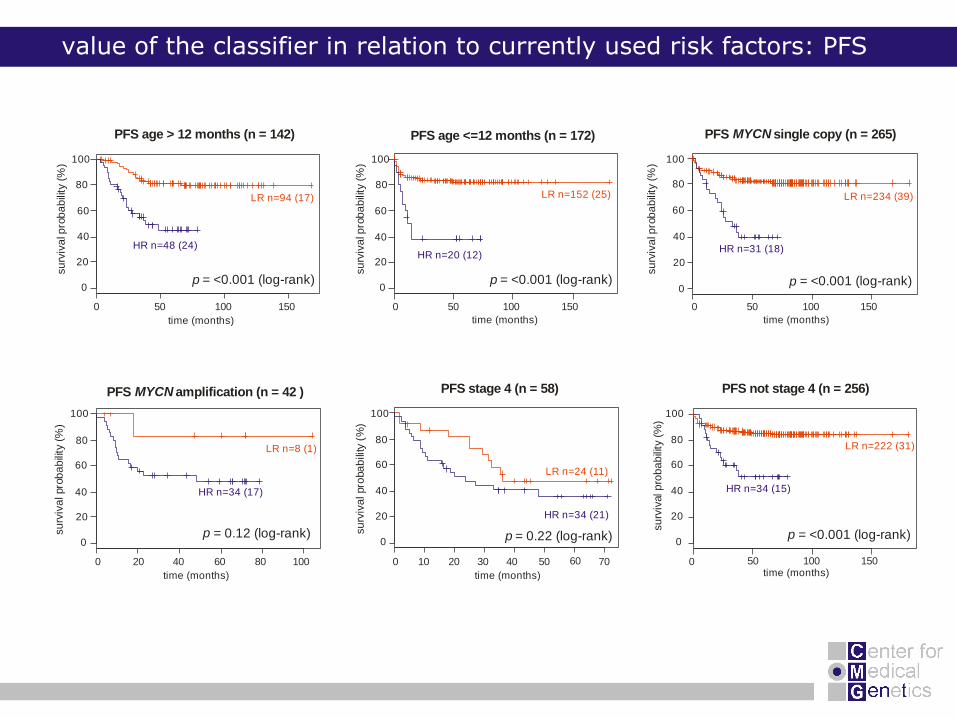
value of the classifier in relation to currently used risk factors: PFS
0 50 100 150
0 20 40 60 80 100 0 10 20 30 40 50 60 70
LR n=94 (17) LR n=152 (25) LR n=234 (39)
LR n=222 (31)LR n=8 (1)
LR n=24 (11)
HR n=48 (24) HR n=31 (18)
HR n=34 (21)
HR n=34 (15)HR n=34 (17)
HR n=20 (12)
p = <0.001 (log-rank)
p = <0.001 (log-rank)
p = <0.001 (log-rank)p = <0.001 (log-rank)
p = 0.12 (log-rank)
time (months)
0 50 100 150
time (months)
0 50 100 150
time (months)
0 50 100 150time (months)time (months)time (months)
100
80
60
40
20
0
su
rviv
al p
rob
ab
ility
(%
) 100
80
60
40
20
0
su
rviv
al p
rob
ab
ility
(%
)
100
80
60
40
20
0
su
rviv
al pro
ba
bili
ty (
%)
100
80
60
40
20
0
su
rviv
al pro
ba
bili
ty (
%)
100
80
60
40
20
0
su
rviv
al p
rob
ab
ility
(%
)su
rviv
al p
rob
ab
ility
(%
)
PFS age <=12 months (n = 172)
PFS not stage 4 (n = 256)PFS stage 4 (n = 58)PFS amplification (n = 42 )MYCN
PFS single copy (n = 265)MYCNPFS age > 12 months (n = 142)
p = 0.22 (log-rank)
100
80
60
40
20
0
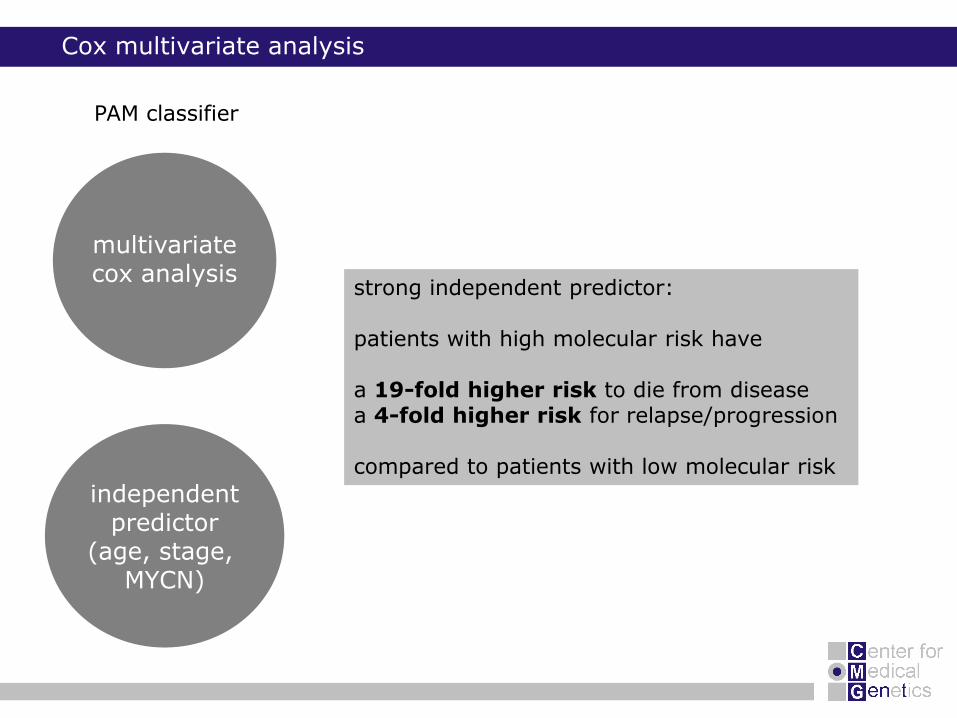
Cox multivariate analysis
independentpredictor
(age, stage, MYCN)
multivariatecox analysis
PAM classifier
strong independent predictor:
patients with high molecular risk have
a 19-fold higher risk to die from diseasea 4-fold higher risk for relapse/progression
compared to patients with low molecular risk
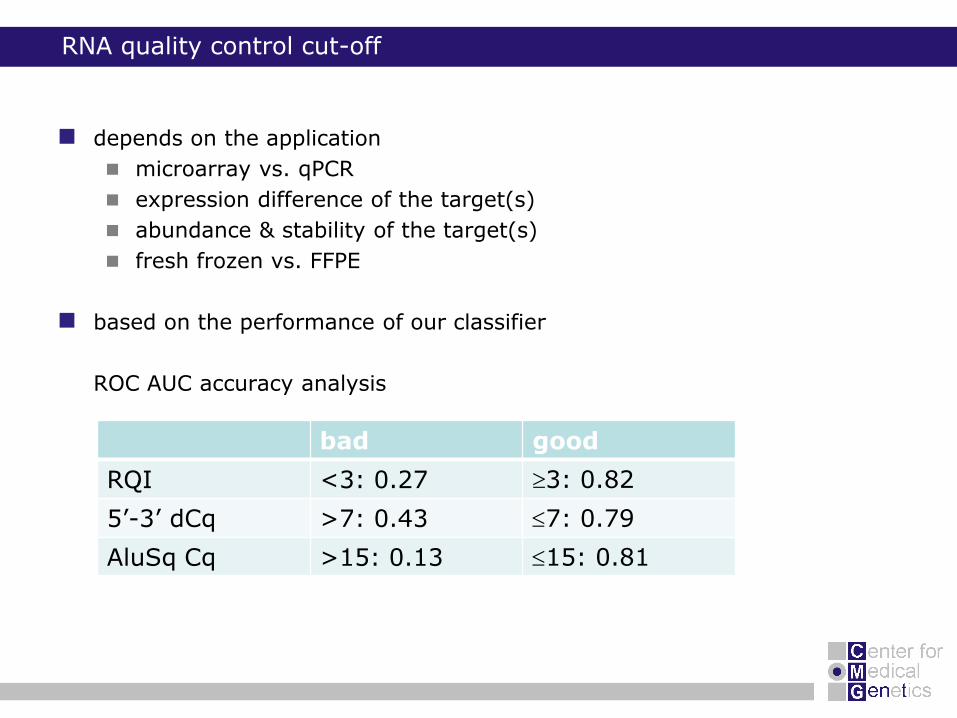
RNA quality control cut-off
depends on the application
microarray vs. qPCR
expression difference of the target(s)
abundance & stability of the target(s)
fresh frozen vs. FFPE
based on the performance of our classifier
ROC AUC accuracy analysis
bad good
RQI <3: 0.27 3: 0.82
5’-3’ dCq >7: 0.43 7: 0.79
AluSq Cq >15: 0.13 15: 0.81
conclusions (I)
validation matters – quality control along the entire workflow
assay performance
template quality
normalization
data-analysis
conclusions (II)
largest qPCR gene-expression study (rigourous RNA quality control)
optimized workflow
using minimal amounts of RNA (100 ng)
use of absolute standards (cross-lab comparison)
selected gene list (59) on a large panel of tumours (366 + 223)
robust multigene expression prognostic classifier
validated on an independent set of tumours
independent after controling for other known risk factors
suitable for routine lab tests
this study might form the basis for future research, i.e. prospective studies
cDNA library source for future qPCR gene expression studies
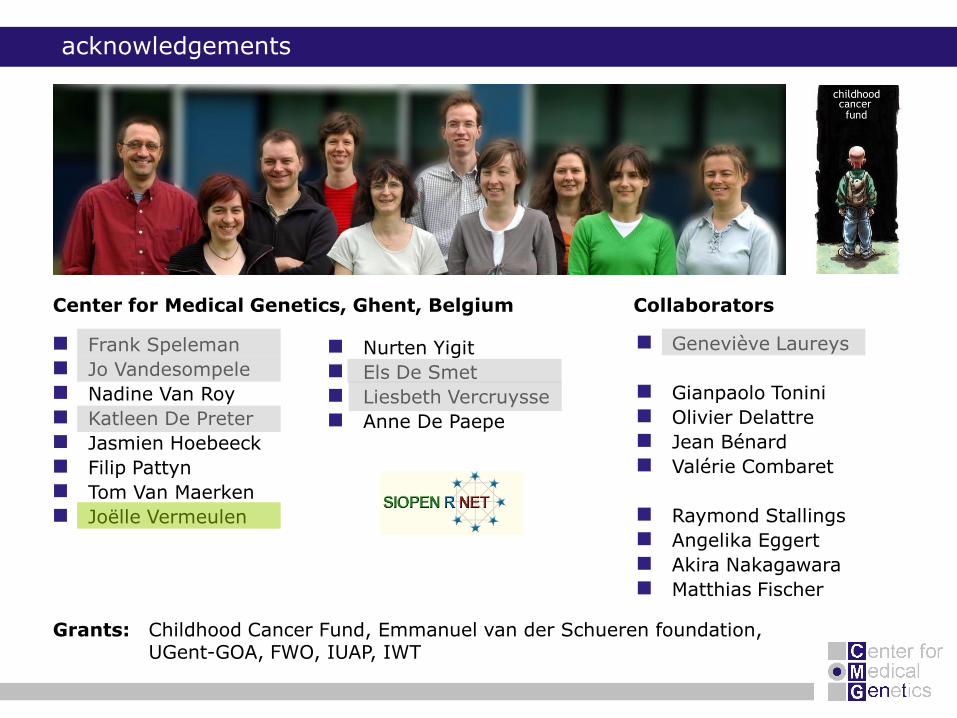
Frank Speleman
Jo Vandesompele
Nadine Van Roy
Katleen De Preter
Jasmien Hoebeeck
Filip Pattyn
Tom Van Maerken
Joëlle Vermeulen
Center for Medical Genetics, Ghent, Belgium
Geneviève Laureys
Gianpaolo Tonini
Olivier Delattre
Jean Bénard
Valérie Combaret
Raymond Stallings
Angelika Eggert
Akira Nakagawara
Matthias Fischer
Grants: Childhood Cancer Fund, Emmanuel van der Schueren foundation, UGent-GOA, FWO, IUAP, IWT
Collaborators
Nurten Yigit
Els De Smet
Liesbeth Vercruysse
Anne De Paepe
acknowledgements