Embed Size (px)
DESCRIPTION
Oil. Oil. CHARACTERIZATION AND ALTERATION OF WETTABILITY STATES OF ALASKAN RESERVOIRS TO IMPROVE OIL RECOVERY EFFICIENCY. Abhijit Y. Dandekar, UAF (PI) Shirish L. Patil, UAF (Co-PI) Santanu Khataniar, UAF (Co-PI) Shivkumar Patil (Graduate Student). Prasad Saripalli, PNNL (PI) - PowerPoint PPT Presentation
Citation preview
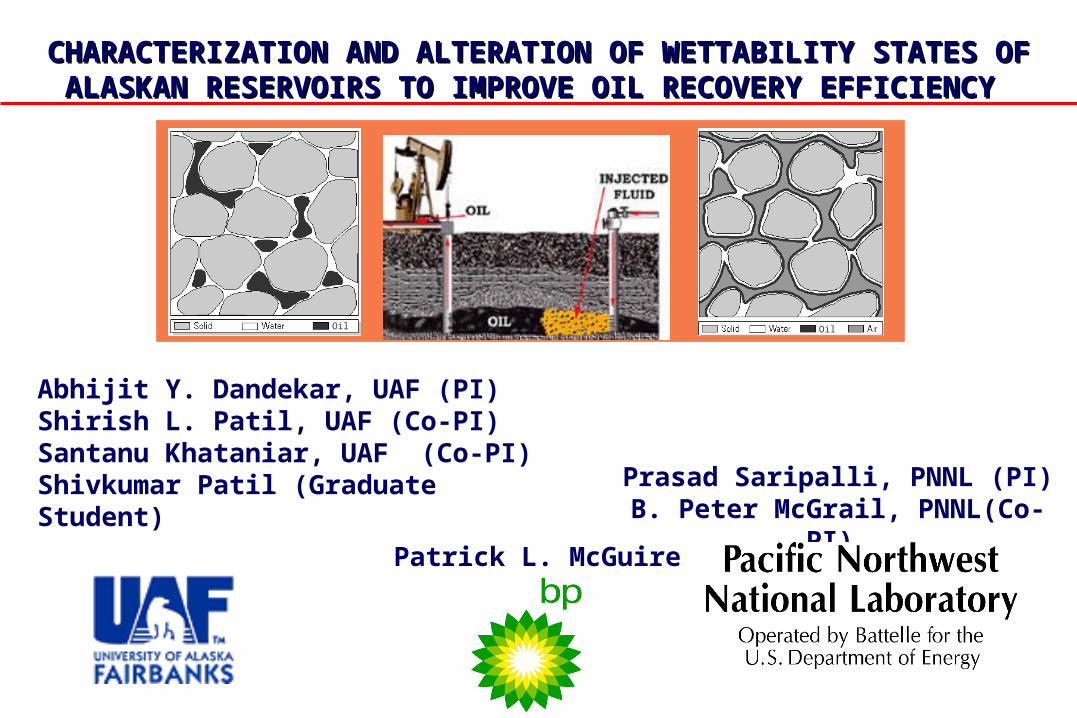
CHARACTERIZATION AND ALTERATION OF WETTABILITY STATES OF CHARACTERIZATION AND ALTERATION OF WETTABILITY STATES OF ALASKAN RESERVOIRS TO IMPROVE OIL RECOVERY EFFICIENCY ALASKAN RESERVOIRS TO IMPROVE OIL RECOVERY EFFICIENCY
Prasad Saripalli, PNNL (PI)B. Peter McGrail, PNNL(Co-PI)
Abhijit Y. Dandekar, UAF (PI)Shirish L. Patil, UAF (Co-PI) Santanu Khataniar, UAF (Co-PI) Shivkumar Patil (Graduate Student)
Patrick L. McGuire
OilOil

OUTLINEOUTLINEFocus on wettabilityExperiment DetailsPKS Data of CoresResultsConclusion/SummaryFuture workProgress

FOCUS ON WETTABILITYFOCUS ON WETTABILITY Relative distribution of fluids within the pore space of a
reservoir rock is controlled by wettability, i.e., influence on Sor or oil recovery
Residual oil saturation is controlled by a complex, poorly understood interaction involving water, oil, and mineral chemistry
Oil/Brine/Rock system Wettability is a function of numerous variables; prominent ones being fluid chemistry and rock type
USBM and Amott considered as industry standards; however they characterize average wettability and are inadequate for mixed wettability characterization

Experiments are being carried out to determine the secondary oil recovery potential of low salinity brine injection and the effect of wettability variation on Sor
Two sets of experiments were carried out
Experiment 1 Observing the effect of oil aging on wettability and consequently on Sor value of ANS cores.
EXPERIMENT DETAILSEXPERIMENT DETAILS

EXPERIMENT DETAILSEXPERIMENT DETAILS
Experiment 2 Determine the secondary oil recovery potential of low salinity brine injection and the effect of wettability variation on Sor.
Test Materials for Experiment- Cores- 1.5” diameter, 0.8” length, Clean and Oil
Aged Alaska North Slope cores. Crude Oil- Alaska North Slope crude oil.

All brines were reconstituted in the lab using NaCl, NaHCO3, Na2SO4, KCl, CaCl2, SrCl2, MgCl2 and distilled water. High salinity brine = 22,000 TDS. Low salinity brine = 11,000 TDS and 5,500 TDS salinities respectively.
EXPERIMENT DETAILSEXPERIMENT DETAILS
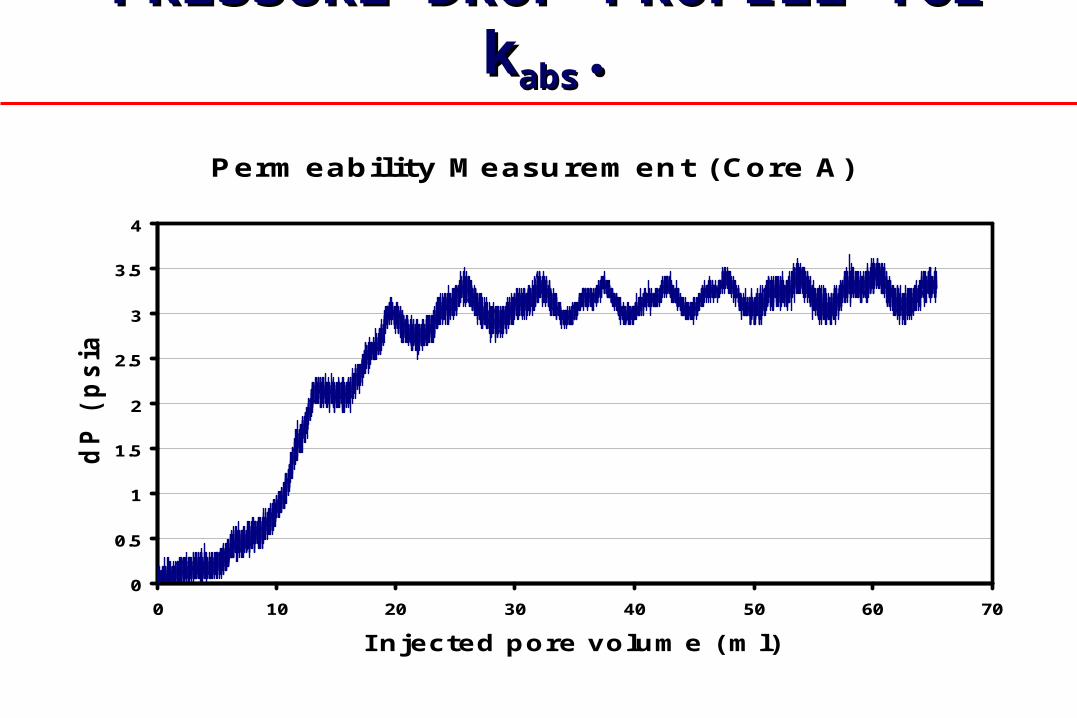
PRESSURE DROP PROFILE for kPRESSURE DROP PROFILE for kabsabs..
Permeability Measurement (Core A)
0
0.5
1
1.5
2
2.5
3
3.5
4
0 10 20 30 40 50 60 70
I njected pore volume (ml)
dP
(p
sia
)

PKS DATA – ANS CORESPKS DATA – ANS CORES
Porosity of Cores
0.1989 0.19680.2078
0.3334
0.339
0
0.1
0.2
0.3
0.4
A B C D E
Core Name
Po
rosi
ty
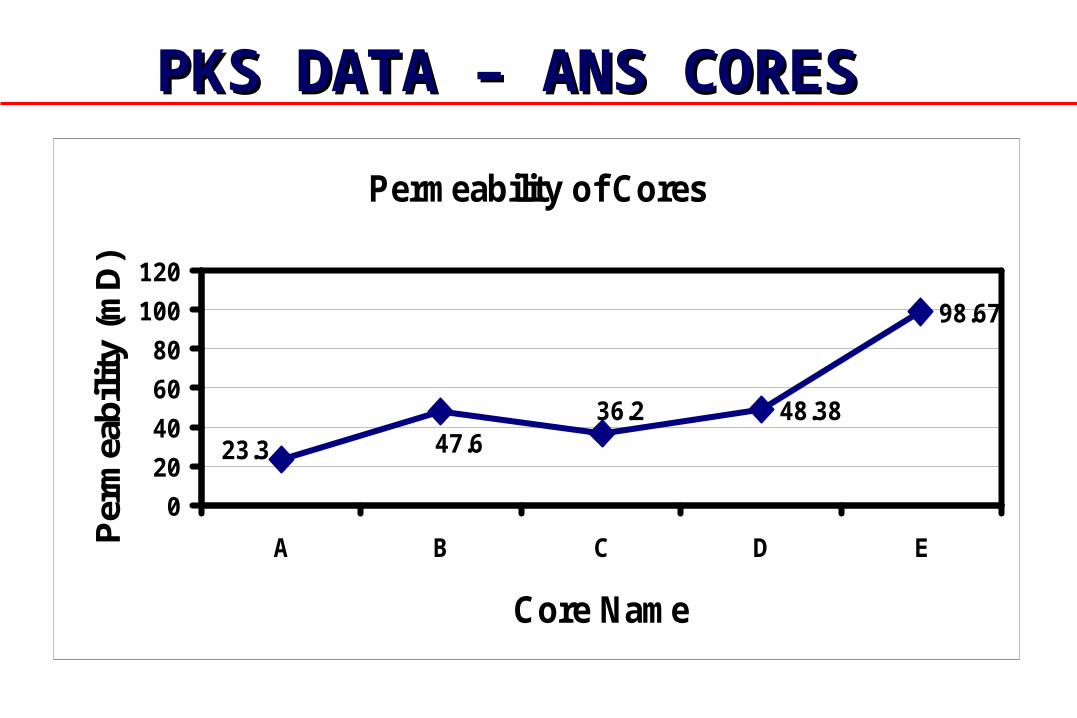
Permeability of Cores
48.38
98.67
47.623.3
36.2
0
20
40
60
80
100
120
A B C D E
Core Name
Per
mea
bilit
y (m
D)
PKS DATA – ANS CORESPKS DATA – ANS CORES

Experiment 1 Experiment 2
Oil aged core sample New i.e. clean core sample
Water flooding Rates of 30 cc/hr.
Water flooding Rates of 30 cc/hr.
Overburden Pressure of 500 psi is used in all floods.
Overburden Pressure of 500 psi is used in all floods.
Flood temperature - Reservoir temperature.
Flood temperature - Reservoir temperature.
EXPERIMENT DETAILSEXPERIMENT DETAILS

Preparation for Experiment 1
Connate water saturation (Swc) was established in the cores on which already high and low salinity waterflood tests had been carried out. (Core A, Core C, Core D)
Cores were oil aged for 21 days in an autoclave.
Reason behind aging- To observe the role of crude oil constituents on the salinity dependence of wettability and oil recovery
EXPERIMENT DETAILSEXPERIMENT DETAILS

WATER FLOODING (C ore D,new core)
0.00
0.05
0.10
0.15
0.20
0.25
0.30
0.35
0.0 1.0 2.0 3.0 4.0 5.0 6.0 7.0 8.0 9.0 10.0 11.0 12.0
Injected Brine (PV)
22000 T D S
11000 T D S
5500 T D S
RESULTSRESULTS
Quarter: Nov-Jan

RESULTS…RESULTS…continuedcontinued
0.4430.4543
0.41250.4317
0.4112
0.38
0.4
0.42
0.44
0.46
Sor
22000 TDS 11000 TDS 5500 TDS
Brine Salinity
Sor vs Brine Salinity (Core D)Before Aging After Aging
Quarter: Nov-Jan
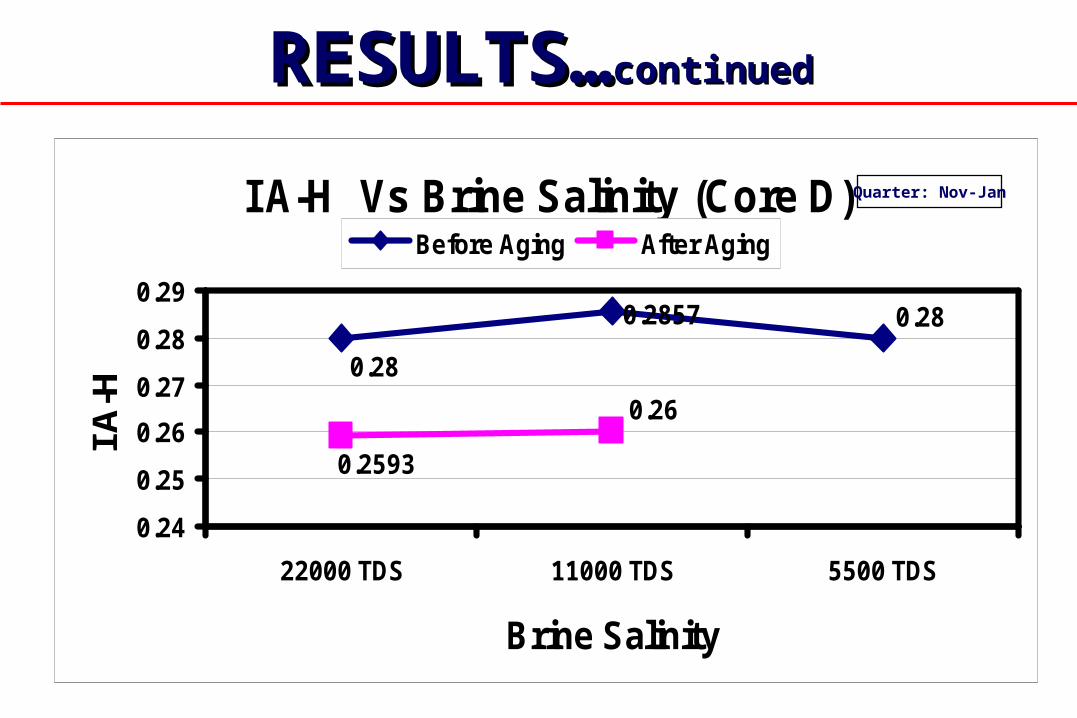
RESULTS…RESULTS…continuedcontinued
I A-H Vs Brine Salinity (Core D)
0.28
0.2857 0.28
0.2593
0.26
0.24
0.25
0.26
0.27
0.28
0.29
22000 TDS 11000 TDS 5500 TDS
Brine Salinity
I A-H
Before Aging After Aging
Quarter: Nov-Jan
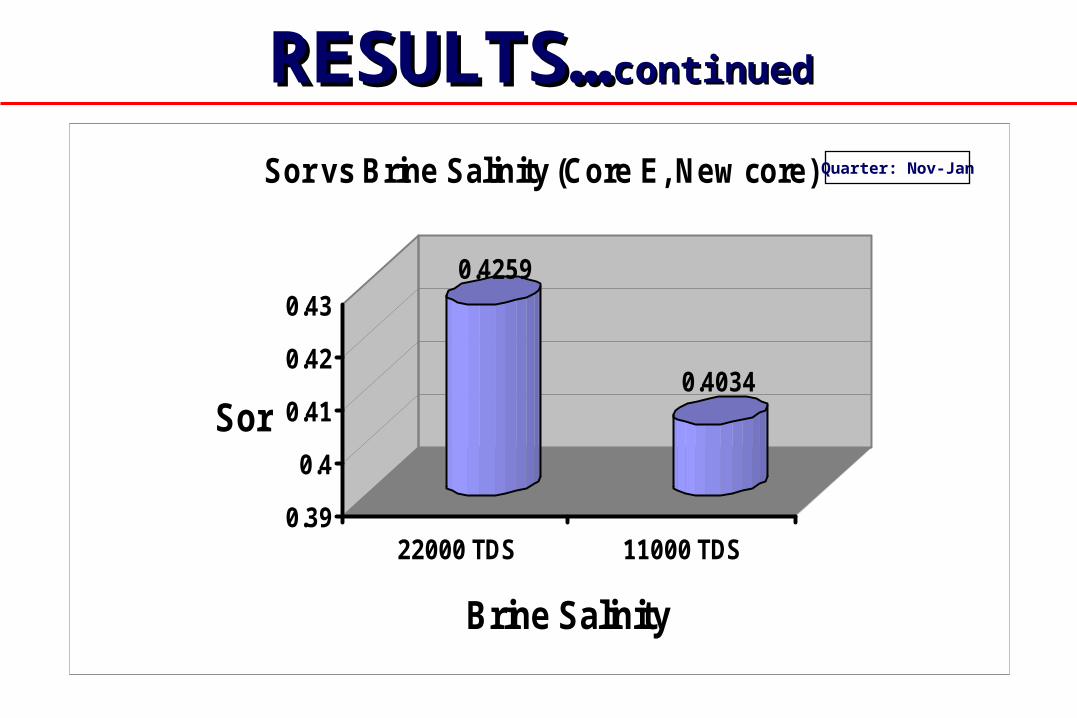
RESULTS…RESULTS…continuedcontinued
0.4259
0.4034
0.39
0.4
0.41
0.42
0.43
Sor
22000 TDS 11000 TDS
Brine Salinity
Sor vs Brine Salinity (Core E, New core) Quarter: Nov-Jan

RESULTS…RESULTS…continuedcontinued
I A-H vs Brine Salinity (Core E, New core)
0.3182
0.3077
0.3
0.305
0.31
0.315
0.32
22000 TDS 11000 TDS
Brine Salinity
I A-H
Quarter: Nov-Jan

RESULTS…RESULTS…continuedcontinued
0.44560.3959 0.4239
0.2033
0.4131
0.1986
0
0.05
0.1
0.15
0.2
0.25
0.3
0.35
0.4
0.45
Sor
22000 11000 5500
Brine Salinity (TDS)
Sor vs Brine salinity (Core A)
After Oil Aging Before Oil Aging

I A-H vs Brine salinity (Core A)
0.3810.36890.375
0.45450.450.44
0
0.2
0.4
0.6
22000 11000 5500
Brine salinity (TDS)
I A-H
After oil Aging Before oil Aging
RESULTS…RESULTS…continuedcontinued

RESULTS…RESULTS…continuedcontinued
0.3862
0.4738
0.2695
0.4565
0.253
0.45
0
0.05
0.10.15
0.2
0.250.3
0.350.4
0.45
0.5
Sor
22000 TDS 11000 TDS 5500 TDS
Brine Salinity
Sor Vs Brine Salinity (Core C)
Before Aging After Aging

RESULTS…RESULTS…continuedcontinued
I A-H vs Brine Salinity (Core C)
0.39
0.43
0.450.45
0.380.385
0.34
0.36
0.38
0.4
0.42
0.44
0.46
22000 TDS 11000 TDS 5500 TDS
Brine Salinity
I A-H
Before Aging After Aging

RESULTS…RESULTS…continuedcontinued
0.3959
0.2033 0.1986
0
0.1
0.2
0.3
0.4
Sor
22000 TDS 11000 TDS 5500 TDS
Brine Salinity
Sor vs Brine Salinity (Core B, New Core)

RESULTS…RESULTS…continuedcontinued
I A-H vs Brine Salinity (Core B, New core)
0.35
0.36
0.38
0.33
0.34
0.35
0.36
0.37
0.38
0.39
22000 TDS 11000 TDS 5500 TDS
Brine Salinity
I A-H

CONCLUSIONS/SUMMARYCONCLUSIONS/SUMMARY• Low salinity waterfloods performed on core A,
B, C, D, E showed reduction in Sor with reduction in salinity.
• The injection of low salinity brine resulted in slight increase in the water-wetness of the
core samples.

CONCLUSIONS/SUMMARYCONCLUSIONS/SUMMARYEffect of oil aging: (Core A, C & D) Because of oil aging the wettability of core is decreased (in water wetting) compared to its previous wettability (wettability when cores were unaged) Increase in Sor value; however, with low salinity
brine injection Sor value reduced.
The wettability of original mineral surfaces can be altered by the adsorption of polar compounds
and/or the deposition of organic matter that was originally in the crude oil.

FUTURE WORKFUTURE WORK
Conducting coreflood experiments on oil aged core samples.
Core flooding studies at complete reservoir conditions with live oil are to be conducted.

PROGRESSPROGRESS
No cost extension upto 9/30/2007

THANK YOU!THANK YOU!