Embed Size (px)
Citation preview

PRAIRIE VIEW A&M UNIVERSITY
ENROLLMENT SNAPSHOTS
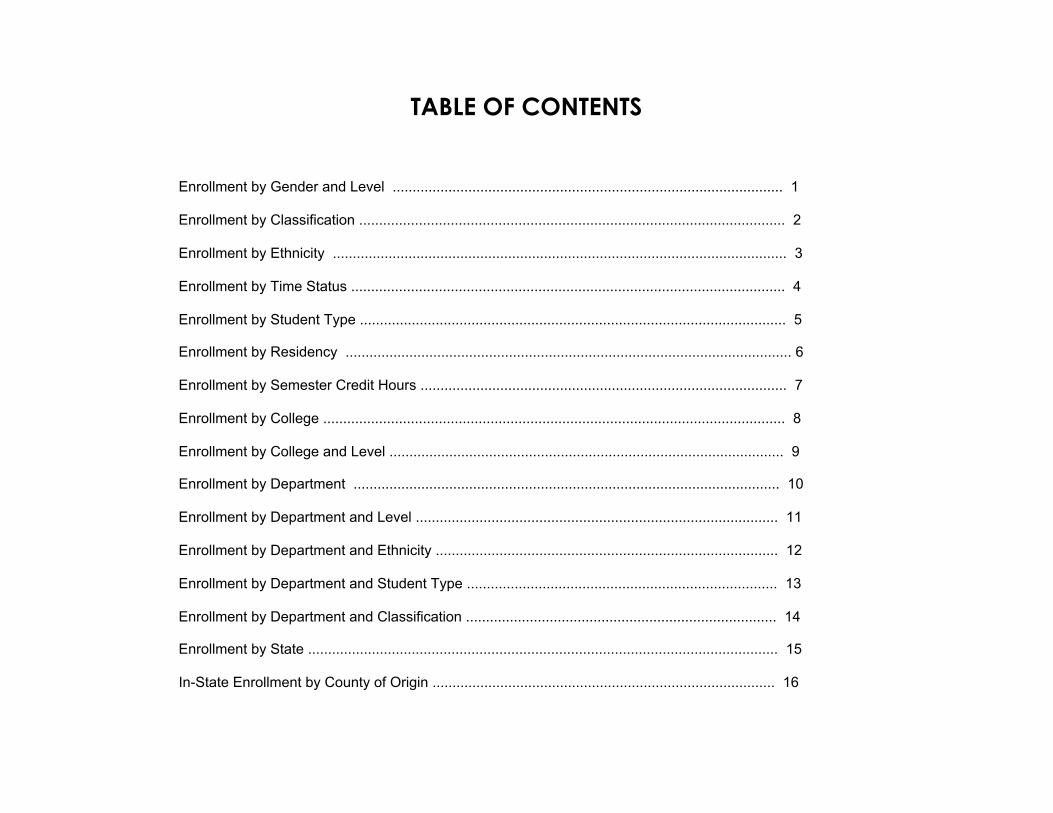
TABLE OF CONTENTS
Enrollment by Gender and Level .................................................................................................. 1 Enrollment by Classification ........................................................................................................... 2 Enrollment by Ethnicity .................................................................................................................. 3 Enrollment by Time Status ............................................................................................................. 4 Enrollment by Student Type ........................................................................................................... 5 Enrollment by Residency ................................................................................................................ 6 Enrollment by Semester Credit Hours ............................................................................................ 7 Enrollment by College .................................................................................................................... 8 Enrollment by College and Level ................................................................................................... 9 Enrollment by Department ........................................................................................................... 10 Enrollment by Department and Level ........................................................................................... 11 Enrollment by Department and Ethnicity ...................................................................................... 12 Enrollment by Department and Student Type .............................................................................. 13 Enrollment by Department and Classification .............................................................................. 14 Enrollment by State ...................................................................................................................... 15 In-State Enrollment by County of Origin ...................................................................................... 16
ENROLLMENT BY GENDER & LEVELSummer 2011
LEVEL
GENDER
Male Female Grand Total
Undergraduate
Graduate
Post Bacc
Doctorate
Grand Total 2,601
86
17
782
1,716
1,678
42
10
601
1,025
923
44
7
181
691
Female1,678
Male923
1
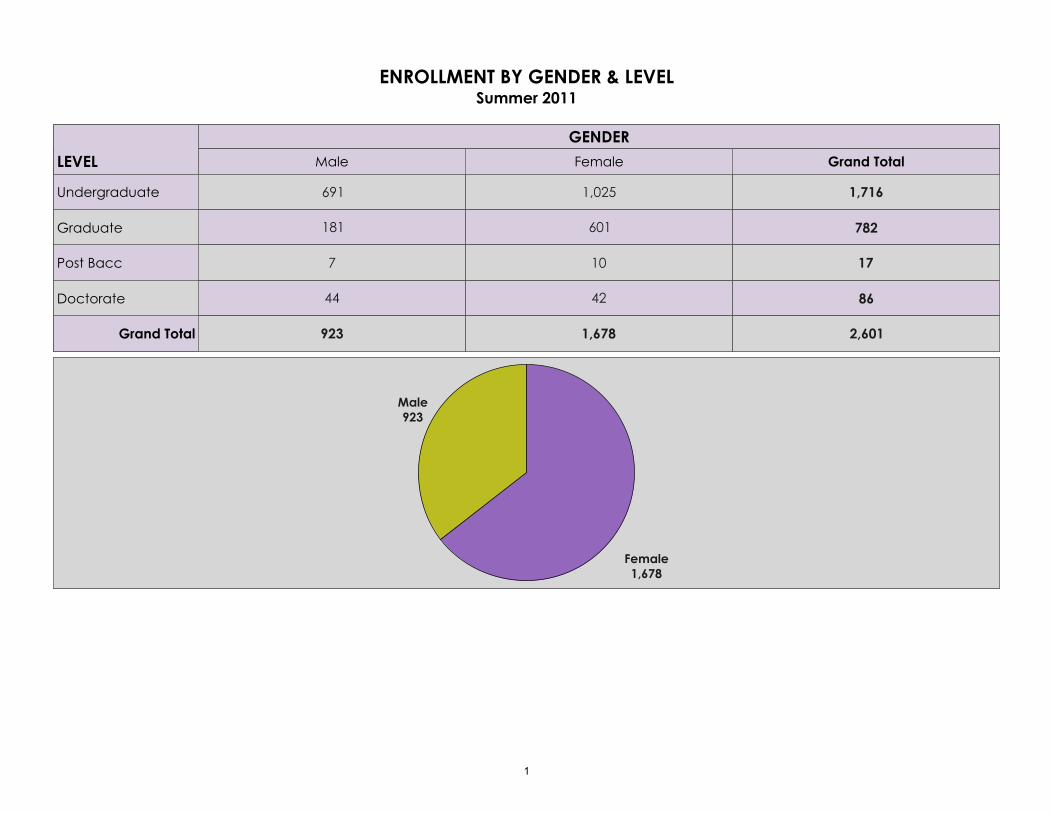
ENROLLMENT BY CLASSIFICATIONSummer 2011
CLASSIFICATIONGENDER
Male Female Grand Total
Freshman
Sophomore
Junior
Senior
Post-Bacc
Masters
Doctoral
Grand Total 2,601
86
782
17
792
467
283
174
1,678
42
601
10
510
262
155
98
923
44
181
7
282
205
128
76
Doctoral86
Masters782
Senior792 Sophomore
283
Post-Bacc17
Junior467
Freshman174
2
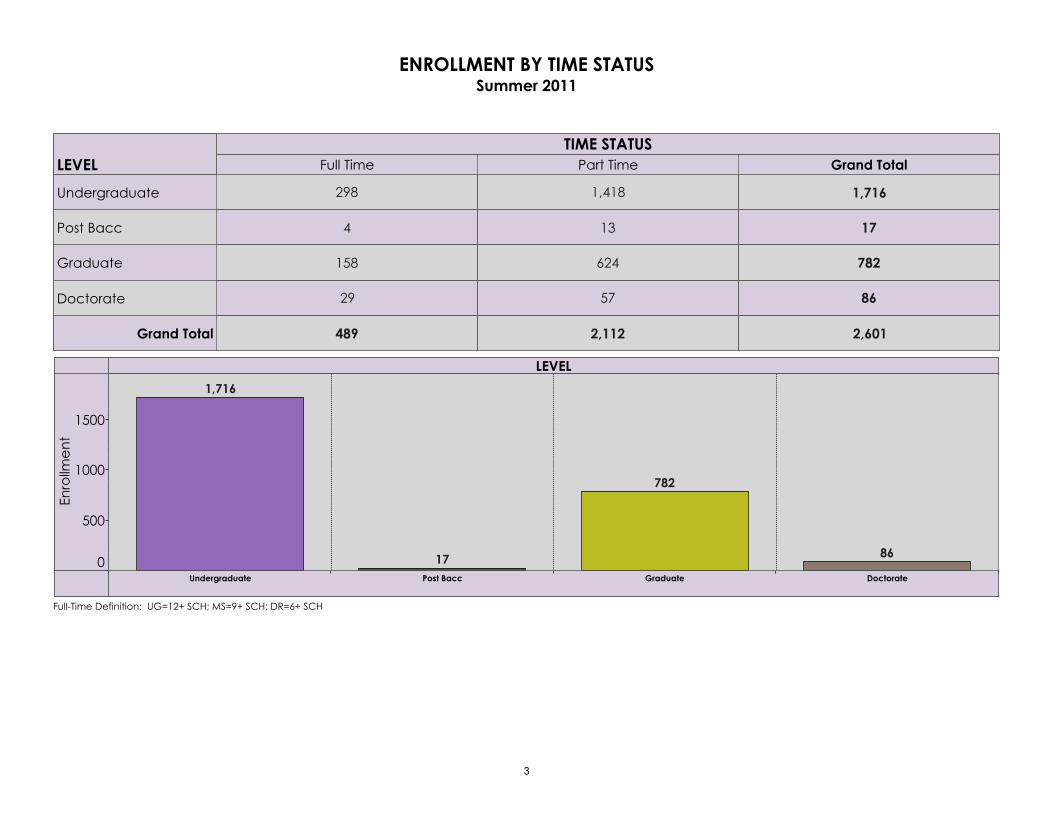
ENROLLMENT BY TIME STATUSSummer 2011
LEVELTIME STATUS
Full Time Part Time Grand Total
Undergraduate
Post Bacc
Graduate
Doctorate
Grand Total 2,601
86
782
17
1,716
2,112
57
624
13
1,418
489
29
158
4
298
LEVEL
Undergraduate Post Bacc Graduate Doctorate
0
500
1000
1500
Enrollment
1,716
782
17 86
Full-Time Definition: UG=12+ SCH; MS=9+ SCH; DR=6+ SCH
3
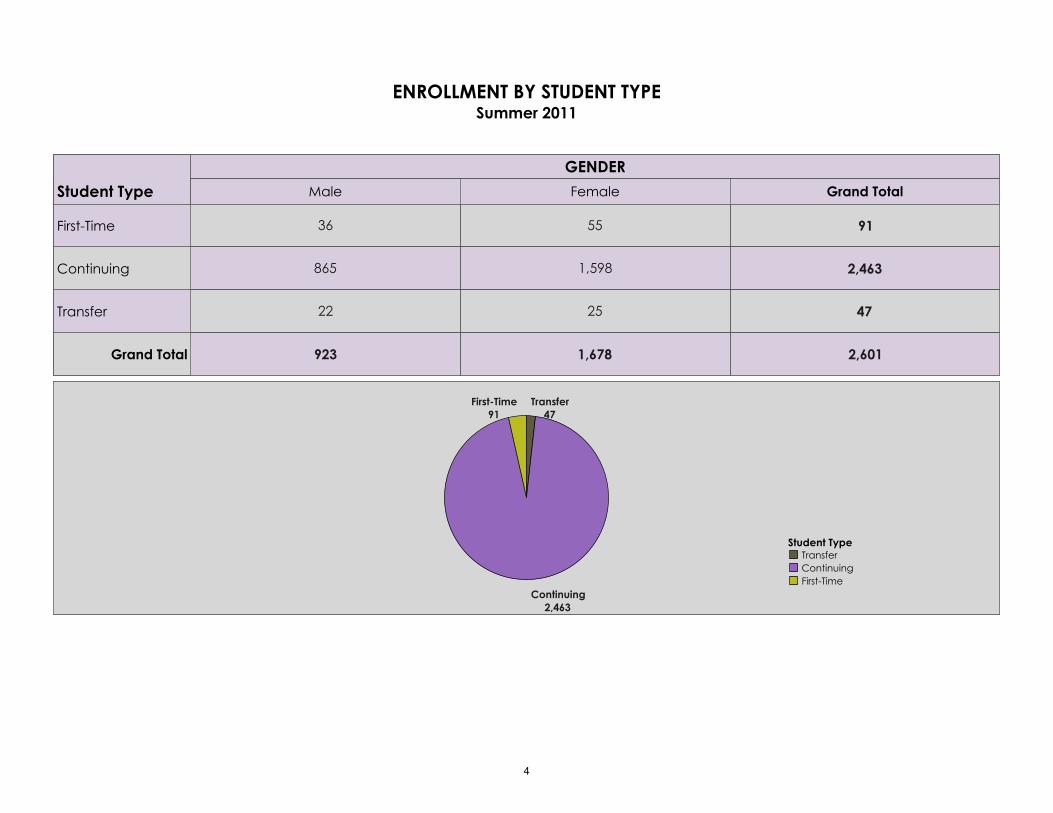
ENROLLMENT BY STUDENT TYPESummer 2011
Student Type
GENDER
Male Female Grand Total
First-Time
Continuing
Transfer
Grand Total 2,601
47
2,463
91
1,678
25
1,598
55
923
22
865
36
Transfer47
Continuing2,463
First-Time91
Student TypeTransferContinuingFirst-Time
4
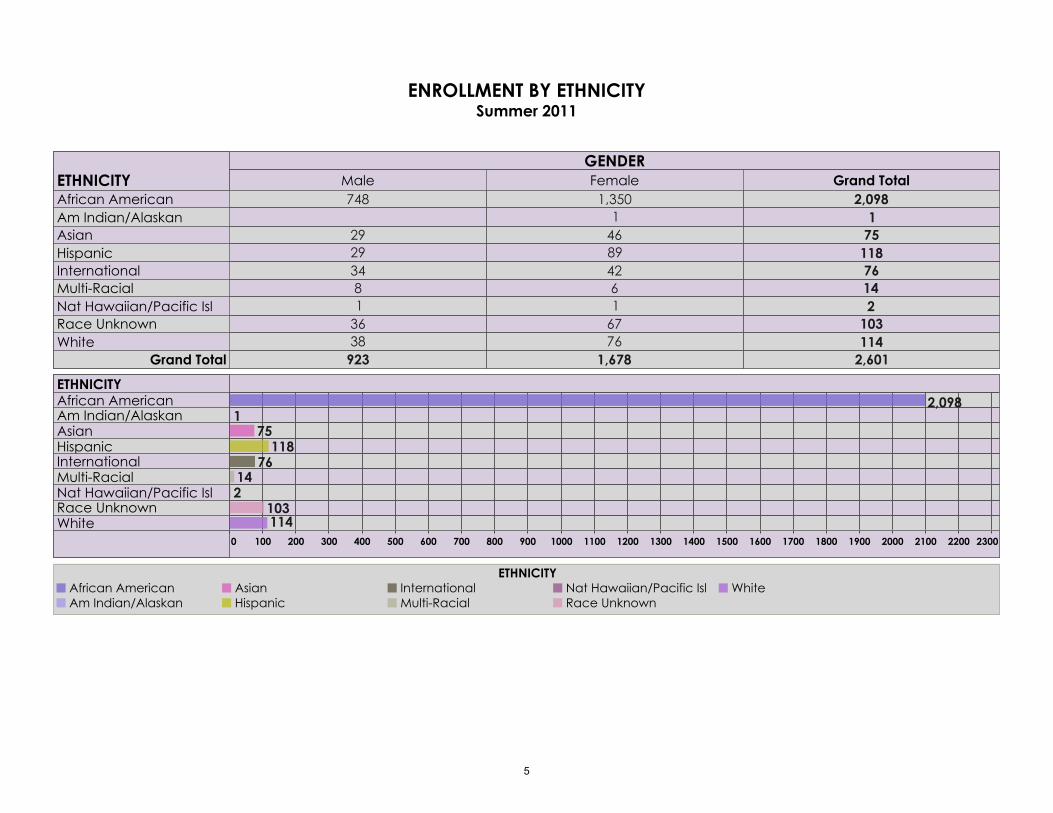
ENROLLMENT BY ETHNICITYSummer 2011
ETHNICITYGENDER
Male Female Grand TotalAfrican AmericanAm Indian/AlaskanAsianHispanicInternationalMulti-RacialNat Hawaiian/Pacific IslRace UnknownWhite
Grand Total 2,60111410321476118751
2,098
1,6787667164289461
1,350
923383618342929
748
ETHNICITY
0 100 200 300 400 500 600 700 800 900 1000 1100 1200 1300 1400 1500 1600 1700 1800 1900 2000 2100 22002300
African AmericanAm Indian/AlaskanAsianHispanicInternationalMulti-RacialNat Hawaiian/Pacific IslRace UnknownWhite 114
10321476118
751
2,098
ETHNICITYAfrican AmericanAm Indian/Alaskan
AsianHispanic
InternationalMulti-Racial
Nat Hawaiian/Pacific IslRace Unknown
White
5
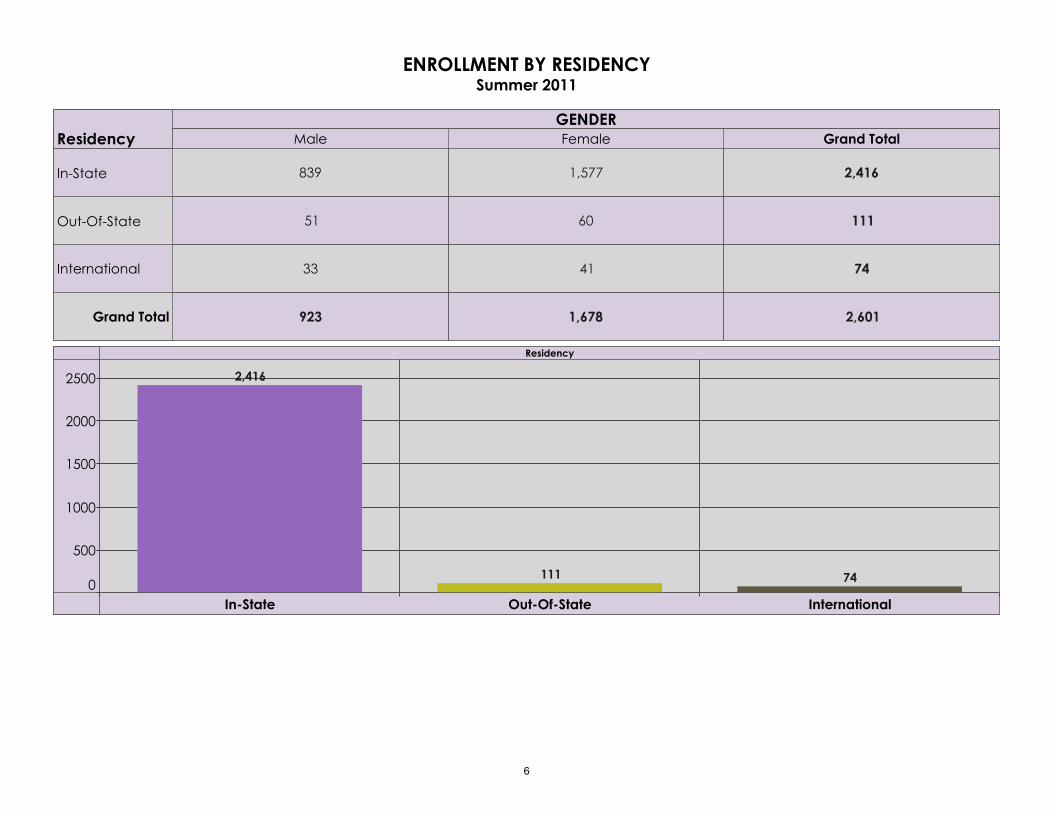
ENROLLMENT BY RESIDENCYSummer 2011
ResidencyGENDER
Male Female Grand Total
In-State
Out-Of-State
International
Grand Total 2,601
74
111
2,416
1,678
41
60
1,577
923
33
51
839
Residency
In-State Out-Of-State International0
500
1000
1500
2000
2500 2,416
111 74
6
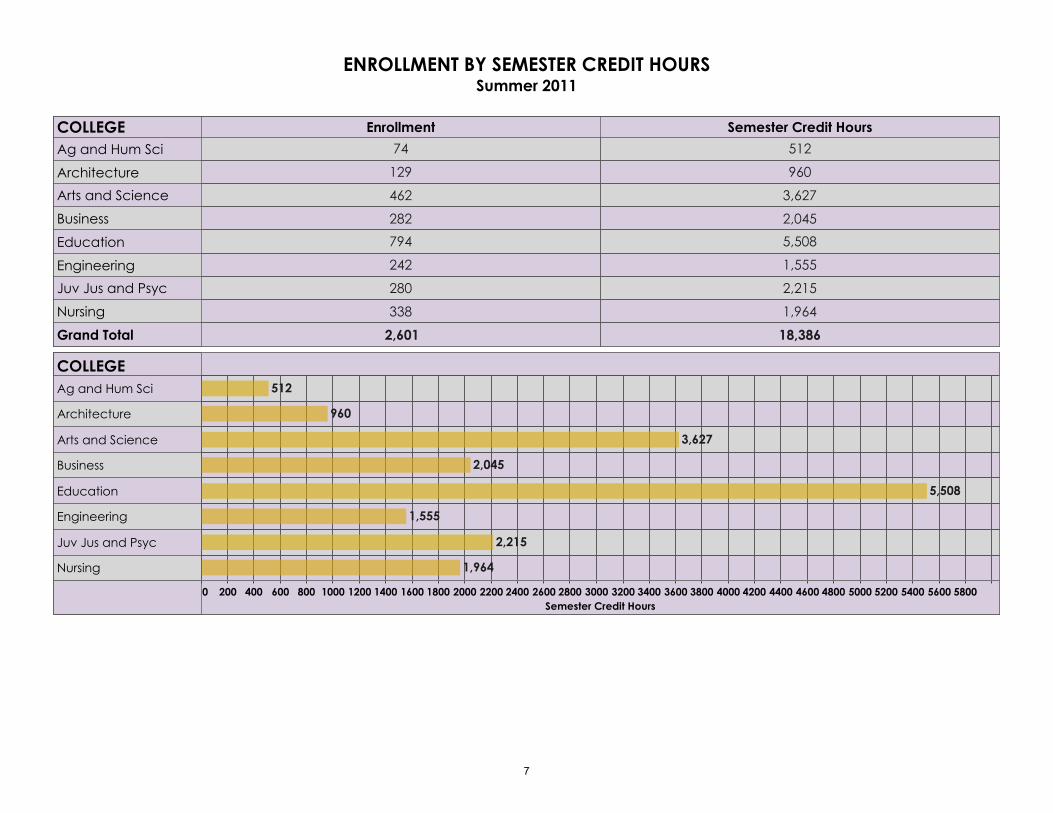
ENROLLMENT BY SEMESTER CREDIT HOURSSummer 2011
COLLEGE Enrollment Semester Credit Hours
Ag and Hum Sci
Architecture
Arts and Science
Business
Education
Engineering
Juv Jus and Psyc
Nursing
Grand Total 18,386
1,964
2,215
1,555
5,508
2,045
3,627
960
512
2,601
338
280
242
794
282
462
129
74
COLLEGE
0 200 400 600 8001000120014001600180020002200240026002800300032003400360038004000420044004600480050005200540056005800Semester Credit Hours
Ag and Hum Sci
Architecture
Arts and Science
Business
Education
Engineering
Juv Jus and Psyc
Nursing
3,627
2,045
5,508
1,555
2,215
1,964
512
960
7
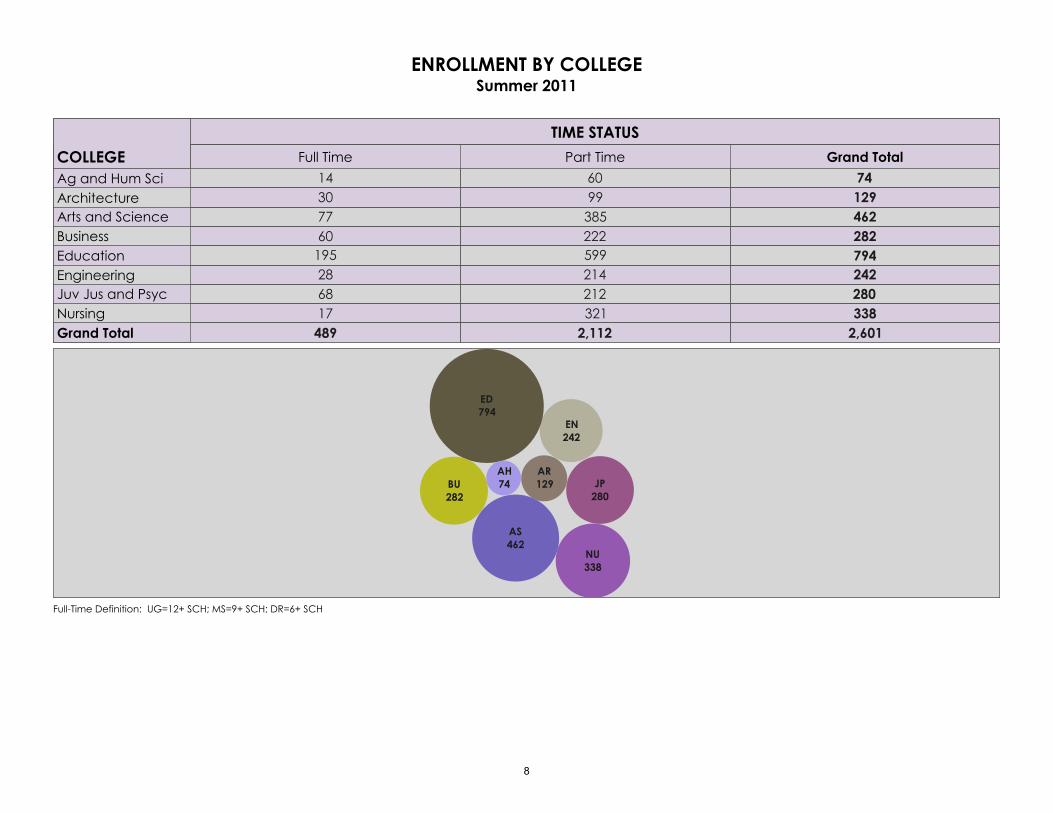
ENROLLMENT BY COLLEGESummer 2011
COLLEGE
TIME STATUS
Full Time Part Time Grand Total
Ag and Hum SciArchitectureArts and ScienceBusinessEducationEngineeringJuv Jus and PsycNursingGrand Total 2,601
33828024279428246212974
2,1123212122145992223859960
48917682819560773014
NU338
JP280
EN242
ED794
BU282
AS462
AR129
AH74
Full-Time Definition: UG=12+ SCH; MS=9+ SCH; DR=6+ SCH
8
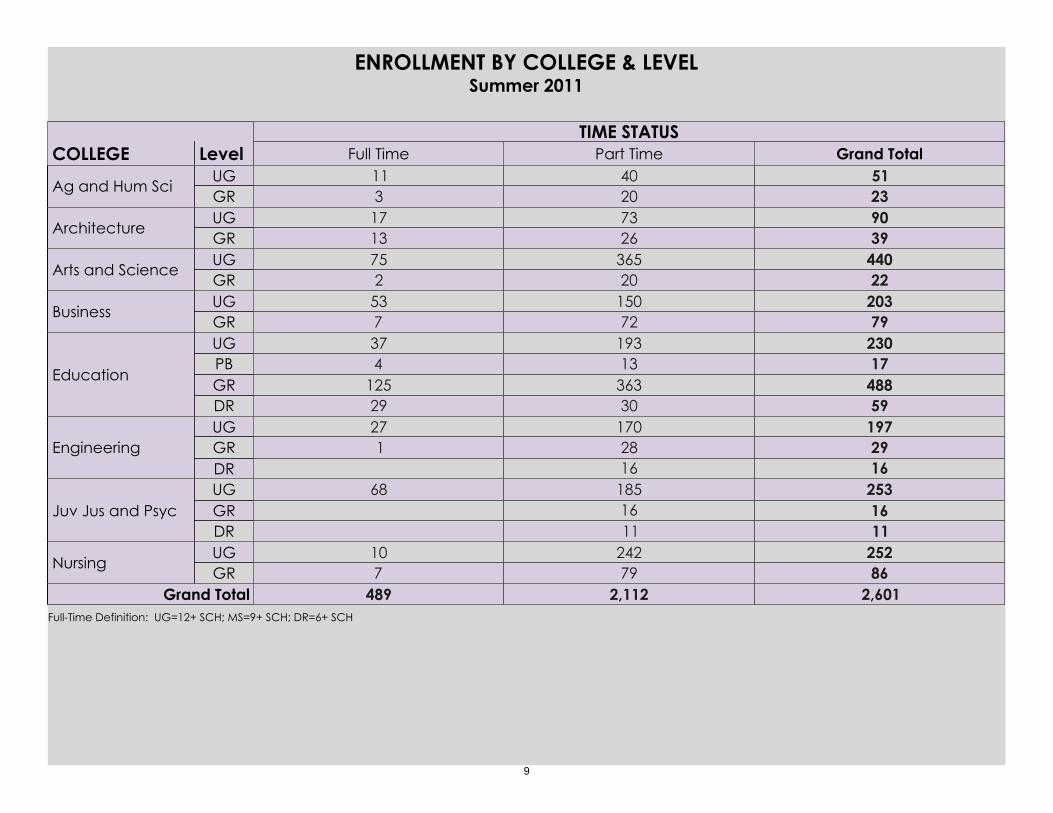
COLLEGE LevelTIME STATUS
Full Time Part Time Grand Total
Ag and Hum SciUGGR
ArchitectureUGGR
Arts and ScienceUGGR
BusinessUGGR
Education
UGPBGRDR
EngineeringUGGRDR
Juv Jus and PsycUGGRDR
NursingUGGR
Grand Total
2351
2040
311
3990
2673
1317
22440
20365
275
79203
72150
753
5948817230
3036313193
29125437
1629197
1628170
127
1116253
111618568
86252
79242
710
2,6012,112489
ENROLLMENT BY COLLEGE & LEVELSummer 2011
Full-Time Definition: UG=12+ SCH; MS=9+ SCH; DR=6+ SCH
9
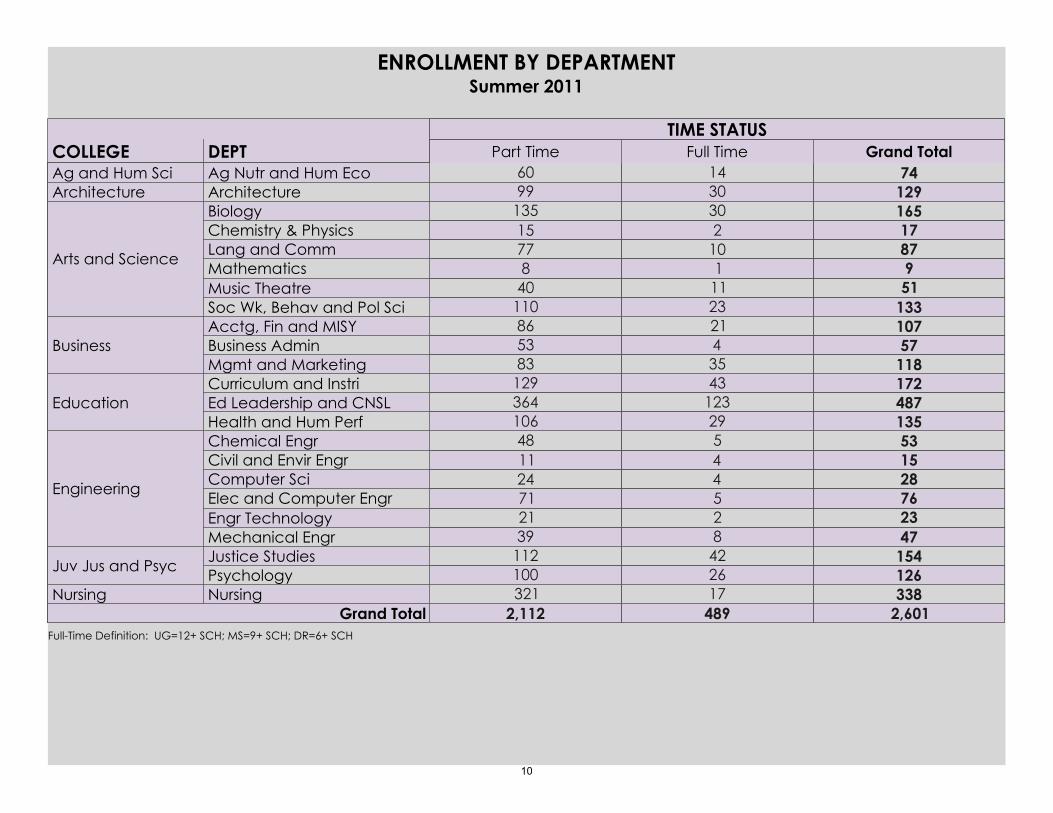
COLLEGE DEPTTIME STATUS
Part Time Full Time Grand TotalAg and Hum Sci Ag Nutr and Hum EcoArchitecture Architecture
Arts and Science
BiologyChemistry & PhysicsLang and CommMathematicsMusic TheatreSoc Wk, Behav and Pol Sci
BusinessAcctg, Fin and MISYBusiness AdminMgmt and Marketing
EducationCurriculum and InstriEd Leadership and CNSLHealth and Hum Perf
Engineering
Chemical EngrCivil and Envir EngrComputer SciElec and Computer EngrEngr TechnologyMechanical Engr
Juv Jus and PsycJustice StudiesPsychology
Nursing NursingGrand Total
7414601293099
1335198717165
2311110230
1104087715135
11857107
35421
835386
135487172
2912343
106364129
472376281553
825445
392171241148
126154
2642
100112
338173212,6014892,112
ENROLLMENT BY DEPARTMENTSummer 2011
Full-Time Definition: UG=12+ SCH; MS=9+ SCH; DR=6+ SCH
10
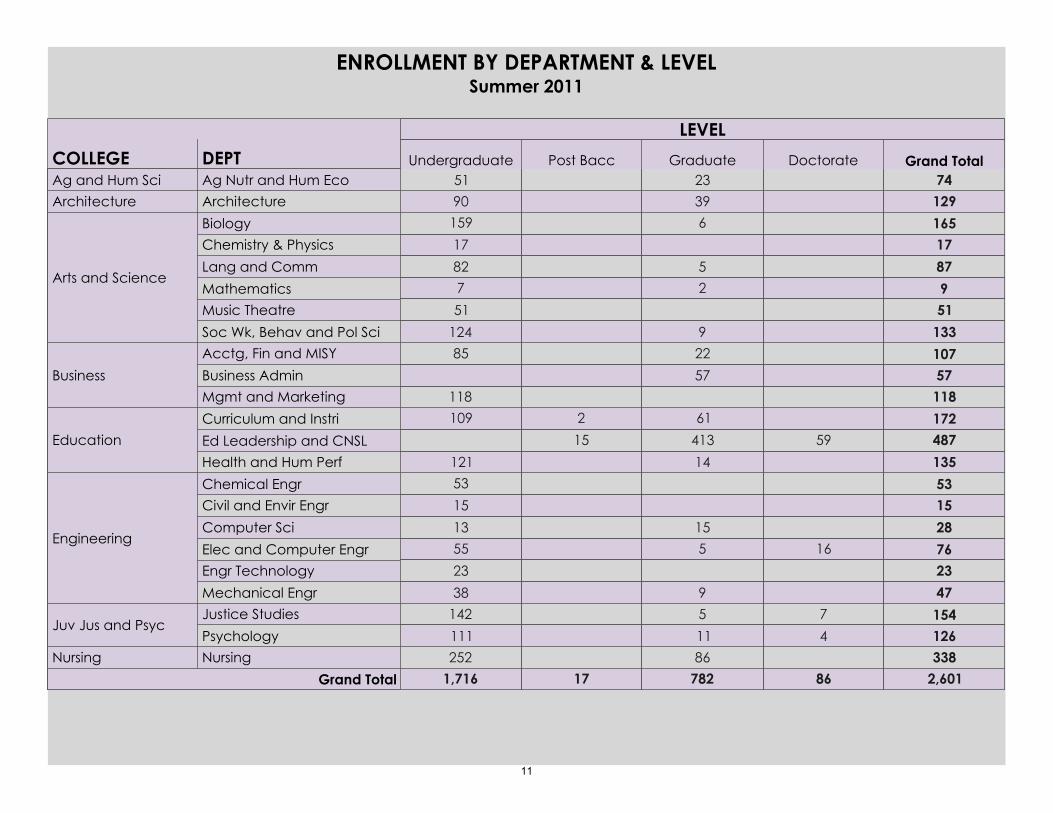
COLLEGE DEPT
LEVEL
Undergraduate Post Bacc Graduate Doctorate Grand TotalAg and Hum Sci Ag Nutr and Hum EcoArchitecture Architecture
Arts and Science
BiologyChemistry & Physics
Lang and Comm
MathematicsMusic Theatre
Soc Wk, Behav and Pol Sci
Business
Acctg, Fin and MISY
Business AdminMgmt and Marketing
EducationCurriculum and Instri
Ed Leadership and CNSLHealth and Hum Perf
Engineering
Chemical EngrCivil and Envir Engr
Computer Sci
Elec and Computer EngrEngr Technology
Mechanical Engr
Juv Jus and PsycJustice Studies
PsychologyNursing Nursing
Grand Total
7423511293990
133
519
87
17165
9
25
6
124
51
782
17
159
11857107
57
22
118
85
135
487172
59
14
413
61
15
2
121
109
47
2376
28
1553
16
9
515
38
23
5513
15
53
126154
4
7
11
5
111
142
338862522,60186782171,716
ENROLLMENT BY DEPARTMENT & LEVELSummer 2011
11
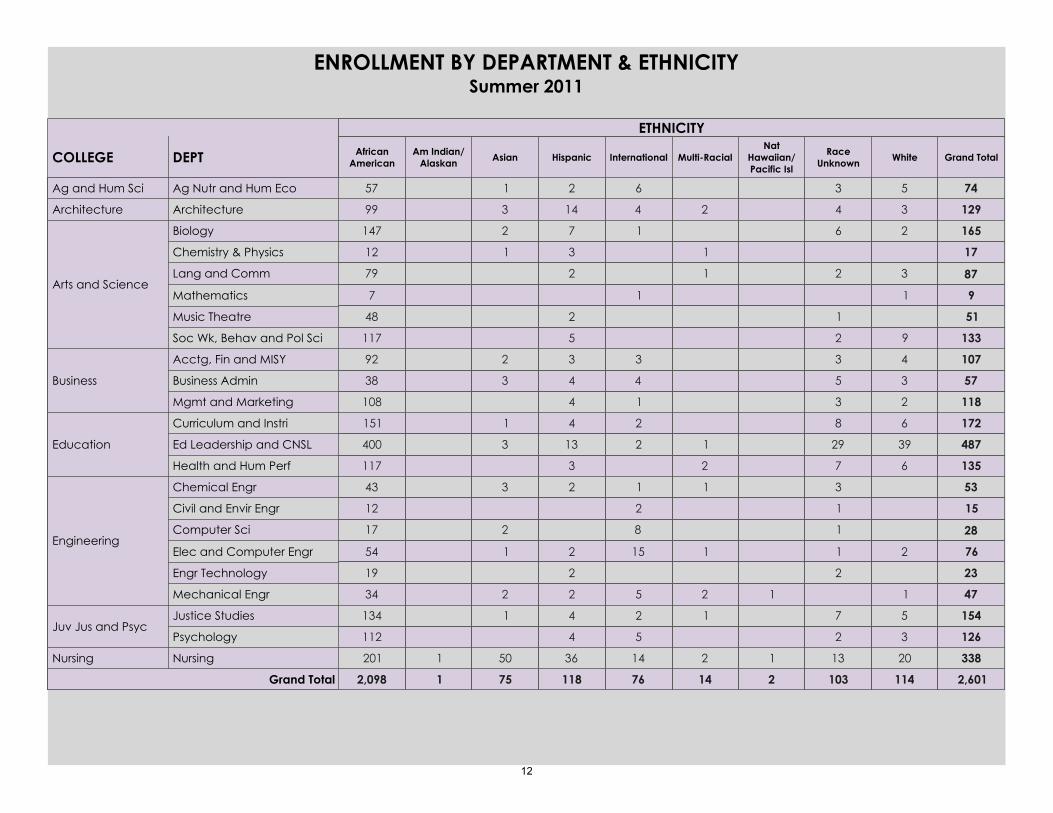
COLLEGE DEPT
ETHNICITY
AfricanAmerican
Am Indian/Alaskan
Asian Hispanic International Multi-RacialNat
Hawaiian/Pacific Isl
RaceUnknown
White Grand Total
Ag and Hum Sci Ag Nutr and Hum Eco
Architecture Architecture
Arts and Science
Biology
Chemistry & Physics
Lang and Comm
Mathematics
Music Theatre
Soc Wk, Behav and Pol Sci
Business
Acctg, Fin and MISY
Business Admin
Mgmt and Marketing
Education
Curriculum and Instri
Ed Leadership and CNSL
Health and Hum Perf
Engineering
Chemical Engr
Civil and Envir Engr
Computer Sci
Elec and Computer Engr
Engr Technology
Mechanical Engr
Juv Jus and PsycJustice Studies
Psychology
Nursing Nursing
Grand Total
745362157
129342414399
133
51
9
87
17
165
9
1
3
2
2
1
2
6
1
1
1
1
5
2
2
3
7
1
2
117
48
7
79
12
147
118
57
107
2
3
4
3
5
3
1
4
3
4
4
3
3
2
108
38
92
135
487
172
6
39
6
7
29
8
2
12
2
3
13
4
3
1
117
400
151
47
23
76
28
15
53
1
2
2
1
1
1
3
12
1
1
5
15
8
2
1
2
2
2
2
2
1
2
3
34
19
54
17
12
43
126
154
3
5
2
71
5
2
4
41
112
134
3382013121436501201
2,601114103214761187512,098
ENROLLMENT BY DEPARTMENT & ETHNICITYSummer 2011
12
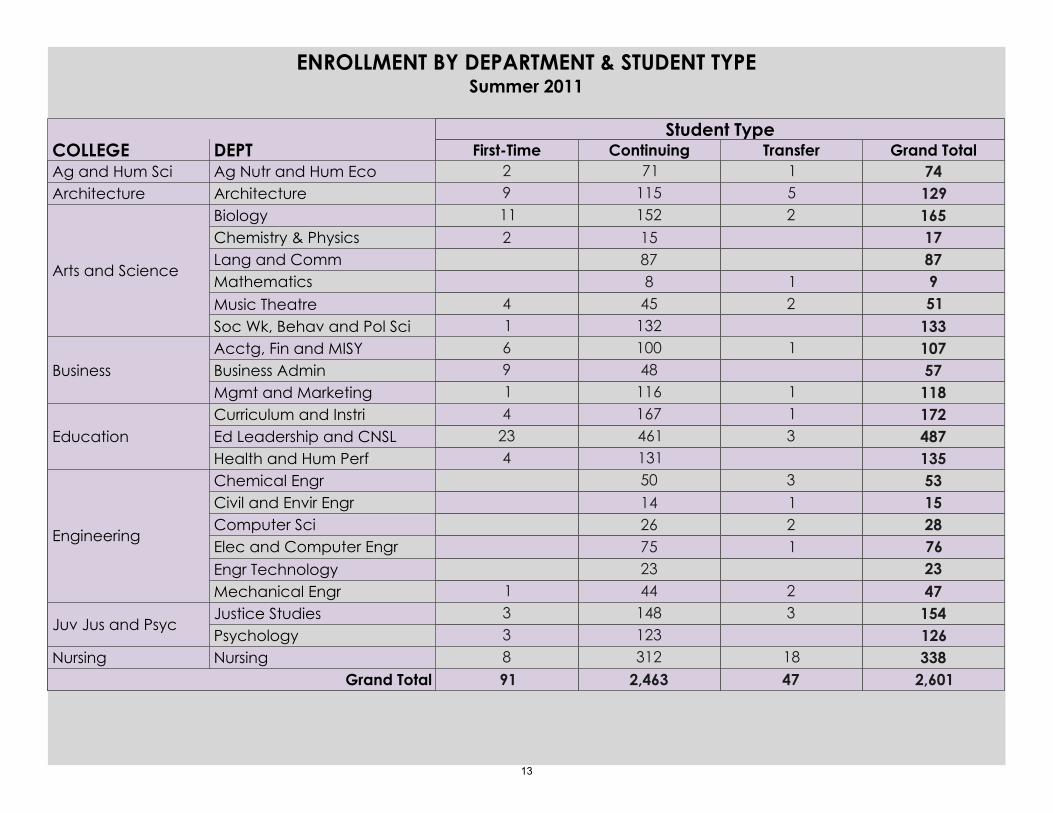
COLLEGE DEPTStudent Type
First-Time Continuing Transfer Grand TotalAg and Hum Sci Ag Nutr and Hum EcoArchitecture Architecture
Arts and Science
BiologyChemistry & PhysicsLang and CommMathematicsMusic TheatreSoc Wk, Behav and Pol Sci
BusinessAcctg, Fin and MISYBusiness AdminMgmt and Marketing
EducationCurriculum and InstriEd Leadership and CNSLHealth and Hum Perf
Engineering
Chemical EngrCivil and Envir EngrComputer SciElec and Computer EngrEngr TechnologyMechanical Engr
Juv Jus and PsycJustice StudiesPsychology
Nursing NursingGrand Total
74171212951159
1335198717165
21
2
1324588715152
14
211
11857107
1
1
11648100
196
135487172
31
131461167
4234
472376281553
2
1213
442375261450
1
1261543
123148
33
3381831282,601472,46391
ENROLLMENT BY DEPARTMENT & STUDENT TYPESummer 2011
13
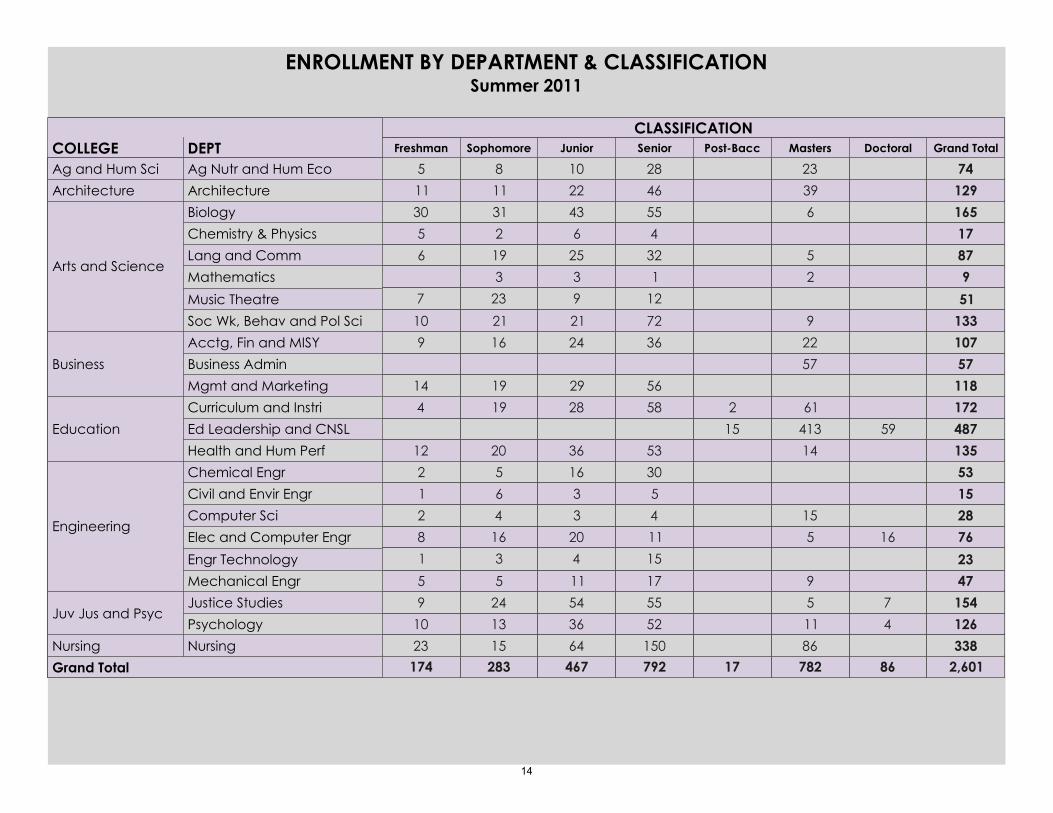
COLLEGE DEPTCLASSIFICATION
Freshman Sophomore Junior Senior Post-Bacc Masters Doctoral Grand Total
Ag and Hum Sci Ag Nutr and Hum Eco
Architecture Architecture
Arts and Science
Biology
Chemistry & Physics
Lang and Comm
Mathematics
Music Theatre
Soc Wk, Behav and Pol Sci
Business
Acctg, Fin and MISY
Business Admin
Mgmt and Marketing
Education
Curriculum and Instri
Ed Leadership and CNSL
Health and Hum Perf
Engineering
Chemical Engr
Civil and Envir Engr
Computer Sci
Elec and Computer Engr
Engr Technology
Mechanical Engr
Juv Jus and PsycJustice Studies
Psychology
Nursing Nursing
Grand Total
7423281085
1293946221111
133
51
9
87
17
165
9
2
5
6
72
12
1
32
4
55
21
9
3
25
6
43
21
23
3
19
2
31
10
7
6
5
30
118
57
107
57
22
56
36
29
24
19
16
14
9
135
487
172
59
14
413
61
15
2
53
58
36
28
20
19
12
4
47
23
76
28
15
53
16
9
5
15
17
15
11
4
5
30
11
4
20
3
3
16
5
3
16
4
6
5
5
1
8
2
1
2
126
154
4
7
11
5
52
55
36
54
13
24
10
9
338861506415232,6018678217792467283174
ENROLLMENT BY DEPARTMENT & CLASSIFICATIONSummer 2011
14
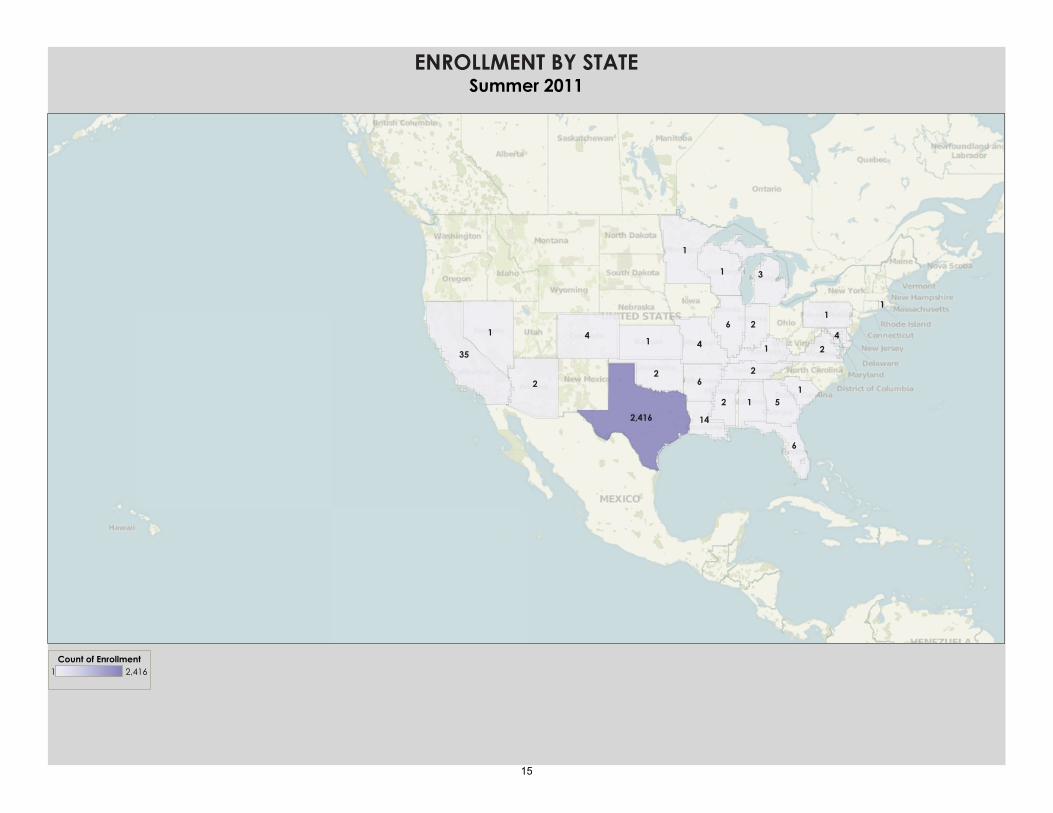
2,416 14
35
4 44
3
2
2
2
2 2
2
5
6
6
6
1
11
1
1
11
1
1
ENROLLMENT BY STATESummer 2011
1 2,416Count of Enrollment
15
220
30
54
90
37 38
93
12
12
12
26
16
26
4
4
4
4
4
7
3
3
3
2
2
2 5
56
6
1
1
1
1
1
1
1
1
1
1
11
1
1
1
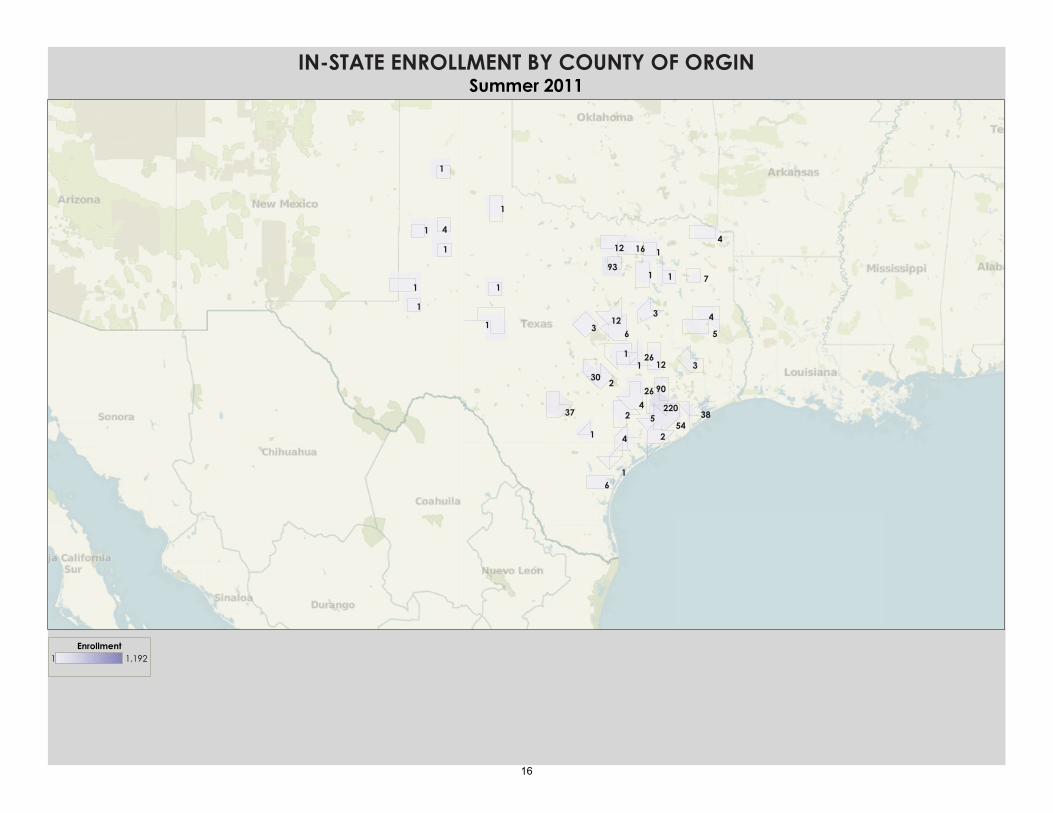
IN-STATE ENROLLMENT BY COUNTY OF ORGINSummer 2011
1 1,192Enrollment
16

![PPRROOCCEEEEDDIINNGGSS - core.ac.uk · Prof dr Sophia Natalia Boemi [GR] Prof dr Anna Stoppato [IT] Prof dr Peter Novak [SI] Prof dr Vladimir Mijakovski [MK] Prof dr Jordan Hristov](https://img.pdfslide.us/doc/110x75/5c69287a09d3f206678ca733/pprroocceeeeddiinnggss-coreacuk-prof-dr-sophia-natalia-boemi-gr-prof-dr.jpg)
![Dr. Sharad Kumar Tiwari UG 2004 Dr. Raj Kamal Varma [UGJ Regular Dr. Kirti Golya LUG] Regular Dr. Pramod Kushwaha Dr. Swapna Singh Dr. Jayaj Kakodiya UG Re ular Dr. Deepak Kumar](https://img.pdfslide.us/doc/110x75/5f72708dff6fbf66e0738a92/-dr-sharad-kumar-tiwari-ug-2004-dr-raj-kamal-varma-ugj-regular-dr-kirti-golya.jpg)