Embed Size (px)
Citation preview

PRAIRIE VIEW A&M UNIVERSITY
ENROLLMENT SNAPSHOTS
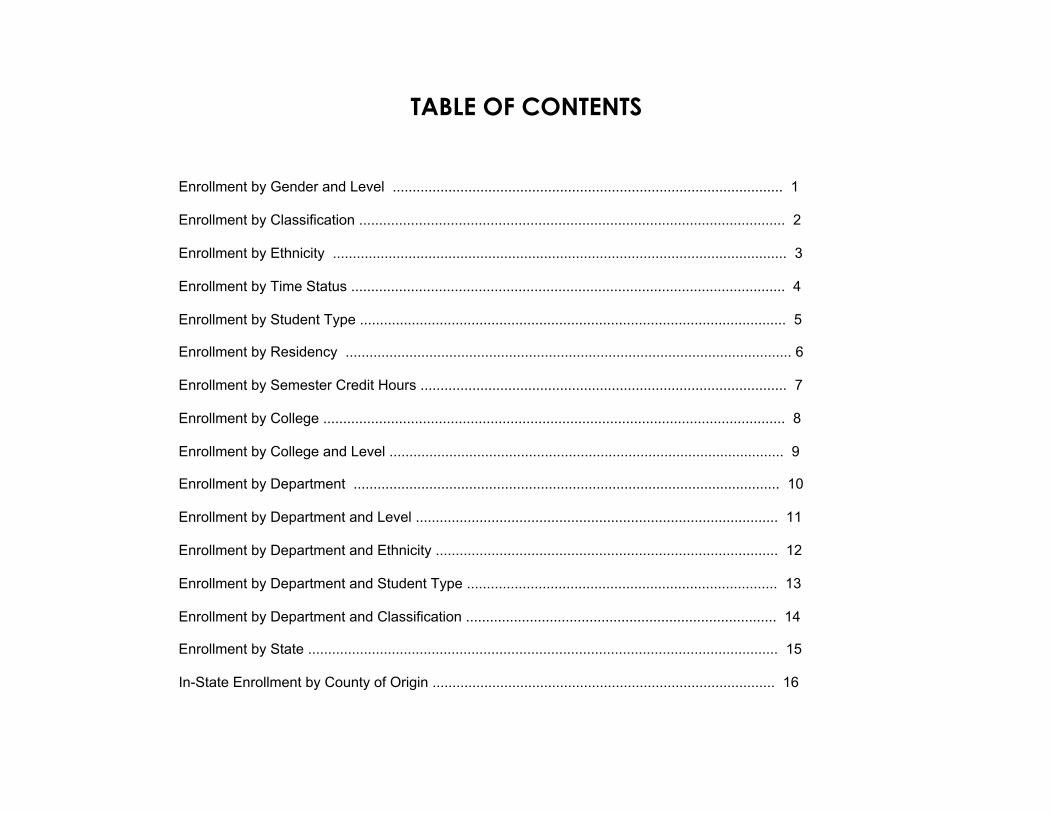
TABLE OF CONTENTS
Enrollment by Gender and Level .................................................................................................. 1 Enrollment by Classification ........................................................................................................... 2 Enrollment by Ethnicity .................................................................................................................. 3 Enrollment by Time Status ............................................................................................................. 4 Enrollment by Student Type ........................................................................................................... 5 Enrollment by Residency ................................................................................................................ 6 Enrollment by Semester Credit Hours ............................................................................................ 7 Enrollment by College .................................................................................................................... 8 Enrollment by College and Level ................................................................................................... 9 Enrollment by Department ........................................................................................................... 10 Enrollment by Department and Level ........................................................................................... 11 Enrollment by Department and Ethnicity ...................................................................................... 12 Enrollment by Department and Student Type .............................................................................. 13 Enrollment by Department and Classification .............................................................................. 14 Enrollment by State ...................................................................................................................... 15 In-State Enrollment by County of Origin ...................................................................................... 16
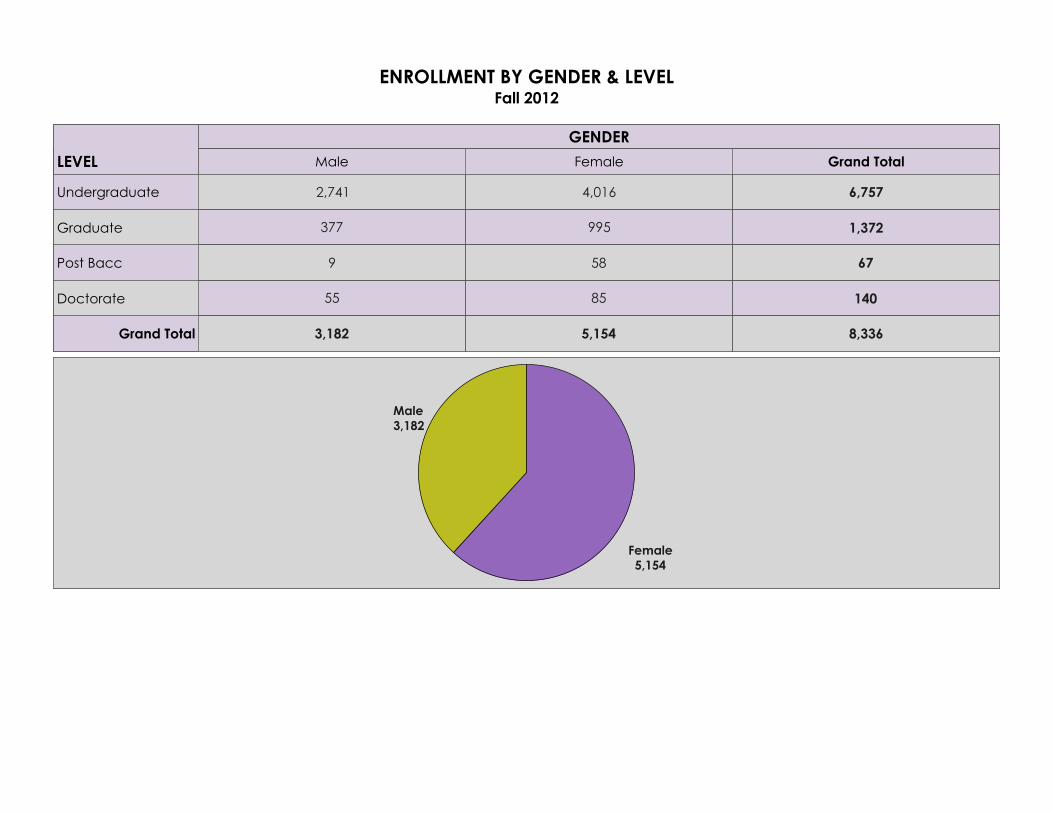
ENROLLMENT BY GENDER & LEVELFall 2012
LEVEL
GENDER
Male Female Grand Total
Undergraduate
Graduate
Post Bacc
Doctorate
Grand Total 8,336
140
67
1,372
6,757
5,154
85
58
995
4,016
3,182
55
9
377
2,741
Female5,154
Male3,182
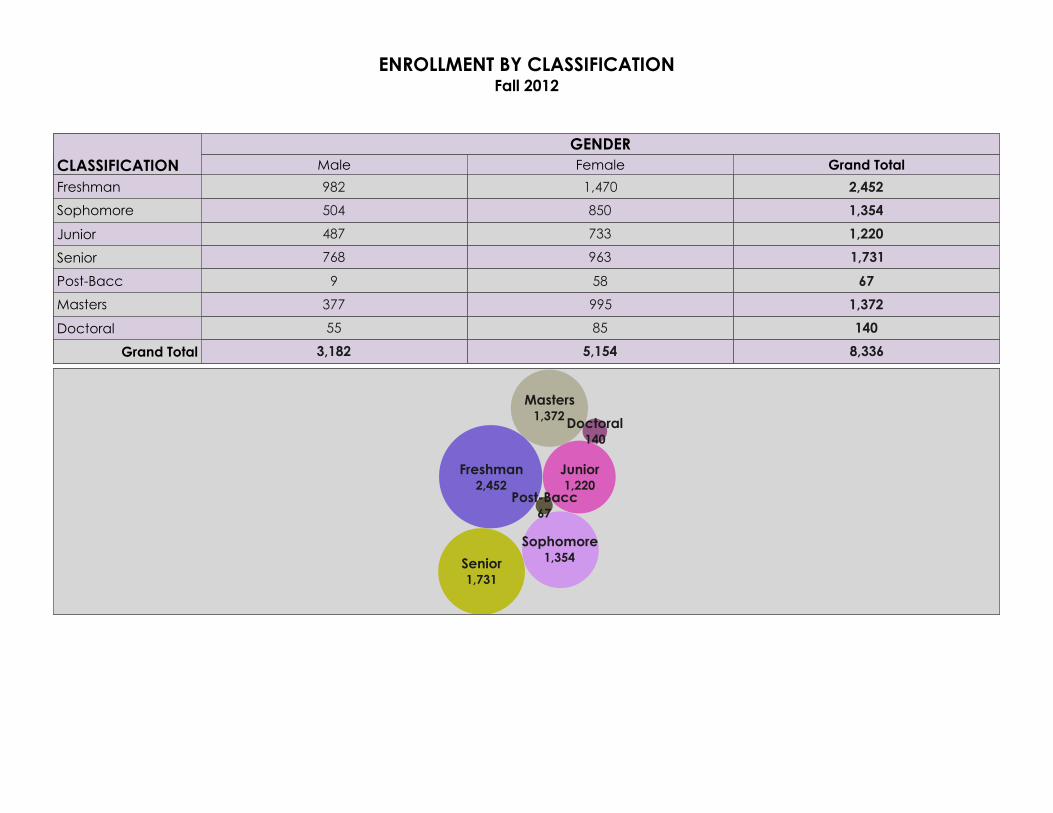
ENROLLMENT BY CLASSIFICATIONFall 2012
CLASSIFICATIONGENDER
Male Female Grand Total
Freshman
Sophomore
Junior
Senior
Post-Bacc
Masters
Doctoral
Grand Total 8,336
140
1,372
67
1,731
1,220
1,354
2,452
5,154
85
995
58
963
733
850
1,470
3,182
55
377
9
768
487
504
982
Doctoral140
Masters1,372
Senior1,731
Sophomore1,354
Post-Bacc67
Junior1,220
Freshman2,452
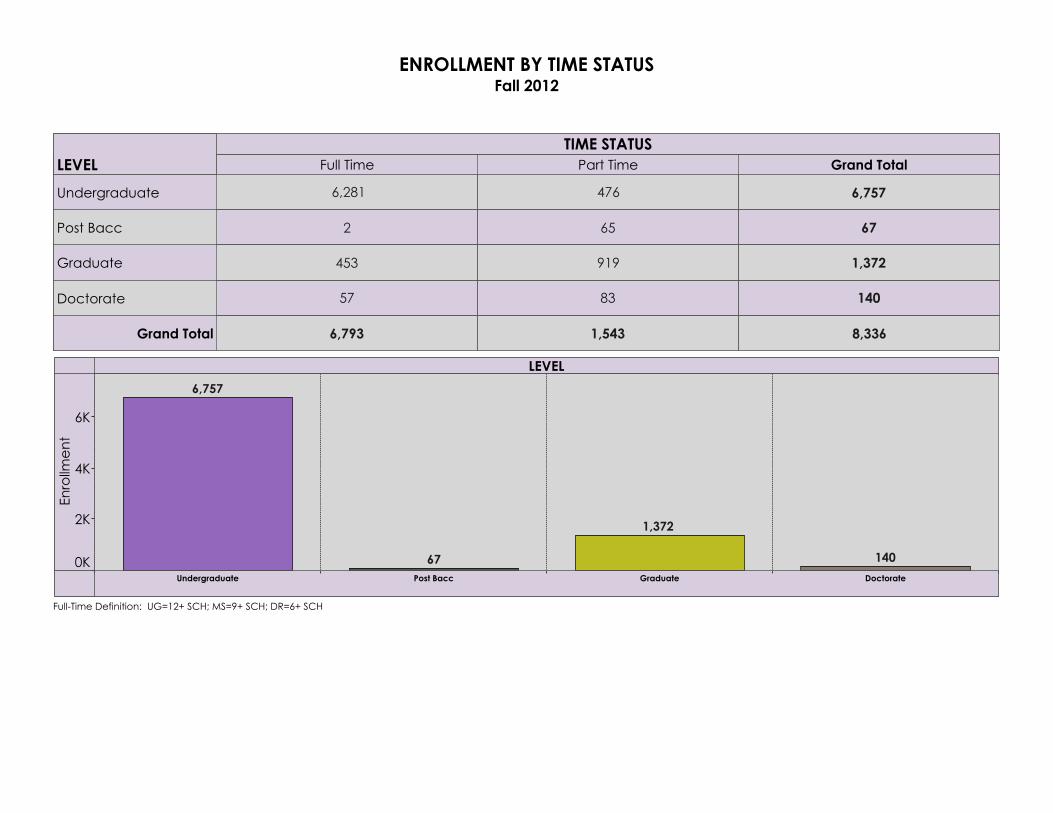
ENROLLMENT BY TIME STATUSFall 2012
LEVELTIME STATUS
Full Time Part Time Grand Total
Undergraduate
Post Bacc
Graduate
Doctorate
Grand Total 8,336
140
1,372
67
6,757
1,543
83
919
65
476
6,793
57
453
2
6,281
LEVEL
Undergraduate Post Bacc Graduate Doctorate
0K
2K
4K
6K
Enrollment
6,757
1,372
14067
Full-Time Definition: UG=12+ SCH; MS=9+ SCH; DR=6+ SCH
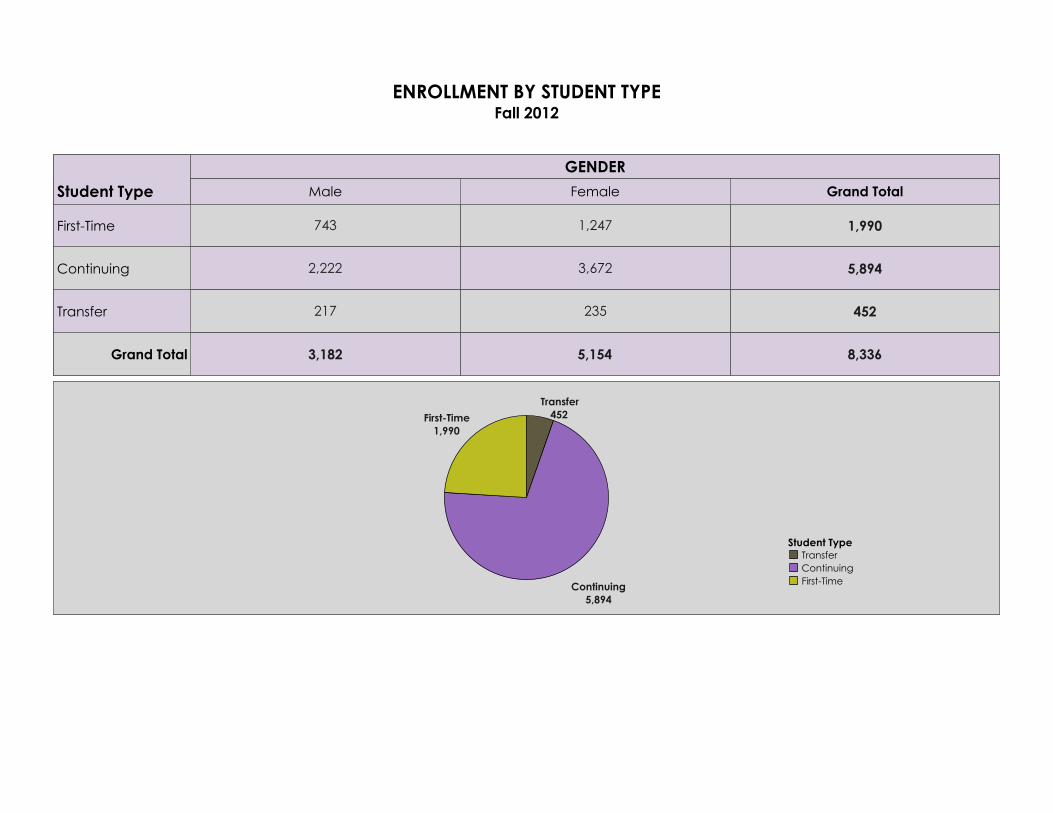
ENROLLMENT BY STUDENT TYPEFall 2012
Student Type
GENDER
Male Female Grand Total
First-Time
Continuing
Transfer
Grand Total 8,336
452
5,894
1,990
5,154
235
3,672
1,247
3,182
217
2,222
743
Transfer452
Continuing5,894
First-Time1,990
Student TypeTransferContinuingFirst-Time
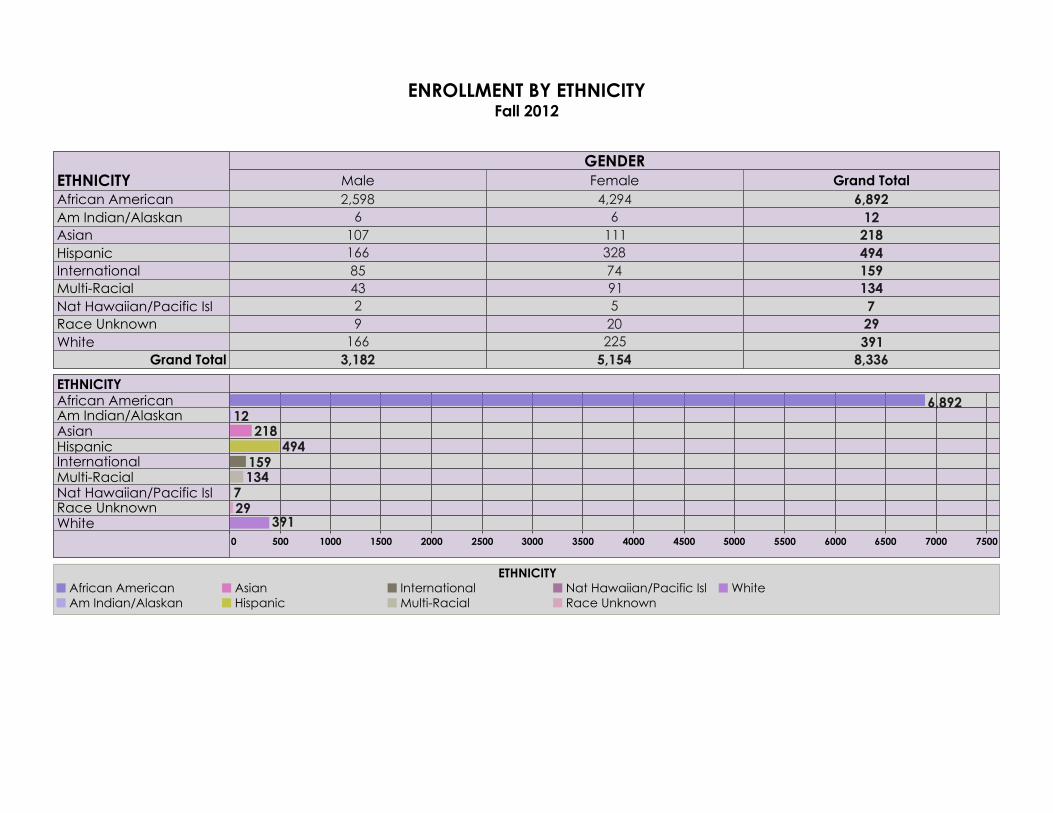
ENROLLMENT BY ETHNICITYFall 2012
ETHNICITYGENDER
Male Female Grand TotalAfrican AmericanAm Indian/AlaskanAsianHispanicInternationalMulti-RacialNat Hawaiian/Pacific IslRace UnknownWhite
Grand Total 8,336391297134159494218126,892
5,154225205917432811164,294
3,1821669243851661076
2,598
ETHNICITY
0 500 1000 1500 2000 2500 3000 3500 4000 4500 5000 5500 6000 6500 7000 7500
African AmericanAm Indian/AlaskanAsianHispanicInternationalMulti-RacialNat Hawaiian/Pacific IslRace UnknownWhite 391
297134159
494218
126,892
ETHNICITYAfrican AmericanAm Indian/Alaskan
AsianHispanic
InternationalMulti-Racial
Nat Hawaiian/Pacific IslRace Unknown
White
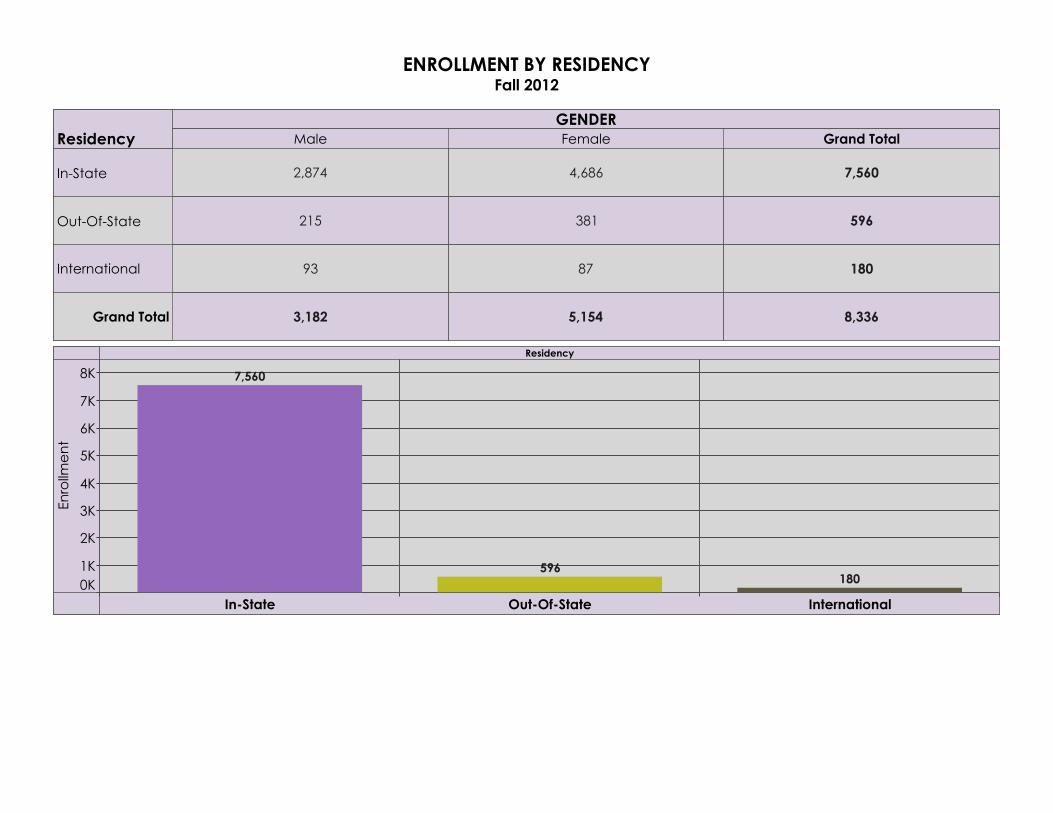
ENROLLMENT BY RESIDENCYFall 2012
ResidencyGENDER
Male Female Grand Total
In-State
Out-Of-State
International
Grand Total 8,336
180
596
7,560
5,154
87
381
4,686
3,182
93
215
2,874
Residency
In-State Out-Of-State International0K1K
2K
3K
4K
5K
6K
7K
8K
Enrollment
7,560
180596
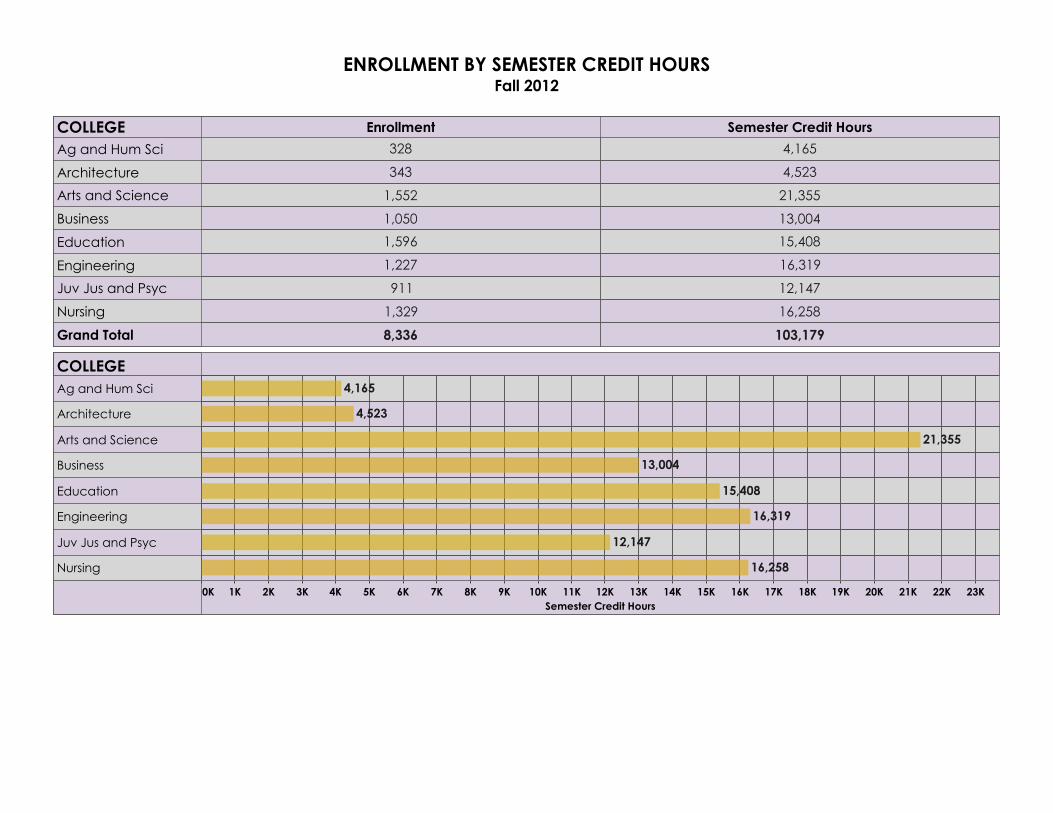
ENROLLMENT BY SEMESTER CREDIT HOURSFall 2012
COLLEGE Enrollment Semester Credit Hours
Ag and Hum Sci
Architecture
Arts and Science
Business
Education
Engineering
Juv Jus and Psyc
Nursing
Grand Total 103,179
16,258
12,147
16,319
15,408
13,004
21,355
4,523
4,165
8,336
1,329
911
1,227
1,596
1,050
1,552
343
328
COLLEGE
0K 1K 2K 3K 4K 5K 6K 7K 8K 9K 10K 11K 12K 13K 14K 15K 16K 17K 18K 19K 20K 21K 22K 23KSemester Credit Hours
Ag and Hum Sci
Architecture
Arts and Science
Business
Education
Engineering
Juv Jus and Psyc
Nursing
21,355
13,004
15,408
16,319
12,147
16,258
4,165
4,523
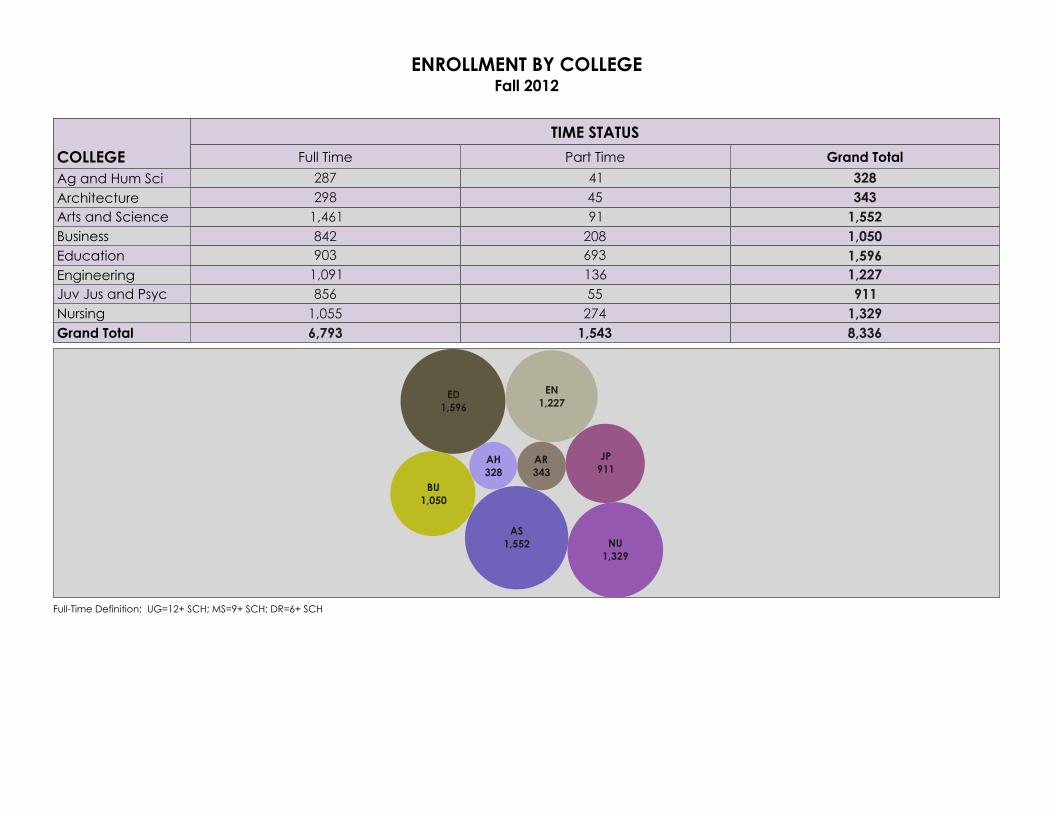
ENROLLMENT BY COLLEGEFall 2012
COLLEGE
TIME STATUS
Full Time Part Time Grand Total
Ag and Hum SciArchitectureArts and ScienceBusinessEducationEngineeringJuv Jus and PsycNursingGrand Total 8,336
1,3299111,2271,5961,0501,552343328
1,54327455136693208914541
6,7931,0558561,0919038421,461298287
NU1,329
JP911
EN1,227
ED1,596
BU1,050
AS1,552
AR343
AH328
Full-Time Definition: UG=12+ SCH; MS=9+ SCH; DR=6+ SCH
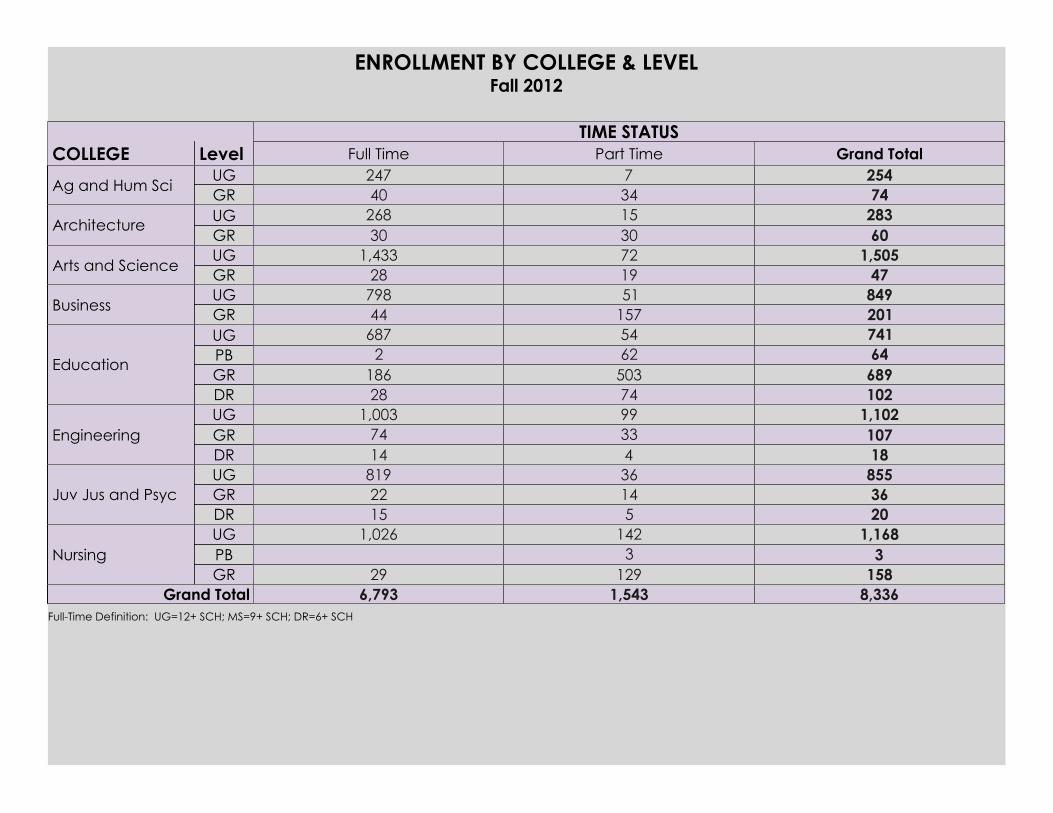
COLLEGE LevelTIME STATUS
Full Time Part Time Grand Total
Ag and Hum SciUGGR
ArchitectureUGGR
Arts and ScienceUGGR
BusinessUGGR
Education
UGPBGRDR
EngineeringUGGRDR
Juv Jus and PsycUGGRDR
NursingUGPBGR
Grand Total
74254
347
40247
60283
3015
30268
471,505
1972
281,433
201849
15751
44798
10268964741
745036254
281862687
181071,102
43399
14741,003
2036855
51436
1522819
15831,168
1293142
29
1,026
8,3361,5436,793
ENROLLMENT BY COLLEGE & LEVELFall 2012
Full-Time Definition: UG=12+ SCH; MS=9+ SCH; DR=6+ SCH
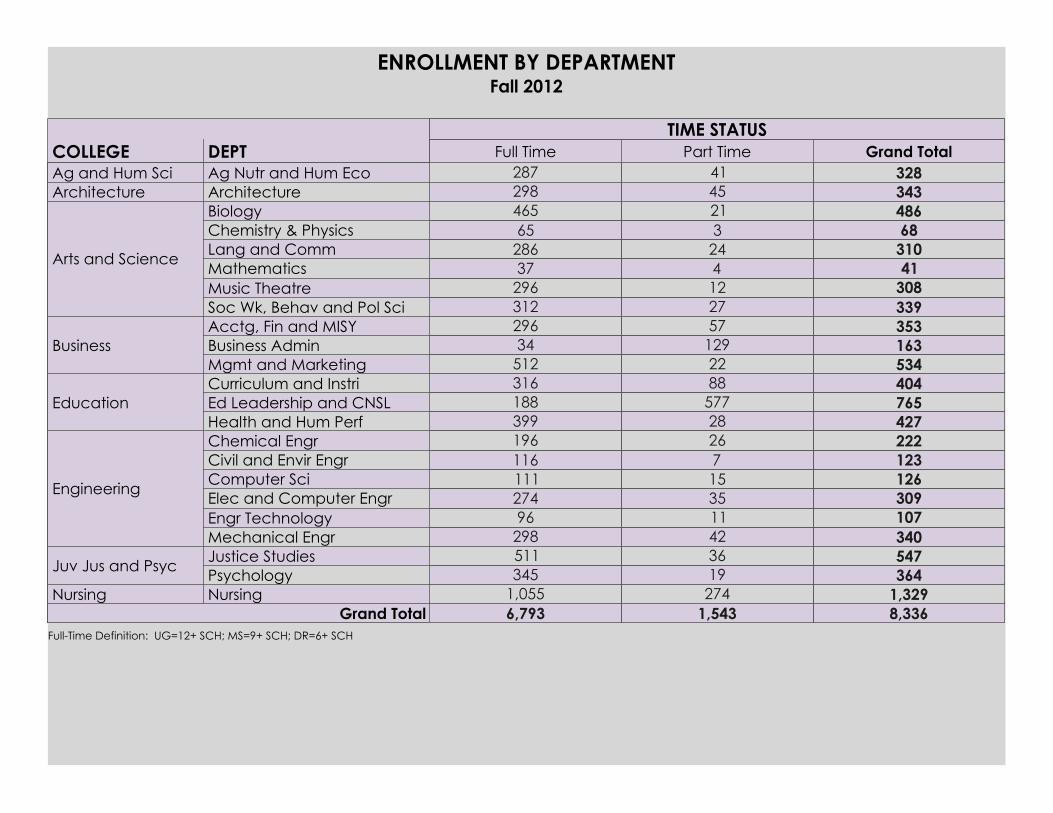
COLLEGE DEPTTIME STATUS
Full Time Part Time Grand TotalAg and Hum Sci Ag Nutr and Hum EcoArchitecture Architecture
Arts and Science
BiologyChemistry & PhysicsLang and CommMathematicsMusic TheatreSoc Wk, Behav and Pol Sci
BusinessAcctg, Fin and MISYBusiness AdminMgmt and Marketing
EducationCurriculum and InstriEd Leadership and CNSLHealth and Hum Perf
Engineering
Chemical EngrCivil and Envir EngrComputer SciElec and Computer EngrEngr TechnologyMechanical Engr
Juv Jus and PsycJustice StudiesPsychology
Nursing NursingGrand Total
3284128734345298
3393084131068486
2712424321
3122963728665465
534163353
2212957
51234296
427765404
2857788
399188316
340107309126123222
42113515726
29896274111116196
364547
1936
345511
1,3292741,0558,3361,5436,793
ENROLLMENT BY DEPARTMENTFall 2012
Full-Time Definition: UG=12+ SCH; MS=9+ SCH; DR=6+ SCH
COLLEGE DEPT
LEVEL
Undergraduate Post Bacc Graduate Doctorate Grand TotalAg and Hum Sci Ag Nutr and Hum EcoArchitecture Architecture
Arts and Science
BiologyChemistry & Physics
Lang and Comm
MathematicsMusic Theatre
Soc Wk, Behav and Pol Sci
Business
Acctg, Fin and MISY
Business AdminMgmt and Marketing
EducationCurriculum and Instri
Ed Leadership and CNSLHealth and Hum Perf
Engineering
Chemical EngrCivil and Envir Engr
Computer Sci
Elec and Computer EngrEngr Technology
Mechanical Engr
Juv Jus and PsycJustice Studies
PsychologyNursing Nursing
Grand Total
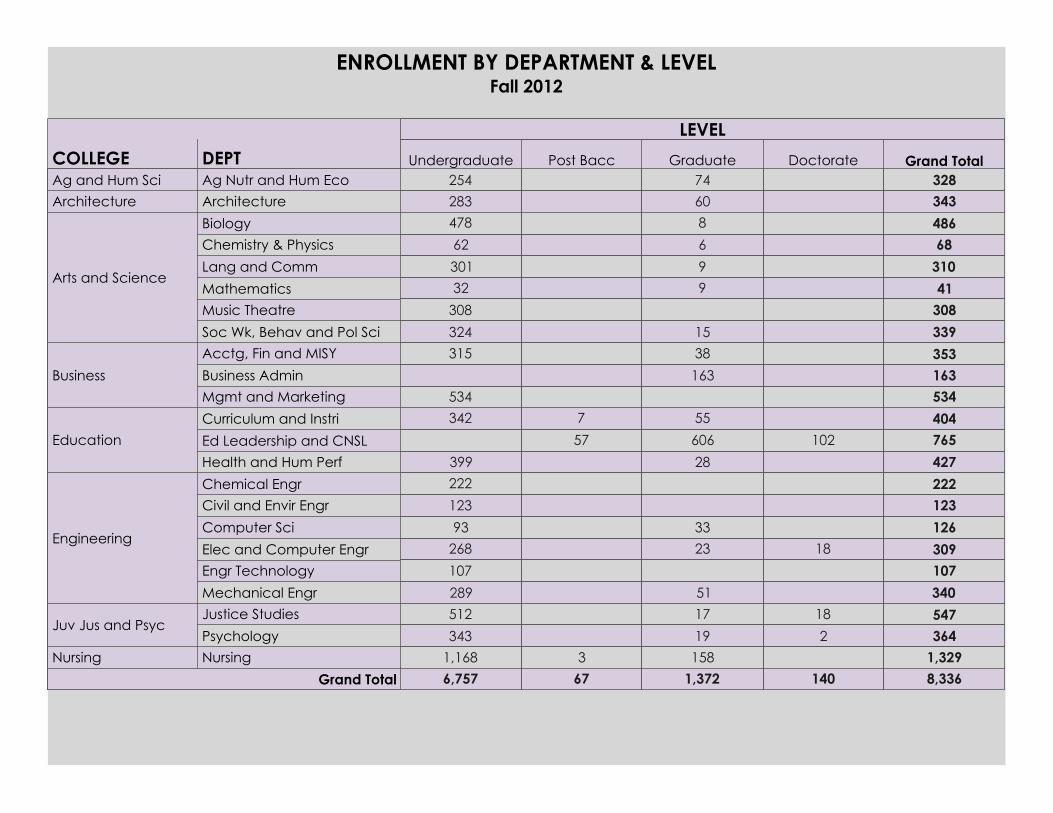
3287425434360283
339
30841
310
68486
15
99
6
8
324
308
32301
62
478
534163353
163
38
534
315
427
765404
102
28
606
55
57
7
399
342
340
107309
126
123222
18
51
2333
289
107
26893
123
222
364547
2
18
19
17
343
512
1,32915831,1688,3361401,372676,757
ENROLLMENT BY DEPARTMENT & LEVELFall 2012
COLLEGE DEPT
ETHNICITY
AfricanAmerican
Am Indian/Alaskan
Asian Hispanic International Multi-RacialNat
Hawaiian/Pacific Isl
RaceUnknown
White Grand Total
Ag and Hum Sci Ag Nutr and Hum Eco
Architecture Architecture
Arts and Science
Biology
Chemistry & Physics
Lang and Comm
Mathematics
Music Theatre
Soc Wk, Behav and Pol Sci
Business
Acctg, Fin and MISY
Business Admin
Mgmt and Marketing
Education
Curriculum and Instri
Ed Leadership and CNSL
Health and Hum Perf
Engineering
Chemical Engr
Civil and Envir Engr
Computer Sci
Elec and Computer Engr
Engr Technology
Mechanical Engr
Juv Jus and PsycJustice Studies
Psychology
Nursing Nursing
Grand Total
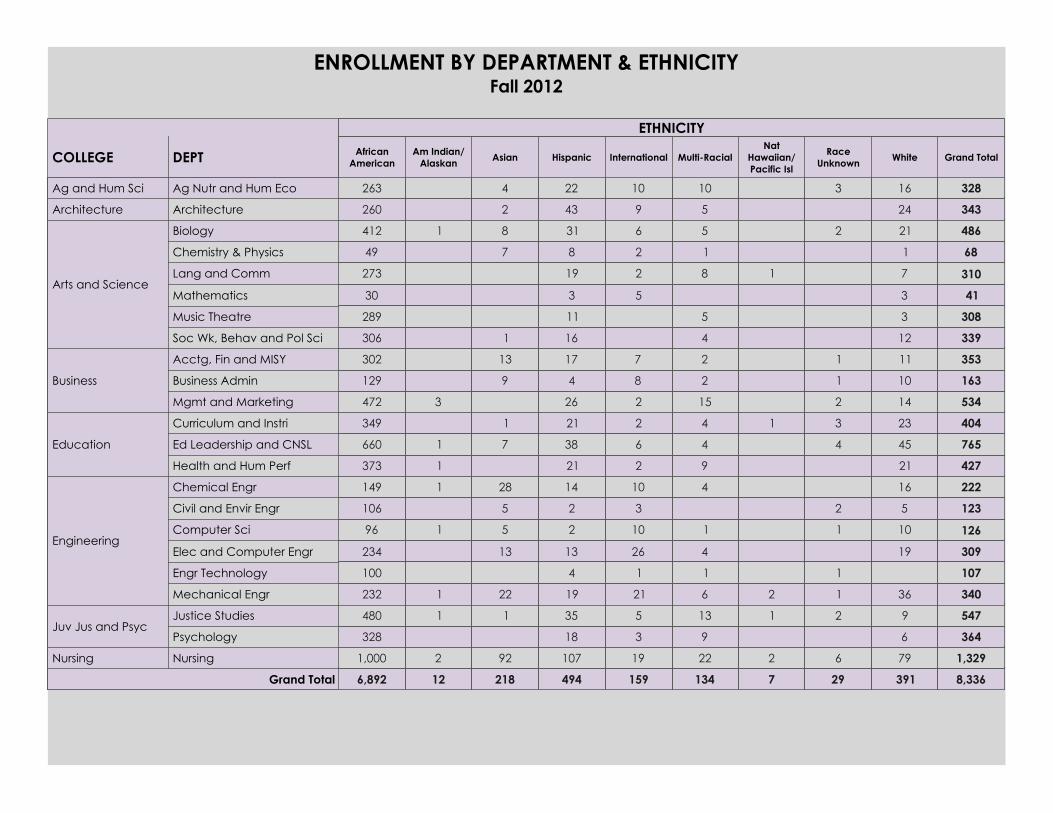
3281631010224263
3432459432260
339
308
41
310
68
486
12
3
3
7
1
212
1
4
5
8
1
5
5
2
2
6
16
11
3
19
8
31
1
7
81
306
289
30
273
49
412
534
163
353
14
10
11
2
1
1
15
2
2
2
8
7
26
4
17
9
13
3472
129
302
427
765
404
21
45
23
4
31
9
4
4
2
6
2
21
38
21
7
1
1
1
373
660
349
340
107
309
126
123
222
36
19
10
5
16
1
1
1
2
26
1
4
1
4
21
1
26
10
3
10
19
4
13
2
2
14
22
13
5
5
28
1
1
1
232
100
234
96
106
149
364
547
6
921
9
13
3
5
18
3511
328
480
1,329796222191079221,000
8,336391297134159494218126,892
ENROLLMENT BY DEPARTMENT & ETHNICITYFall 2012
COLLEGE DEPTStudent Type
First-Time Continuing Transfer Grand TotalAg and Hum Sci Ag Nutr and Hum EcoArchitecture Architecture
Arts and Science
BiologyChemistry & PhysicsLang and CommMathematicsMusic TheatreSoc Wk, Behav and Pol Sci
BusinessAcctg, Fin and MISYBusiness AdminMgmt and Marketing
EducationCurriculum and InstriEd Leadership and CNSLHealth and Hum Perf
Engineering
Chemical EngrCivil and Envir EngrComputer SciElec and Computer EngrEngr TechnologyMechanical Engr
Juv Jus and PsycJustice StudiesPsychology
Nursing NursingGrand Total
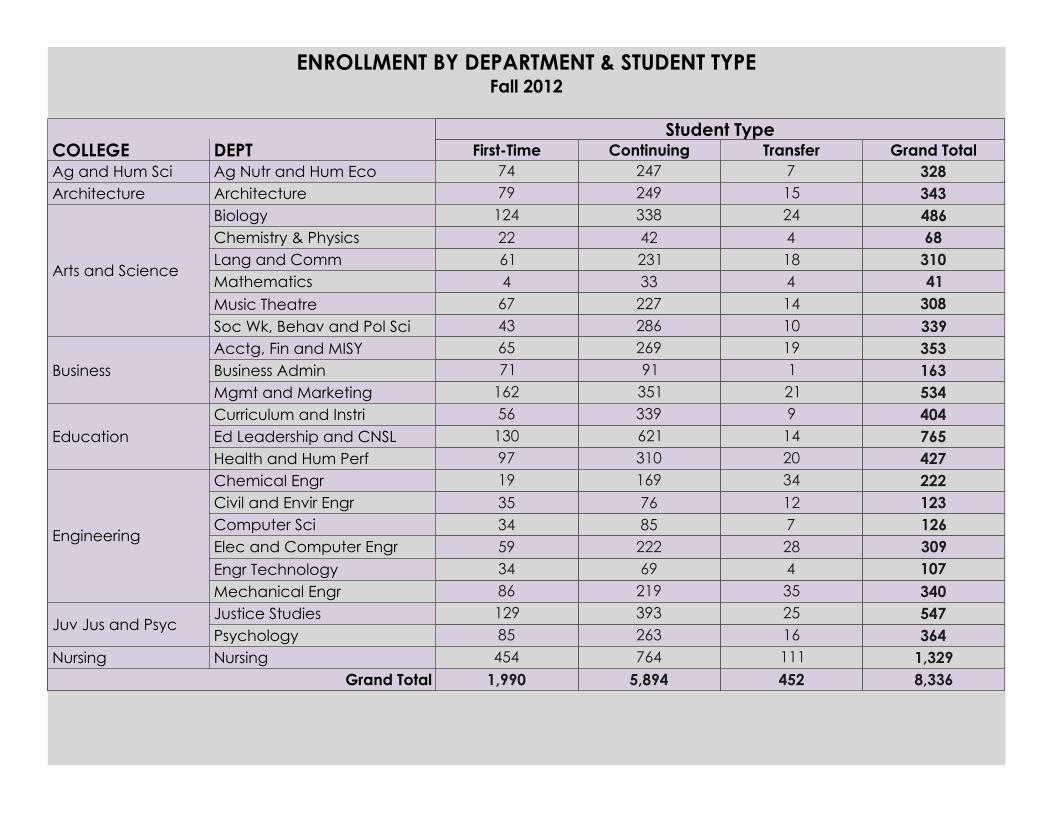
3287247743431524979
3393084131068486
1014418424
2862273323142338
436746122124
534163353
21119
35191269
1627165
427765404
20149
310621339
9713056
340107309126123222
3542871234
219692228576169
863459343519
364547
1625
263393
85129
1,3291117644548,3364525,8941,990
ENROLLMENT BY DEPARTMENT & STUDENT TYPEFall 2012
COLLEGE DEPTCLASSIFICATION
Freshman Sophomore Junior Senior Post-Bacc Masters Doctoral Grand Total
Ag and Hum Sci Ag Nutr and Hum Eco
Architecture Architecture
Arts and Science
Biology
Chemistry & Physics
Lang and Comm
Mathematics
Music Theatre
Soc Wk, Behav and Pol Sci
Business
Acctg, Fin and MISY
Business Admin
Mgmt and Marketing
Education
Curriculum and Instri
Ed Leadership and CNSL
Health and Hum Perf
Engineering
Chemical Engr
Civil and Envir Engr
Computer Sci
Elec and Computer Engr
Engr Technology
Mechanical Engr
Juv Jus and PsycJustice Studies
Psychology
Nursing Nursing
Grand Total
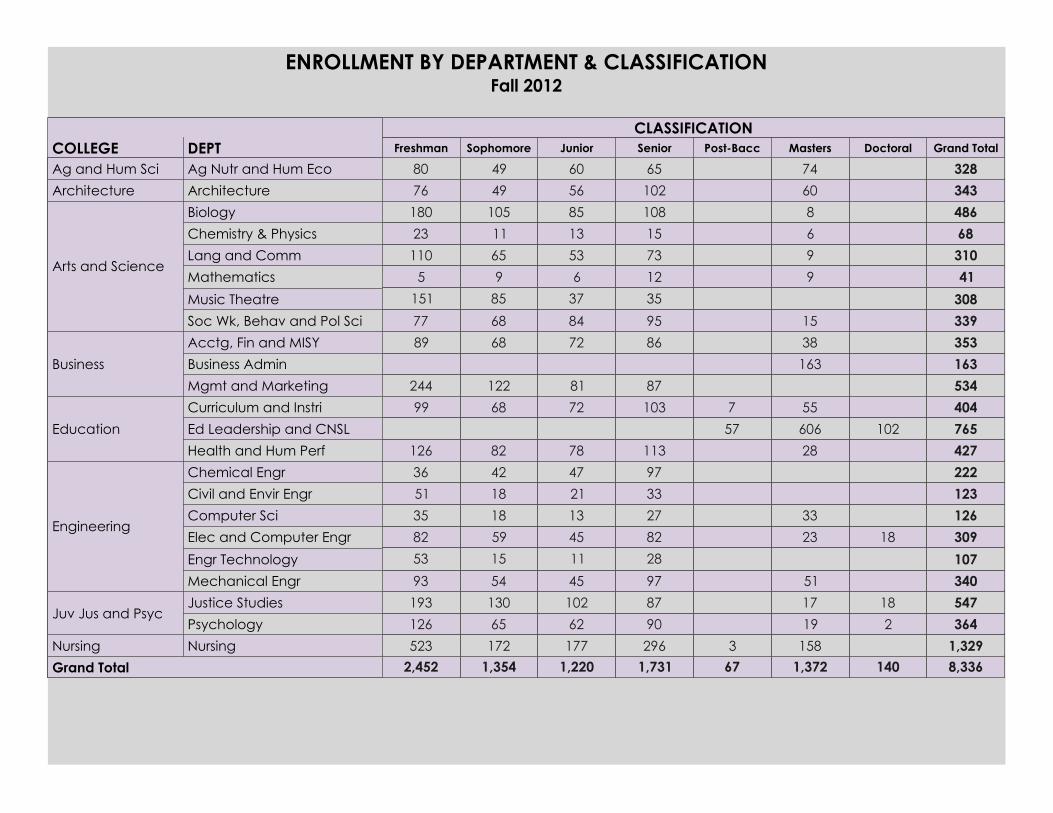
3287465604980
34360102564976
339
308
41
310
68
486
15
9
9
6
8
95
35
12
73
15
108
84
37
6
53
13
85
68
85
9
65
11
105
77
151
5
110
23
180
534
163
353
163
38
87
86
81
72
122
68
244
89
427
765
404
102
28
606
55
57
7
113
103
78
72
82
68
126
99
340
107
309
126
123
222
18
51
23
33
97
28
82
27
33
97
45
11
45
13
21
47
54
15
59
18
18
42
93
53
82
35
51
36
364
547
2
18
19
17
90
87
62
102
65
130
126
193
1,32915832961771725238,3361401,372671,7311,2201,3542,452
ENROLLMENT BY DEPARTMENT & CLASSIFICATIONFall 2012
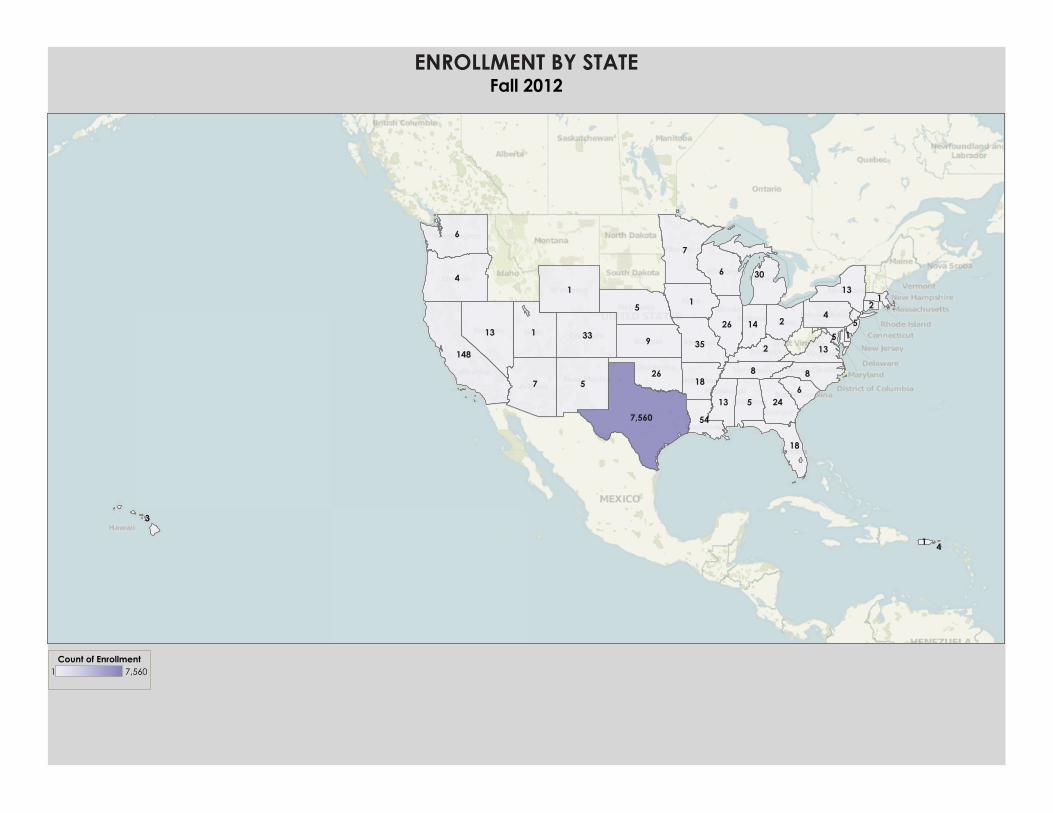
7,560
148
24
14
54
30
18
18
33
13
13
13
1335
26
264
4
4
7
7
88
3
2
2
2
5
5
5
5
5
9
6
6
6
1 1
1
1
1
1
ENROLLMENT BY STATEFall 2012
1 7,560Count of Enrollment
157
127
388
232
645145 119
24
10
40
37
17
78
28
83
12
22
25
11
61
4
4
4
4
4
7
7
3
3
2
2
29
9
9
9
9
9
6
6
1
1
1
1
1
1
1
1
1
1
1
1
1
1
1
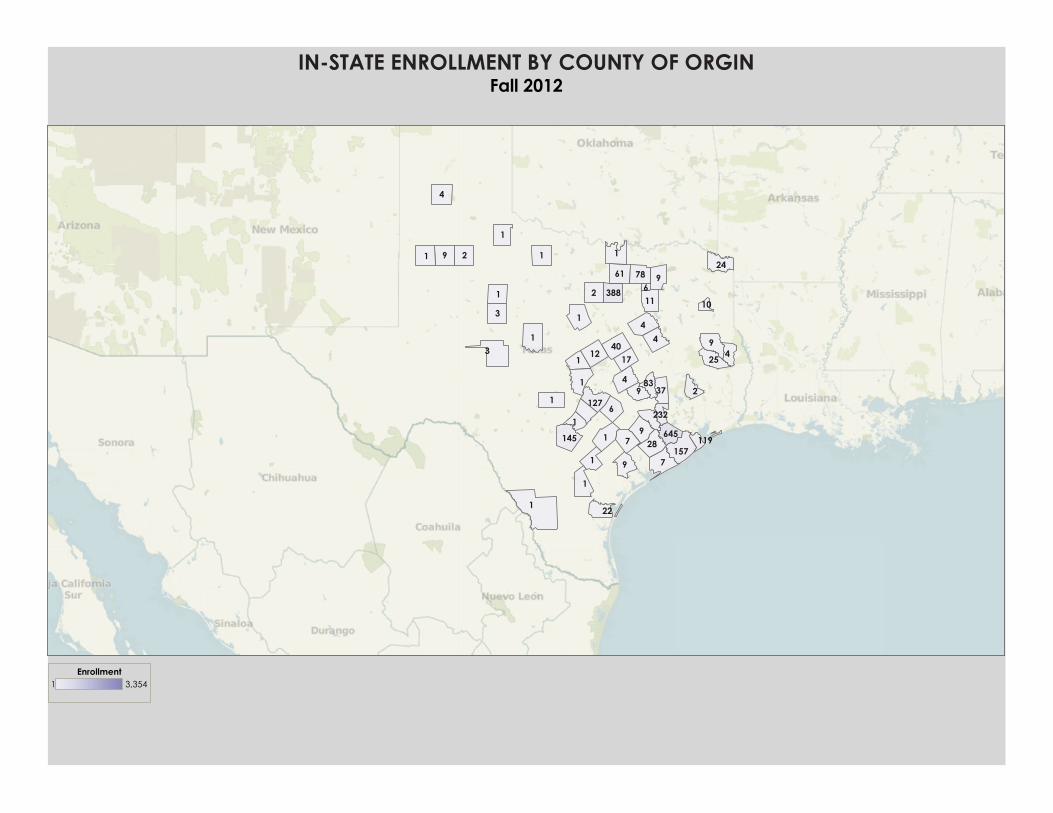
IN-STATE ENROLLMENT BY COUNTY OF ORGINFall 2012
1 3,354Enrollment