Embed Size (px)
Citation preview

PRAGUE, CZECH REPUBLIC
20-21 OCTOBER 2016
DaRTS6 – An Introduction to
Deflection at Road Traffic Speed
Brian Ferne, TRL

© Copyright 2016 TRL Ltd
Introduction to DaRTS
2
• Road pavement deflection-measuring technologies now exist to collect data at normal road traffic speeds.
• The Deflection at Road Traffic Speed (DaRTS) group provides an interchange forum to explore how these technologies can be used in future project and network level pavement analyses
• Established 2012 by TRL and the English Highways Agency (now Highways England• DaRTS1 – June 2012 London, UK• DaRTS2 – June 2013 Trondheim, Norway• DaRTS3 - Sept 2014 Blacksburg, USA• DaRTS4 – Sept 2015 Berlin, Germany• DaRTS5 – April, 2016 London, UK• DaRTS6 – Oct 2016 Prague, Czech Republic
• Members from Australia, Belgium, Denmark, France, Germany, Italy, Netherlands, Poland, South Africa, USA

© Copyright 2016 TRL Ltd
Brief history of deflection measurement
• Earliest measurements under loaded rolling wheel• At relatively slow speeds
• Benkelman beam• Deflectograph (2.5km/h)• Curviameter (18 km/h)
• At traffic speed• Road Deflection Tester, Sweden• Rolling Wheel Deflection, USA• Traffic Speed Deflectometer, Denmark• And many other attempts………

© Copyright 2016 TRL Ltd
Measuring Rolling Wheel DeflectionCreep speed
Walking speed
Running speed
Traffic speed

© Copyright 2016 TRL Ltd
HIGH SPEED DEFLECTION?

© Copyright 2016 TRL Ltd
Principles of the TSD equipment
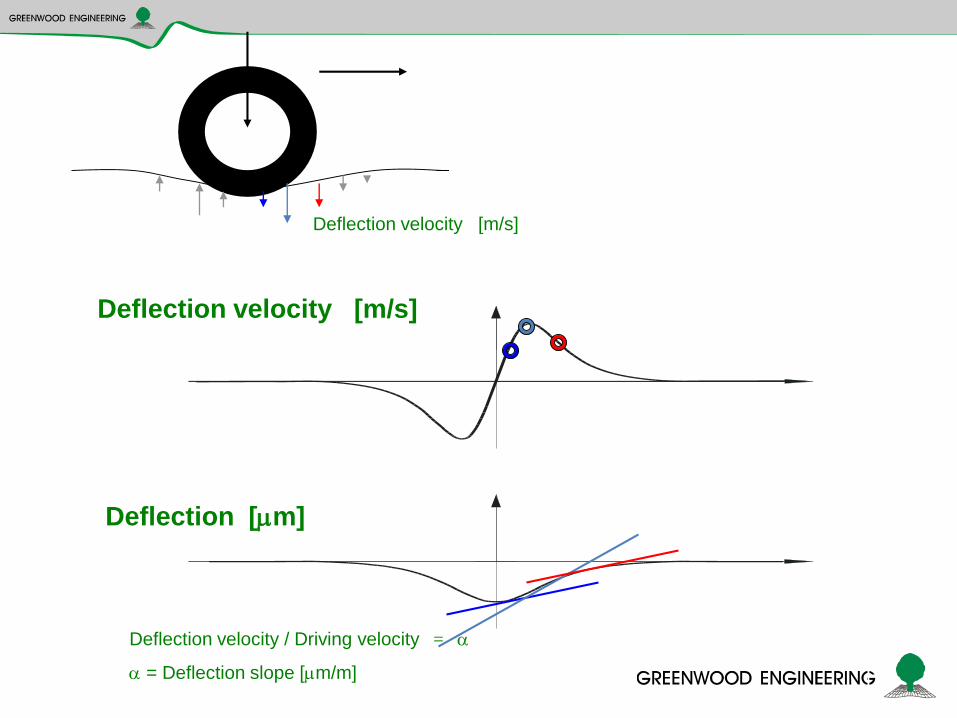
Deflection velocity [m/s]
Deflection [m]
Deflection velocity / Driving velocity
= Deflection slope [m/m]
=
Deflection velocity [m/s]

© Copyright 2016 TRL Ltd
Development of the DaRTS devices and their use by country and date
2000? Denmark Greenwood & Danish Road Directorate2005 England Highways Agency/TRL2010 Italy ANAS2011 Poland IBDIM2012 South Africa SANRAL2013 China RIOH2013 USA Comparative trials and demonstrations2014 Australia ARRB2015 Germany BaST2016 The Netherlands RWS2016 Denmark Dynatest

© Copyright 2016 TRL Ltd
Development of the TSD and its use by country
2000? Denmark Greenwood – Jorgen Krarup2005 England Highways Agency/TRL2010 Italy ANAS2011 Poland IBDIM2012 South Africa SANRAL2013 China RIOH2013 USA Comparative trials and demonstrations2014 Australia ARRB2015 Germany BaST2016 The Netherlands RWS
© Copyright 2016 TRL Ltd
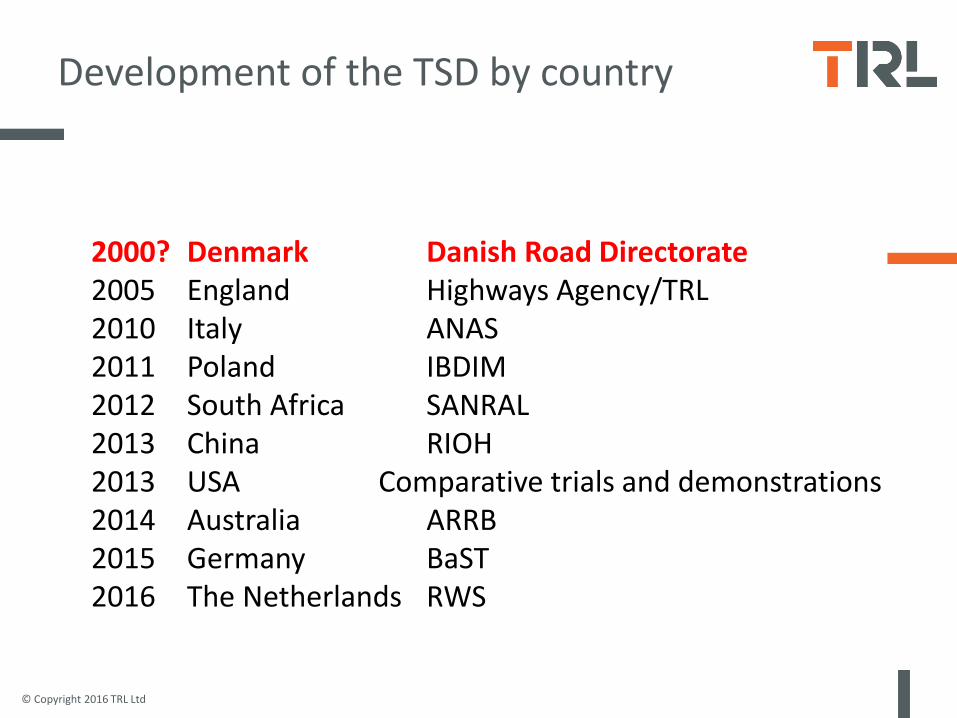
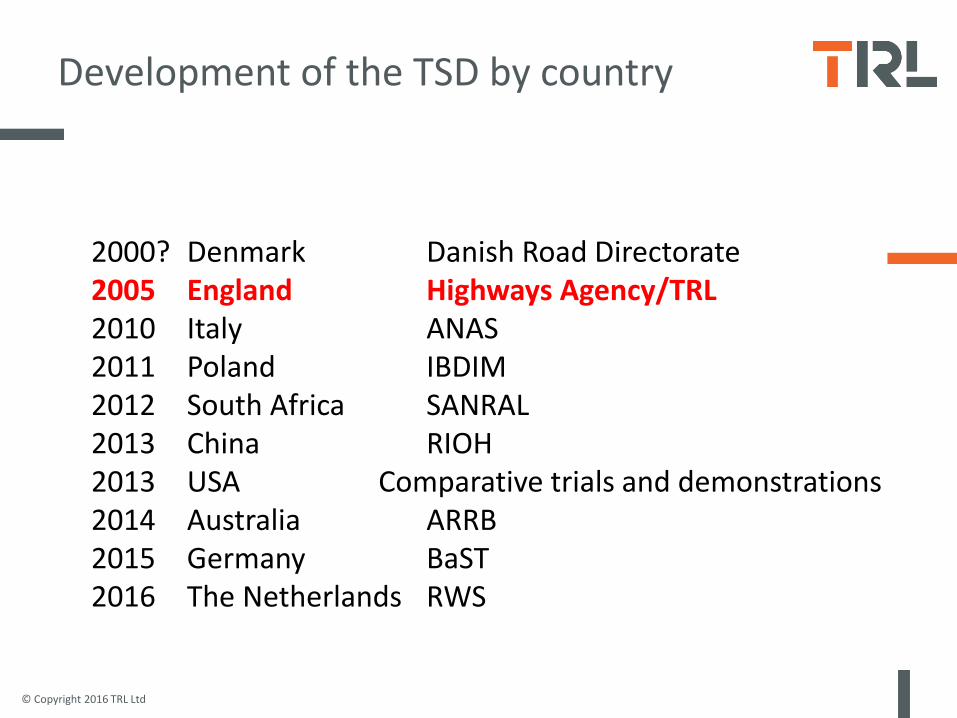
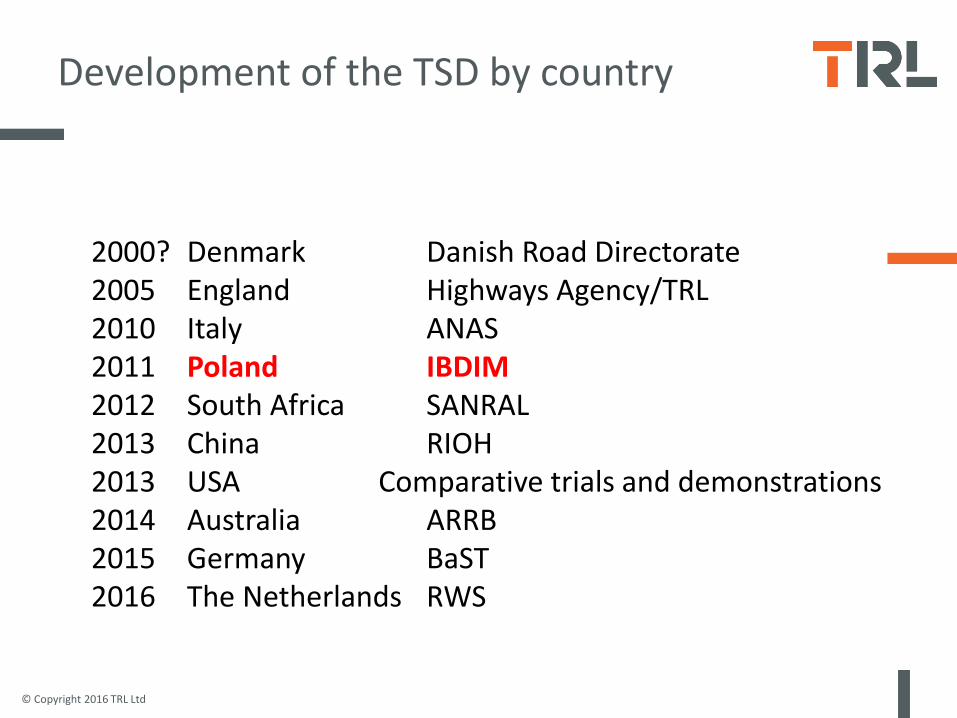
Development of the TSD by country
2000? Denmark Danish Road Directorate2005 England Highways Agency/TRL2010 Italy ANAS2011 Poland IBDIM2012 South Africa SANRAL2013 China RIOH2013 USA Comparative trials and demonstrations2014 Australia ARRB2015 Germany BaST2016 The Netherlands RWS

DRD status
Susanne Baltzer, Danish Road Directorate
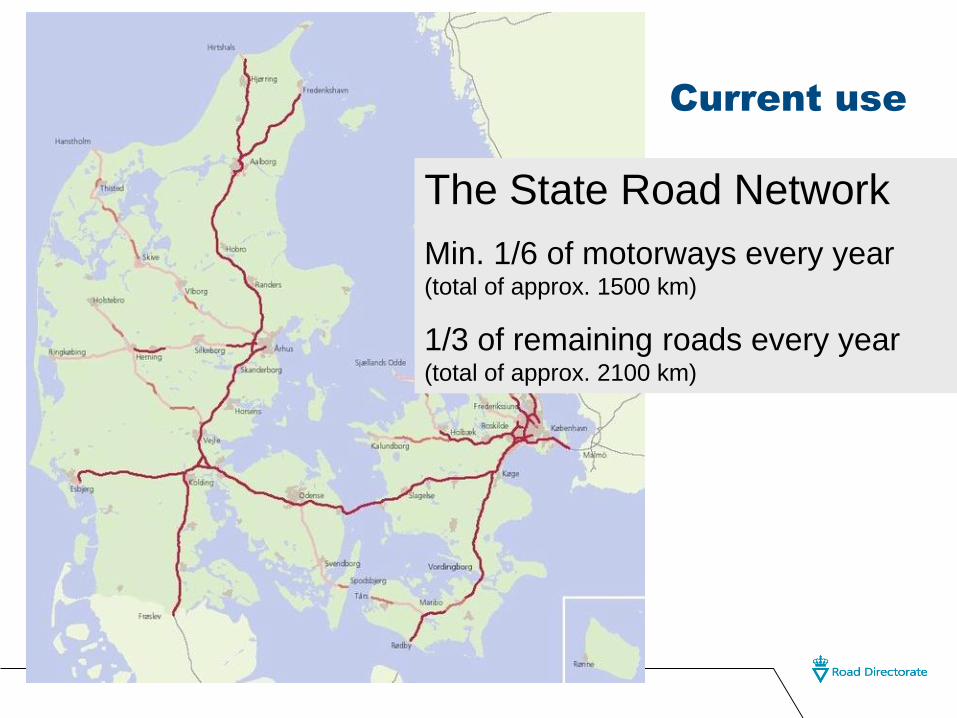
The State Road Network
Min. 1/6 of motorways every year(total of approx. 1500 km)
1/3 of remaining roads every year(total of approx. 2100 km)
Current use

HSD – good/poor bearing capacity
© Copyright 2016 TRL Ltd
Development of the TSD by country
2000? Denmark Danish Road Directorate2005 England Highways Agency/TRL2010 Italy ANAS2011 Poland IBDIM2012 South Africa SANRAL2013 China RIOH2013 USA Comparative trials and demonstrations2014 Australia ARRB2015 Germany BaST2016 The Netherlands RWS
Roger Fairclough
Highways England
Status on the UK use of the TSD

TSD Development 2006-2009
Development of prototype into fully functional research tool
Development of empirical relationship between TSD and Deflectograph
Ready for roll-out of network-level structural condition surveys as proxy for Deflectograph
y = 8E-06x2 + 5E-05x + 0.1838
R2 = 0.7708
0
0.2
0.4
0.6
0.8
1
1.2
1.4
0 50 100 150 200 250 300 350
DFG [µm]
TS
D [
mm
/m]
100m Average, 107 points
Poly. (100m Average, 107 points)
0
100
200
300
400
500
600
0 1000 2000 3000 4000 5000 6000 7000 8000 9000 10000 11000 12000
Chainage [m]
DFG
Def
lect
ion
[µm
]
DFG N/S Events
Underbridge
x4Hen & chicken on-slip
Isington Lane
Underbridge Overbridge
x3
Surrey boundary Bar markers startSign for Bentley
0
0.2
0.4
0.6
0.8
1
1.2
1.4
1.6
0 1000 2000 3000 4000 5000 6000 7000 8000 9000 10000 11000 12000
Chainage [m]
TSD
Slo
pe [m
m/m
]
Events TSD P100 10m average
Underbridge
x4Hen & chicken on-slip
Isington Lane
Underbridge Overbridge
x3
Surrey boundary Bar markers startSign for Bentley
Deflectograph
TSD
Page 17
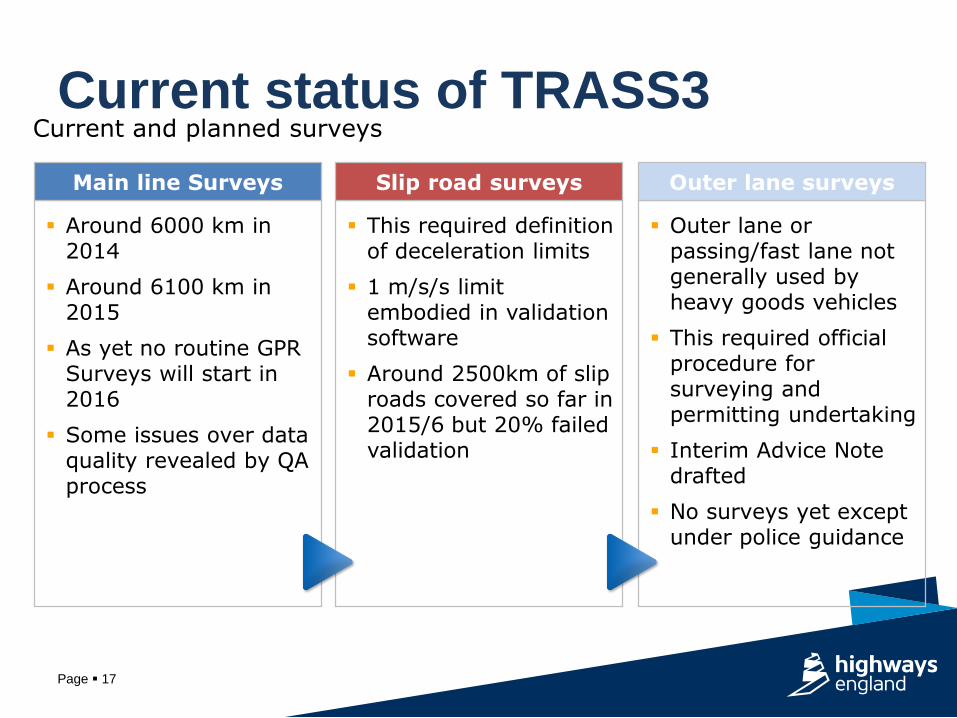
Current status of TRASS3
Around 6000 km in 2014
Around 6100 km in 2015
As yet no routine GPR Surveys will start in 2016
Some issues over data quality revealed by QA process
Main line Surveys
This required definition of deceleration limits
1 m/s/s limit embodied in validation software
Around 2500km of slip roads covered so far in 2015/6 but 20% failed validation
Slip road surveys
Outer lane or passing/fast lane not generally used by heavy goods vehicles
This required official procedure for surveying and permitting undertaking
Interim Advice Note drafted
No surveys yet except under police guidance
Outer lane surveys
Current and planned surveys
Page 18
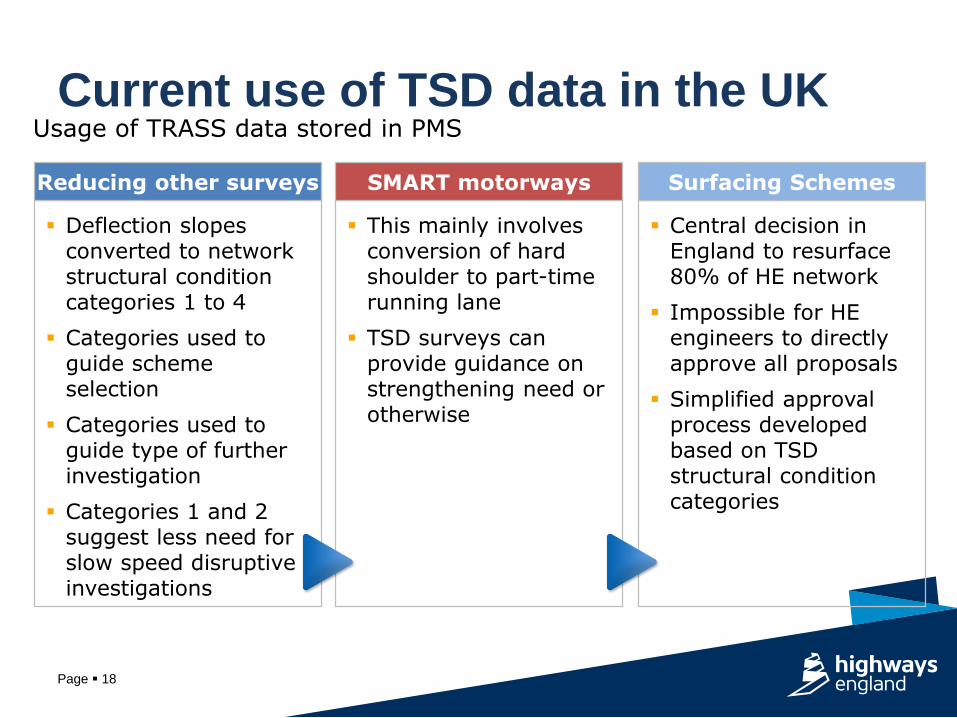
Current use of TSD data in the UK
Deflection slopes converted to network structural condition categories 1 to 4
Categories used to guide scheme selection
Categories used to guide type of further investigation
Categories 1 and 2 suggest less need for slow speed disruptive investigations
Reducing other surveys
This mainly involves conversion of hard shoulder to part-time running lane
TSD surveys can provide guidance on strengthening need or otherwise
SMART motorways
Central decision in England to resurface 80% of HE network
Impossible for HE engineers to directly approve all proposals
Simplified approval process developed based on TSD structural condition categories
Surfacing Schemes
Usage of TRASS data stored in PMS

© Copyright 2016 TRL Ltd
Development of the TSD by country
2000? Denmark Danish Road Directorate2005 England Highways Agency/TRL2010 Italy ANAS2011 Poland IBDIM2012 South Africa SANRAL2013 China RIOH2013 USA Comparative trials and demonstrations2014 Australia ARRB2015 Germany BaST2016 The Netherlands RWS

20
ANAS TSD - acceptance test and calibration
comparison between TSD and FWD
Pavement Management in ANAS network
Ing. Stefano Drusin
ANAS S.p.a.
Direzione Centrale
Ricerca e Nuove Tecnologie
DARTS 18 – 19 June 2012

21
SS675 IS300 70 km/h date 10-9-2010
0
50
100
150
200
250
300
350
43.1 43.3 43.5 43.7 43.9 44.1 44.3 44.5 44.7
MeasurementFileName=T3201009100006.lp.dist
MeasurementFileName=T3201009100007.lp.dist
FWD
SS 675 IS300 different driving speed 50 - 90 km/h date 10-9-2010
0
50
100
150
200
250
300
350
500 600 700 800 900 1000 1100 1200 1300 1400 1500
MeasurementFileName=T3201009100009.raw MeasurementFileName=T3201009100011.row MeasurementFileName=T3201009100013.row
MeasurementFileName=T3201009100015.raw MeasurementFileName=T3201009100017.row MeasurementFileName=T3201009100019.row
MeasurementFileName=T3201009100021.row MeasurementFileName=T3201009100023.row MeasurementFileName=T3201009100027.row
FWD
The comparison data have
demonstrated good repeatability
of the TSD of its comparability
with the FWD equipment, should
also be considered that some
variables, like test temperature
require additional measures,
change in vehicle speed seems
irrelevant when the speed itself is
contained between 40 and 80
km/h.
It can be concluded that a
qualitative correspondence
between the two devices is
present.
Direzione
Centrale
Ricerche
e Nuove
Tecnologie

ANAS s.p.a. - Codirezione Generale Tecnica - Unità Ricerca e Innovazione – Centro Sperimentale Stradale
Pavement management problemsin ANAS network
directly managed Km 25.420
under concession Km 5.695
Evaluation of Network
Condition
Pavement
Design
Testing of Worksmaintenance of existing road or
new road construction
HOW ANAS PLAN TO MANAGE
IN INTEGRATED WAY
ALL FEATURES
© Copyright 2016 TRL Ltd
Development of the TSD by country
2000? Denmark Danish Road Directorate2005 England Highways Agency/TRL2010 Italy ANAS2011 Poland IBDIM2012 South Africa SANRAL2013 China RIOH2013 USA Comparative trials and demonstrations2014 Australia ARRB2015 Germany BaST2016 The Netherlands RWS
INSTYTUT BADAWCZY DRÓG I MOSTÓW (IBDIM)
IBDiM TSD updateSep 2014
Jacek Sudyka
Adam ZofkaTo be presented @ DaRTS3 at PE2014
24

INSTYTUT BADAWCZY DRÓG I MOSTÓW (IBDIM)
• Road and Bridge Research Institute (IBDiM)
• TSD since 2011
– Fixed 10 ton load on the single (rear) axis
– 6 plus 1 sensors
– Load sensors installed in 2014
• Example projects:
– Trial testing in Germany, Finland, Sweden
– City of Warsaw, Poland, 2012
– Silesian Region, Poland, 2013
– Masovian Region, Poland, 2014
25

© Copyright 2016 TRL Ltd
Development of the TSD by country
2000? Denmark Danish Road Directorate2005 England Highways Agency/TRL2010 Italy ANAS2011 Poland IBDIM2012 South Africa SANRAL2013 China RIOH2013 USA Comparative trials and demonstrations2014 Australia ARRB2015 Germany BaST2016 The Netherlands RWS

SANRAL TSD SAT RESULTS
PLANNED RESEARCH
Louw KannemeyerJune 2013DaRTS2 Workshop

To Correctly Interpret TSD Data – Need To understand pavement response

R104 Instrumented Sections - Flexible

© Copyright 2016 TRL Ltd
Development of the TSD by country
2000? Denmark Danish Road Directorate2005 England Highways Agency/TRL2010 Italy ANAS2011 Poland IBDIM2012 South Africa SANRAL2013 China RIOH2013 USA Comparative trials and demonstrations2014 Australia ARRB2015 Germany BaST2016 The Netherlands RWS

TURNER-FAIRBANK HIGHWAY RESEARCH CENTER
Pavement Structural Evaluation at the Network Level
DaRTS5 Meeting
Session 2
April 26, 2016
TURNER-FAIRBANK HIGHWAY RESEARCH CENTER
Project Objectives
Objectives:
– Assess and evaluate capability of traffic speed deflection-related devices for pavement structural evaluation at network level
– Develop methodologies for enabling use of devices in pavement management
TURNER-FAIRBANK HIGHWAY RESEARCH CENTER
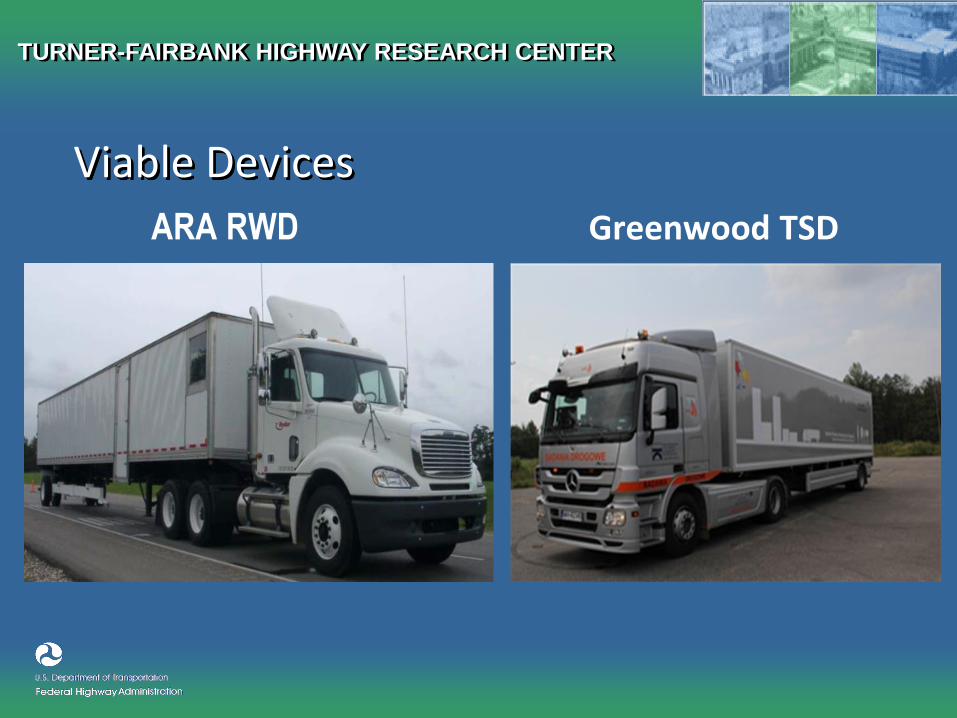
Viable Devices
ARA RWD Greenwood TSD

TURNER-FAIRBANK HIGHWAY RESEARCH CENTER
Devices & Sites
MnROAD Facility
Wright County, MN 18-mile loop
TSD, Curviameter &
RWD

04/07/2014
Demonstration of Network Level Pavement
Structural Evaluation with Traffic Speed
Deflectometer
Samer Katicha
Gerardo Flintsch
DaRTS5 Meeting
April, 26th 2016
Center for Sustainable Transportation Infrastructure

Pooled Fund Team
Pooled fund effort (9 States + FHWA)
FHWA (lead)
CALTRANS, GDOT, IDDOT, IDOT, NDOT, NYDOT,
PennDOT, SCDOT, VDOT
Project team
Engineering & Software Consultants, Inc. (ESCINS)
Project management
Virginia Tech Transportation Institute (VTTI)
Research team
Greenwood Engineering
Testing
Transport Research Laboratory (TRL): Brian Ferne
Expert advice and consulting support
Center for Sustainable Transportation Infrastructure
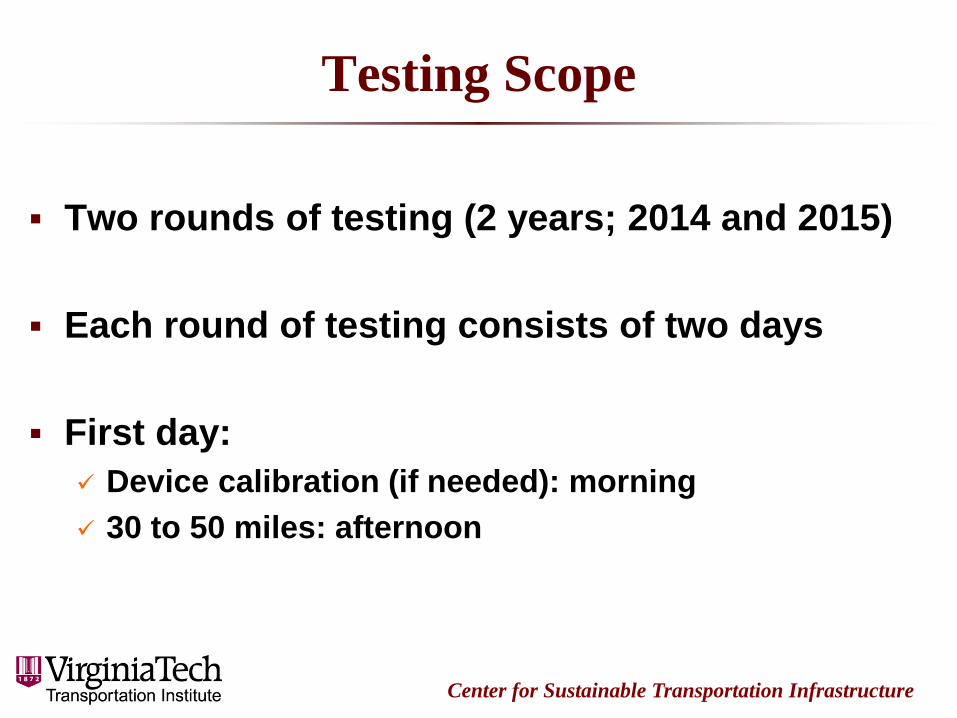
Testing Scope
Two rounds of testing (2 years; 2014 and 2015)
Each round of testing consists of two days
First day:
Device calibration (if needed): morning
30 to 50 miles: afternoon
Center for Sustainable Transportation Infrastructure

Testing Scope
Second day:
Testing up to 250 miles (depending on chosen
course)
Testing completed
Total: 4,500 miles (excluding Idaho ~ 500 miles)
Range: 300 to 1,000 miles
Center for Sustainable Transportation Infrastructure

Objective
Demonstrate the TSD
Network level structural evaluation
Application in agency’s PMS
Evaluate TSD
Repeatability
Calculation of structural index
Relation to existing condition
Center for Sustainable Transportation Infrastructure
© Copyright 2016 TRL Ltd
Development of the TSD by country
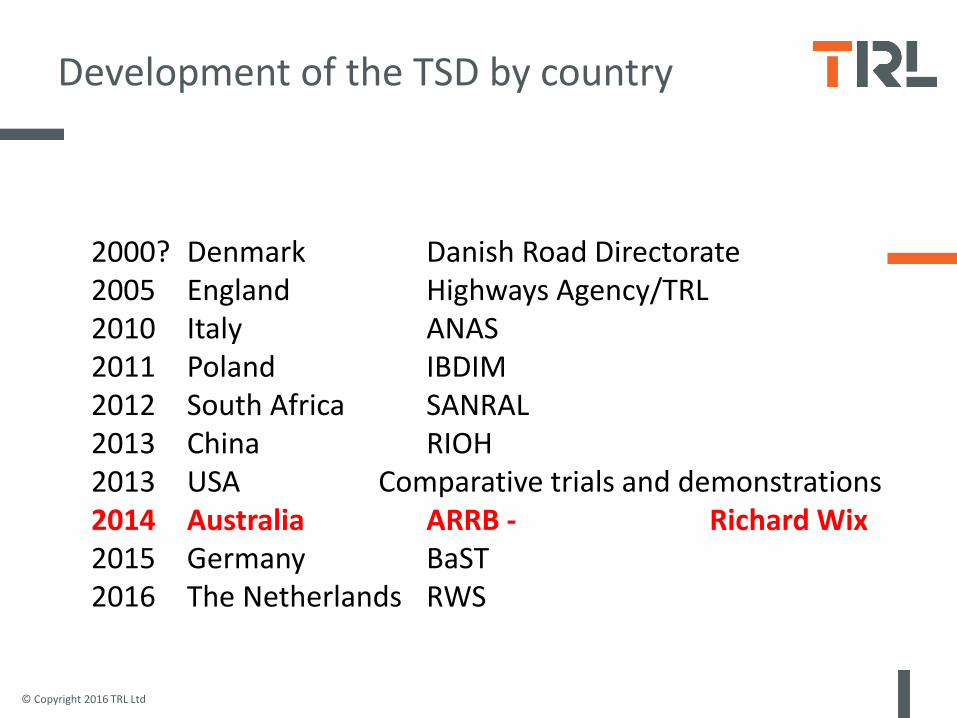
2000? Denmark Danish Road Directorate2005 England Highways Agency/TRL2010 Italy ANAS2011 Poland IBDIM2012 South Africa SANRAL2013 China RIOH2013 USA Comparative trials and demonstrations2014 Australia ARRB - Richard Wix 2015 Germany BaST2016 The Netherlands RWS
© Copyright 2016 TRL Ltd
Development of the TSD by country
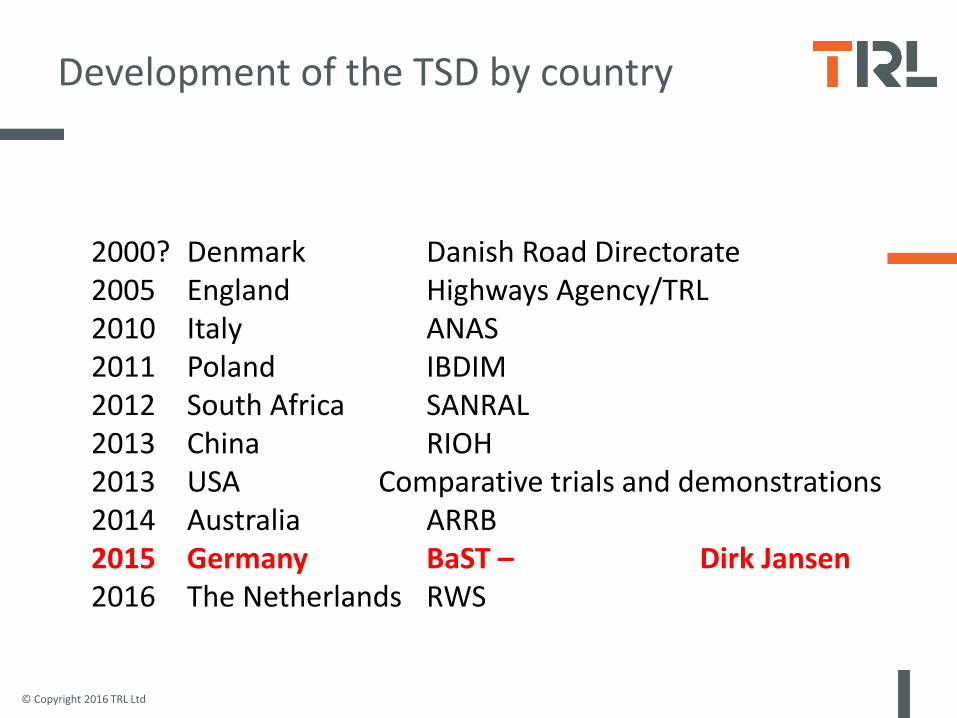
2000? Denmark Danish Road Directorate2005 England Highways Agency/TRL2010 Italy ANAS2011 Poland IBDIM2012 South Africa SANRAL2013 China RIOH2013 USA Comparative trials and demonstrations2014 Australia ARRB2015 Germany BaST – Dirk Jansen2016 The Netherlands RWS

© Copyright 2016 TRL Ltd
Development of the TSD by country
2000? Denmark Danish Road Directorate2005 England Highways Agency/TRL2010 Italy ANAS2011 Poland IBDIM2012 South Africa SANRAL2013 China RIOH2013 USA Comparative trials and demonstrations2014 Australia ARRB2015 Germany BaST2016 The Netherlands RWS2016 Denmark Dynatest
Monday, October 24, 2016
Research ProgrammeReplacement & Renovation
of Pavements
Arthur van Dommelen
Ministry of Infrastructure and Environment
The Netherlands

Rijkswaterstaat
Research Programme “Replacement & Renovation of Pavements” 2016-2020
Aim
Risk assessment and R&R needs by 2020 of pavements on Dutch road network
• 2015 set-up of Research Programme R&R pavements
• 2016 identification of data sources and
suitable inspection and measurement methods
• 2017 inventory of pavement characteristics and
information gathering by means of measurements and inspections
• 2018 analysis of replacement/renovation needs; formulating recommendations
45 24-10-2016

Rijkswaterstaat
Research Topics 2016-2018
1. bearing capacity
• TSD
• Curviameter
2. culverts
3. robustness of pavement and road design against changes in traffic and climate conditions
46 24-10-2016
Focus 2016
© Copyright 2016 TRL Ltd
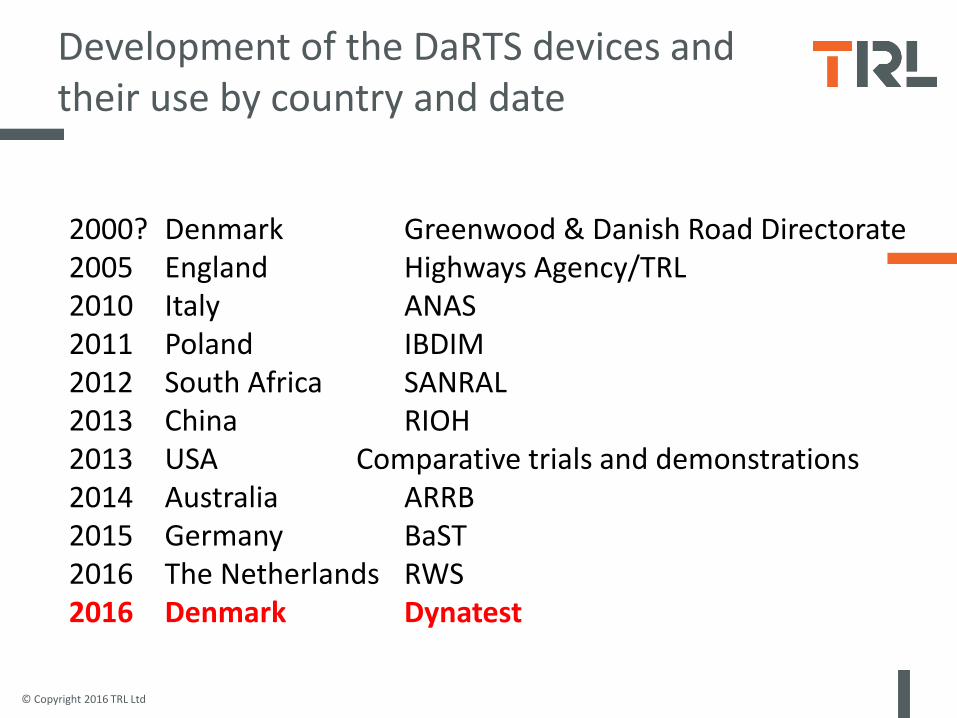
Development of the DaRTS devices and their use by country and date
2000? Denmark Greenwood & Danish Road Directorate2005 England Highways Agency/TRL2010 Italy ANAS2011 Poland IBDIM2012 South Africa SANRAL2013 China RIOH2013 USA Comparative trials and demonstrations2014 Australia ARRB2015 Germany BaST2016 The Netherlands RWS2016 Denmark Dynatest

© Copyright 2016 TRL Ltd
Dynatest RWD or RPT? Ready 2017?
48
© Copyright 2016 TRL Ltd
Summary on the measurement of deflection at traffic speed
Now 10 or more Greenwood TSDs in use
Other devices in operation
Further devices under development
Range of implementation from regular network surveys to research
Range of interpretation from simple to complex
Much potential for future developments and wider application
Learn more at DaRTS2017 - part of:
4924-10-2016