Embed Size (px)
Citation preview

0 | P a g e
GOVERNMENT OF INDIA
PRADHANMANTRI KRISHI SINCHAN YOJANA
(PMKSY)
DISTRICT IRRIGATION PLAN
Prepared By District Superintending Agriculture Officer,
Sindhudurg. (M.S.)

1 | P a g e
Index
Sr. No.
Particulars Page No
1 Physical Personality of Sindhudurg District 03-16
2 Literature View PMKSY 17-24
3 Methodology and Approach for Preparation of DIP 25-31
4 Data Requirement for Preparation of District Irrigation Plan 32-37
5 Hydrology 38-54
6 Accelerated Irrigation Benefit Programme 55-56
7 Per Drop More Crop 57-58
8 Probable Benefits of the Plan 59-60
9 Conclusion 61
10 Template 62-92
2 | P a g e
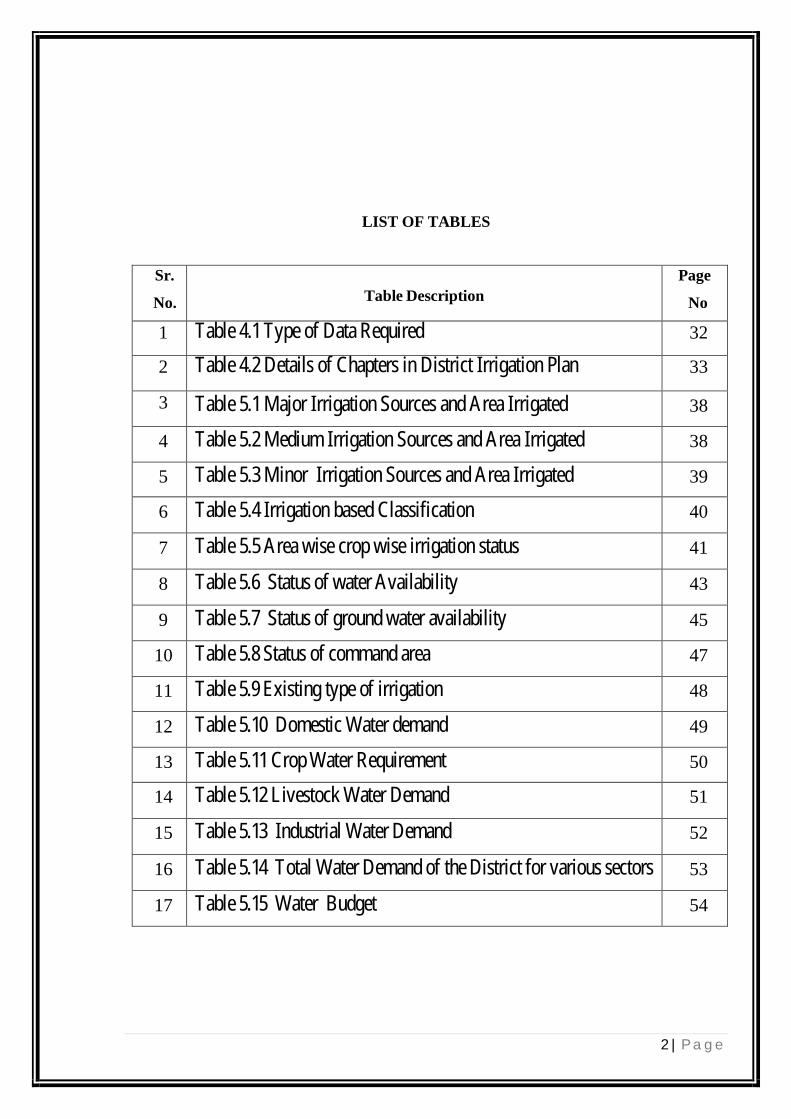
LIST OF TABLES
Sr.
No. Table Description Page
No
1 Table 4.1 Type of Data Required 32
2 Table 4.2 Details of Chapters in District Irrigation Plan 33
3 Table 5.1 Major Irrigation Sources and Area Irrigated 38
4 Table 5.2 Medium Irrigation Sources and Area Irrigated 38
5 Table 5.3 Minor Irrigation Sources and Area Irrigated 39
6 Table 5.4 Irrigation based Classification 40
7 Table 5.5 Area wise crop wise irrigation status 41
8 Table 5.6 Status of water Availability 43
9 Table 5.7 Status of ground water availability 45
10 Table 5.8 Status of command area 47
11 Table 5.9 Existing type of irrigation 48
12 Table 5.10 Domestic Water demand 49
13 Table 5.11 Crop Water Requirement 50
14 Table 5.12 Livestock Water Demand 51
15 Table 5.13 Industrial Water Demand 52
16 Table 5.14 Total Water Demand of the District for various sectors 53
17 Table 5.15 Water Budget 54
3 | P a g e
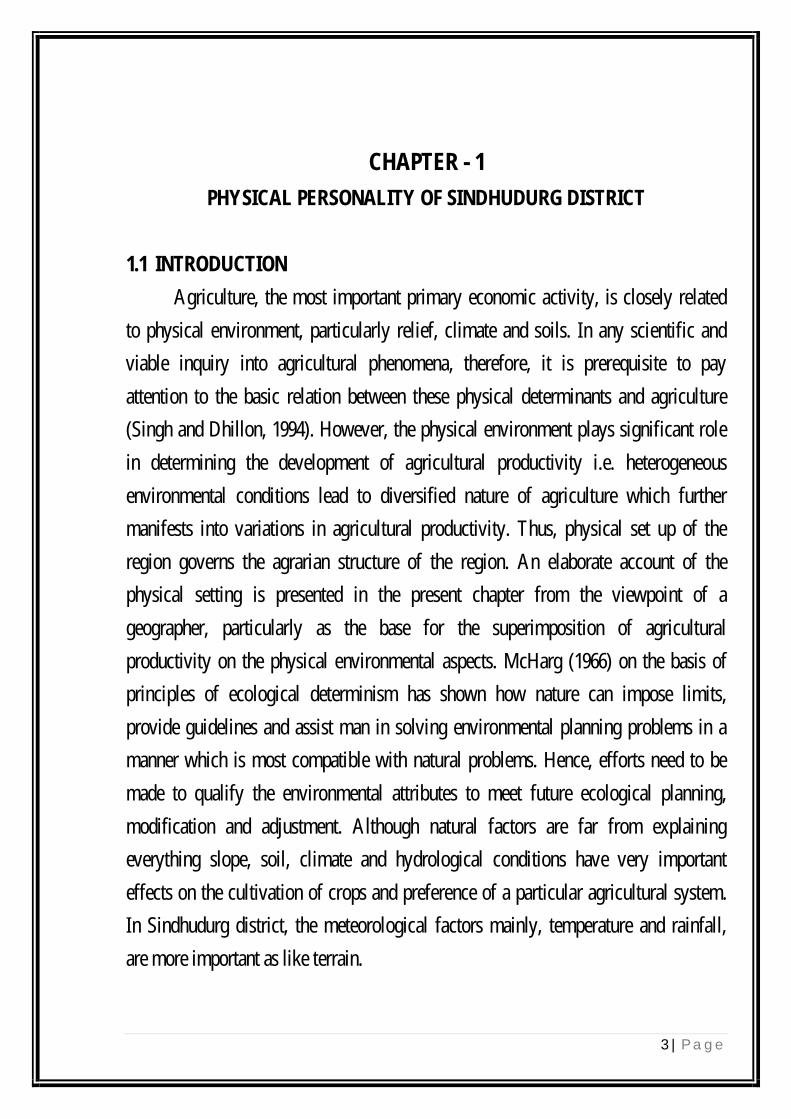
CHAPTER - 1
PHYSICAL PERSONALITY OF SINDHUDURG DISTRICT
1.1 INTRODUCTION
Agriculture, the most important primary economic activity, is closely related
to physical environment, particularly relief, climate and soils. In any scientific and
viable inquiry into agricultural phenomena, therefore, it is prerequisite to pay
attention to the basic relation between these physical determinants and agriculture
(Singh and Dhillon, 1994). However, the physical environment plays significant role
in determining the development of agricultural productivity i.e. heterogeneous
environmental conditions lead to diversified nature of agriculture which further
manifests into variations in agricultural productivity. Thus, physical set up of the
region governs the agrarian structure of the region. An elaborate account of the
physical setting is presented in the present chapter from the viewpoint of a
geographer, particularly as the base for the superimposition of agricultural
productivity on the physical environmental aspects. McHarg (1966) on the basis of
principles of ecological determinism has shown how nature can impose limits,
provide guidelines and assist man in solving environmental planning problems in a
manner which is most compatible with natural problems. Hence, efforts need to be
made to qualify the environmental attributes to meet future ecological planning,
modification and adjustment. Although natural factors are far from explaining
everything slope, soil, climate and hydrological conditions have very important
effects on the cultivation of crops and preference of a particular agricultural system.
In Sindhudurg district, the meteorological factors mainly, temperature and rainfall,
are more important as like terrain.
4 | P a g e
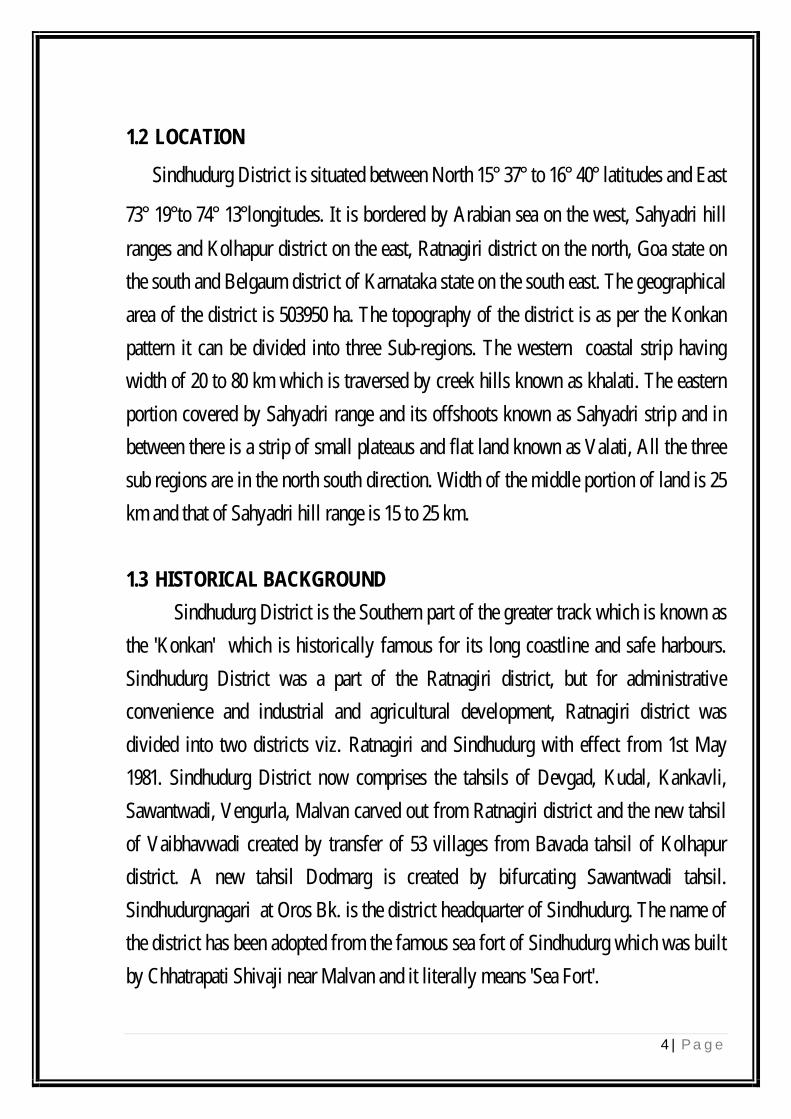
1.2 LOCATION
Sindhudurg District is situated between North 15° 37° to 16° 40° latitudes and East
73° 19°to 74° 13°longitudes. It is bordered by Arabian sea on the west, Sahyadri hill
ranges and Kolhapur district on the east, Ratnagiri district on the north, Goa state on
the south and Belgaum district of Karnataka state on the south east. The geographical
area of the district is 503950 ha. The topography of the district is as per the Konkan
pattern it can be divided into three Sub-regions. The western coastal strip having
width of 20 to 80 km which is traversed by creek hills known as khalati. The eastern
portion covered by Sahyadri range and its offshoots known as Sahyadri strip and in
between there is a strip of small plateaus and flat land known as Valati, All the three
sub regions are in the north south direction. Width of the middle portion of land is 25
km and that of Sahyadri hill range is 15 to 25 km.
1.3 HISTORICAL BACKGROUND
Sindhudurg District is the Southern part of the greater track which is known as
the 'Konkan' which is historically famous for its long coastline and safe harbours.
Sindhudurg District was a part of the Ratnagiri district, but for administrative
convenience and industrial and agricultural development, Ratnagiri district was
divided into two districts viz. Ratnagiri and Sindhudurg with effect from 1st May
1981. Sindhudurg District now comprises the tahsils of Devgad, Kudal, Kankavli,
Sawantwadi, Vengurla, Malvan carved out from Ratnagiri district and the new tahsil
of Vaibhavwadi created by transfer of 53 villages from Bavada tahsil of Kolhapur
district. A new tahsil Dodmarg is created by bifurcating Sawantwadi tahsil.
Sindhudurgnagari at Oros Bk. is the district headquarter of Sindhudurg. The name of
the district has been adopted from the famous sea fort of Sindhudurg which was built
by Chhatrapati Shivaji near Malvan and it literally means 'Sea Fort'.
5 | P a g e
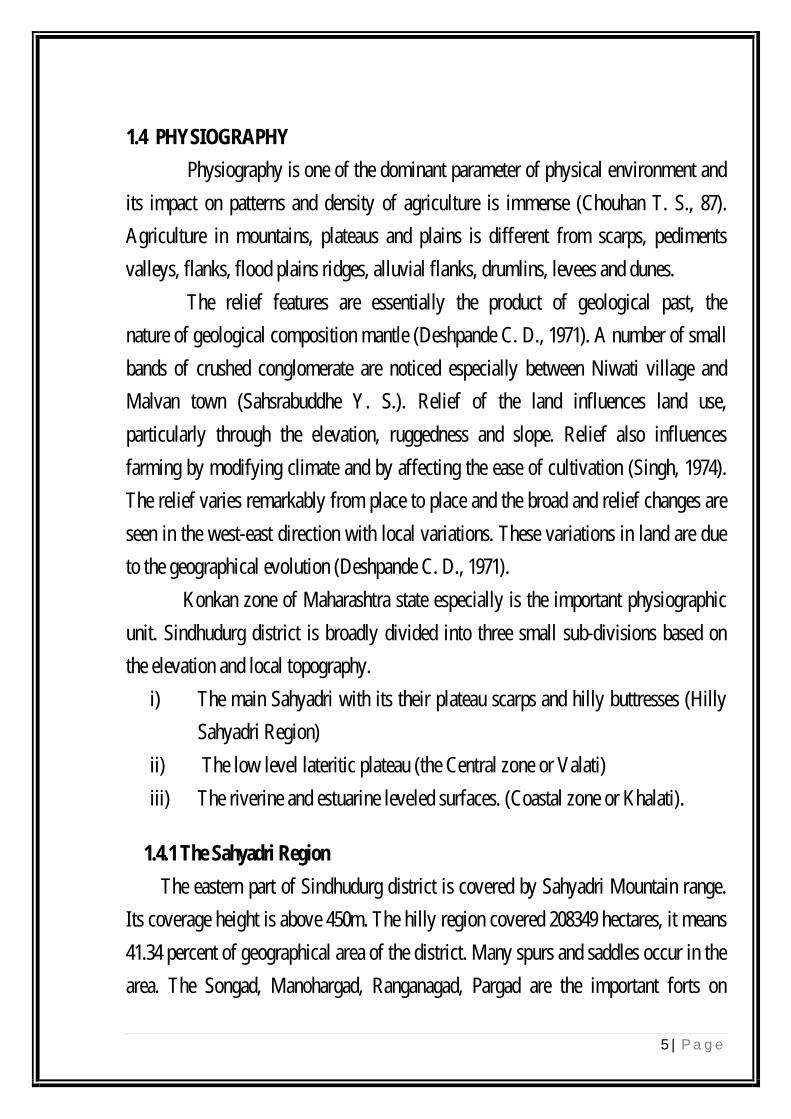
1.4 PHYSIOGRAPHY
Physiography is one of the dominant parameter of physical environment and
its impact on patterns and density of agriculture is immense (Chouhan T. S., 87).
Agriculture in mountains, plateaus and plains is different from scarps, pediments
valleys, flanks, flood plains ridges, alluvial flanks, drumlins, levees and dunes.
The relief features are essentially the product of geological past, the
nature of geological composition mantle (Deshpande C. D., 1971). A number of small
bands of crushed conglomerate are noticed especially between Niwati village and
Malvan town (Sahsrabuddhe Y. S.). Relief of the land influences land use,
particularly through the elevation, ruggedness and slope. Relief also influences
farming by modifying climate and by affecting the ease of cultivation (Singh, 1974).
The relief varies remarkably from place to place and the broad and relief changes are
seen in the west-east direction with local variations. These variations in land are due
to the geographical evolution (Deshpande C. D., 1971).
Konkan zone of Maharashtra state especially is the important physiographic
unit. Sindhudurg district is broadly divided into three small sub-divisions based on
the elevation and local topography.
i) The main Sahyadri with its their plateau scarps and hilly buttresses (Hilly
Sahyadri Region)
ii) The low level lateritic plateau (the Central zone or Valati)
iii) The riverine and estuarine leveled surfaces. (Coastal zone or Khalati).
1.4.1 The Sahyadri Region
The eastern part of Sindhudurg district is covered by Sahyadri Mountain range.
Its coverage height is above 450m. The hilly region covered 208349 hectares, it means
41.34 percent of geographical area of the district. Many spurs and saddles occur in the
area. The Songad, Manohargad, Ranganagad, Pargad are the important forts on
6 | P a g e
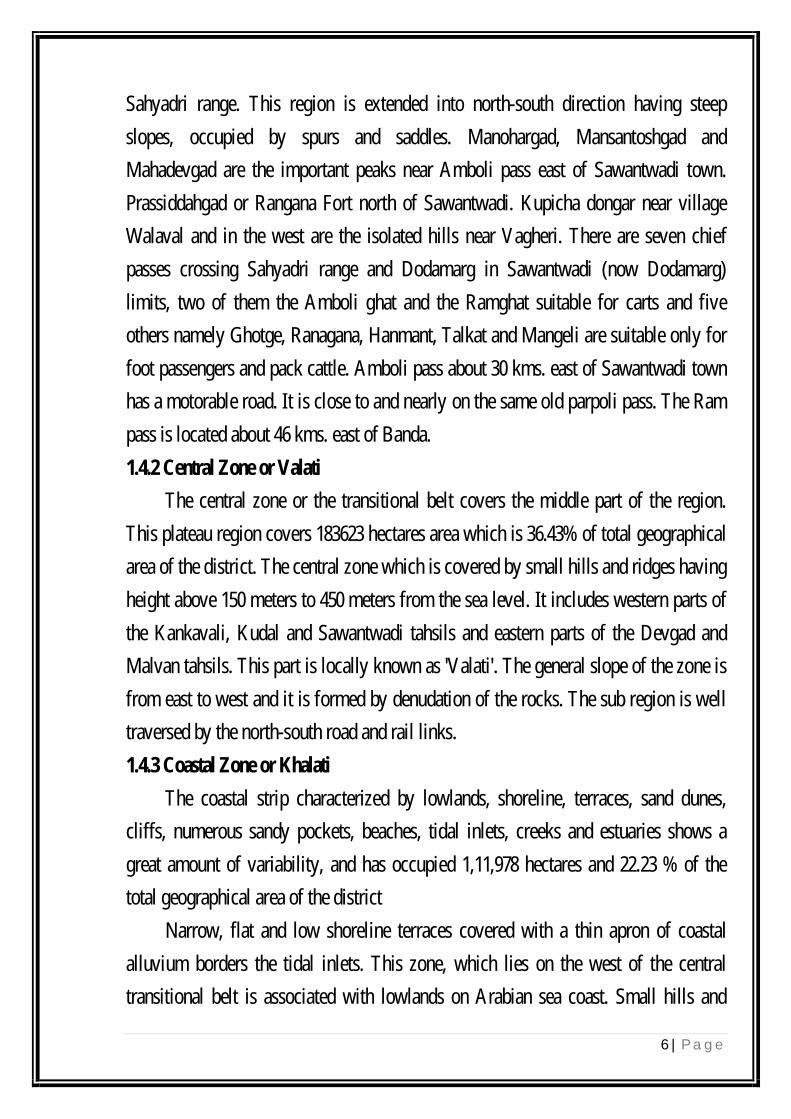
Sahyadri range. This region is extended into north-south direction having steep
slopes, occupied by spurs and saddles. Manohargad, Mansantoshgad and
Mahadevgad are the important peaks near Amboli pass east of Sawantwadi town.
Prassiddahgad or Rangana Fort north of Sawantwadi. Kupicha dongar near village
Walaval and in the west are the isolated hills near Vagheri. There are seven chief
passes crossing Sahyadri range and Dodamarg in Sawantwadi (now Dodamarg)
limits, two of them the Amboli ghat and the Ramghat suitable for carts and five
others namely Ghotge, Ranagana, Hanmant, Talkat and Mangeli are suitable only for
foot passengers and pack cattle. Amboli pass about 30 kms. east of Sawantwadi town
has a motorable road. It is close to and nearly on the same old parpoli pass. The Ram
pass is located about 46 kms. east of Banda.
1.4.2 Central Zone or Valati
The central zone or the transitional belt covers the middle part of the region.
This plateau region covers 183623 hectares area which is 36.43% of total geographical
area of the district. The central zone which is covered by small hills and ridges having
height above 150 meters to 450 meters from the sea level. It includes western parts of
the Kankavali, Kudal and Sawantwadi tahsils and eastern parts of the Devgad and
Malvan tahsils. This part is locally known as 'Valati'. The general slope of the zone is
from east to west and it is formed by denudation of the rocks. The sub region is well
traversed by the north-south road and rail links.
1.4.3 Coastal Zone or Khalati
The coastal strip characterized by lowlands, shoreline, terraces, sand dunes,
cliffs, numerous sandy pockets, beaches, tidal inlets, creeks and estuaries shows a
great amount of variability, and has occupied 1,11,978 hectares and 22.23 % of the
total geographical area of the district
Narrow, flat and low shoreline terraces covered with a thin apron of coastal
alluvium borders the tidal inlets. This zone, which lies on the west of the central
transitional belt is associated with lowlands on Arabian sea coast. Small hills and

7 | P a g e
lowlands cover the western part of Devgad, Malvan and Vengurla tahsils. The
elevation of the area is below 150 meters and is formed by alluvial soil, which is
fertile, locally called, 'Khalati Soil'. Cliff formed by wave action and there is a great
variety of shore marks between 2 mts. to 10 meters above sea level. The tidal basins
are a series of small flat plains.
1.5 DRAINAGE PATTERN
Drainage is one of the most important component of physical environment
which influences the agriculture directly as well as indirectly. Drainage is a
comprehensive expression in geography. It includes surface as well as ground water.
1.5.1 Rivers
Direction of flow of the rivers in the district is from east to west in general. The
rivers are useful for the agricultural development but they are mostly dry in Summer
season. However in monsoon season most of the rivers are flooded.
i) Devgad river
Devgad River rises in the Sivgad pass. After a comparatively straight course of
about 56km. from east to west reaches the sea at the fort of Devgad which forms the
southern headland about 19km. south of Vijaydurg fort. Several small islands have
been formed in the bed of the river in its tidal section.
ii) Achare River
It is a small river taking its name from the village on its left bank. It rises in a
spur of Sahyadri range near the Phonda pass. It has a southwesterly course of rather
less than 47 km. to the sea. The entrance to the river is narrow. It lies about 22km.
south of Devgad.
iii) Kalaval River
The river Kalaval rises in the Naradave pass near Bhairvgad. It receives the
waters of a tributary stream, called Gad River. It takes a southwesterly course passing
through Ramgad on the right and Masure on the left. It reaches the sea in a small bay
8 | P a g e
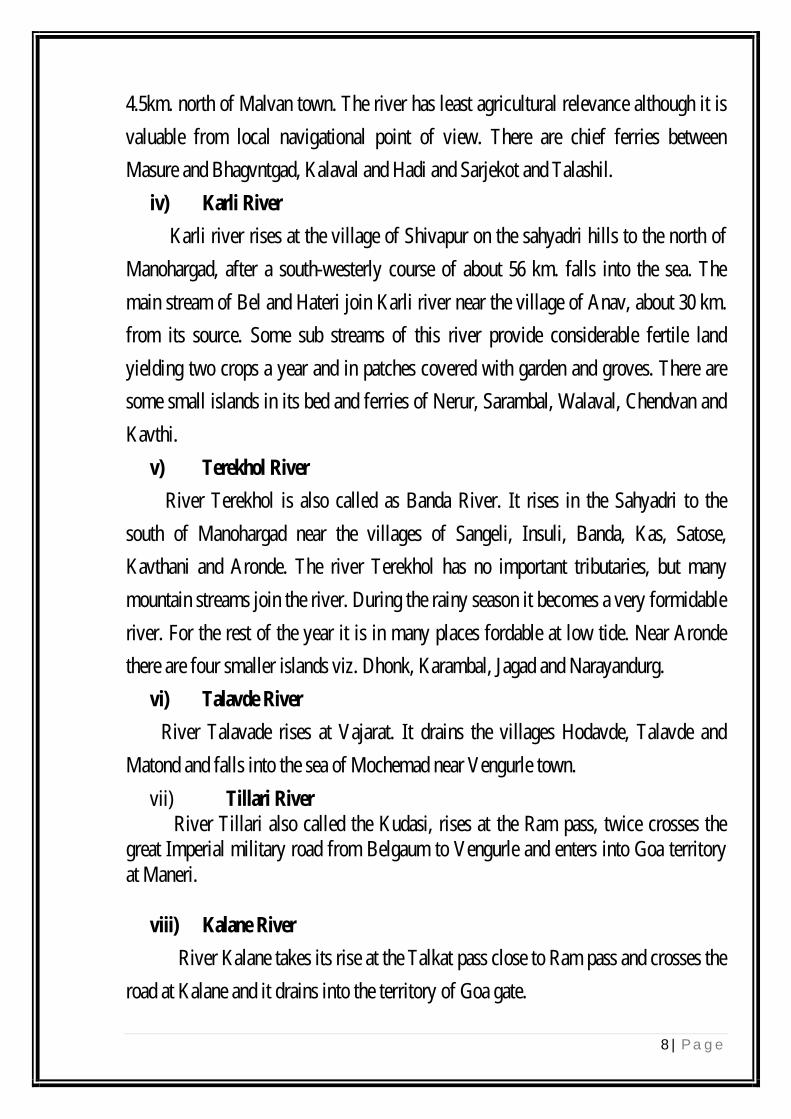
4.5km. north of Malvan town. The river has least agricultural relevance although it is
valuable from local navigational point of view. There are chief ferries between
Masure and Bhagvntgad, Kalaval and Hadi and Sarjekot and Talashil.
iv) Karli River
Karli river rises at the village of Shivapur on the sahyadri hills to the north of
Manohargad, after a south-westerly course of about 56 km. falls into the sea. The
main stream of Bel and Hateri join Karli river near the village of Anav, about 30 km.
from its source. Some sub streams of this river provide considerable fertile land
yielding two crops a year and in patches covered with garden and groves. There are
some small islands in its bed and ferries of Nerur, Sarambal, Walaval, Chendvan and
Kavthi.
v) Terekhol River
River Terekhol is also called as Banda River. It rises in the Sahyadri to the
south of Manohargad near the villages of Sangeli, Insuli, Banda, Kas, Satose,
Kavthani and Aronde. The river Terekhol has no important tributaries, but many
mountain streams join the river. During the rainy season it becomes a very formidable
river. For the rest of the year it is in many places fordable at low tide. Near Aronde
there are four smaller islands viz. Dhonk, Karambal, Jagad and Narayandurg.
vi) Talavde River
River Talavade rises at Vajarat. It drains the villages Hodavde, Talavde and
Matond and falls into the sea of Mochemad near Vengurle town.
vii) Tillari River River Tillari also called the Kudasi, rises at the Ram pass, twice crosses the great Imperial military road from Belgaum to Vengurle and enters into Goa territory at Maneri.
viii) Kalane River
River Kalane takes its rise at the Talkat pass close to Ram pass and crosses the
road at Kalane and it drains into the territory of Goa gate.

9 | P a g e
There are number of other small streams, which in the rainy season, owing to
the heavy rainfall and the nearness of the Sahyadri, suddenly swell into considerable
sizes and are difficult and dangerous to cross.
The eastern escarpment is deeply eroded by the swift flowing rivers because
of the intensive furrowing. There is a succession of drainage amphitheatres with the
residual hills intervening. One who visits Phonda and Amboli passes can see the
contrasting landscapes to the west and east of these places. To the west, there is
youthful topography whereas to the east there is gentle undulating topography
showing a stage of maturity. Due to erosion, the western scarp itself is retreating
eastward and hence there are several phenomena of river capture from the tributaries
of the rivers in the plateau areas (Padmanabham N.)
All the main rivers emerge from the eastern scarp margin of the district and run
parallel to each other from east to west till they met the Arabian sea forming broad
creeks at their mouths. The important creeks from North to South are the creeks of
Vijaydurg, Devgad, Achare, Kalavali, Kolamb, Karli, and Terekhol.
In general, there are some seasonal rivers, which are small in length and are
active with flow of water in monsoon season. They act as outflow drainage channels
for the rainwater. These rivers get dry in summer season. However, drainage is one of
the most important physical environment which affects agriculture directly and
indirectly.
1.5.2. LAKES
Dhamapur and Pendur lakes are the important lakes in Malvan tahsil. Dhamapur
lake covers an area of about 22 hectares with a maximum depth 12mt. Maharashtra
Tourism Development Corporation (M.T.D.C.) has developed this lake as a tourism
spot. Pendur Lake covers an area of 21 hectares having maximum depth of 4mt.
Moti Talav is the largest lake at the centre of Sawantwadi town. It covers an area
of 12 hectares, and the average depth is between 2mt. to 3mts. The lake side is an

10 | P a g e
evening rendezvous for the people in the town. Other four important lakes in the
vicinity are located at the villages viz. Zarap, Mangaon, Bambarde and Matond.
1.5.3. GROUND WATER
Ground water is often called underground water which occurs below the surface
of the earth. Level of ground water is important from the viewpoint of agriculture.
The rise in water-table in any season may be a fluctuating phenomenon of a short
duration. The groundwater is mostly tapped from percolation in wells and springs.
Direction of groundwater flow is from east to west. Natural springs are observed in
Bazarwadi, Pimpalwadi, Morgaon and Amboli in Vaibhavwadi, Devgad and
Dodamarg tahsils respectively.
1.6 RAINFALL
Rainfall as the primary ecological parameter has created a variety of farming
enterprises, types or systems in the world. It is dominant single weather element
influencing the intensity and location of farming system and the farmer's choice. It
also becomes a climatic hazard to farming when it is characterized with scantiness,
concentration, intensity, variability and unreliability. Thus variations in rainfall
characteristics affect agriculture as a whole. Moisture conditions affected to the
stages of crops at sowing, germination, shooting, stalking and heading, maturing,
harvesting and threshing. It is all the more important in the minimal regions, here
average or normal rainfall is generally necessary for successful crop production. In
such areas, the system of crop production must be correlated more or less to the
moisture factor (Klages, 1958).
The co-efficient of rainfall variation for the district is calculated based on the
data for 25 years. One may note some leading variations from the normal occurrence
of the rainfall in terms of daily fall and intensity.

11 | P a g e
i) The commencement of monsoon varies from the first to even the last week
of June. The annual and monthly rainfall varies considerable.
ii) Daily rainfall amount varies considerably within the same month.
iii) There are frequent dry spells.
iv) There is a possibility of total rain failure. No wonder that these rainfall
characteristics deeply influence the traditional agriculture, which is
dependent on rainfall in the absence of irrigation facilities. (Tawade,1976).
The rainy season is due to the south-western monsoon, that is June to
September.
1.6.2 Intensity of Rainfall
Rainfall Intensity of the rain- storms is not always the same.
i) Uniform intensity pattern type - the rainfall intensity remain nearly
constant throughout the rain spell.
ii) Advanced pattern - The rainfall intensity reaches its peak value suddenly
and then intensity decreases slowly by step till it becomes zero.
iii) Delayed pattern - The rainfall intensity reaches it takes its peak value and
thereafter sometime the intensity suddenly reaches zero value.
iv) Intermediate Pattern - The rainfall intensity is the combination of
advanced and delayed pattern.
Rainfall intensity is important as it determines the intensity of soil erosion.
The term 'intensity' refers to the rate at which rain falls in a 24 hours period. It is
calculated by employing the following formula used by Monkhouse and Wilkinson
(1971).
A I = ------- N Where,
I = Intensity of Rainfall
A = Annual Rainfall

12 | P a g e
n = Number of rainy days.
The intensity of rainfall is increases from the coastal area towards the hilly
region, i.e. from west to east.
1.7 SOILS
Soils are important natural resource. They not only form the base for
agriculture and sustain forests and pasture land but also provide the material for brick
making and other industrial activities. Soils provide essential material on which
agriculture is based and therefore any comprehensive survey of the geography of
agriculture, should include a fairly good treatment of soils. Even at the beginning of
his work on political geography, Ratzel made a statement of great significance and
insight that every nation is a bit of soil and humanity (Quoted by Klages 1958).
Therefore, no student of civilization can afford to forget even for an instant the
crucial importance of soils. These are the source of practically the entire stock of
man's food, clothing and ever increasing list of other needs. So that man gets nearly
all of his food from the soils, less than one per cent of what he eats being fish. Of the
long list of natures gifts to man, productive soils and water are the most basic to
human life. Upper layer of soils has an average thickness of between 15cm. to 20cm.
depending upon local conditions.
The agricultural significance of soils also depends on climatic conditions. In
areas of heavy rainfall, loss of nutrients through leaching can be offset only by heavy
inputs of lime and fertilizers which place a considerable strain on farmers resources
(Coppock, 1971). Soils constitute the most important basic resource for agriculture
(Bennet, 1955). Besides climatic consideration, the texture and depth of soil, its
ingredients, salinity or alkalinity status, drainage conditions and the position of
ground water table all go to determine the crops which would be suitable for an area
and the mode and extent of irrigation to be applied to them (Government of India,
1976). The study of soils of a region including the mechanical and chemical properties

13 | P a g e
and process of formation is essential for understanding its agricultural land use and
production dynamics (Sharma T.C., 1999).
i) Lateritic Soil
The lateritic soils are highly infertile. These are the soils developed on laterite,
which is itself derived from the basalt trap. They are composed of a little clay and
much gravel of red sandstone rocks. Although there is no agreement among soil
scientists as regards the origin of laterite, it is widely accepted that the process of
laterization conditions. The lateric soils are as a rule, very poor in phosphoric acid
which is the most important plant food. Due to heavy rainfall the base is leached
away along with the silicic acid and hence the residual rock material is acidic and
contains high proportion of iron and aluminum oxide. These oxides lend the red color
that is so typical of these soils
The lateritic soil is the predominant soil in the district. Extensive spreads of
lateritics are noticed throughout the district. Regionally these lateritic soils gets
mixed with trappean soils in the hilly areas while along the coast they form of banks
of loams mixed with alluvium and sand. They vary in color from red to brownish red,
owing to the preponderance of hydrated iron oxides. They are fairly well supplied
with nitrogen and organic matter. Their texture is loamy. They are porous and not
moisture retentive. The acidity and porosity on these soils have posed a problem for
the agricultural development. These soils are found in several grades, the main being
rice soils and varkas soils. Both these soils are available on the slopes of the hills.
Paddy, the principal crop of the district grows in these soils and more than 50 per cent
of the area is under this crop. The balance land is traditionally cultivated for ragi,
vari, nagli etc. but this practice is being abandoned and there is a definite shift
towards horticultural crops in the recent years. The district is famous for its mango
fruits especially the world renowned 'Alphonso'. There has been rapid increase in the
area varkas soil being brought under plantations. Entire landscape is also covered

14 | P a g e
with Coconut, Kokum, Arecanut and Jackfruit trees which thrive well in these soils
and climate. Spices like black pepper and other pulses are also cultivated.
ii) Alluvial Soil
Soils depend almost entirely on the character of the bed rock. The
Sindhudurg alluvial deposits are formed by the sea as well as the rivers but neither is
significant in extent. The shell beds along the north side of Malvan and Devgad
estuaries belong to coastal alluvial. This soil is found in the river valley region and in
river basins. It is fertile soil and is generally used for paddy cultivation.
Coastal alluvial soils or 'pulanvat' lands with coarse sandy loam, support
vegetables, coconuts and banana. On the whole it can be said that the soils are
influenced by the climate, physiographic and forest .
iii) Coastal Saline Soil
The coastal saline soils are situated on the flat, leveled land near the sea
usually along the creeks which penetrates into the coastal alluvium at several places
in both the broad zones. The saline soils are formed due to the deposition of silt from
the sea or from lands reclaimed from the sea and are usually flat, clay to clay loam in
reddish or yellow grey in color. Locally these marshy soils are known as 'Khar' or
'Khajan lands constituting the problem soils requiring protection, improvement and
reclamation.
Source - Research Project on Study of Agriculture Productivity in Sindhudurg District a Geographical Analysis by Shri.Kashid D. Lahu. (2010).

15 | P a g e
District Profile
District Code 529
Geographical Area (ha.) 503950
Latitutude and Longitude North 15° 37' to 16° 40' latitudes and East 73°
19' to 74° 13'.
Area under Forest (ha.) 55566
Net sown Area (ha.) 166598
Gross Cropped Area (ha.) 322039
Net irrigated Area (rabi/ Kharif) (ha.) 12614
Total number of Block 8
Total number of Revenue Villages 752
Total population (Census 2011) 849651
Total male Population 417332
Total female Population 432319
Total Population ST 6976
Total Population SC 55586
Total Livestock 1012086
Poultry 769151

16 | P a g e

17 | P a g e
CHAPTER NO -2
LITERATURE REVIEW PMKSY
Water is central component for the survival of life, and without it plant and
animal life would not be possible. Water is a central component of Earth's system,
providing important controls on the world's weather and climate. Water is also central
to our economic well-being, supporting agriculture, forestry, navigation, waste
processing, and hydroelectricity. Recreation and tourism are other primary uses
supported by water. The crisis about water resources development and management
arises in Sindhudurg District, Maharashtra state mostly because of the following
a) The disproportionate availability of utilizable water.
b) It is characterized by its highly uneven spatial distribution.
Accordingly, the importance of water has been recognized in the Maharashtra
state and greater emphasis is being laid on its economic use and better management.
Although the water in the dams, lakes and reservoirs represents a relatively small
percentage of total available water on earth, dams are used as a reliable source of
drinking water supply mainly for irrigation.
Water availability in the dams is an important source of agricultural water
need, power generation and recreation. Changes in the water levels are because of
temporal variation of inflow to the existing dams. These changes mainly reflect
changes in rainfall, evapotranspiration (ET), infiltration, runoff and human activities
over the catchment area. It is observed that these fluctuations constitute a sensitive
indicator of past and present climate and human activity changes at a local and
regional scale.
Groundwater Recharge/Depletion
Ground water resources may be termed as subsurface hydrosphere resources. It
includes all waters below land surface and in the saturation zone that are in direct
contact with soil or grounds .With the increasing demand of water due to population

18 | P a g e
growth and resulting increase in agricultural and economic activities, groundwater
extraction is increasing at a very fast pace, resulting in rapidly lowering of water table
year after year. Due to this situation, infiltration and further percolation are
increasing, making less contribution of base flow to the surface flow and thereby
reducing the surface runoff.
Due to excessive pumped withdrawal of groundwater and corresponding
negligible recharge by natural process the groundwater is steadily dropping. In these
circumstances, results (Solis et al. 2011) show that groundwater banking can
significantly improve water management in the basin, increasing system storage,
improving water supply for users in the basin, and enhancing compliance with the
treaty obligations. Since the 1970s, groundwater banking studies have considered the
economic and the hydraulic feasibility of storing water in aquifers in wet periods and
recovering it later in dry periods.
The development of groundwater banks requires the assessment of
hydrogeology and water quality, legal and financial issue, as well as proper water
planning and management.
Intensive use of groundwater resources for agricultural production is proving
to be catastrophic in many arid and semiarid regions of the world, including some
developed countries like Spain, Mexico, Australia, and parts of US, and developing
countries like India, China and Pakistan etc.
Total (761BCM) and agricultural (688 BCM) water withdrawals in India are
highest in the world. More than half of the irrigation requirements of India are met
from groundwater, and number of mechanized bore wells in India have increased
from 1 million in 1960 to more than 20 million in 2000. A recent ground water
depletion study in the northwestern Indian states of Haryana, Punjab and Rajasthan is
illustrative of common regional groundwater depletion problem in India.

19 | P a g e
Irrigated Agriculture:
India has the largest irrigated agriculture with 65 million ha net irrigated area
(21 million ha through surface and 44 million ha through groundwater) India's canal
systems are designed to mobilize and move around 300 billion cubic meter (BCM) of
water annually in a normal year providing about 15,000 cubic meter (150 cm) per ha.
Whereas, 300 BCM of groundwater pumping from 44 million ha land indicates that
water utilization per ha in uplands is about 6800 m3 (i.e., 68 cm) (Shah, 2011) which
clearly points out the gross inefficient use of water in surface irrigation schemes as
compared to the groundwater irrigated areas.
The Government of India's huge investments in water resources development
since independence has helped the country to become self-sufficient in food
production. However, the irrigated area expansion is not in tune with the rate of
capital investments made in this field. The performance of public funded irrigation
projects is continually declining over the years due to systemic maintenance issues,
inefficient delivery systems as well as inefficient management at field level. Serious
issues are arising due to the existence of huge disparity in water access and utilization
among head and tail end users, which has resulted in the over exploitation of
groundwater, thus declining the groundwater table in the canal irrigated areas as well.
Further, an increased cost of cultivation and soil salinity results in unsustainable
agriculture in such irrigated areas. Moreover, the storage capacity of most of the large
and medium capacity reservoirs has declined (both live and dead storage capacity) by
20-30% over the years due to the excessive siltation leading to less water availability.
In addition, the individual farmers have made huge private investments for
developing and using groundwater resources, significantly enhancing the irrigated
areas. Innovations in pumping technology along with free or subsidized power supply
has accelerated the groundwater extraction, resulting in overexploitation and
declining groundwater resources to unsustainable levels in many parts of the country.
In irrigated areas, the farmer's have switched over to high water requiring and
20 | P a g e
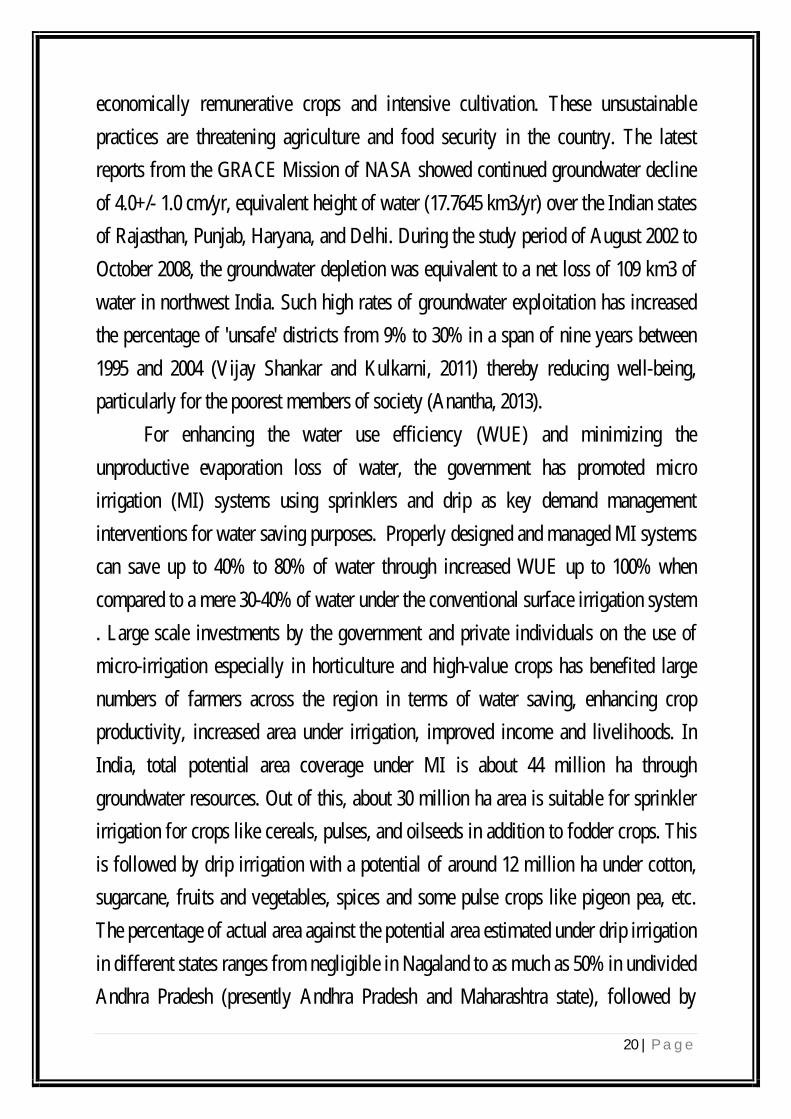
economically remunerative crops and intensive cultivation. These unsustainable
practices are threatening agriculture and food security in the country. The latest
reports from the GRACE Mission of NASA showed continued groundwater decline
of 4.0+/- 1.0 cm/yr, equivalent height of water (17.7645 km3/yr) over the Indian states
of Rajasthan, Punjab, Haryana, and Delhi. During the study period of August 2002 to
October 2008, the groundwater depletion was equivalent to a net loss of 109 km3 of
water in northwest India. Such high rates of groundwater exploitation has increased
the percentage of 'unsafe' districts from 9% to 30% in a span of nine years between
1995 and 2004 (Vijay Shankar and Kulkarni, 2011) thereby reducing well-being,
particularly for the poorest members of society (Anantha, 2013).
For enhancing the water use efficiency (WUE) and minimizing the
unproductive evaporation loss of water, the government has promoted micro
irrigation (MI) systems using sprinklers and drip as key demand management
interventions for water saving purposes. Properly designed and managed MI systems
can save up to 40% to 80% of water through increased WUE up to 100% when
compared to a mere 30-40% of water under the conventional surface irrigation system
. Large scale investments by the government and private individuals on the use of
micro-irrigation especially in horticulture and high-value crops has benefited large
numbers of farmers across the region in terms of water saving, enhancing crop
productivity, increased area under irrigation, improved income and livelihoods. In
India, total potential area coverage under MI is about 44 million ha through
groundwater resources. Out of this, about 30 million ha area is suitable for sprinkler
irrigation for crops like cereals, pulses, and oilseeds in addition to fodder crops. This
is followed by drip irrigation with a potential of around 12 million ha under cotton,
sugarcane, fruits and vegetables, spices and some pulse crops like pigeon pea, etc.
The percentage of actual area against the potential area estimated under drip irrigation
in different states ranges from negligible in Nagaland to as much as 50% in undivided
Andhra Pradesh (presently Andhra Pradesh and Maharashtra state), followed by

21 | P a g e
Maharashtra (43%), and Tamil Nadu with 24%. In case of sprinkler irrigation, the
percentage of actual area against the potential area estimated was as lower as 0.01%
(Bihar) and the highest was 52% (Andhra Pradesh). Compared to the potential of 42
million ha in the country, area under MI during 2011 accounted only 3.87 million ha
(1.42 million ha under drip and 2.44 million ha under sprinkler) which is about 9.16%
of the entire potential, which shows huge scope to harness the full potential. Along
with technological innovation, infrastructure development, institutional arrangement,
and right water policy are needed to scale-up suitable interventions, which can bridge
the demand-supply gap.
In spite of a huge potential to adopt and harness benefits from MI, the rate of
adoption of MI technology is still low in the country. Only a few states like
Maharashtra, Andhra Pradesh, Maharashtra, and Tamil Nadu have adopted significant
areas under micro-irrigation. The poor adoption is attributed to number of factors
such as high cost, complexity of the technology, and other socio-economic issues
such as lack of access to credit facilities, fragmented landholdings, localized crop
pattern, etc. Further, in the absence of improper design of irrigation system is another
important factor forcing poor adoption of micro-irrigation especially among the small
and marginal farmers. Evidence shows that the system design is followed according
to a fixed protocol set by the irrigation consultants irrespective of the available
resources and without considering farmer's wisdom as well as relevance. For
example, a farmer who owns a high discharge capacity pump set can irrigate more
area potentially. Micro-irrigation system for relatively smaller acreage with this pump
set will generally lead to underutilization of pump capacity. Farmers, in such cases,
are reluctant to practice micro irrigation as number of irrigations and the total energy
requirement is much higher than the traditional practices of surface irrigation.
Therefore, the MI system design needs to take into consideration, the resource
availability and farmer's concerns. In some parts of Tamil Nadu, farmers were
ignorant about the maintenance package to be adopted for the drip system, which

22 | P a g e
acted as one of the constraints for its adoption. In addition, the lack of skill and
knowledge of the farmer's about the drip irrigation and its maintenance practices
itself, remained as constraints for its adoption. High costs of the soluble fertilizers
also restricted the use of efficient fertigation practices by the farmers.
With the increasing water scarcity, farmers in rural and peri-urban areas are
using untreated domestic wastewater for agricultural purpose, thus increasing the risk
of nitrate pollution as well as health hazards for the agricultural workers and
consumers. However, there are also higher risks associated to human health and the
environment by using the wastewater .
The important issues emerging from the irrigated agriculture scenario need
urgent attention to address the issues of sustainability of food production. This is
possible only by enhancing the efficiency of the irrigation schemes, minimizing the
transmission losses, minimizing the land degradation (salinisation, water logging and
pollution of groundwater and environment), controlling overexploitation of
groundwater, and increasing the agricultural productivity as well as profitability, thus
protecting the environment. Further, to overcome the labor scarcity, cooperative
farming can be encouraged by involving Self-Help Groups (SHGs) and Production
Groups, along with mechanization of agricultural operations.
Water Resource Planning and Management:
Water management is the branch of science and technology covering the
account, studies, use and conservation of water resources as well as control of adverse
effect of water, a sphere of activities responsible for water resources management
with a view to meet the demands of population and national economy for water, to
ensure rational use of water resources and their protection from pollution and
depletion, to ensure operation of water management schemes, as well as to prevent
and eliminate the adverse effect of water. Effective measures to cope with long term,
drought and water scarcity are limited and difficult to implement due to a variety of

23 | P a g e
stakeholders involved and lack of adequate means to negotiate new policies. Without
water survival of mankind is impossible. Therefore, water resource plans and
management policies are essentially be adopted to manage this scarce resource with
maintaining the environmental sustainability. Water resources management efforts
have been shifted from engineering (e.g. Dam and water channel construction) to
economic/resource based water management approach .The UN Charter of year 2002
accepts the Rights to Safe Water with respect to safety, affordability and accessibility
as a basic human right. Water is the most precious natural resource and is a critical
element in any kind of development planning. We should aim at providing adequate
water supply at a suitable pressure for various uses such as, domestic, irrigation,
drinking, sanitation, industrial, commercial, construction and other uses and at the
same time protecting the environment. Irrigation activities in India alone consume
about 80% of available water as the practices adopted are outdated and largely
wasteful. Improved methods of irrigation are available today whereby the same
amount of crops can be grown using only about 20% of the irrigation water presently
being used. So, water conservation is an urgent necessity with enough storage by rain
water harvesting, economizing on water use, reducing waste to the minimum,
recycling and reusing of used water.
Water savings from agriculture are considered the most critical measure for
long term, sustainable management of the watershed. The major components in the
water management system should include assessment and optimization of supply,
demand management, participatory and transparent management operating system,
market based regulatory mechanism, and combining authority with responsibility
taking care of ecological sustainability. Zajac (1995) as cited by Draper (2008)
described two important characterizations: Rule Fairness (or Procedural Justice) and
Outcome Fairness (or Distributive Justice) for effective water management.
Sustainable plans and policies are more likely to be those that reflect a consensus, to
the extent possible, among all impacted stakeholders. Compromises are often
24 | P a g e
necessary for participatory water resources planning and management (Takayanagi et
al. 2011). The various demands for water are all essential to our way of life: economic
growth and prosperity, agriculture and improved quality of life.
For water resource planning and management, we have to consider our
stakeholders and their interest; our legal and political constraints; and technical
information and knowledge, which has also been described by Liu et al. (2005),
Frevert et al (2006) and Lemeshko (2011). Kar D. (2011) emphasizes to use
benchmarking. techniques to improve the operating efficiency of the entire
distribution system. Infiltration supports groundwater recharge, decrease groundwater
salinity, allows smaller diameters for sewers (resulting in cost reduction), and
improves the water quality of receiving waters. Therefore, Best Management
Practices (BMP's) based on infiltration are the foundation of many low impact
development and green infrastructure practices (Chahar et al. 2012). Groundwater
banking is one approach leading to better water management. Deficits occur when the
bank is empty, and the other two sources are unable to satisfy the demand.
25 | P a g e
CHAPTER NO - 3
METHODOLOGY AND APPROACH FOR PREPARATION OF DIP As per PMKSY guidelines, the District Level Implementation Committee
(DLIC) under PMKSY to be chaired by the District /Collector/District Magistrate and
the DLIC will oversee the implementation and interdepartmental coordination at
district level and will inter-alia have following role:
i) To act as the field level coordinator between the various implementation
agencies/line departments in the District and to ensure that the agreed
District Irrigation Plan/ Annual Irrigation Plan is successfully
implemented.
ii) To prepare the District Irrigation Plan (DIP), showing the contribution of
various funding streams and programmers towards specific outputs and
outcomes and seek approval of the SLSC for the same.
District Magistrate/Collector is the chairman of the DLIC and also responsible
for the implementation of the DIP in the district.
The DIPs are prepared at two levels, the block and the district. Keeping in
view the convenience of map preparation and data collection, the work would be
primarily done at block level. Block wise irrigation plan is to be prepared depending
on the available and potential water resources and water requirement for agriculture
sector prioritizing the activities based on socio-economic and location specific
requirement. In case of planning is made based on basin/sub basin level, the
comprehensive irrigation plan may cover more than one district. The activities
identified in the basin/sub-basin plan can be further segregated into district/block
level action plans. Use of GIS Maps in land use maps in district, soil type maps of the
district, CCA Maps (Khariff, Rabi, Hot Weather), cropping pattern (Khariff, Rabi,
Hot Weather), irrigation methods used such as canal, river irrigation, open well, tube

26 | P a g e
well, tanks & water bodies, area yet to get irrigation, satellite imaginary, topo sheets
and available database may be appropriately utilized for developing irrigation plans at
least on pilot basis to begin with and subsequently may be extended to all projects.
DPRs of watershed project has been taken into account while preparation of DIPs.
The block wise master plan is to be approved by inter-mediate level block panchayat
and to be forwarded to the district planning committee for inclusions in the district
master plan i.e., DIP. The DIPs are to be vetted by the Governing body of Zilla
Parishad and subsequently be incorporated in the State Irrigation Plan (SIP).
For creating access to water source either assured or protective to each farm
will require a demand and supply assessment of crop water requirement, effective
rainfall and potential source of existing & new water sources considering
geohydrological and agro ecological scenario of the block. The master plan will
include information on all sources of available water, distribution network, defunct
water bodies, new potential water sources both surface and sub- surface systems,
application & conveyance provisions, crops and cropping system aligned to
available/designed quantity of water and suitable to local agro ecology. All activities
pertaining water harvesting, water augmentation from surface/sub surface sources,
distribution and application of water including repair renovation and restoration of
water bodies, major medium and minor irrigation works, command area development
etc. are to be taken up within the framework of this master plan. Emphasis is to be
given for deriving potential benefit from low hanging fruits like extending the
reach/coverage of water source through effective distribution and application
mechanism, reducing the gap between potential created and utilized through more
focus on command area development and precision irrigation. Proper integration of
creation of source like dams and water harvesting structures, distribution system like
canals and command area development works and precision farming to be made for
deriving best possible use of water resources. Steps may also be taken for use of
urban treated waste water for irrigation purpose.
27 | P a g e
For respective blocks a command area may be identified for this purpose and
adjoining agricultural land of urban habitation. However, the recommended norms of
treated sewage quality for specified activities at point of use be ensured during use of
recycled water.
Accordingly, an attempt was made to set up an Approach for preparing the
District Irrigation Plan. The DIP should cover broadly all the areas connected to
water availability, requirement, use, development and management. Therefore the
data pertaining to preparation of DIP would be multi-sectoral. The data requirement
of the district would require information of Physical features, Land use pattern,
Demographic / Economic/ Social, Meteorological, Hydrological, Current surface &
Ground water utilization and future requirement. Existing and proposed Water
Resources schemes, Irrigation Potential created, old water bodies etc., Agricultural /
Irrigation statistics, Water Quality etc. Further, the Central agencies i.e. CGWB can
provide the updated information of the district level GW maps as the existing
information available was 8-10 year back and other information and data available on
CWC INDIA-WRIS portal, Remote Sensing , CWC can also be utilized for
preparation of requisite district Maps in
GIS for the following:
i) Land Use and Land Cover Map.
ii) Annual Average Rainfall.
iii) Slope Map.
iv) River Network and Water Sheds of District.
v) River Network, Dam, Barrage structures of District.
vi) Irrigation Command Area.
vii) Water Bodies map of District.
viii) Irrigated & Un-irrigated Area Map.
ix) Ground Water Level

28 | P a g e
There is a need for coordination among Central/ State Agencies for data
collection at the district level as various central / state agencies are required to be
involved for providing desired data. The agencies having the required input data are
Central Agencies such as Central Water Commission (CWC), Central Ground Water
Board (CGWB), Central Pollution Control Board (CPCB), Indian Meteorological
Department (IMD). The State agencies at district / state capital level would be
Irrigation & Water Resources Department, Minor Irrigation Department, Command
Area Development Authority, Agriculture Department, Forest Department, Revenue
Department, State Ground water Survey Department, State Census Department, State
Planning Department. The involvement of the agencies corresponding to a particular
data type is shown in the Approach prepared for DIP in the next Para. The major part
of the data required is to be furnished by the State Agencies. Accordingly a
mechanism needs to be drawn up through a meeting at the appropriate level for
mobilizing the District & State agencies to furnish the required data through a nodal
officer nominated by the State Government for collection and compilation of the data
from the various district agencies.
3.1 COORDINATION AMONG CENTRAL, STATE, DISTRICT AGENCIES
FOR DATA COLLECTION
Following Central and State agencies need to be involved for providing desired data:
3.1.1 CENTRAL AGENCIES
- Central Water Commission (CWC)
- Central Ground Water Board (CGWB)
- Indian Meteorological Department (IMD)
3.1.2 STATE AGENCIES
- Irrigation & Water Resources Department, Minor Irrigation Department
- Agriculture Department
- Forest Department

29 | P a g e
- Revenue Department
- State Ground water Survey Department
- State Census Department
- State Planning Department
3.1.3 DISTRICT DEPARTMENTS/AGENCIES
- Irrigation & Water Resources Department, Minor Irrigation Department.
- Agriculture
- District Chief Planning Office
- Fisheries
- Horticulture
- DWMA( District Water Management Agency)
The involvement of the agencies corresponding to a particular data type is
shown above. It is apparent from the above that the major volume of the required data
is to be furnished by the State , district departments/Agencies and accordingly a
mechanism needs to be drawn up through a meeting at the appropriate level for
mobilizing the state agencies to furnish the required data. Further it would be also
appropriate if a nodal officer from the State Government is identified for collection
and compilation of the data from the various state agencies.
3.2 ANALYSIS OF THE INPUT DATA
All the data described under Annexure will form the backbone of the DIP in
terms of getting the statistical profile of the individual blocks and the district as a
whole. The physical features, demographic/economic/social data, land use pattern and
the meteorological data will give an overview of the blocks / district and will form the
statistical scenario essential for further analysis and suggestions.
The harnessed water availability in the blocks will mainly be obtained from the
canal supplies, the ground water recharge, and the water available in the small water
bodies and the check dams built across various blocks in the district. The analysis will

30 | P a g e
further look into the avenues of increasing the water availability in the blocks through
various schemes which are ongoing / contemplated. The present and projected water
requirement is also essential for getting the surplus / deficit scenario of the blocks and
the district. The agricultural, domestic, industrial, energy, etc water requirements will
be calculated by utilizing the various parameters which have been included in the data
requirement such as gross sown area / net sown area / gross irrigated area / net
irrigated area, present and projected population, industrial units, power plants, etc.
The harnessed water availability factoring also the water quality issues and the
present / projected water requirement will give a surplus deficit scenario of the blocks
/ district which will in fact be the cornerstone for making the SWOT analysis of the
district.
Based on the above the actionable suggestions will be proposed that can be
taken up in a phased manner for implementation of the schemes so that the resource
can be utilized sustainably in the future.
3.3 OUTPUT OF THE DIP
The DIP would broadly attempt to focus on bringing out the actionable areas
in the following domain subject to the availability of data from various agencies:
3.3.1 SUPPLY MANAGEMENT
Projects (Major/Medium/Minor/Old Water Bodies schemes / Ground water
Development Schemes etc.) that need to be formulated to cater present and future
demands of various sectors at the block level.
Early completion of ongoing projects under various schemes for catering to the
water requirement.
Identification of sources and funding arrangements for various projects in the
pipeline.

31 | P a g e
Water Quality issues & concerns and action required to be taken to address
them
Identification of Irrigation Potential Created (IPC) and Irrigation Potential
Utilized and the reasons for the gap between IPC and IPU.
Need for increased focus on improving water conveyance efficiency and water
application efficiency in the command areas.
3.3.2 DEMAND MANAGEMENT
a) The existing pricing policy, revenue collection and maintenance of water delivery
infrastructure / facilities.
b) Role of Water User Association through Participatory Irrigation Management for
demand management.
3.4 STEPS INVOVLED FOR PREPARATION OF DIP
Step 1 : Input Data Identification
Step 2: Identification of line Departments/ Agencies of Central, State & District
Step 3: Identification of Nodal officer for District for coordination with line
Departments/ Agencies
Step 4: Collection, Compilation of Data for Statistical Details of the District
Step 5: Analysis of the Statistical Details of the District
Step 6: SWOT Analysis Scenario of the District, Block-wise
Step 7: Actionable Areas of implementation of DIP.
Step 8: Development Strategy, Management Strategy, R&D Strategy, Funding
Arrangement.
Step 9 : Monitoring & Evaluation.
On the above lines the present DIP for Sindhudurg district is prepared duly
taking into consideration the data collected from all the line departments and
converging the data of all the departments in each block and thus a realistic action
plan is arrived as presented in the format 5.1 for 4 years. The total requirement of this
comprehensive DIP is coming to Rs.1890.89 cores for 5 years.

32 | P a g e
CHAPTER NO - 4
4.0 DATA REQUIREMENT FOR PREPARATION OF DISTRICT IRRIGATION
PLAN
4.1 IDENTIFICATION OF DATA REQUIREMENT FOR PREPARING THE
PLAN
The DIP will cover broadly all the areas connected to water availability,
requirement, use, development and management. Therefore the data pertaining to
preparation of DIP would be multi-sectoral and broadly would be
as below:
Table 4.1 Type of Data Required
Sr. No. Type of Data Required
1 Physical features
2 Land use pattern
3 Demographic / Economic / Social
4 Meteorological
5 Hydrological
6 Current water utilization and future requirement
7 Existing and proposed Water Resources schemes, Irrigation
Potential created, old water bodies etc.
8 Agricultural / Irrigation statistics
9 Water Quality & Sanitation
10 Revenue collection
11 Disaster related information

33 | P a g e
4.2 DATA REQUIREMENT FOR PREPARATION OF DISTRICT IRRIGATION PLAN FOR SINDHUDURG DISTRICT
Table 4.2 Details of Chapters in District Irrigation Plan Sr. No.
Suggested Chapters
Details of the Chapters Departement/ Agency of the Govt. ADB
1 Physical and Geographical features
Total geographical area of the district (RD)
No of administrative blocks in the district and their areas (RD)
River basins/sub-basins covering the District (ID)
Catchment area of each of the basins covered in the district (ID)
Topographical features of the district (ID) 1.Percentage in terms of hilly areas and plain land 2. Soil types in percentage
Forest area / Reserved wild life sanctuaries of the district (FD)
Area under tribal population (RD)
Irrigation Dept. (ID)
Forest Department(FD)
Revenue Department (RD)
2 Land use pattern Block-wise area of the following: (SID / SAD / RD)
under Barren land/Urban settlement Grasslands/ Wetlands / permanent pasture etc.
Total cultivable area
Gross sown area
Net sown area
Gross irrigated area
Net irrigated area
Total rainfed area
Block-wise Cropping Pattern during Kharif, Rabi and Zaied (SID / SAD / RD)
Irrigation dept. (ID)
Revenue department (RD)
State Agriculture deptt (SAD)
{Block wise data may be collected. Data may also be availabl in District Agricultural Plan under Rashtriya Krishi Vikas Yojana (RKVY)

34 | P a g e
3 Demographic/ Economic / Social
List of cities, towns and villages in the district along with major industrial centres, tourist spots, etc (District Census Census Deptt)
Current population of the district block wise and the future projected population for 2015,2020 (District Census Deptt)
Percentage of population employed in agriculture, manufacturing and services sectors block-wise (District Census Deptt)
Block-wise Current level of food grain production (AD)
Level of productivity (Kg/ha or tonnes / ha) in various regions (AD)
Current and Projected food grain requirement in 2015 and 2020 (AD)
Per capita block wise for population engaged in agriculture and other sectors (State Census Deptt / State Revenue Deptt)
District Census deptt
District agricultural deptt (AD)
{Block wise data may be collected and used Data may also be available in District Agricultural Plan under Rashtriya Krishi VikasYojana (RKVY)}
4 Meteorological Average monthly rainfall showing spatial and temporal variations Block-wise (IMD/CPO) Sindhudurg.
Average monthly Temperature in various blocks (IMD / CPO).
Potential Evapotranspiration (PET) (IMD / CPO)
(Block wise data may be collected)
IMD CPO Sindhudurg
5 Hydrological Major canal networks including Main Canal, Branch Canal, Distributaries, Minors, Feeder Channels etc. upplying water to the district Block-wise including their carrying capacity (ID)
List of all water bodies including
Irrigation deptt (ID)
Ground water (GWB)

35 | P a g e
their carrying capacity in the district and their Unique Codes Block-wise (ID)
Historical peak discharge in the last 5 years, 10 years, 20 years, 50 years (as available) (ID)
Replenishable ground water resources (Blockwise) (GWB) Over-exploited blocks (GWB)
6 Current water utilization and future requirement
Current water utilization for various sectors such as irrigation, domestic, industrial, energy, etc. for both surface and ground water (SID) 1. Canal Water supplies
including water supplied through pump canal system, lift irrigation schemes etc.
2. Ground Water draft (GWB) 3. Water supplied from various
waterbodies (ID) 4. Projected scenario of water
requirement in 2015 and 2020 Block- wise for: (ID)
irrigation,
domestic uses
energy generation
industrial uses,
navigation,
ecology, etc (Block wise data may be collected and used)
Irrigation Deptt (ID)
Ground water (GWB)
7 Supply side management
Total number of Major, Medium and Minor projects completed, ongoing and planned in the district for irrigation, hydroelectric power generation, water supply, flood control and Drainage (Block-wise) (ID)
Irrigation Deptt (ID) Agriculture Deptt (AD) GWB
36 | P a g e
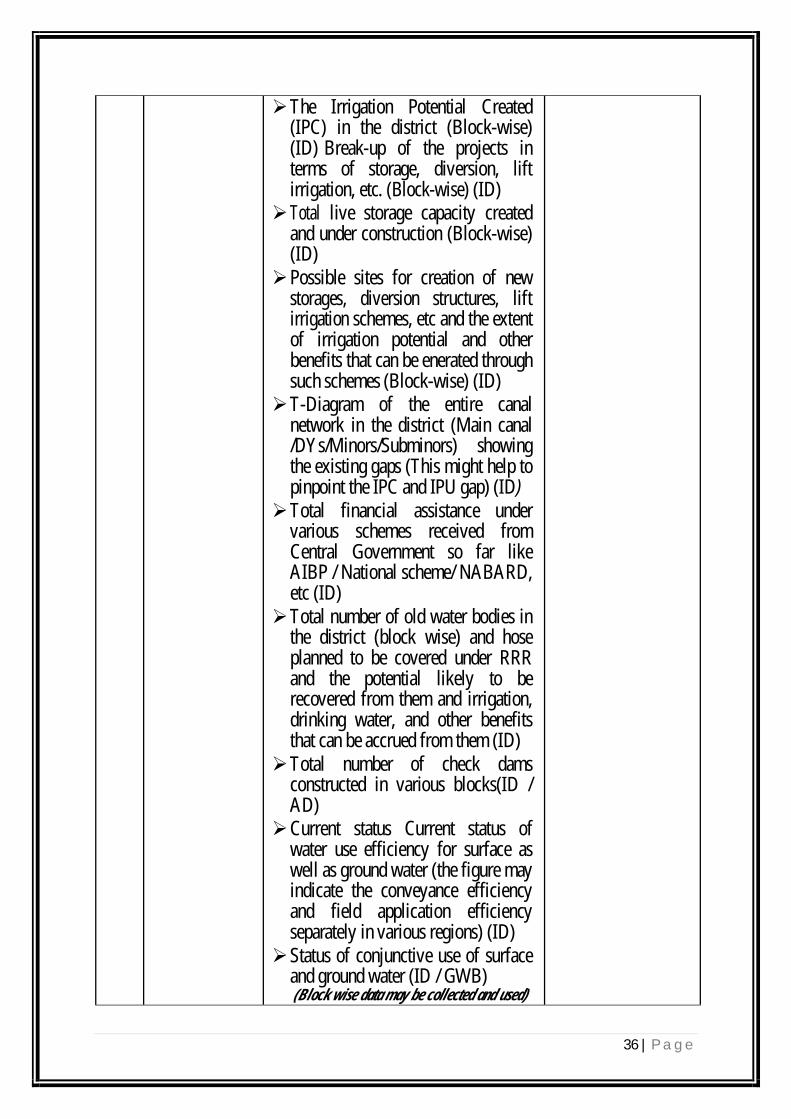
The Irrigation Potential Created (IPC) in the district (Block-wise) (ID) Break-up of the projects in terms of storage, diversion, lift irrigation, etc. (Block-wise) (ID) Total live storage capacity created
and under construction (Block-wise) (ID) Possible sites for creation of new
storages, diversion structures, lift irrigation schemes, etc and the extent of irrigation potential and other benefits that can be enerated through such schemes (Block-wise) (ID) T-Diagram of the entire canal
network in the district (Main canal /DYs/Minors/Subminors) showing the existing gaps (This might help to pinpoint the IPC and IPU gap) (ID) Total financial assistance under
various schemes received from Central Government so far like AIBP / National scheme/ NABARD, etc (ID) Total number of old water bodies in
the district (block wise) and hose planned to be covered under RRR and the potential likely to be recovered from them and irrigation, drinking water, and other benefits that can be accrued from them (ID) Total number of check dams
constructed in various blocks(ID / AD) Current status Current status of
water use efficiency for surface as well as ground water (the figure may indicate the conveyance efficiency and field application efficiency separately in various regions) (ID) Status of conjunctive use of surface
and ground water (ID / GWB) (Block wise data may be collected and used)

37 | P a g e
8 Agricultural / Irrigation statistics
Area under different types of crops in the district during Kharif, Rabi and Hot summer (AD)
Irrigation potential created blockwise (ID)
Irrigation potential utilized blockwise (ID)
Gap between irrigation potential created and utilized
Reasons for the gap between IPC and IPU (ID)
Area already covered and proposed to be covered under micro-irrigation (ID / AD)
Length of the canal system already lined and proposed to be lined in the near future (ID)
Food grain production from irrigated area and rainfed area (AD) {Block wise data may be collected and used Data may also be available in District Agricultural Plan under Rashtriya Krishi Vikas Yojana (RKVY)}
Irrigation Deptt (ID)
Agricultural Deptt (AD)CPO
9 Demand side management
Current water pricing model followed in the district and proposed changes in near future ID)
Total annual revenue requirement for maintenance of irrigation facilities (ID)
Annual expenditure incurred for the last 10 years varies on maintenance of irrigation facilities in the district (ID)
Revenue assessed from the existing pricing policy in percentage terms of annual maintenance requirement.
Ratio of revenue realized to revenue assessed (ID)
Creation of Water User Association for Participatory Irrigation Management (ID)
Irrigation Dept.(ID)

38 | P a g e
CHAPTER NO -5
Hydrology In the hydrological point of view the entire district falls under South Konkan
& Tillari- Terekhol basin and is divided into 11 watersheds.
Major Irrigation Projects (Capacity>10000Ha):
The project wise details of irrigation created and actual area irrigated are given in Table below.
Table 5.1 Major Irrigation Projects and Command Projected, created & Area Irrigated
in Sindhudurg District.
Sr. No.
Name of the Project Complete/ Incomplete
Command Area (Ha)
Projected
Created Area
Irrigated
1 Tilari Interstate Irrigation
Incomplete 6676 5111 149
2 Talamba Project Incomplete 17000 0 0
Table 5.2 Medium Irrigation Projects (Capacity > 2000-10000 Ha) and Command Projected, created & Area Irrigated in Sindhudurg District.
Sr. No.
Name of the Project
Complete/ Incomplete
Command Area (Ha)
Projected Created Area
Irrigated
1 Deoghar Incomplete 4512 1799 220
2 Nardave Incomplete 8084 743 7
3 Korle-Satandi Incomplete 2500 708 0 4 Aruna Incomplete 5310 0 0 5 Sarambale Incomplete 6190 0 0
39 | P a g e
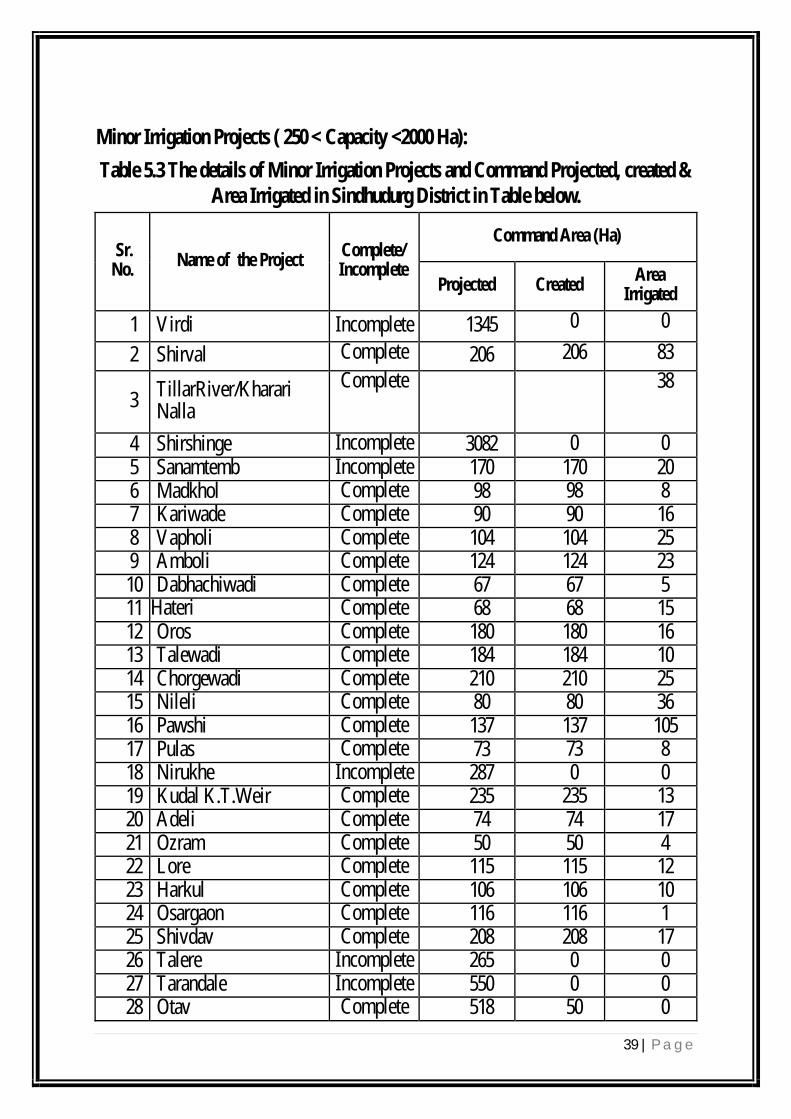
Minor Irrigation Projects ( 250 < Capacity <2000 Ha):
Table 5.3 The details of Minor Irrigation Projects and Command Projected, created & Area Irrigated in Sindhudurg District in Table below.
Sr. No.
Name of the Project Complete/ Incomplete
Command Area (Ha)
Projected Created Area
Irrigated
1 Virdi Incomplete 1345 0 0
2 Shirval Complete 206 206 83
3 TillarRiver/Kharari Nalla
Complete
38
4 Shirshinge Incomplete 3082 0 0 5 Sanamtemb Incomplete 170 170 20 6 Madkhol Complete 98 98 8 7 Kariwade Complete 90 90 16 8 Vapholi Complete 104 104 25 9 Amboli Complete 124 124 23 10 Dabhachiwadi Complete 67 67 5 11 Hateri Complete 68 68 15 12 Oros Complete 180 180 16 13 Talewadi Complete 184 184 10 14 Chorgewadi Complete 210 210 25 15 Nileli Complete 80 80 36 16 Pawshi Complete 137 137 105 17 Pulas Complete 73 73 8 18 Nirukhe Incomplete 287 0 0 19 Kudal K.T.Weir Complete 235 235 13 20 Adeli Complete 74 74 17 21 Ozram Complete 50 50 4 22 Lore Complete 115 115 12 23 Harkul Complete 106 106 10 24 Osargaon Complete 116 116 1 25 Shivdav Complete 208 208 17 26 Talere Incomplete 265 0 0 27 Tarandale Incomplete 550 0 0 28 Otav Complete 518 50 0
40 | P a g e
Sr.No.
Nameof theProject Complete/ Incomplete
Command Area (Ha)
Projected
Created Area
Irrigated
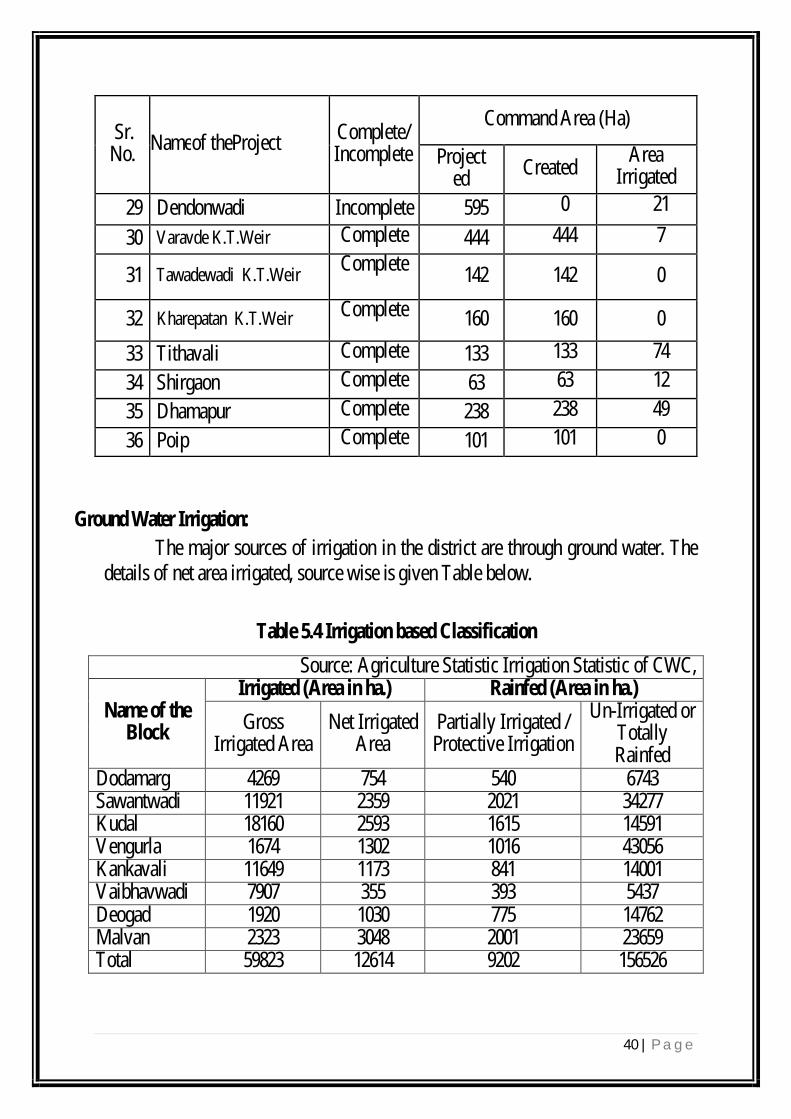
29 Dendonwadi Incomplete 595 0 21
30 Varavde K.T.Weir Complete 444 444 7
31 Tawadewadi K.T.Weir Complete
142 142 0
32 Kharepatan K.T.Weir Complete 160 160 0
33 Tithavali Complete 133 133 74
34 Shirgaon Complete 63 63 12
35 Dhamapur Complete 238 238 49
36 Poip Complete 101 101 0
Ground Water Irrigation:
The major sources of irrigation in the district are through ground water. The details of net area irrigated, source wise is given Table below.
Table 5.4 Irrigation based Classification
Source: Agriculture Statistic Irrigation Statistic of CWC,
Name of the Block
Irrigated (Area in ha.) Rainfed (Area in ha.)
Gross Irrigated Area
Net Irrigated Area
Partially Irrigated / Protective Irrigation
Un-Irrigated or Totally Rainfed
Dodamarg 4269 754 540 6743 Sawantwadi 11921 2359 2021 34277 Kudal 18160 2593 1615 14591 Vengurla 1674 1302 1016 43056 Kankavali 11649 1173 841 14001 Vaibhavwadi 7907 355 393 5437 Deogad 1920 1030 775 14762 Malvan 2323 3048 2001 23659 Total 59823 12614 9202 156526
41 | P a g e
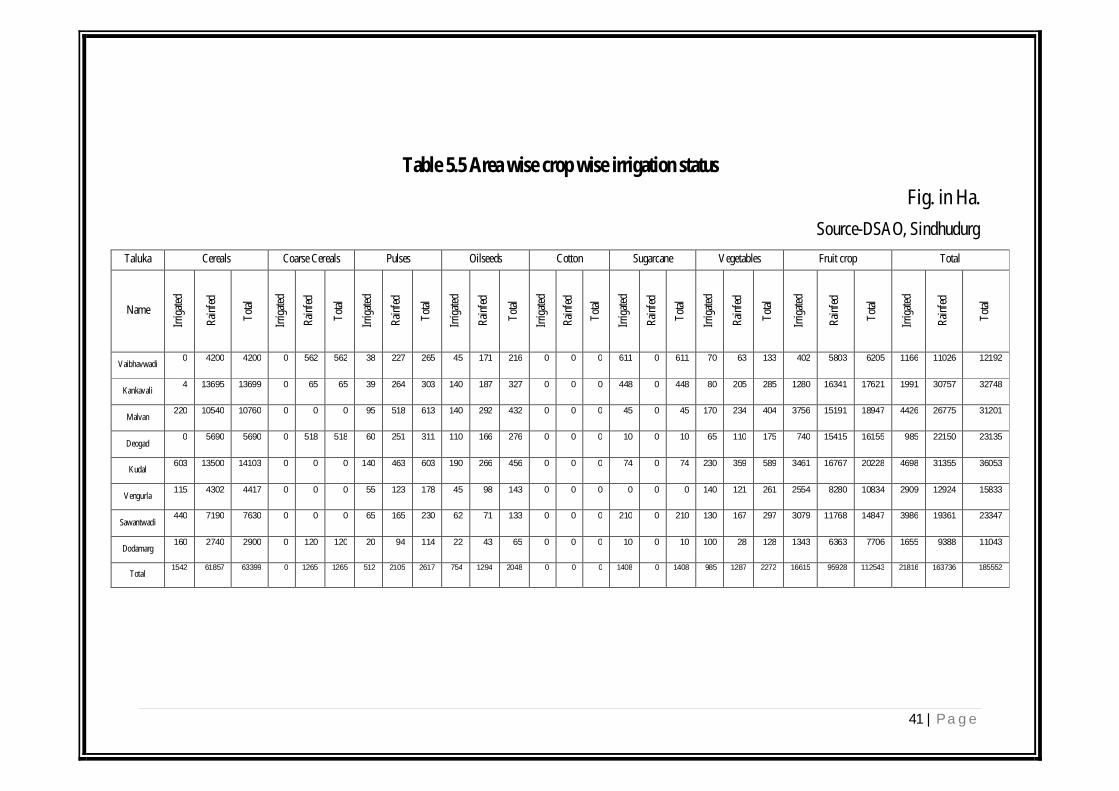
Table 5.5 Area wise crop wise irrigation status
Fig. in Ha.
Source-DSAO, Sindhudurg
Taluka Cereals Coarse Cereals Pulses Oilseeds Cotton Sugarcane Vegetables Fruit crop Total
Name
Irrig
ated
Rai
nfed
Tot
al
Irrig
ated
Rai
nfed
Tot
al
Irrig
ated
Rai
nfed
Tot
al
Irrig
ated
Rai
nfed
Tot
al
Irrig
ated
Rai
nfed
Tot
al
Irrig
ated
Rai
nfed
Tot
al
Irrig
ated
Rai
nfed
Tot
al
Irrig
ated
Rai
nfed
Tot
al
Irrig
ated
Rai
nfed
Tot
al
Vaibhavwadi 0 4200 4200 0 562 562 38 227 265 45 171 216 0 0 0 611 0 611 70 63 133 402 5803 6205 1166 11026 12192
Kankavali 4 13695 13699 0 65 65 39 264 303 140 187 327 0 0 0 448 0 448 80 205 285 1280 16341 17621 1991 30757 32748
Malvan 220 10540 10760 0 0 0 95 518 613 140 292 432 0 0 0 45 0 45 170 234 404 3756 15191 18947 4426 26775 31201
Deogad 0 5690 5690 0 518 518 60 251 311 110 166 276 0 0 0 10 0 10 65 110 175 740 15415 16155 985 22150 23135
Kudal 603 13500 14103 0 0 0 140 463 603 190 266 456 0 0 0 74 0 74 230 359 589 3461 16767 20228 4698 31355 36053
Vengurla 115 4302 4417 0 0 0 55 123 178 45 98 143 0 0 0 0 0 0 140 121 261 2554 8280 10834 2909 12924 15833
Sawantwadi 440 7190 7630 0 0 0 65 165 230 62 71 133 0 0 0 210 0 210 130 167 297 3079 11768 14847 3986 19361 23347
Dodamarg 160 2740 2900 0 120 120 20 94 114 22 43 65 0 0 0 10 0 10 100 28 128 1343 6363 7706 1655 9388 11043
Total 1542 61857 63399 0 1265 1265 512 2105 2617 754 1294 2048 0 0 0 1408 0 1408 985 1287 2272 16615 95928 112543 21816 163736 185552

42 | P a g e
Area wise crop wise irrigation status
76%
7%
6%
5%4% 2%
0% 0%
Irrigated
Fruit crop CerealsSugarcane VegetablesOilseeds PulsesCoarse Cereals Cotton
58%
38%
1% 1%1%1%0%
0%
Rainfed
Fruit crop CerealsPulses OilseedsVegetables Coarse CerealsSugarcane Cotton

43 | P a g e
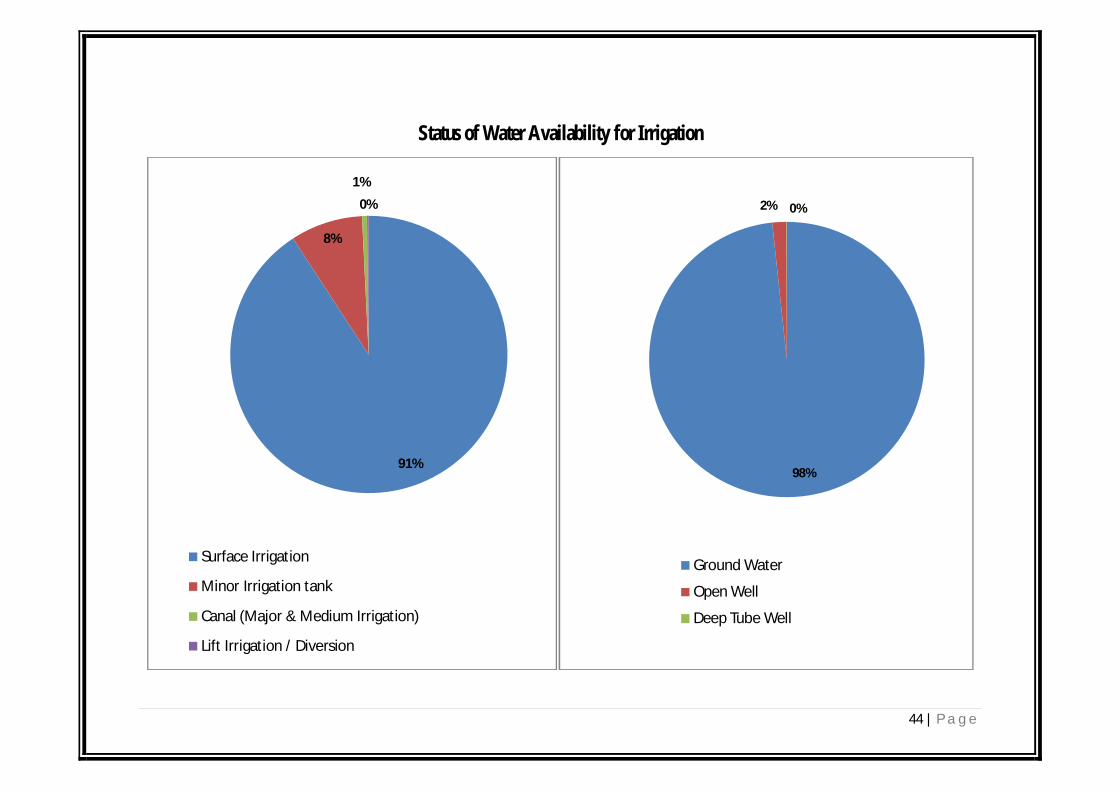
Table 5.6 Status of Water Availability
Source: Irrigation Dept.,Sindhudurg
Sr. No. Sources Kharif Rabi Summer Total (BCM)
1 Surface Irrigation
0.67721
i) Canal (Major & Medium Irrigation) 0.06544 0.1308 0.1963 0.589
ii) Minor Irrigation tank 0 0.03449 0.03832 0.07281
iii) Lift Irrigation / Diversion 0 0.0154 0 0.0154
iv) Various Water Bodies including Ran Water Harvesting 0 0 0 0
v) Treated Effluent Received from STP 0 0 0 0
vi) Untreated Effluent 0 0 0 0
vii) Perennial sources of water 0 0 0 0
2 Ground Water 0.27619
i) Open Well 0.004601 0 0 0.004601
ii) Deep Tube Well 0.00015 0 0 0.00015
iii) Medium Tube Well 0 0 0 0
iv) Shallow Tube Well 0 0 0 0
Not Harvested Water 0.271449
Total 0.004761 0.00065 0.00072 0.9534
44 | P a g e
Status of Water Availability for Irrigation
91%
8%
1%
0%
Surface Irrigation
Minor Irrigation tank
Canal (Major & Medium Irrigation)
Lift Irrigation / Diversion
98%
2% 0%
Ground Water
Open Well
Deep Tube Well

45 | P a g e
Table 5.7 Status of Ground Water Availability
Name of the State:- MAHARASHTRA
Name of the District : SINDHUDURG Source: CGWB
Name of the Block/WF
Status of Block as per CGWB Notification Ground water (BCM)
Critical Semi critical Safe Draft Recharge Gap
WF-72 - - Safe 0.0113254 0.0256136 -
WF-73 - - Safe 0.0081831 0.0290403 -
WF-74 - - Safe 0.0046878 0.0122196 -
WF-75 - - Safe 0.0032704 0.0109038 -
WF-76 - - Safe 0.0199652 0.0763321 -
WF-77 - - Safe 0.0250927 0.0535829 -
WF-78 - - Safe 0.0108968 0.0283344 -
WF-79 - - Safe 0.0107563 0.0227068 -
WF-79a - - Safe 0.00045 0.0093264 -
WF-80 - - Safe 0.002247 0.0060471 -
WF-81 - - Safe 0.0004637 0.0020847 -
Total 0.0973384 0.2761917

46 | P a g e

47 | P a g e
Table 5.8 Status of Command Area
Name of the State:- MAHARASHTRA Source - Irrigation Dept., Sindhudurg Name of the District : SINDHUDURG
Area in Ha.
Name of Taluka Number
of the Village
Information of canal command Information of the other services command Total area
Total area
Developed area
Undeveloped area
Total area
Developed area
Undeveloped area
Developed command
(4+7)
Undeveloped command
(5+8)
1 2 3 4 5 6 7 8 9 10
Dodamarg 24 4269 82 4269 0 0 0 82 4269
Sawantwadi 52 12327 92 12235 0 0 0 92 12235
Kudal 89 17539 220 17319 909 0 909 220 18228
Vengurla 9 1674 17 1674 0 0 0 17 1674
Kankavali 84 8290 15 8275 5191 0 5191 15 13466
Vaibhavwadi 22 7907 0 7907 0 0 0 0 7907
Devgad 17 1920 0 1920 0 0 0 0 1920
Malvan 14 621 20 601 1984 0 1984 20 2585
TOTAL 311 54547 446 54200 8084 0 8084 446 62284

48 | P a g e
Table 5.9 Existing Type of Irrigation
Name of the State:- MAHARASHTRA Source: CDAP, SREP, Irrigation Dept., Sindhudurg Name of the District : SINDHUDURG
Name of Block
Surface irrigation (1) Ground water (2)
Oth
er s
ourc
es in
clud
ing
tradi
tiona
l W
HS
(3)
Trea
ted
efflu
ent d
isch
arge
d fr
om
STP
Water extraction devices/ lift
Total
Canal Based
Tanks /Ponds/ Reservoirs
Tube wells
Open Wells
Bore Well
elec
trici
ty p
ump
(4)
Die
sel p
ump
(5)
Oth
ers
(6)
Irrig
atio
n S
ourc
es (1
+2+3
)
Wat
er e
xtra
ctin
g un
its
(4+5
+6)
Gov
t. C
anal
Com
mun
ity /P
VT
. C
anal
Com
mun
ity p
onds
in
clud
ing
smal
l
Indi
vidu
al /P
vt. P
onds
Gov
t. /
Res
ervo
irs/
Dam
s
Gov
t.
PVT.
Com
mun
ity /G
ovt.
PVT.
Gov
t.
PVT.
Deogad 0 - 497 - - - - - 775 - 155 - -
5732 1900 -
1427
7632
Vaibhavwadi 5 - 241 - - - - - 393 - 95 - - 734 Malvan 2 - 1827 - - - - - 2001 - 333 - - 4163 Vengurla 0 - 978 - - - - - 1016 - 0 - - 1994 Kudal 2 - 1342 - - - - - 1615 - 373 - - 3332 Sawantwadi 3 - 1742 - - - - - 2021 - 328 - - 4094 Dodamarg 1 - 429 - - - - - 540 - 149 - - 1119 Kankavali 6 - 618 - - - - - 841 - 469 - - 1934
Total 19 - 7674 - - - - - 9202 - 1902 - - 5732 1900 18797 7632
49 | P a g e
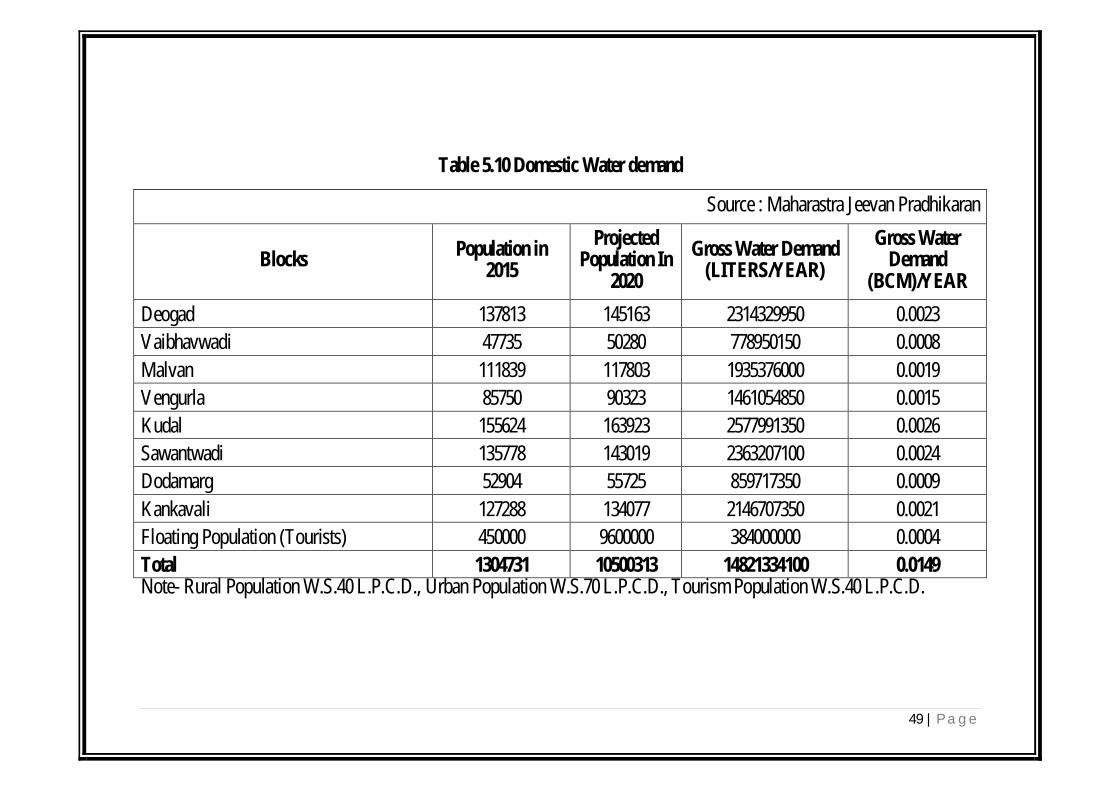
Table 5.10 Domestic Water demand
Source : Maharastra Jeevan Pradhikaran
Blocks Population in 2015
Projected Population In
2020
Gross Water Demand (LITERS/YEAR)
Gross Water Demand
(BCM)/YEAR
Deogad 137813 145163 2314329950 0.0023
Vaibhavwadi 47735 50280 778950150 0.0008
Malvan 111839 117803 1935376000 0.0019
Vengurla 85750 90323 1461054850 0.0015
Kudal 155624 163923 2577991350 0.0026
Sawantwadi 135778 143019 2363207100 0.0024
Dodamarg 52904 55725 859717350 0.0009
Kankavali 127288 134077 2146707350 0.0021
Floating Population (Tourists) 450000 9600000 384000000 0.0004
Total 1304731 10500313 14821334100 0.0149 Note- Rural Population W.S.40 L.P.C.D., Urban Population W.S.70 L.P.C.D., Tourism Population W.S.40 L.P.C.D.

50 | P a g e
Table 5.11 Crop Water Requirement
Block Area Sown (ha) Irrigated area (ha.)
Crop water demand (Lit.)
Water potential required (BCM)
Existing water potential (BCM)
Water potential to be created
(BCM)
Deogad 22203 1805 92761900000 0.0927619 0.0010215 0.0917404 Dodamarg 8729 1294 44125880000 0.04412588 0.000368937 0.043756943 Kankavali 16624 2014 203474160000 0.20347416 0.001987021 0.201487139 Kudal 23221 4208 198001030000 0.19800103 0.000757636 0.197243394 Malvan 10375 5049 156076660000 0.15607666 0.001995047 0.154081613 Sawantwadi 16112 4380 107883430000 0.10788343 0.001707253 0.106176177 Vaibhavwadi 8293 748 78151780000 0.07815178 0.001050286 0.077101494 Vengurla 11745 2318 65070050000 0.06507005 0.003674561 0.061395489
Total 117302 21816 945544890000 0.94554489 0.012562239 0.932982651 Note- Crop Water Demand = Crop Area x Crop Water Requirement.
51 | P a g e
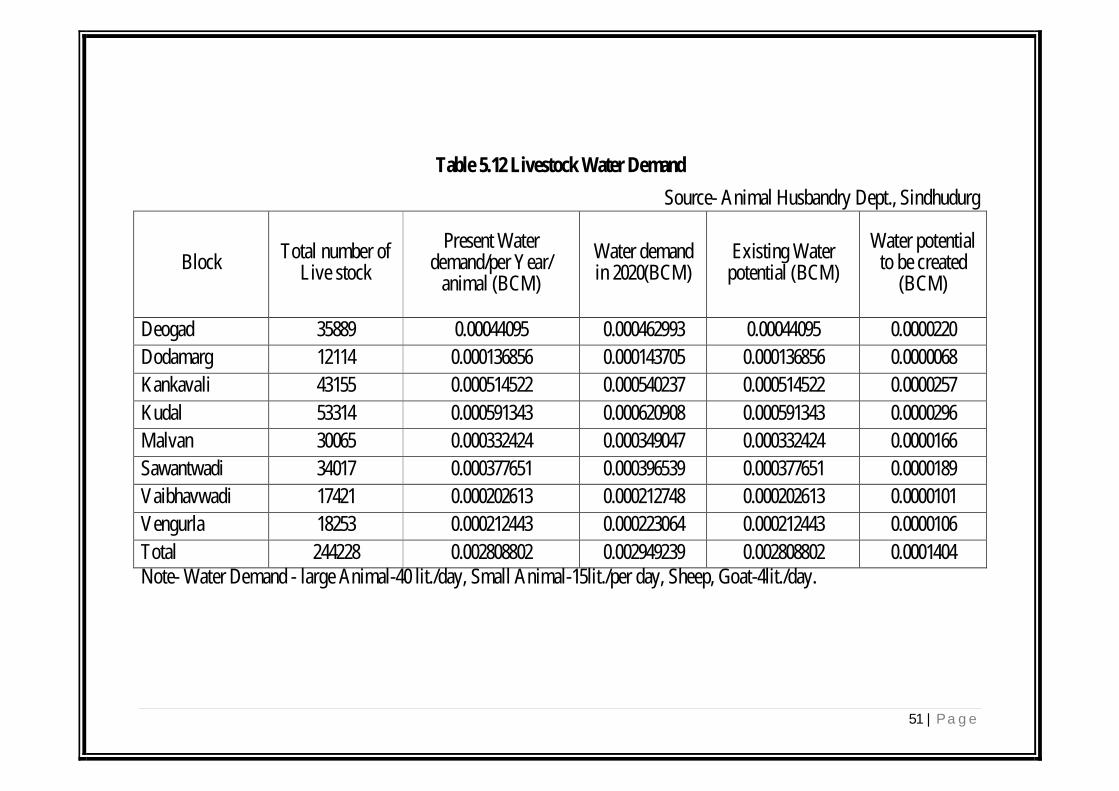
Table 5.12 Livestock Water Demand
Source- Animal Husbandry Dept., Sindhudurg
Block Total number of
Live stock
Present Water demand/per Year/
animal (BCM)
Water demand in 2020(BCM)
Existing Water potential (BCM)
Water potential to be created
(BCM)
Deogad 35889 0.00044095 0.000462993 0.00044095 0.0000220
Dodamarg 12114 0.000136856 0.000143705 0.000136856 0.0000068
Kankavali 43155 0.000514522 0.000540237 0.000514522 0.0000257
Kudal 53314 0.000591343 0.000620908 0.000591343 0.0000296
Malvan 30065 0.000332424 0.000349047 0.000332424 0.0000166
Sawantwadi 34017 0.000377651 0.000396539 0.000377651 0.0000189
Vaibhavwadi 17421 0.000202613 0.000212748 0.000202613 0.0000101
Vengurla 18253 0.000212443 0.000223064 0.000212443 0.0000106
Total 244228 0.002808802 0.002949239 0.002808802 0.0001404 Note- Water Demand - large Animal-40 lit./day, Small Animal-15lit./per day, Sheep, Goat-4lit./day.

52 | P a g e
Table 5.13 Industrial Water Demand
Source- Irrigation Dept., Sindhudurg.
Sr. No. Block
Name of industry
Water demand (BCM)
Water demand in 2020 (BCM)
Existing Water potential (BCM)
Water potential to be created (BCM)
1 Deogad 2 Vaibhavwadi Khambale 0.000000454 0.000000674 0.000000454 0.00000022 3 Malvan 4 Vengurla 5 Kudal Kudal 0.000508 0.00075 0.000508 0.000242 6 Sawantwadi 7 Dodamarg Aadali 0.0020075 0.0020075 8 Kankavali
Total 0.000508454 0.002758174 0.000508454 0.00224972

53 | P a g e
Table 5.14 Total Water Demand of the District for Various Sectors
Sr. no.
Block
Components
Total BCM Domestic Crop Livestock Industrial Power
Generation
1 Devgad 0.0023
0.0937834 0.000462993 0 0.096546393
2 Vaibhavwadi 0.0008
0.079202066 0.000143705 0.000000674 0 0.080146445
3 Malvan 0.0019
0.158071707 0.000540237 0 0.160511944
4 Vengurla 0.0015
0.068744611 0.000620908 0 0.070865519
5 Kudal 0.0026
0.198758666 0.000349047 0.00075 0 0.202457713
6 Sawantwadi 0.0024
0.109590683 0.000396539 0 0.112387222
7 Dodamarg 0.0009
0.044494817 0.000212748 0.0020075 0.352 0.399615065
8 Kankavli 0.0021
0.205461181 0.000223064 0.079 0.286784245
9 Floating Population (Tourists)
0.0004
0.0004
Total 0.0149 0.958107131 0.002949241 0.002758174 0.431 1.409714546
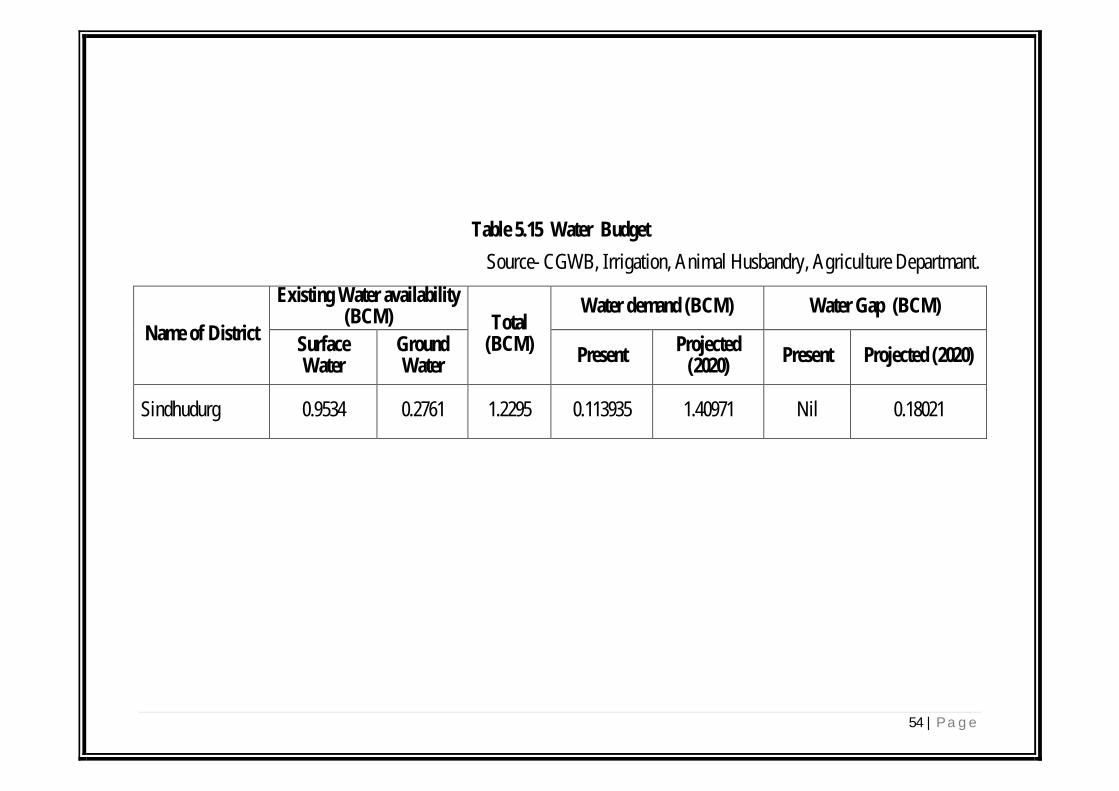
54 | P a g e
Table 5.15 Water Budget
Source- CGWB, Irrigation, Animal Husbandry, Agriculture Departmant.
Name of District
Existing Water availability (BCM) Total
(BCM)
Water demand (BCM) Water Gap (BCM)
Surface Water
Ground Water Present
Projected (2020) Present Projected (2020)
Sindhudurg 0.9534 0.2761 1.2295 0.113935 1.40971 Nil 0.18021

55 | P a g e
CHAPTER NO -6
Accelerated Irrigation Benefit Programme
Background :
Major & medium irrigation projects are capital-intensive in nature. The State
Governments with resources find themselves unable to meet desired fund demands of
all the projects. Therefore, the project completion gets delayed and a large number of
projects in the country have spilled over from one plan to another. Further, funds
spent on these projects are locked up and the country is not able to derive the desired
benefits. This was a matter of grave concern for the Union Government. Against
this background, the Accelerated Irrigation Benefit Programme (AIBP) was
launched by Government of India during 1996- 97 to provide financial assistance to
State Governments for accelerating the pace of irrigation development in the country.
Objective:
a) To focus on faster completion of ongoing Major and Medium Irrigation
including National Projects of Sindhudurg District.
b) To accelerate implementation of large irrigation projects which are
beyond the resource capability of state government
c) Expeditious completion of the projects which were in advance stage of the
completion
d) To realize the bulk benefit from the irrigation project. Scope:
1. Enhancement of Net irrigated area in the district to the maximum potential.
2. Ongoing major & medium projects completion by next 5 years (2015-2020).

56 | P a g e
Status of Projects:
Major Irrigation Project:
Projects which have cultivable command area (CCA) of more than 10,000 ha.
Utilize mostly surface water resources.
Total No. of Major Irrigation Projects = 2 (Ongoing Project )
Names of the Projects:
1) Tilari Interstate Irrigation Project
2) Talamba Project
Medium Irrigation Project:
Kankavli 1) Deoghar Project - 4512 Ha.
2) Nardave Project - 8084 Ha.
3) Korle Satandi Project - 2500 Ha.
Vaibhawadi 4) Aruna Project - 5310 Ha.
Sawantwadi 5) Sarambal Project - 6190 Ha.

57 | P a g e
CHAPTER NO -7
Per Drop More Crop
Objective:
To enhance the crop productivity by improving the water use efficiency through
micro irrigation systems.
Scope:
Promoting efficient water convenience and precision water application devices
like drip, Sprinklers in the farm.
Activities:
1. Construction of micro irrigation structure to supplement source creation activates
including tube wells and dug wells ( in areas where ground water to available and
not under semi critical\critical\over exploited category of development) Which
are not supported under PMKSY(WR),PMKSY (Watershed) and MGNREGS.
2. Secondary storage structure at tail end of canal system to store water when
available in abundance (rainy season) or from perennial sources like streams for
use during dry periods through effective on-farm water management;
3. Capacity building, training for encouraging potential water source through
technological agronomic and management practices including community
irrigation.
4. Awareness campaign on water saving technologies, practice, programme etc.
organization of workshops, conferences, publication of booklets, pamphlets,
success stories, documentary, advertisements etc.
5. Improved/ innovative distribution system like pipe and box outlet system with
controlled outlet and other activities of enhancing water use efficiency.

58 | P a g e
6. Topping of a input cost particularity under civil construction beyond permissible
limit (40%), under MGNREGS for activities like lining inlet, outlet silt traps,
distribution system etc.
7. Drought proofing to check dams/water harvesting structure.
8. On farm development like distribution pipe/raised bed and furrow systems etc.
Output:
Drip and sprinkler irrigation
a. Under drip 3,000 ha.
b. Under sprinkler 1,000 ha.
4,000 ha. to be brought under micro irrigation to increase water use efficiency.
Outcome:
Increase production, Productivity & Quality.
Conservation and sustainable use of water.
Higher energy efficiency in agriculture sector.
Improves water use efficiency.
Higher fertilizer use efficiency.
Saving in expanses labour

59 | P a g e
CHAPTER - 08
PROBABLE BENEFITS OF THE PLAN
Following benefits are intended from the proposed DIP (Sindhudurg):
1. The total cropped area of Sindhudurg district is 322090 ha. Though, this whole
area was under agriculture most of the area is under fruit crops like Mango,
Cashew nut & Coconuts etc.
2. Through PMKSY, we are envisaging to increase irrigation potential in the district.
Under AIBP, 2 major & 9 medium irrigation projects are proposed in the plan
which shall increase the irrigation potential in 2,86,188ha. The model irrigation
plan envisages educating the farmers to adhere to the scientific practices in the
command area of Kaddam Narayan Reddy Project and Saraswathi Canal (Sri Ram
Sagar Project). This will increase the crop production per unit area of agriculture
land and ensure the recycling of ground water in a balanced manner.
3. Under Har Kheth ko Paani, Minor and Lift irrigation projects proposed shall
enable to provide irrigation access to some of the remote tribal blocks in the
district favouring second cropping during the Rabi season. As such majority of
the tribal agriculture in Sindhudurg is rainfed and the aforementioned minor
irrigation projects will facilitate better availability of water.
4. A lot of Water Harvesting and conservation structures, like Farm Ponds, Check
Dams, Percolation Tanks, Nala bunds are proposed which shall enhance the Net
Irrigated Area. This shall be undertaken in convergence with MGNREGS and
Integrated Watershed Management Program.
5. On the other hand, there is depletion of ground water levels in Sindhudurg
district. Hence the plan has proposed for many ground water table recharge
structures. This shall favour micro irrigation activities in the region mainly drip
60 | P a g e
and sprinkler irrigation. This will also spur a change in cropping patterns and
farmers will show interests towards vegetable and other horticultural crops. This
can be boost commercial precision agriculture fostering local economy. There is
high potential for micro irrigation in Sindhudurg and the plan has proposed for
maximum utilization of the same. Nearly 15% of the total cropped area can be
brought under micro-irrigation system.
6. Target of "More Crop per Drop" will be achieved.
7. New Structures shall provide more surface water opportunities and shall act as
support for the live stock. This is one of the major water needs that goes
unnoticed. The plan has proposed for cattle troughs and village ponds that favour
cattle and other livestock.
8. Increased Water Availability shall spur many Agro-based industries in the region
providing employment generation.
61 | P a g e
CHAPTER NO - 09
Conclusion
1. The holistic irrigation plan was prepared at Block level & District level.
2. PMKSY DIP will fulfill the resource gap in the irrigation chain.
3. Irrigation to every farm will be achieved through completion of major, medium &
surface minor projects proposed under AIBP.
4. Under Per Drop More crop, we will achieve enhance cropping & productivity
which leads to rural prosperity.
5. Culturable area of the district is 628100 ha.
6. Irrigated area of the district is 134542 ha. Hence 493558 ha. has to be irrigated.
7. This action plan proposes for better water use efficiency & management along
with best distribution of water sources.
Recommendation
Sindhudurg district has high availability of water both through rainfall and rivers,
streams intersecting the mainland. However much of the potential has not been
capitalized till date. Pradhan Mantri Krishi Sinchan Yojana is a boon at this important
juncture of Sindhudurg. The district has to undergo a transformational phase of
development mainly in irrigation as agriculture is the spine of the Sindhudurg's
economy. Access to irrigation to small and marginal farmers who comprise nearly 76 %
of total farmers, alone shall bring a synergy in rural economy and it is high time the
water potential of Sindhudurg is utilized to its fullest.
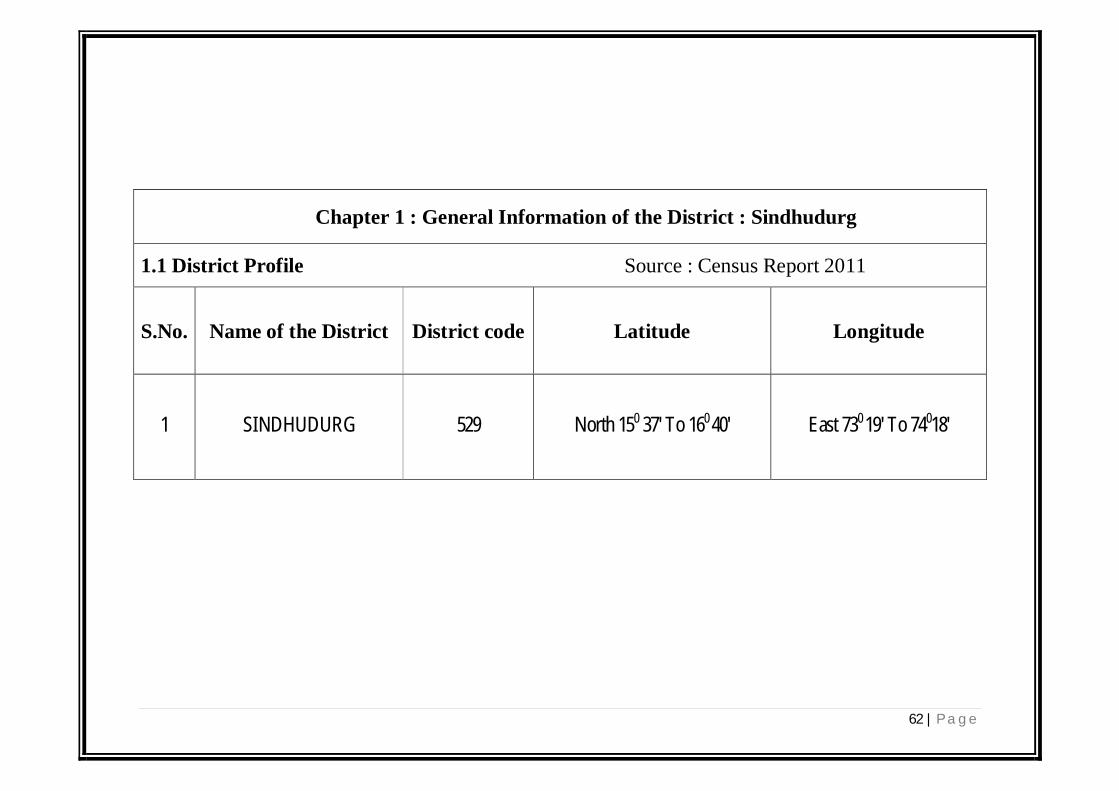
62 | P a g e
Chapter 1 : General Information of the District : Sindhudurg
1.1 District Profile Source : Census Report 2011
S.No. Name of the District District code Latitude Longitude
1 SINDHUDURG 529 North 150 37' To 160 40' East 730 19' To 74018'

63 | P a g e
1.2 Demography
Source : Census of India 2011
Name of the Taluka
Num
ber o
f the
V
illag
e co
vere
d
Cod
e of
Tal
uka Population SC ST General Total
M F CH Total
No.
of H
ouse
ho
ld
No.
of
Mem
bers
No.
of H
ouse
ho
ld
No.
of
Mem
bers
No.
of H
ouse
ho
ld
No.
of
Mem
bers
No.
of H
ouse
ho
ld
No.
of
Mem
bers
1 2 3 4 5 6 7 8 9 10 11 12 13 14 15 Deogad 98 0326 58938 61971 N/A 120909 1863 7081 270 1001 28930 112827 31063 120909
Vaibhavwadi 59 0327 20563 23282 N/A 43845 976 3712 55 207 10237 39926 11270 43845
Kankavali 105 0328 66241 69054 N/A 135295 3139 11930 332 1231 31316 122134 34788 135295
Malvan 134 0329 55010 56797 N/A 111807 1846 7015 212 785 26668 104007 28726 111807
Vengurla 84 0330 42235 43566 N/A 85801 1055 4010 136 505 20842 81286 22034 85801
Sawantwadi 85 0332 72944 74522 N/A 147466 2736 10398 507 1879 34663 135189 37908 147466
Kudal 125 0331 77159 78465 N/A 155624 2197 8350 286 1061 37490 146213 39974 155624
Dodamarg 62 0333 24242 24662 N/A 48904 813 3090 82 307 11668 45507 12564 48904
Total 752 - 417332 432319 N/A 849651 14633 55586 1890 6987 201826 787089 218341 849651

64 | P a g e
1.3 Biomass and Livestock
Source : Animal Husbandry Dept.
Name of the Taluka
Small Animals Large Animals
Any
oth
er M
ilch
or
Mea
t Ani
mal
(No)
Total Animal
Total
Poul
try (N
o)
Duc
ks (N
o)
Pigs
(No)
Goa
ts (N
o)
Shee
ps (N
o)
Inde
geno
us c
ow
(No)
Hyb
rid C
ow (N
o)
In d
escr
iptiv
e B
uffa
lo (N
o)
Hyb
rid B
uffa
lo
(No)
Animal Poultry
1 2 3 4 5 6 7 8 9 10 11 12 13 14 Deogad 50204 8 0 2250 7 26512 N/A 5808 N/A N/A 34585 50204 84789 Dodamarg 134048 0 0 1142 0 6409 N/A 4563 N/A N/A 12114 134048 146162 Kankavali 108372 13 523 3462 4 29892 N/A 9249 N/A N/A 43143 108372 151515 Kudal 144948 13 207 8188 0 24916 N/A 20001 N/A N/A 53325 144948 198273 Malvan 61409 0 100 4784 0 18243 N/A 6938 N/A N/A 30065 61409 91474 Sawantwadi 188006 15 618 4579 0 15666 N/A 13151 N/A N/A 34029 188006 222035 Vaibhavwadi 45845 4 0 2185 0 12735 N/A 2501 N/A N/A 17425 45845 63270 Vengurla 36319 8 250 1535 0 11732 N/A 4724 N/A N/A 18249 36319 54568
TOTAL 769151 61 1698 28125 11 146105 N/A 66935 N/A N/A 242935 769151 1012086
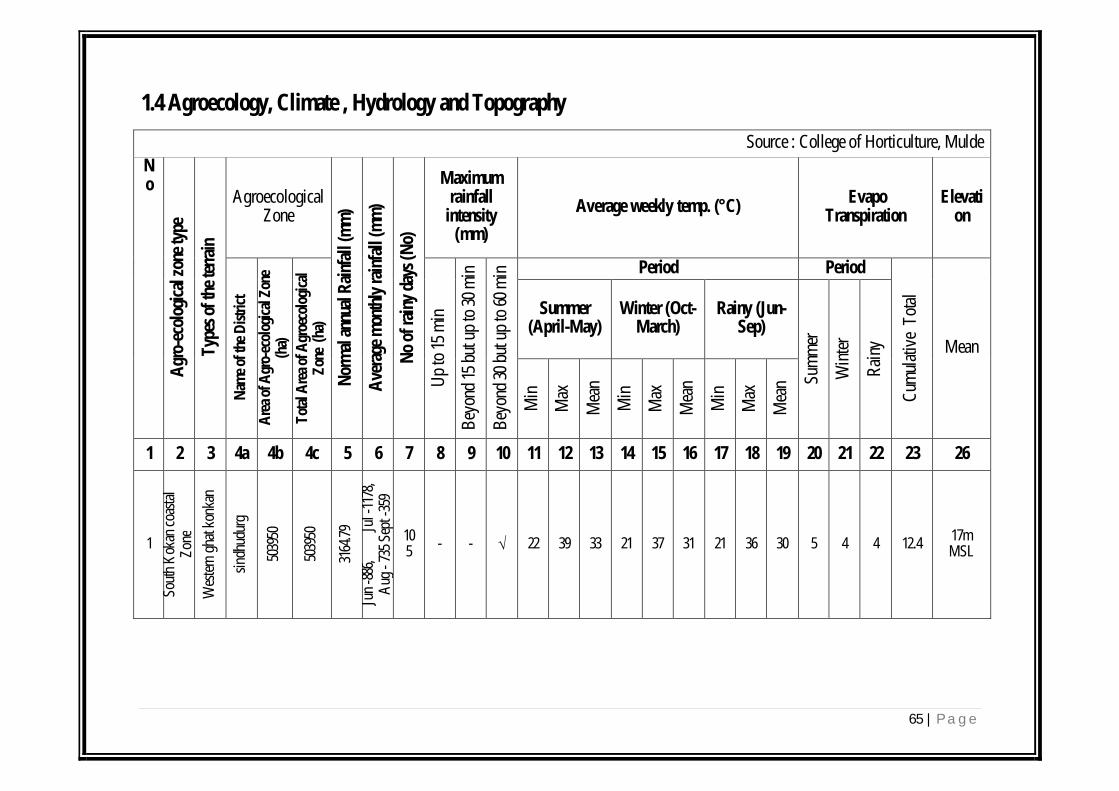
65 | P a g e
1.4 Agroecology, Climate , Hydrology and Topography
Source : College of Horticulture, Mulde
No
Agr
o-ec
olog
ical
zon
e ty
pe
Type
s of
the
terr
ain
Agroecological Zone
Nor
mal
ann
ual R
ainf
all (
mm
)
Ave
rage
mon
thly
rain
fall
(mm
)
No
of ra
iny
days
(No)
Maximum rainfall
intensity (mm)
Average weekly temp. (°C) Evapo
Transpiration Elevati
on
Nam
e of
the
Dis
tric
t
Are
a of
Agr
o-ec
olog
ical
Zon
e
(ha)
Tot
al A
rea
of A
groe
colo
gica
l Z
one
(ha)
Up
to 1
5 m
in
Bey
ond
15 b
ut u
p to
30
min
Bey
ond
30 b
ut u
p to
60
min
Period Period
Cum
ulat
ive
Tot
al
Mean
Summer (April-May)
Winter (Oct-March)
Rainy (Jun-Sep)
Sum
mer
Win
ter
Rai
ny
Min
Max
Mea
n
Min
Max
Mea
n
Min
Max
Mea
n
1 2 3 4a 4b 4c 5 6 7 8 9 10 11 12 13 14 15 16 17 18 19 20 21 22 23 26
1
Sout
h K
okan
coa
stal
Zo
ne
Wes
tern
gha
t kon
kan
sind
hudu
rg
5039
50
5039
50
3164
.79
Jun
-886
,
J
ul -1
178,
A
ug -
735
Sept
-359
105
- - √ 22 39 33 21 37 31 21 36 30 5 4 4 12.4 17m MSL

66 | P a g e
1.5 Soil Profile
Source :District soil testing lab, Sindhudurg
Name of Taluka Soil Type Land Slope
Major Soil Classes Area (ha) 0-3 % (ha) 3-8 % (ha) 8-25 % (ha) > 25 % (ha)
1 2 3 4 5 6 7
Deogad Laterite and alluvial soil 78127 3515.715 45313.66 23438.1 5859.525
Vaibhavwadi Laterite and alluvial soil 41612 1872.54 24134.96 12483.6 3120.9
Kankavali Laterite and alluvial soil 77339 3480.225 44856.62 23201.7 5800.425
Malvan Laterite and alluvial soil 61829 2782.305 35860.82 18548.7 4637.175
Vengurla Laterite and alluvial soil 29033 1306.485 16839.14 8709.9 2177.475
Sawantwadi Laterite and alluvial soil 84540 3804.3 49033.2 25362 6340.5
Kudal Laterite and alluvial soil 81897 3685.36 47500.26 24569.1 6142.275
Dodamarg Laterite and alluvial soil 49573 2230.785 28752.34 14871.9 3717.975

67 | P a g e
1.6 Soil Erosion and Runoff Status Source: CGWB
Name of the GSDA Watershed
Nam
e of
the
Sedi
men
t M
onito
ring
Stat
ion
Long
itude
Soil
eros
ion
(Ton
e/ha
)
Latit
ude
Runoff
Dro
ught
Fre
quen
cy
Name of the GSDA Waters
hed
Area of the waters
hed
Name of the Taluka covered
Peak
Rat
e (c
um/h
\r.)
Freq
uenc
y of
Pea
k (N
o. in
Mon
ths)
Tota
l Run
off
volu
me
of R
ainy
Se
ason
(Ha-
m)
Time of return of Maximum
flood
5 Y
ears
10 Y
ears
in y
ears
wf-72 63779 Devgod, Kankavli,Vaibhavwadi NA 73018'40" 14.14 16026'00" NA 2 1792.95 Nil Nil Nil Nil
wf-73 49666 Devgod, Kankavli,Vaibhavwadi NA 73020'20" 13.43 16021'30" NA 2 2032.82 Nil Nil Nil Nil
wf-74 22619 Deogad NA 73022'15" 11.58 16015'10" NA 2 855.37 Nil Nil Nil Nil
wf-75 28340 Kankavli, Malvan,Deogad NA 73025'00" 11.87 16008'50" NA 2 763.27 Nil Nil Nil Nil
wf-76 96219 Kankavli, Kudal, Malvan NA 73027'00" 11.41 15055'10" NA 2 5343.25 Nil Nil Nil Nil
wf-77 86351 Kudal, Malvan, Vengurla NA 73027'20" 14.98 15055'10" NA 2 3750.80 Nil Nil Nil Nil
wf-78 34480 Kudal, Sawantwadi,Vengurla NA 73030'10" 12.75 15047'10" NA 2 1983.41 Nil Nil Nil Nil
wf-79 70969 Sawantwadi,Vengurla, Dodamarg NA 73039'20" 16.88 15043'00" NA 2 1589.48 Nil Nil Nil Nil
wf-79a 14036 Sawantwadi NA 73059'30" 15051'40" NA 2 652.85 Nil Nil Nil Nil
wf-80 46585 Sawantwadi, Dodamarg NA 73054'00" 18.96 15037'50" NA 2 423.30 Nil Nil Nil Nil
wf-81 7656 Sawntwadi, Dodamarg NA 73058'10" 17.92 15037'00" NA 2 145.93 Nil Nil Nil Nil
Total 19333.42

68 | P a g e
1.7 Land Use Pattern
Source: CDAP,SREP Area in ha.
Sr No.
Name of Taluka
Number of the
Villages Covered
Total Geographical
Area
Area under Agriculture
Area under Forest
Area under Watershed
Area under Other uses
Gross Cropped Area (1)
Net Sown Area (2)
Area sown more than once (1-2)
Cropping intensity
(%)
1 Deogad 98 78127 40046 22527 22203 180.36 3004 69879 1932
2 Vaibhavwadi 59 41612 30030 11961 11833 253.78 4744 37814 2898
3 Kankavali 107 77339 55505 29025 26480 191.23 10990 79333 2880
4 Malvan 135 61829 39184 21997 17187 178.13 2298 70302 3011
5 Vengurla 84 29033 76979 42114 34865 182.79 18295
63932 5253
6 Sawantwadi 85 84540 72477
7 Kudal 125 81897 51492 31497 19995 163.48 11845 96005 3226
8 Dodamarg 55 49573 28803 14430 14373 199.61 4390 50776 2190
Total 503950 322039 173551 146936 192.76 55566 540518 21390

69 | P a g e
Table 2.1 Area wise crop wise irrigation status
Fig. in Ha.
Source-DSAO, Sindhudurg Taluka Cereals Coarse Cereals Pulses Oilseeds Cotton Sugarcane Vegetables Fruit crop Total
Name
Irrig
ated
Rai
nfed
Tot
al
Irrig
ated
Rai
nfed
Tot
al
Irrig
ated
Rai
nfed
Tot
al
Irrig
ated
Rai
nfed
Tot
al
Irrig
ated
Rai
nfed
Tot
al
Irrig
ated
Rai
nfed
Tot
al
Irrig
ated
Rai
nfed
Tot
al
Irrig
ated
Rai
nfed
Tot
al
Irrig
ated
Rai
nfed
Tot
al
Vaibhavwadi 0 4200 4200 0 562 562 38 227 265 45 171 216 0 0 0 611 0 611 70 63 133 402 5803 6205 1166 11026 12192
Kankavali 4 13695 13699 0 65 65 39 264 303 140 187 327 0 0 0 448 0 448 80 205 285 1280 16341 17621 1991 30757 32748
Malvan 220 10540 10760 0 0 0 95 518 613 140 292 432 0 0 0 45 0 45 170 234 404 3756 15191 18947 4426 26775 31201
Deogad 0 5690 5690 0 518 518 60 251 311 110 166 276 0 0 0 10 0 10 65 110 175 740 15415 16155 985 22150 23135
Kudal 603 13500 14103 0 0 0 140 463 603 190 266 456 0 0 0 74 0 74 230 359 589 3461 16767 20228 4698 31355 36053
Vengurla 115 4302 4417 0 0 0 55 123 178 45 98 143 0 0 0 0 0 0 140 121 261 2554 8280 10834 2909 12924 15833
Sawantwadi 440 7190 7630 0 0 0 65 165 230 62 71 133 0 0 0 210 0 210 130 167 297 3079 11768 14847 3986 19361 23347
Dodamarg 160 2740 2900 0 120 120 20 94 114 22 43 65 0 0 0 10 0 10 100 28 128 1343 6363 7706 1655 9388 11043
Total 1542 61857 63399 0 1265 1265 512 2105 2617 754 1294 2048 0 0 0 1408 0 1408 985 1287 2272 16615 95928 112543 21816 163736 185552

70 | P a g e
2.2 Production and Productivity of major Crops
Source: Department of Agriculture
Season Crop
Category
Rainfed Irrigated Total
Are
a (H
a.)
Prod
uctio
n (to
ns)
Prod
uctiv
ity o
r Y
ield
(Kgs
/ha)
Are
a (H
a.)
Prod
uctio
n
(qtn
/Yr.)
Prod
uctiv
ity
(Kgs
/ha)
Are
a (H
a.)
Prod
uctio
n
(qtn
/Yr.)
Prod
uctiv
ity
(Kgs
/ha)
A) Kharif Cereals 61857 162560 2628 0 0 0 61857 162560 2628
Coarse Cereals 1265 2386 1886 0 0 0 1265 2386 1886
Pulses 716 259 362 0 0 0 716 259 362
Oil Seeds 487 709 14560 0 0 0 487 709 14560
Cotton 0 0 0 0 0 0 0 0 0
Vegetables 1445 2150 1488.1 0 0 0 1445 2150 1488.1
B) Rabi Cereals 0 0 0 0 0 0 0 0 0
Coarse Cereals 0 0 0 0 0 0 0 0 0
Pulses 1315 496 377 585 221 378 1900 717 378
Oil Seeds 0 0 0 0 0 0 0 0 0
Vegetables 0 0 0 837 1245 1488 837 1245 1488
C) Summer Cereals 0 0 0 1439 2605 1810 1439 2605 1810

71 | P a g e
Coarse Cereals 0 0 0 0 0 0 0 0 0
Pulses 0 0 0 0 0 0 0 0 0
Oil Seeds 0 0 0 759 1501 1978 759 1501 1978
Sugarcane 0 0 0 1408 84480 60000 1408 84480 60000
Vegetables 0 0 0 81 121 1488 81 121 1488
Fruit crop 0 0 0 108670 1273069 11715 108670 1273069 11715
Total Cereals 61857 162560 2628 1439 2605 1810 63296 165165 2219
Coarse Cereals 1265 2386 1886 0 0 0 1265 2386 1886
Pulses 2031 755 370 585 221 378 2616 976 370
Oil Seeds 487 709 1456 759 1501 1978 1246 2210 1717
Cotton 0 0 0 0 0 0 0 0 0
Sugarcane 0 2150 0 1408 84480 60000 1408 86630 60000
Vegetables 1445 0 1488 918 1366 1488 2363 1366 1488
Fruit crop 0 0 0 0 0 0 0 0 0

72 | P a g e
Table 2.3 Irrigation based Classification
Source: Agriculture Statistic, Irrigation Dept, Sindhudurg
Name of the Block Irrigated (Area in ha.) Rainfed (Area in ha.)
Gross Irrigated Area Net Irrigated Area Partially Irrigated / Protective Irrigation
Un-Irrigated or Totally Rainfed
Dodamarg 4269 754 540 6743
Sawantwadi 11921 2359 2021 34277
Kudal 18160 2593 1615 14591
Vengurla 1674 1302 1016 43056
Kankavali 11649 1173 841 14001
Vaibhavwadi 7907 355 393 5437
Deogad 1920 1030 775 14762
Malvan 2323 3048 2001 23659
Total 59823 12614 9202 156526

73 | P a g e
Table 3.1 Status of water Availability
Source: Irrigation Dept.,Sindhudurg
Sr. No. Sources Kharif Rabi Summer Total (BCM)
1 Surface Irrigation
0.67721
i) Canal (Major & Medium Irrigation) 0.06544 0.1308 0.1963 0.589
ii) Minor Irrigation tank 0 0.03449 0.03832 0.07281
iii) Lift Irrigation / Diversion 0 0.0154 0 0.0154
iv) Various Water Bodies including Ran Water Harvesting 0 0 0 0
v) Treated Effluent Received from STP 0 0 0 0
vi) Untreated Effluent 0 0 0 0
vii) Perennial sources of water 0 0 0 0
2 Ground Water 0.27619
i) Open Well 0.004601 0 0 0.004601
ii) Deep Tube Well 0.00015 0 0 0.00015
iii) Medium Tube Well 0 0 0 0
iv) Shallow Tube Well 0 0 0 0
Not Harvested Water 0.271449
Total 0.004761 0.00065 0.00072 0.9534
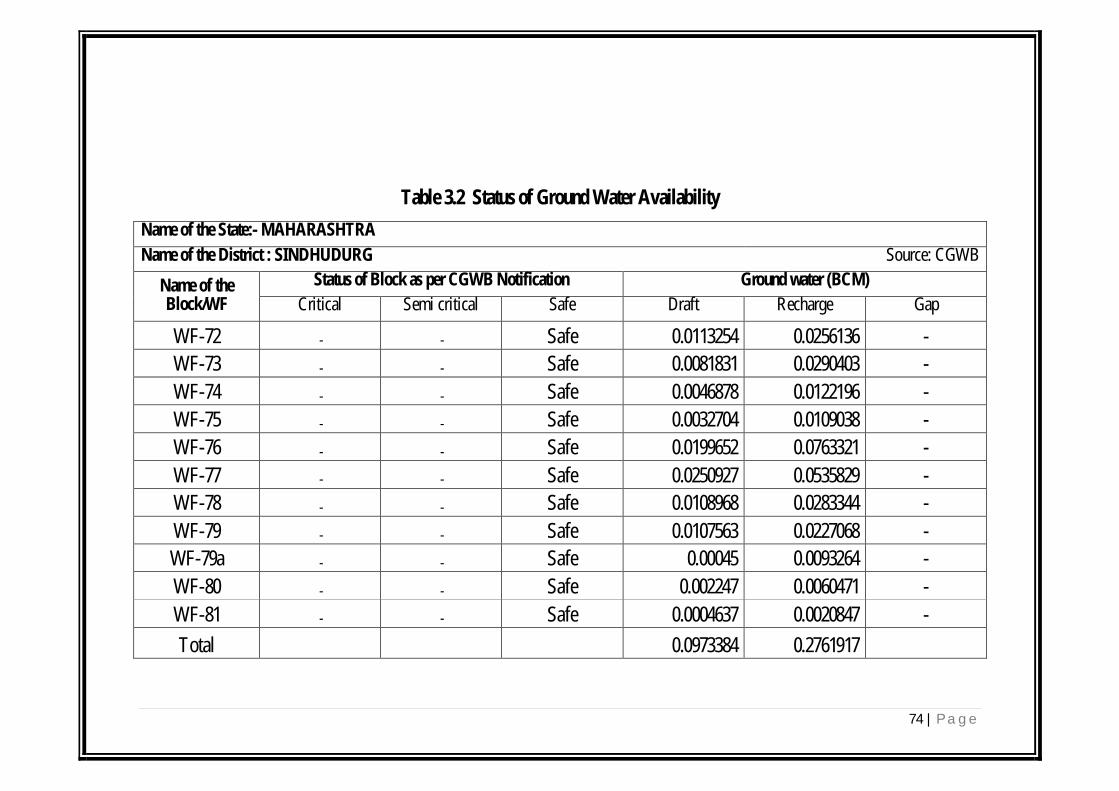
74 | P a g e
Table 3.2 Status of Ground Water Availability
Name of the State:- MAHARASHTRA
Name of the District : SINDHUDURG Source: CGWB
Name of the Block/WF
Status of Block as per CGWB Notification Ground water (BCM)
Critical Semi critical Safe Draft Recharge Gap
WF-72 - - Safe 0.0113254 0.0256136 -
WF-73 - - Safe 0.0081831 0.0290403 -
WF-74 - - Safe 0.0046878 0.0122196 -
WF-75 - - Safe 0.0032704 0.0109038 -
WF-76 - - Safe 0.0199652 0.0763321 -
WF-77 - - Safe 0.0250927 0.0535829 -
WF-78 - - Safe 0.0108968 0.0283344 -
WF-79 - - Safe 0.0107563 0.0227068 -
WF-79a - - Safe 0.00045 0.0093264 -
WF-80 - - Safe 0.002247 0.0060471 -
WF-81 - - Safe 0.0004637 0.0020847 -
Total 0.0973384 0.2761917
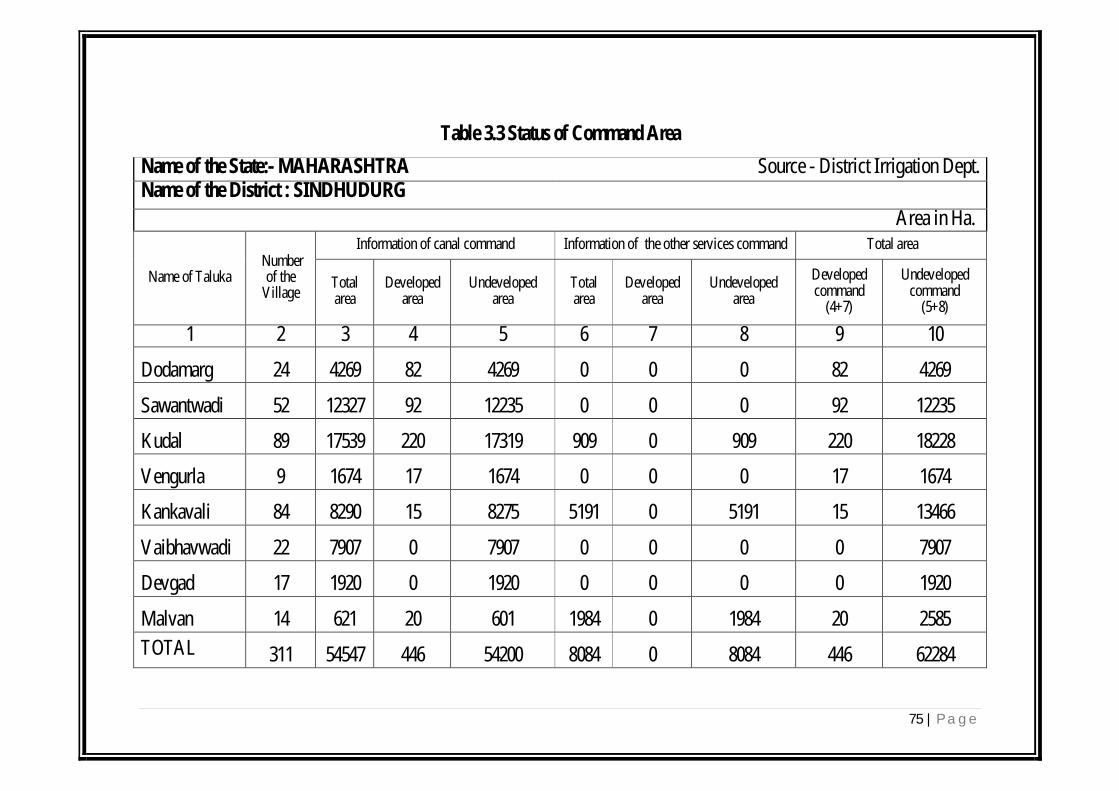
75 | P a g e
Table 3.3 Status of Command Area
Name of the State:- MAHARASHTRA Source - District Irrigation Dept. Name of the District : SINDHUDURG
Area in Ha.
Name of Taluka Number
of the Village
Information of canal command Information of the other services command Total area
Total area
Developed area
Undeveloped area
Total area
Developed area
Undeveloped area
Developed command
(4+7)
Undeveloped command
(5+8)
1 2 3 4 5 6 7 8 9 10
Dodamarg 24 4269 82 4269 0 0 0 82 4269
Sawantwadi 52 12327 92 12235 0 0 0 92 12235
Kudal 89 17539 220 17319 909 0 909 220 18228
Vengurla 9 1674 17 1674 0 0 0 17 1674
Kankavali 84 8290 15 8275 5191 0 5191 15 13466
Vaibhavwadi 22 7907 0 7907 0 0 0 0 7907
Devgad 17 1920 0 1920 0 0 0 0 1920
Malvan 14 621 20 601 1984 0 1984 20 2585
TOTAL 311 54547 446 54200 8084 0 8084 446 62284

76 | P a g e
Table 3.4 Existing Type of Irrigation
Name of the State:- MAHARASHTRA Source: CDAP, SREP, District Irrigation Dept. Name of the District : SINDHUDURG
Name of Block
Surface irrigation (1) Ground water (2)
Oth
er s
ourc
es in
clud
ing
tradi
tiona
l W
HS
(3)
Tre
ated
eff
luen
t dis
char
ged
from
ST
P
Water extraction devices/ lift
Total
Canal Based
Tanks /Ponds/ Reservoirs
Tube wells
Open Wells
Bore Well
elec
trici
ty p
ump
(4)
Die
sel p
ump
(5)
Oth
ers
(6)
Irrig
atio
n S
ourc
es (1
+2+3
)
Wat
er e
xtra
ctin
g un
its
(4+5
+6)
Gov
t. C
anal
Com
mun
ity /P
VT.
C
anal
Com
mun
ity p
onds
in
clud
ing
smal
l
Indi
vidu
al /P
vt.P
onds
Gov
t. /
Res
ervo
irs/
Dam
s
Gov
t.
PVT.
Com
mun
ity /G
ovt.
.
PVT.
Gov
t.
PVT.
Devgad 0 - 497 - - - - - 775 - 155 - -
5732 1900 -
1427
7632
Vaibhavwadi 5 - 241 - - - - - 393 - 95 - - 734 Malvan 2 - 1827 - - - - - 2001 - 333 - - 4163 Vengurla 0 - 978 - - - - - 1016 - 0 - - 1994 Kudal 2 - 1342 - - - - - 1615 - 373 - - 3332 Sawantwadi 3 - 1742 - - - - - 2021 - 328 - - 4094 Dodamarg 1 - 429 - - - - - 540 - 149 - - 1119 Kankavali 6 - 618 - - - - - 841 - 469 - - 1934 Total 19 - 7674 - - - - - 9202 1902 5732 1900 18797 7632
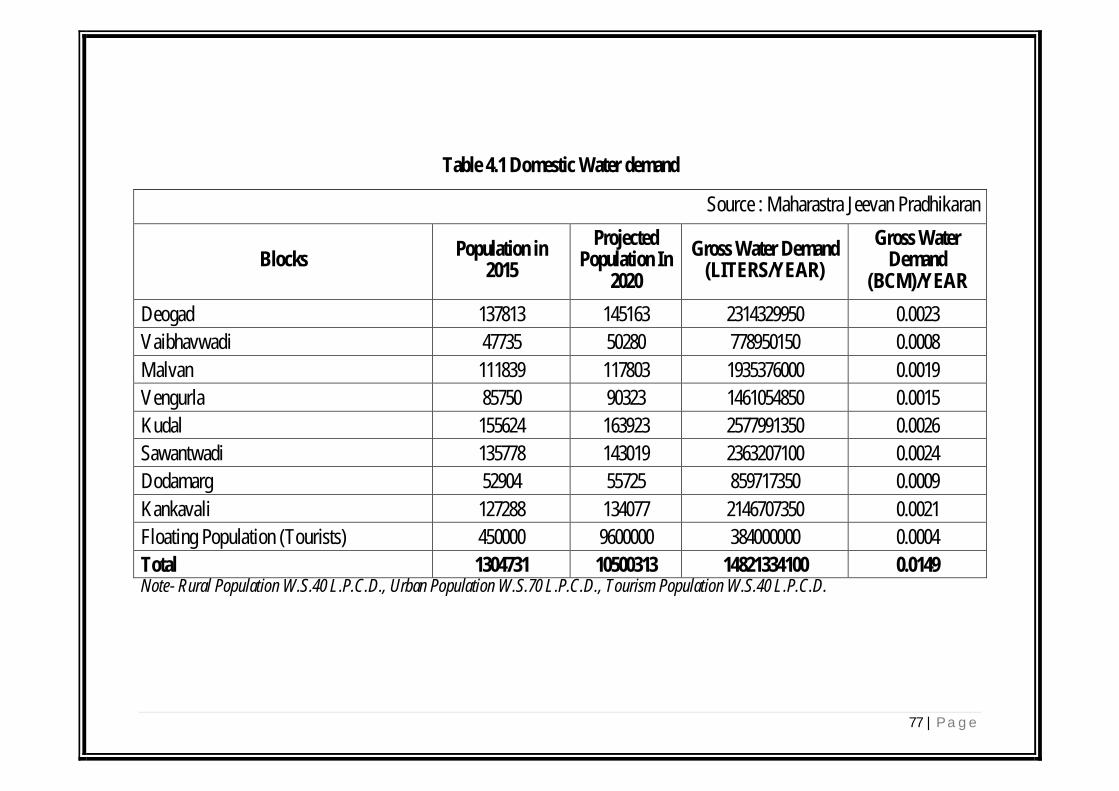
77 | P a g e
Table 4.1 Domestic Water demand
Source : Maharastra Jeevan Pradhikaran
Blocks Population in 2015
Projected Population In
2020
Gross Water Demand (LITERS/YEAR)
Gross Water Demand
(BCM)/YEAR
Deogad 137813 145163 2314329950 0.0023
Vaibhavwadi 47735 50280 778950150 0.0008
Malvan 111839 117803 1935376000 0.0019
Vengurla 85750 90323 1461054850 0.0015
Kudal 155624 163923 2577991350 0.0026
Sawantwadi 135778 143019 2363207100 0.0024
Dodamarg 52904 55725 859717350 0.0009
Kankavali 127288 134077 2146707350 0.0021
Floating Population (Tourists) 450000 9600000 384000000 0.0004
Total 1304731 10500313 14821334100 0.0149 Note- Rural Population W.S.40 L.P.C.D., Urban Population W.S.70 L.P.C.D., Tourism Population W.S.40 L.P.C.D.

78 | P a g e
Table 4.2 Crop Water Requirement
Block Area Sown (ha) Irrigated area (ha.)
Crop water demand (Lit.)
Water potential required (BCM)
Existing water potential (BCM)
Water potential to be created (BCM)
Deogad 22203 1805 92761900000 0.0927619 0.0010215 0.0917404 Dodamarg 8729 1294 44125880000 0.04412588 0.000368937 0.043756943 Kankavali 16624 2014 203474160000 0.20347416 0.001987021 0.201487139 Kudal 23221 4208 198001030000 0.19800103 0.000757636 0.197243394 Malvan 10375 5049 156076660000 0.15607666 0.001995047 0.154081613 Sawantwadi 16112 4380 107883430000 0.10788343 0.001707253 0.106176177 Vaibhavwadi 8293 748 78151780000 0.07815178 0.001050286 0.077101494 Vengurla 11745 2318 65070050000 0.06507005 0.003674561 0.061395489
Total 117302 21816 945544890000 0.94554489 0.012562239 0.932982651 Note- Crop Water Demand = Crop Area x Crop Water Requirement.
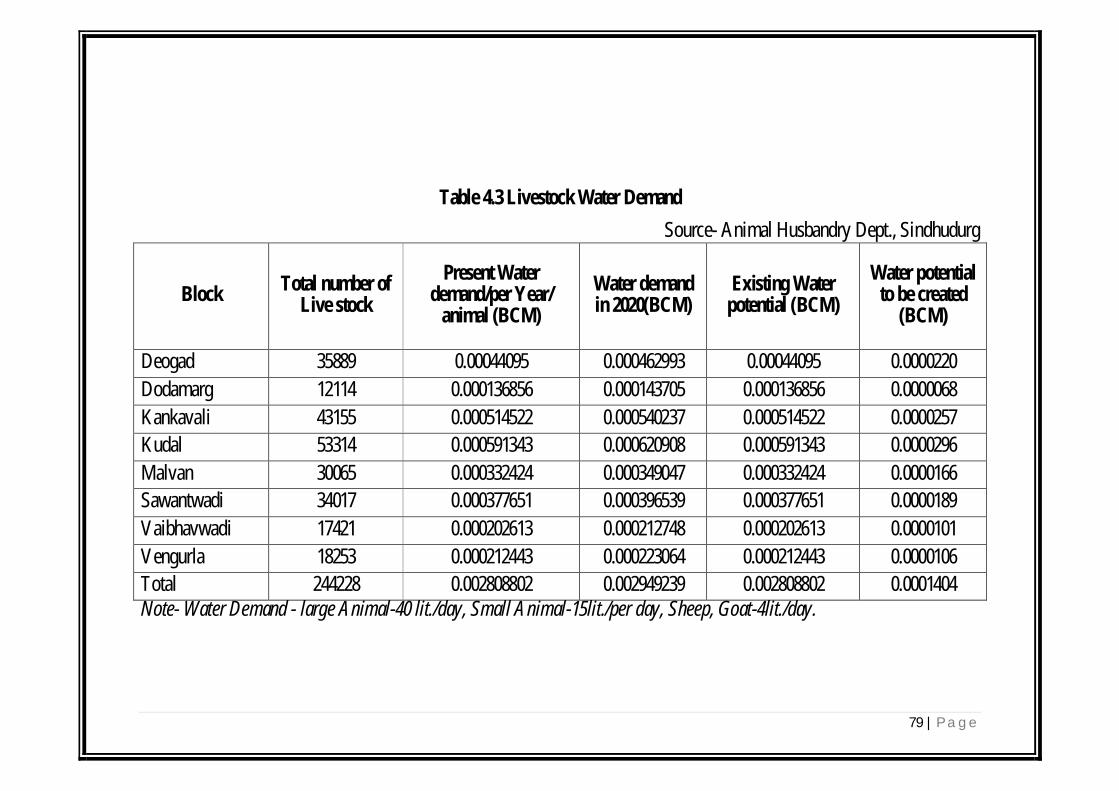
79 | P a g e
Table 4.3 Livestock Water Demand
Source- Animal Husbandry Dept., Sindhudurg
Block Total number of Live stock
Present Water demand/per Year/
animal (BCM)
Water demand in 2020(BCM)
Existing Water potential (BCM)
Water potential to be created
(BCM)
Deogad 35889 0.00044095 0.000462993 0.00044095 0.0000220
Dodamarg 12114 0.000136856 0.000143705 0.000136856 0.0000068
Kankavali 43155 0.000514522 0.000540237 0.000514522 0.0000257
Kudal 53314 0.000591343 0.000620908 0.000591343 0.0000296
Malvan 30065 0.000332424 0.000349047 0.000332424 0.0000166
Sawantwadi 34017 0.000377651 0.000396539 0.000377651 0.0000189
Vaibhavwadi 17421 0.000202613 0.000212748 0.000202613 0.0000101
Vengurla 18253 0.000212443 0.000223064 0.000212443 0.0000106
Total 244228 0.002808802 0.002949239 0.002808802 0.0001404 Note- Water Demand - large Animal-40 lit./day, Small Animal-15lit./per day, Sheep, Goat-4lit./day.

80 | P a g e
Table 4.4 Industrial Water Demand
Source- Irrigation Dept., Sindhudurg.
Sr. No. Block
Name of industry
Water demand (BCM)
Water demand in 2020 (BCM)
Existing Water potential (BCM)
Water potential to be created (BCM)
1 Deogad 2 Vaibhavwadi Khambale 0.000000454 0.000000674 0.000000454 0.00000022 3 Malvan 4 Vengurla 5 Kudal Kudal 0.000508 0.00075 0.000508 0.000242 6 Sawantwadi 7 Dodamarg Aadali 0.0020075 0.0020075 8 Kankavali
Total 0.000508454 0.002758174 0.000508454 0.00224972

81 | P a g e
4.5 Water Demand for Power Generation
Block Power requirement MW
Water demand (BCM)
Water demand in 2020 (BCM)
Existing Water potential (BCM)
Water potential to be created
(BCM)
Dodamarg (Tillari) 10 0.352 0.352 0.447 NIL
Kankavali (Deoghar) 1.5 0.079 0.079 0.098 NIL
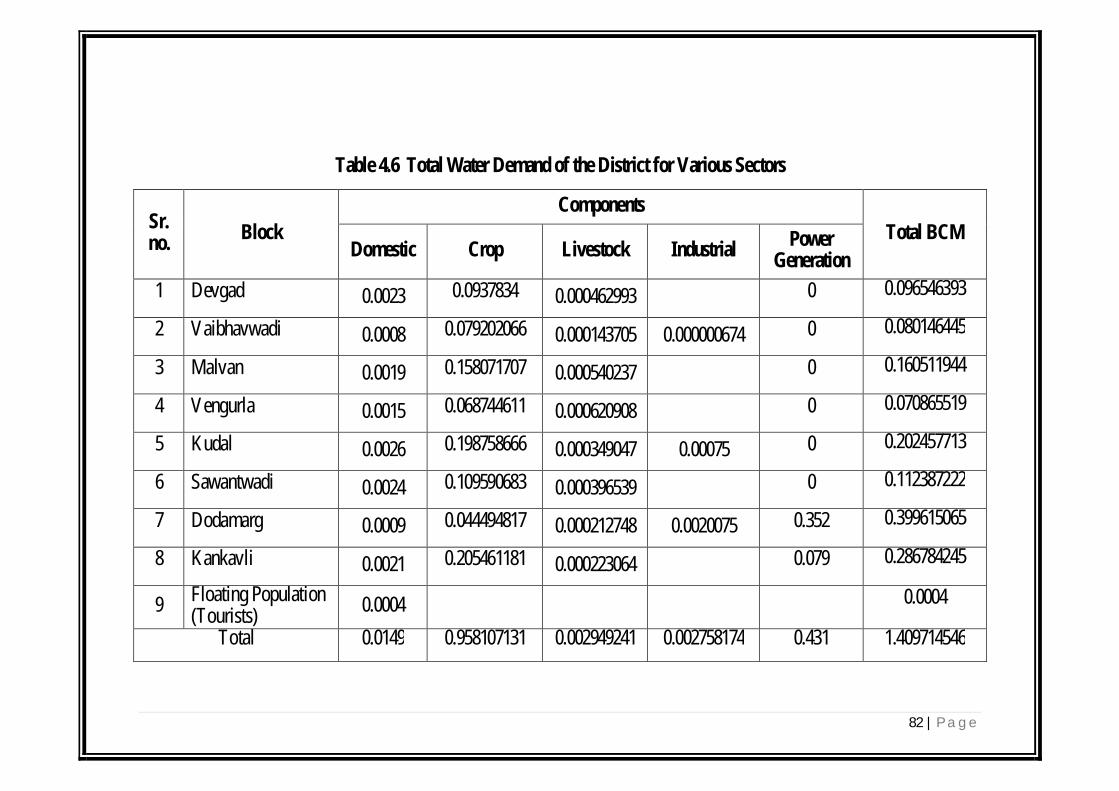
82 | P a g e
Table 4.6 Total Water Demand of the District for Various Sectors
Sr. no.
Block
Components
Total BCM Domestic Crop Livestock Industrial Power
Generation
1 Devgad 0.0023 0.0937834 0.000462993
0 0.096546393
2 Vaibhavwadi 0.0008 0.079202066 0.000143705 0.000000674 0 0.080146445
3 Malvan 0.0019 0.158071707 0.000540237 0 0.160511944
4 Vengurla 0.0015 0.068744611 0.000620908 0 0.070865519
5 Kudal 0.0026 0.198758666 0.000349047 0.00075 0 0.202457713
6 Sawantwadi 0.0024 0.109590683 0.000396539
0 0.112387222
7 Dodamarg 0.0009 0.044494817 0.000212748 0.0020075 0.352 0.399615065
8 Kankavli 0.0021 0.205461181 0.000223064 0.079 0.286784245
9 Floating Population (Tourists)
0.0004
0.0004
Total 0.0149 0.958107131 0.002949241 0.002758174 0.431 1.409714546

83 | P a g e
68%
31%
1%0%0%
Total Water Demand of the District for Various Sectors
Crop
Power Generation
Domestic
Livestock
Industrial

84 | P a g e
Table 4.7 Water Budget
Source- CGWB, Irrigation, Animal Husbandry, Agriculture Departmant.
Name of District
Existing Water availability (BCM) Total
(BCM)
Water demand (BCM) Water Gap (BCM)
Surface Water
Ground Water Present
Projected (2020) Present Projected (2020)
Sindhudurg 0.9534 0.2761 1.2295 0.113935 1.40971 Nil 0.18021

District - Sindhudurg
Sr. No. Item 2016-17 2017-18 2018-19 2019-20 2020-21 Total Rs in Cr.
1 AIBP (Accelerated Irrigation Benefit Programme) 858.45 954.20 865.97 644.67 326.59 3649.88
2 Har Khet Ko Pani 31.26 31.26 31.26 31.26 31.26 156.30
3 Per Drop more crop (MicroIrrigation 4.90 4.90 4.90 4.90 4.90 24.50
4 Per Drop more crop (Supplementary Water Management Activities) 1.89 1.89 1.89 1.89 1.89 9.45
5 PMKSY Watershed 42.32 33.74 35.25 30.76 30.76 172.826 Convergence with MGNREGA 18.56 18.56 18.56 18.56 18.56 92.787 State Planned Scheme of irrigation 21.80 21.80 21.80 21.80 21.80 109.00
Total 979.18 1066.34 979.63 753.84 435.75 4214.73
Strategic Action Plan for Irrigation in District (SAPID) under PMKSY Itemwise year wise Estimated cost 2016-2021
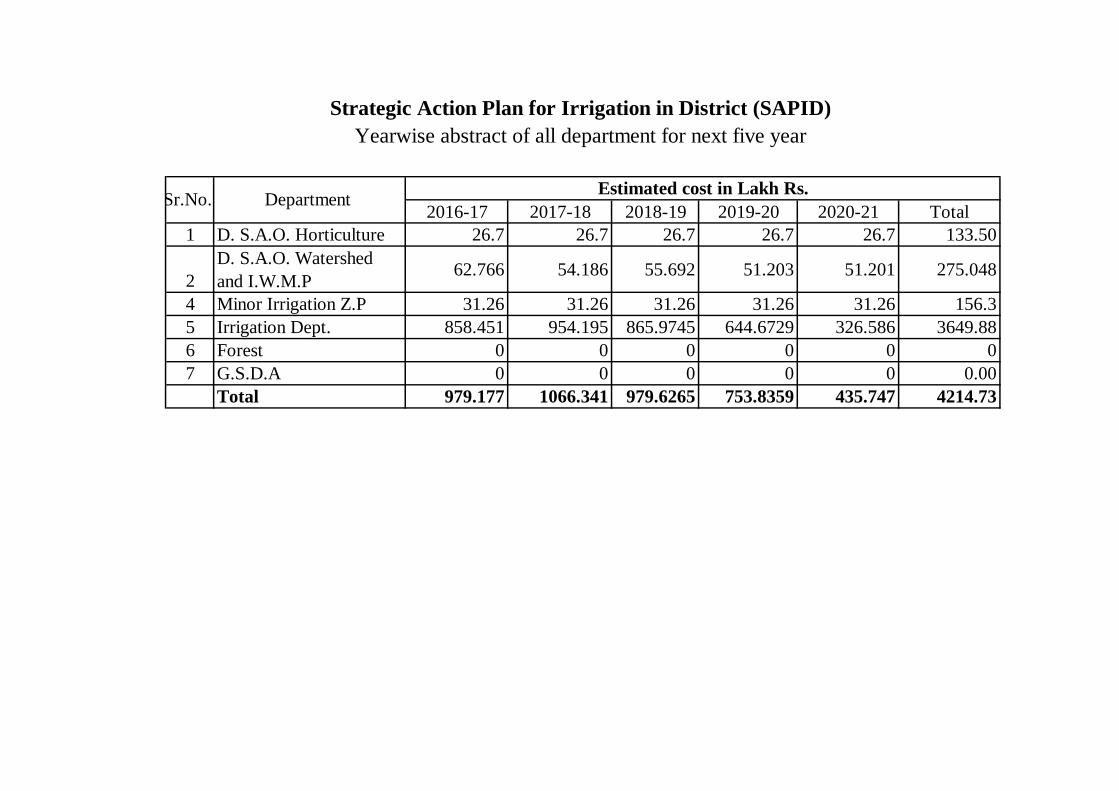
2016-17 2017-18 2018-19 2019-20 2020-21 Total1 D. S.A.O. Horticulture 26.7 26.7 26.7 26.7 26.7 133.50
2D. S.A.O. Watershed and I.W.M.P 62.766 54.186 55.692 51.203 51.201 275.048
4 Minor Irrigation Z.P 31.26 31.26 31.26 31.26 31.26 156.35 Irrigation Dept. 858.451 954.195 865.9745 644.6729 326.586 3649.886 Forest 0 0 0 0 0 07 G.S.D.A 0 0 0 0 0 0.00
Total 979.177 1066.341 979.6265 753.8359 435.747 4214.73
Strategic Action Plan for Irrigation in District (SAPID) Yearwise abstract of all department for next five year
Sr.No. Department Estimated cost in Lakh Rs.

1 MoWR AIBP Major Irrigation 462.96 23676 134.698 234.688 116.08 55 55 595.4662 MoWR AIBP Medium Irrigation 439.975 26596 574.038 544.757 589.351 503.014 70.81 2281.97
3 MoWR AIBP Surface Minor Irrigation 158.238 13538.57 149.715 174.75 160.5435 86.6589 200.776 772.4435
1061.173 63810.57 858.451 954.195 865.9745 644.6729 326.586 3649.87954 MoWR Lift Irrigation 0 0 0 0 0 0 0 0
5 MoWR Ground Water Development 12500 TCM 6125 31.26 31.26 31.26 31.26 31.26 156.3
6 MoWR RRR Of Water Bodies 0 0 0 0 0 0 0 07 MoWR Construction Of Field Channel 0 0 0 0 0 0 0 0
7.1 MoWR lined field channel 0 0 0 0 0 0 0 07.2 MoWR Unlinned channels 0 0 0 0 0 0 0 08 MoWR Micro Irrigation 0 0 0 0 0 0 0 0
12500 TCM 6125 31.26 31.26 31.26 31.26 31.26 156.3
9 MOA & FW- DCC & FW DPAP Drip 0 0 0 0 0 0 0 0
10 MOA & FW- DCC & FW DPAP Sprinkler 0 0 0 0 0 0 0 0
11 MOA & FW- DCC & FW NON-DPAP Drip 3000 0 4.5 4.5 4.5 4.5 4.5 22.5
12 MOA & FW- DCC & FW NON-DPAP Sprinkler 1000 0 0.4 0.4 0.4 0.4 0.4 24000 0 4.9 4.9 4.9 4.9 4.9 24.5
13 MOA & FW- DCC & FW Topping up of MGNREGA 200 250 0.1 0.1 0.1 0.1 0.1 0.5
14 MOA & FW- DCC & FWDrought Proofing through check Dams/ Water
Harvesting Structures125 500 0.64 0.64 0.64 0.64 0.64 3.2
15 MOA & FW- DCC & FW Secondary storage Structures 1000 1000 1 1 1 1 1 5
16 MOA & FW- DCC & FWOn farm Development (distribution pipe/ raised bed
and furrow system etc)5000 5000 0.15 0.15 0.15 0.15 0.15 0.75
6325 6750 1.89 1.89 1.89 1.89 1.89 9.45
2016-17 2017-18 2018-19 2019-20 2020-21
Estimated cost for 5 Year (Rs. In Cr.)
Total AIBP
Total Har Khet ko Pani
Sr. no.Name of the Blocks/ Sub
Districts
Concerned Ministry/ Department
Component Activity
Har Khet Ko Pani
Per Drop more Crop (Supplementary water manegement activities)
Per Drop more Crop (Micro Irrigation
5. Strategic Action plan for Irrigation in District under PMKSY (District: Sindhudurg) Period of Implementation (5 yrs)
Total : Per Drop more Crop (Micro Irrigation)
Total: Per Drop more Crop (Supplementary water manegement activities)
Total number / Capacity (Mcum)
Command Area/ Irrigation Potential

2016-17 2017-18 2018-19 2019-20 2020-21
Estimated cost for 5 Year (Rs. In Cr.)
Sr. no.Name of the Blocks/ Sub
Districts
Concerned Ministry/ Department
Component Activity
5. Strategic Action plan for Irrigation in District under PMKSY (District: Sindhudurg) Period of Implementation (5 yrs)
Total number / Capacity (Mcum)
Command Area/ Irrigation Potential
17 DoLR - MoRD Newly Created WHS
17.1 DoLR - MoRD Farm Ponds 1600 1600 2.4 2.4 2.4 2.4 2.4 12
17.2 DoLR - MoRD Check Dams 750 500 1.4 1.4 1.4 1.4 1.4 7
17.3 DoLR - MoRD Nallah Bunds 750 750 6 6 6 6 6 30
17.4 DoLR - MoRD Pencolation Tanks 0 0 0 0 0
17.5 DoLR - MoRD Other grouund Water Recharg structure 20000 10500 18 18 18 18 18 90
17.6 DoLR - MoRD FIshery ponds/ cattle pond 0 0 0 0 0 0
18 DoLR - MoRD Renovated WHS
18.1 DoLR - MoRD Farm Ponds 0 0 0 0 0
18.2 DoLR - MoRD Check Dams 24 0.02 0.02 0.02 0.02 0.02 0.1
18.3 DoLR - MoRD Nallah Bunds 10 10 0.02 0.02 0.02 0.02 0.02 0.1
18.4 DoLR - MoRD Pencolation Tanks 0 0 0 0 0
18.5 DoLR - MoRD Other grouund Water Recharg structure 20 32 0.08 0.08 0.08 0.08 0.08 0.4
18.5A DoLR - MoRD Livelihood Activities 14.4 5.82 7.326 2.837 2.835 33.218
18.6 DoLR - MoRD Fishery ponds/ cattle pond 0 0 0 0 0 023154 13392 42.32 33.74 35.246 30.757 30.755 172.818
19 DoLR - MoRD Newly Created 0 0 0 0 0
19.1 DoLR - MoRD Water Conservation 0 0 0 0 0
19.2 DoLR - MoRD Water Harvesting 400 400 0.6 0.6 0.6 0.6 0.6 3
19.3 DoLR - MoRD Creation of Irrigation canals and Drains 59880 59880 17.506 17.506 17.506 17.506 17.506 87.53
19.4 DoLR - MoRD Providing Infrastructure for Irrigation 0 0 0 0 0 0
19.5 DoLR - MoRD Land Development 0 0 0 0 0 0
20 DoLR - MoRD Renovation
20.1 DoLR - MoRD Renovation of water boidies including destling 210 2310 0.45 0.45 0.45 0.45 0.45 2.25
20.2 DoLR - MoRDRenovation & Maintenance of Irrigation Canals &
Drains0 0 0 0 0 0
60490 62590 18.556 18.556 18.556 18.556 18.556 92.78
21
21.1 State Agriculture Department Name of Scheme Micro Irrigation 4000 21.8 21.8 21.8 21.8 21.8 109
21.2 State Agriculture Department Name of Scheme Medium Irrigation
21.3 State Agriculture Department Name of Scheme Surface Minor Irrigation
22Irrigation Scheme Of State
Agriculture DepartmentName of Scheme
23Irrigation Scheme Of Other
Line DepartmentName of Scheme
24 Externallay added project Name of Scheme
25Other Loaned project like
NABARDName of Scheme
4000 0 21.8 21.8 21.8 21.8 21.8 109
111530.17 152667.57 979.18 1066.34 979.63 753.84 435.75 4214.73Total
State Planned Scheme Of Irrigation
PMKSY Watersshed
Convergence with MGNREGA
State Planned Scheme Of Irrigation
Total : PMKSY Watersshed
Total: Convergence with MGNREGA
85 / P a g e