Embed Size (px)
Citation preview
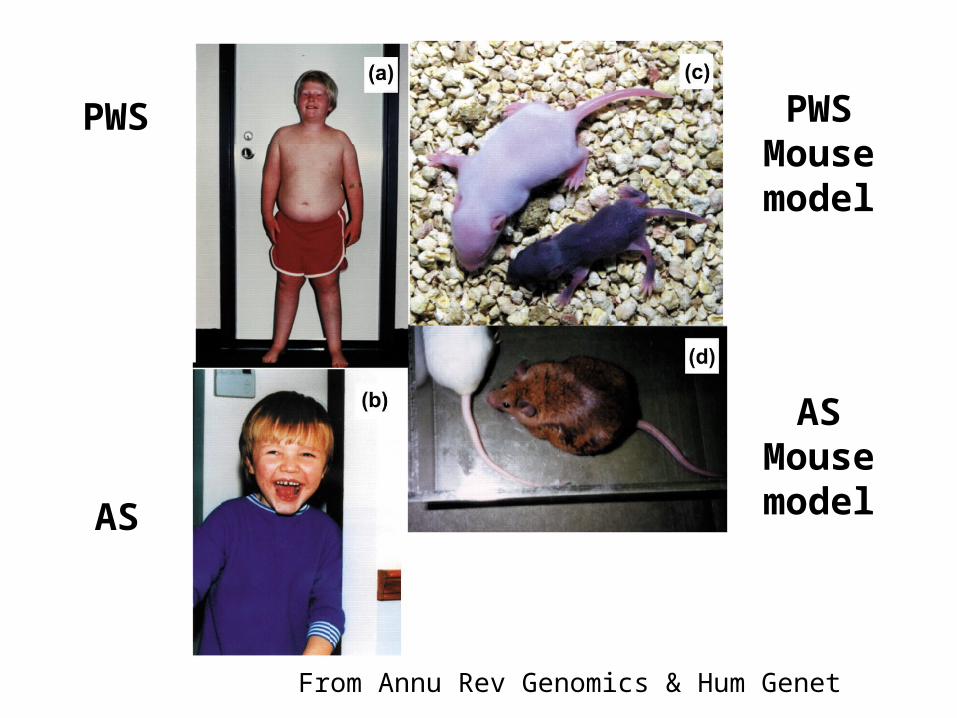
Prader-Willi & Angelman Syndromes
• Both of these genetic disorders are caused by deletion of a region of chromosome 15.
• However, the syndromes differ:– Prader-Willi Syndrome - obesity, mental retardation,
short stature. (abbreviated PWS)
– Angelman Syndrome - uncontrollable laughter, jerky movements, and other motor and mental symptoms. (abbreviated AS)
• Syndrome that develops depends upon the parent that provided the mutant chromosome.
PWS
AS
PWSMousemodel
ASMousemodel
From Annu Rev Genomics & Hum Genet
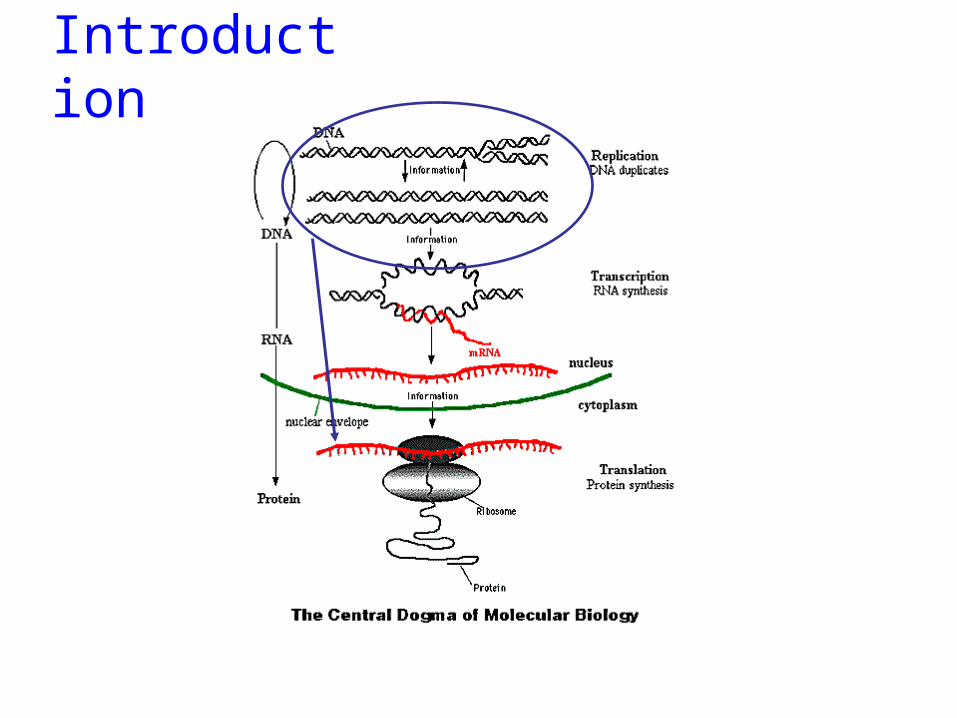
Introduction
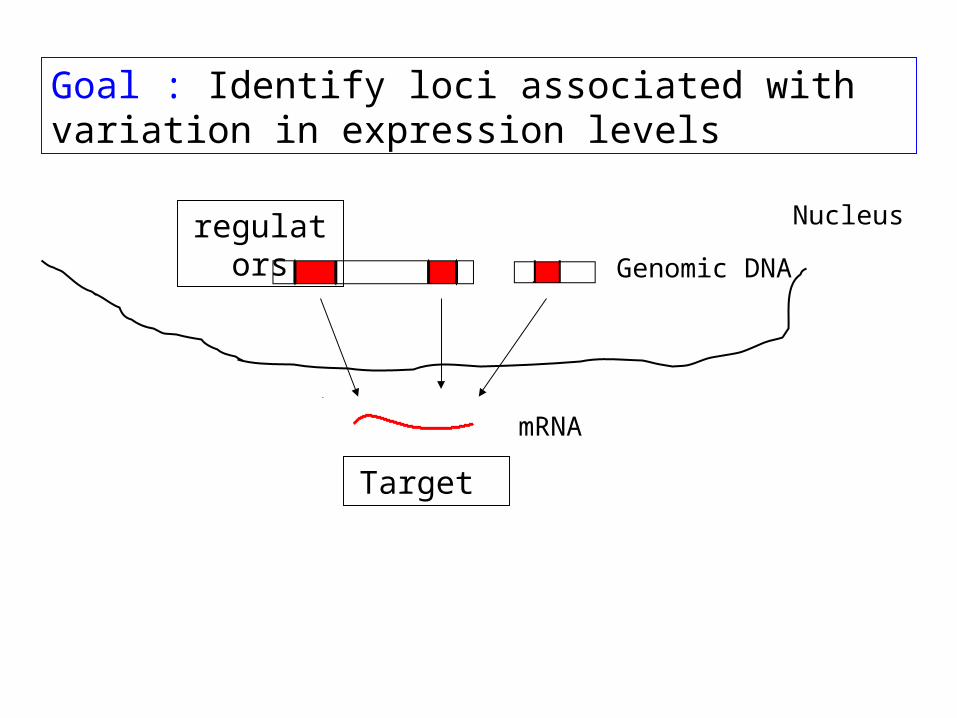
Goal : Identify loci associated with variation in expression levels
Genomic DNA
mRNA
Nucleus
mRNA
regulators
Target
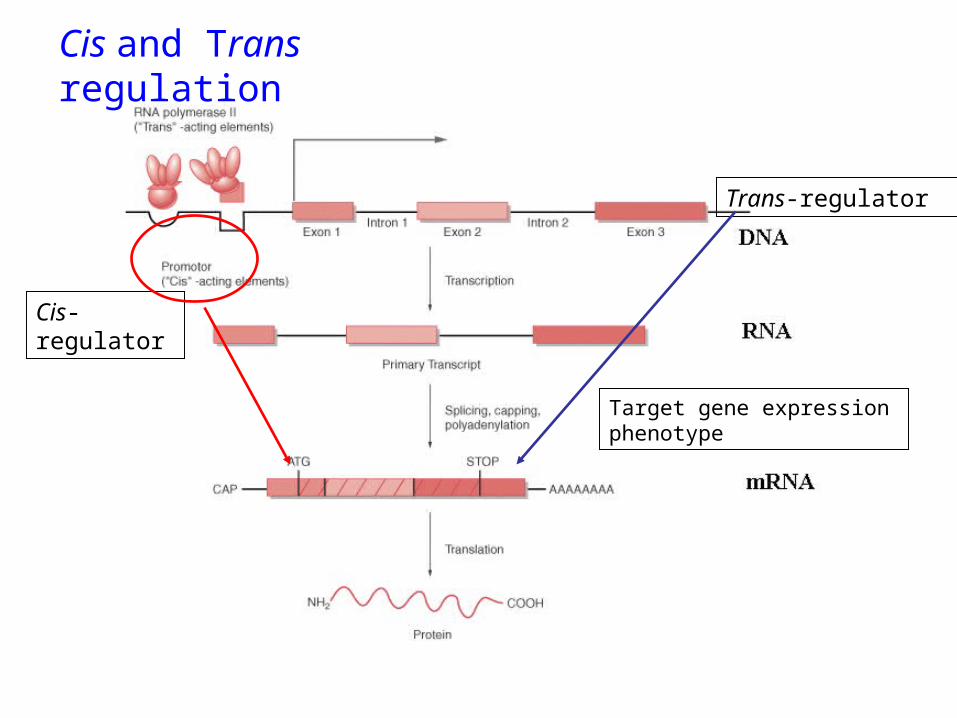
Cis and Trans regulation
Target gene expression phenotype
Cis-regulator
Trans-regulator
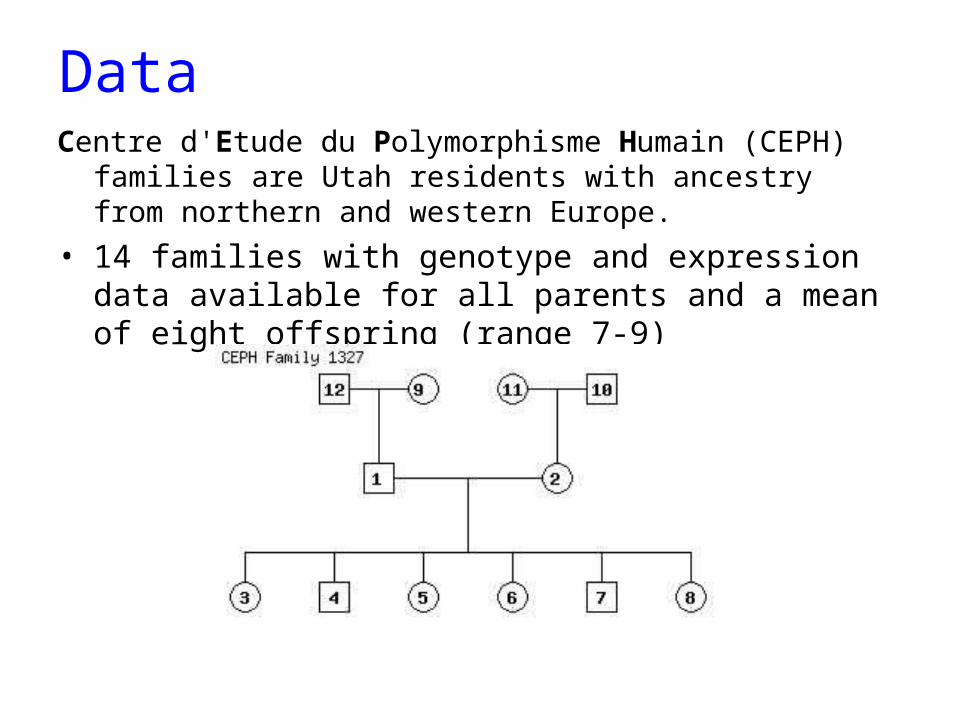
DataCentre d'Etude du Polymorphisme Humain (CEPH) families are Utah
residents with ancestry from northern and western Europe.
• 14 families with genotype and expression data available for all parents and a mean of eight offspring (range 7-9)
A1 A2 A3 A4
A1 A3 A1 A4
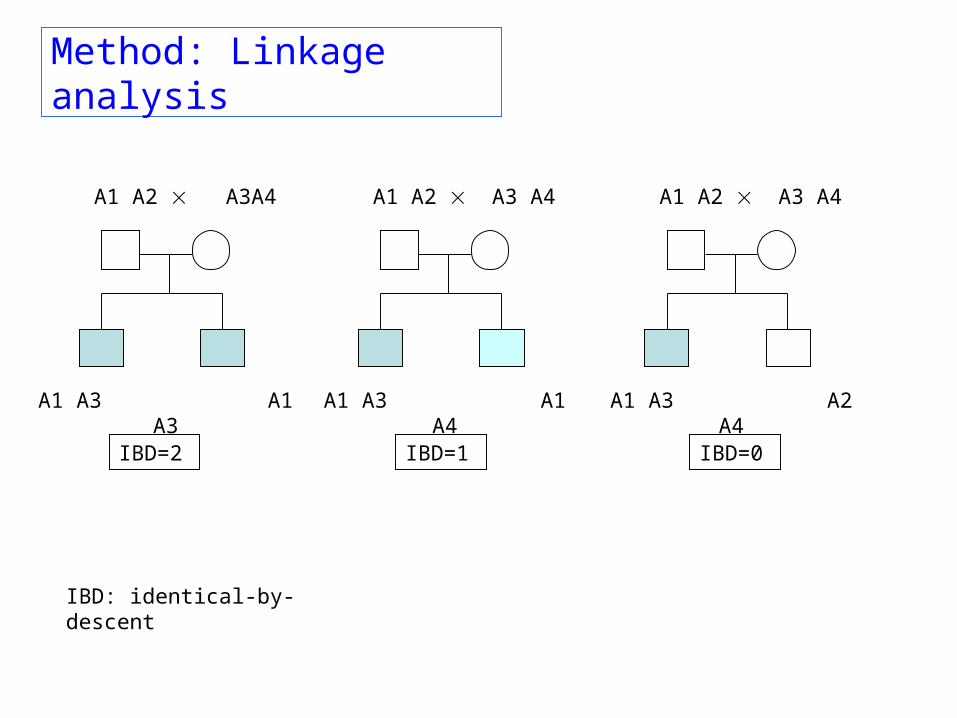
Method: Linkage analysis
A1 A2 A3 A4
A1 A3 A2 A4
A1 A2 A3A4
A1 A3 A1 A3
IBD=2 IBD=1 IBD=0
IBD: identical-by-descent
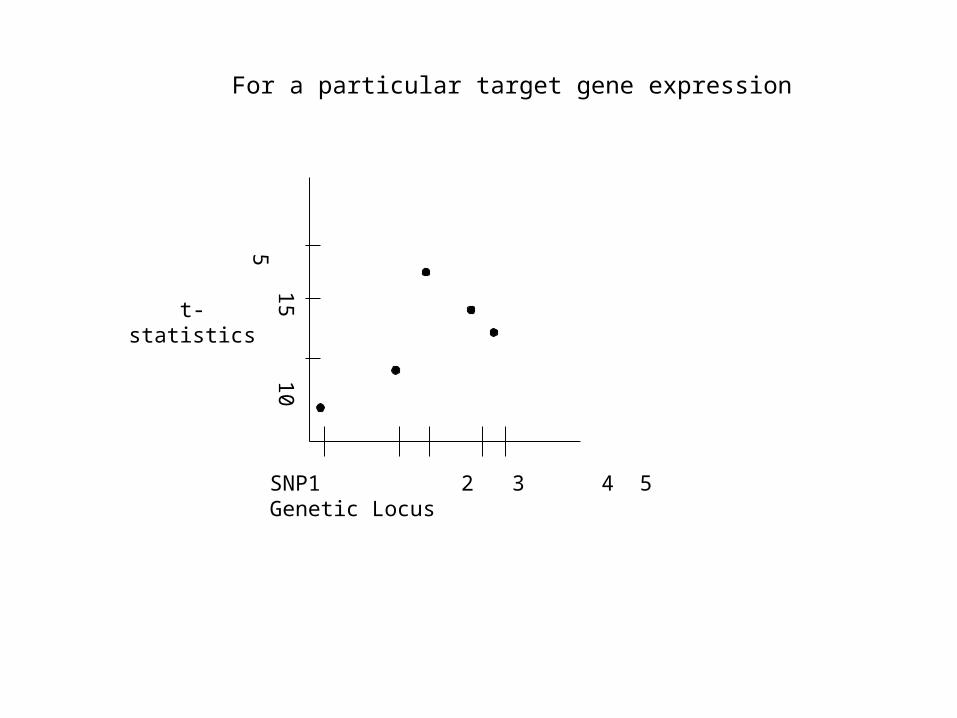
For a particular target gene expression
15 10 5
t-statistics
SNP1 2 3 4 5 Genetic Locus
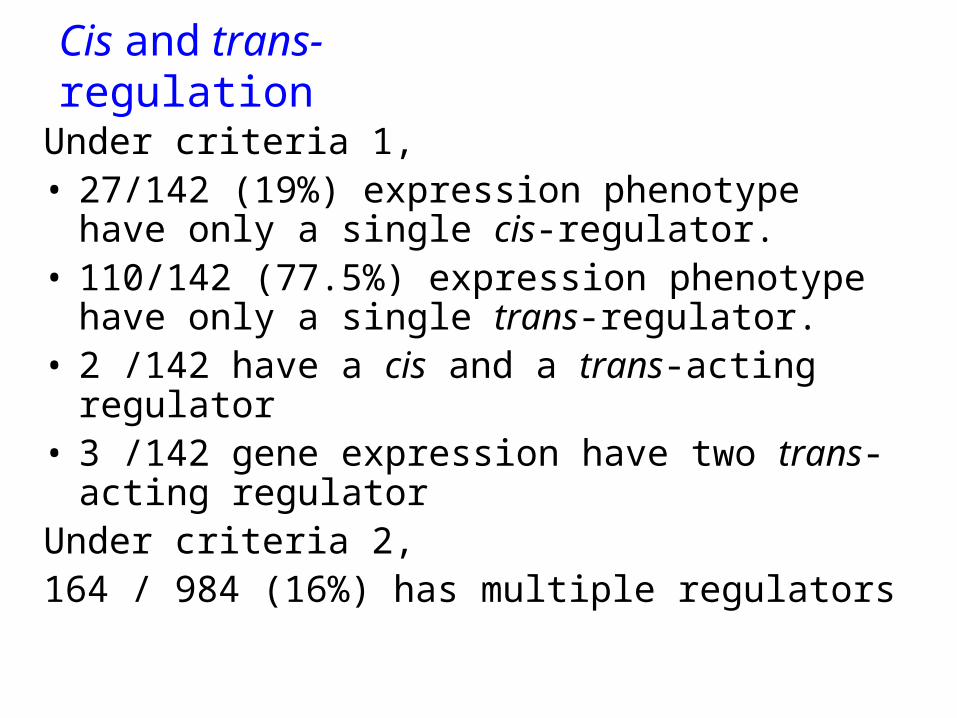
Under criteria 1,• 27/142 (19%) expression phenotype have only a single
cis-regulator.• 110/142 (77.5%) expression phenotype have only a
single trans-regulator.• 2 /142 have a cis and a trans-acting regulator• 3 /142 gene expression have two trans-acting regulator Under criteria 2, 164 / 984 (16%) has multiple regulators
Cis and trans- regulation
Se requiere modelos de regulación de expresión génica
GAL Genes: Eukaryotic Transcriptional Regulation
GAL Genes: Eukaryotic Transcriptional Regulation
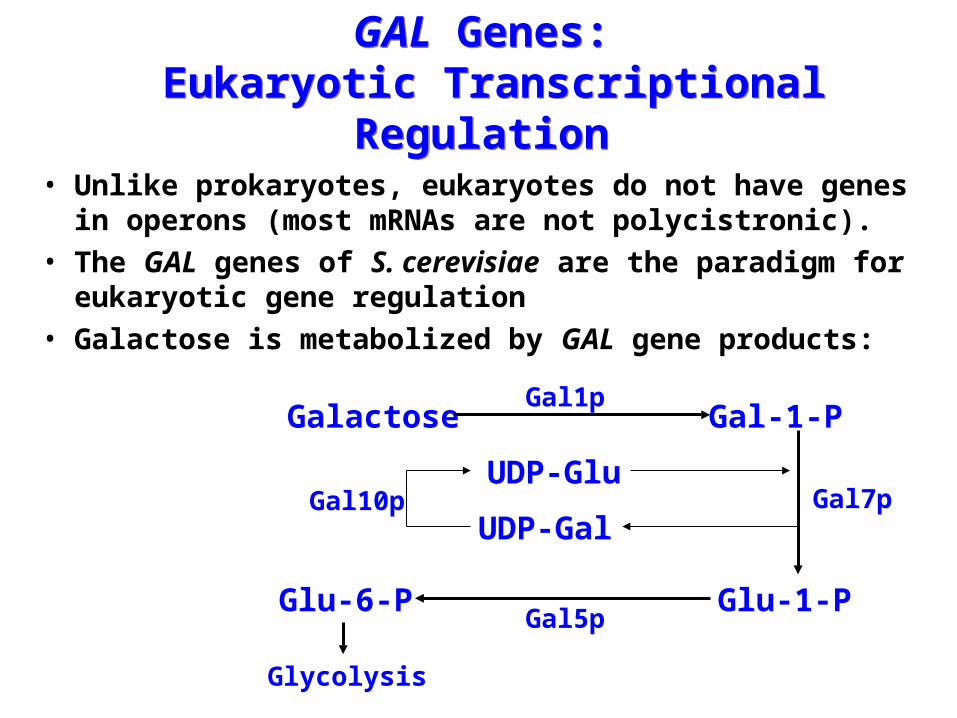
• Unlike prokaryotes, eukaryotes do not have genes in operons (most mRNAs are not polycistronic).
• The GAL genes of S. cerevisiae are the paradigm for eukaryotic gene regulation
• Galactose is metabolized by GAL gene products:
Galactose Gal-1-PGal1p
Glu-1-P
UDP-Glu
UDP-GalGal7pGal10p
Gal5pGlu-6-P
Glycolysis
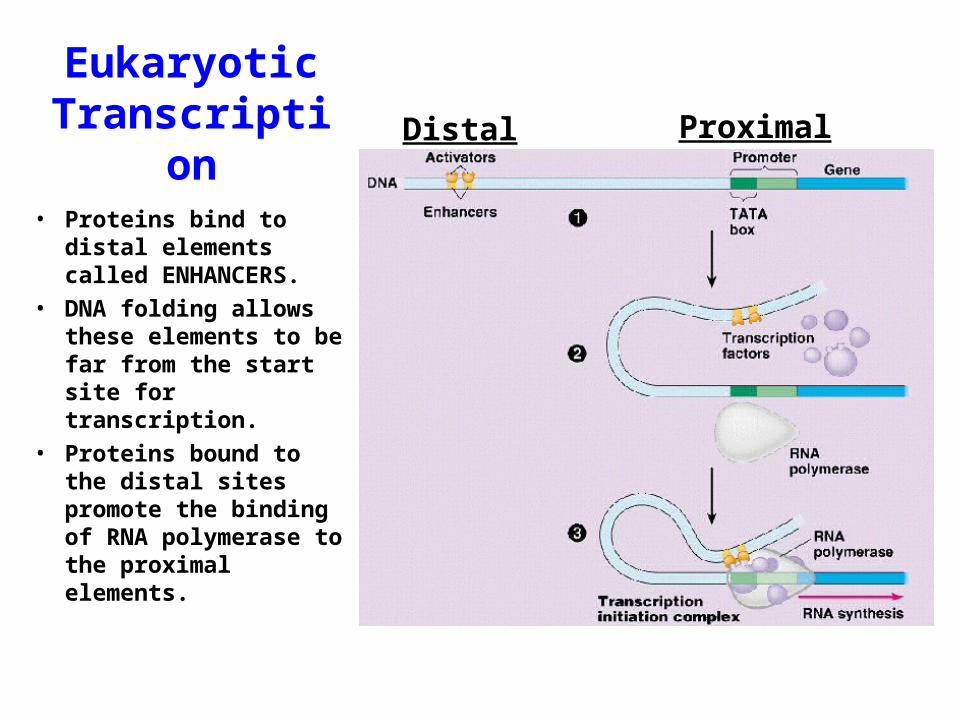
EukaryoticTranscription Distal Proximal
• Proteins bind to distal elements called ENHANCERS.
• DNA folding allows these elements to be far from the start site for transcription.
• Proteins bound to the distal sites promote the binding of RNA polymerase to the proximal elements.
GAL Genes: A Transcriptional ProgramGAL Genes: A Transcriptional Program
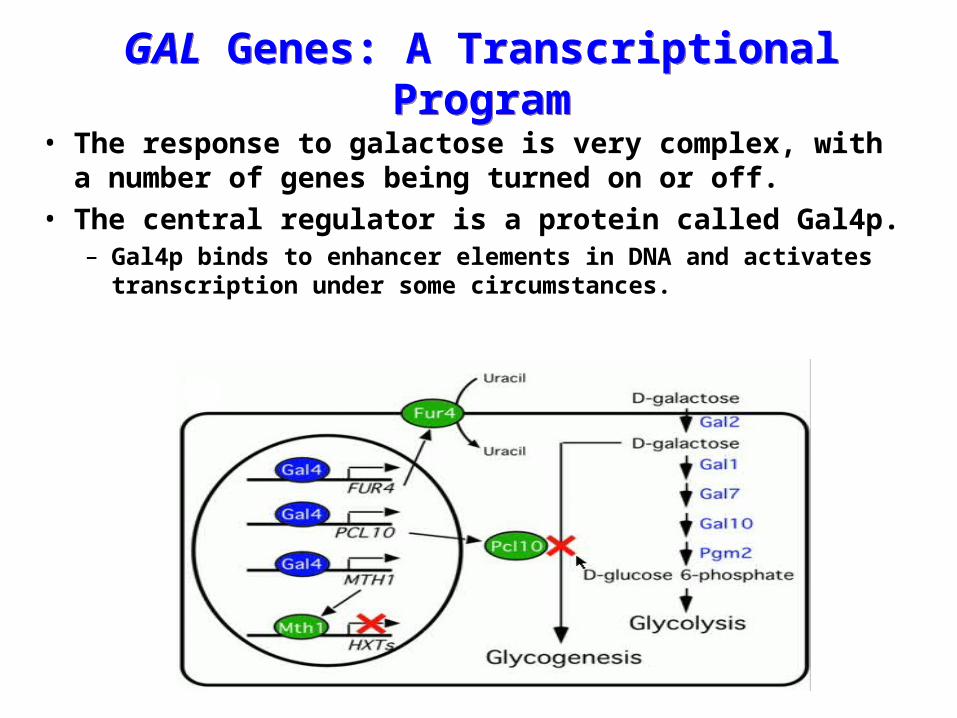
• The response to galactose is very complex, with a number of genes being turned on or off.
• The central regulator is a protein called Gal4p.– Gal4p binds to enhancer elements in DNA and activates
transcription under some circumstances.
Gal4p: A Transcriptional RegulatorGal4p: A Transcriptional Regulator
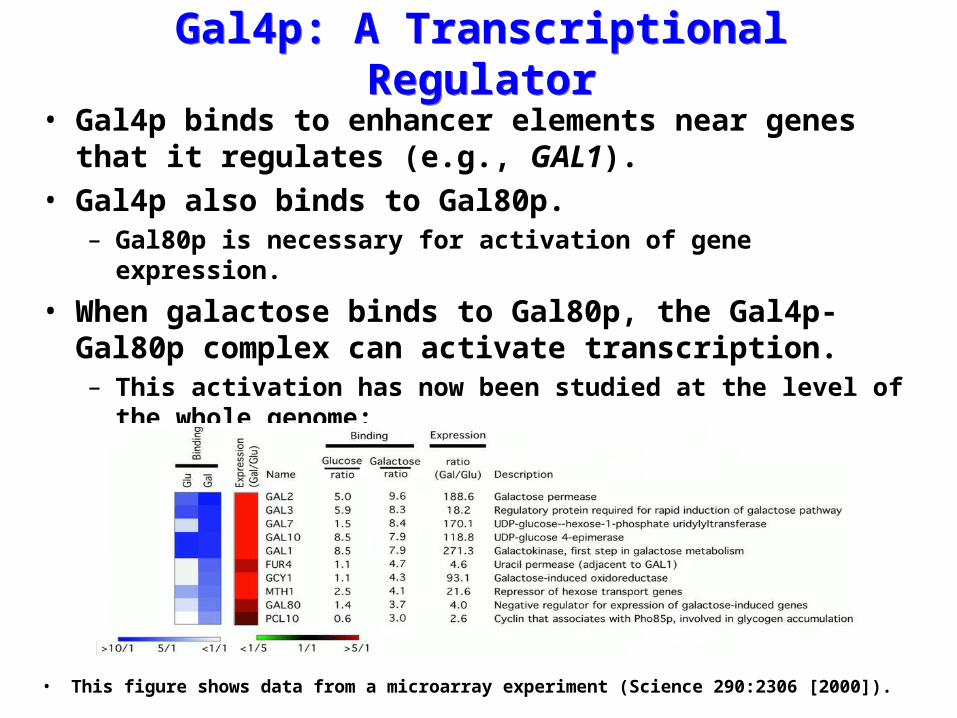
• Gal4p binds to enhancer elements near genes that it regulates (e.g., GAL1).
• Gal4p also binds to Gal80p.– Gal80p is necessary for activation of gene expression.
• When galactose binds to Gal80p, the Gal4p-Gal80p complex can activate transcription.– This activation has now been studied at the level of the whole
genome:
• This figure shows data from a microarray experiment (Science 290:2306 [2000]).
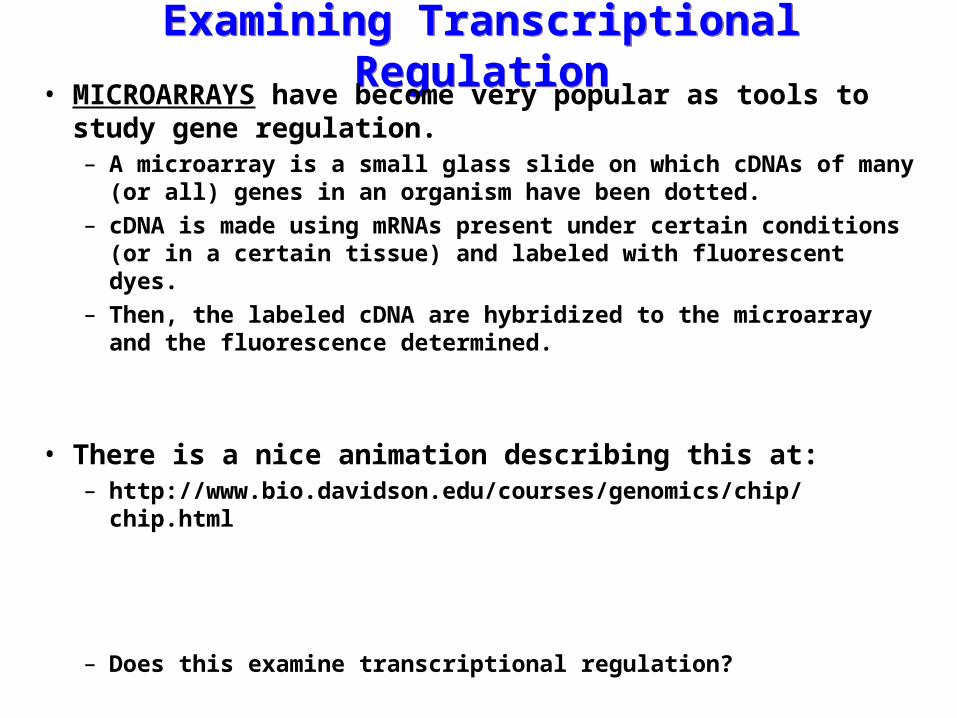
Examining Transcriptional RegulationExamining Transcriptional Regulation• MICROARRAYS have become very popular as tools to
study gene regulation.– A microarray is a small glass slide on which cDNAs of many
(or all) genes in an organism have been dotted.– cDNA is made using mRNAs present under certain conditions
(or in a certain tissue) and labeled with fluorescent dyes.– Then, the labeled cDNA are hybridized to the microarray and
the fluorescence determined.
• There is a nice animation describing this at:– http://www.bio.davidson.edu/courses/genomics/chip/chip.html
– Does this examine transcriptional regulation?
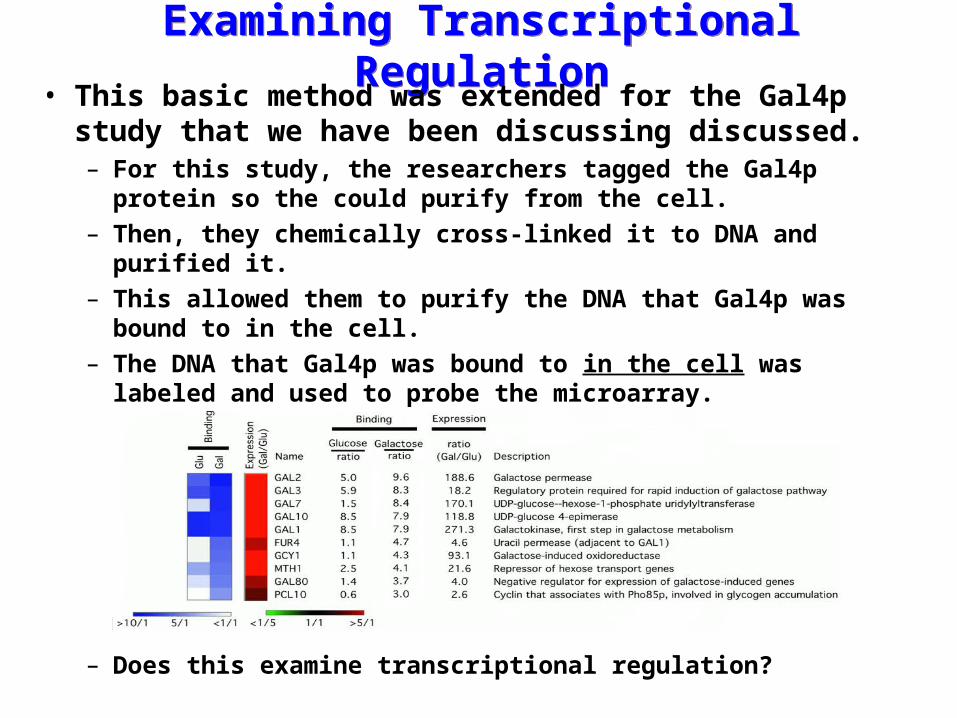
Examining Transcriptional RegulationExamining Transcriptional Regulation• This basic method was extended for the Gal4p study
that we have been discussing discussed.– For this study, the researchers tagged the Gal4p protein so the
could purify from the cell.– Then, they chemically cross-linked it to DNA and purified it.– This allowed them to purify the DNA that Gal4p was bound to
in the cell.– The DNA that Gal4p was bound to in the cell was labeled and
used to probe the microarray.
– Does this examine transcriptional regulation?
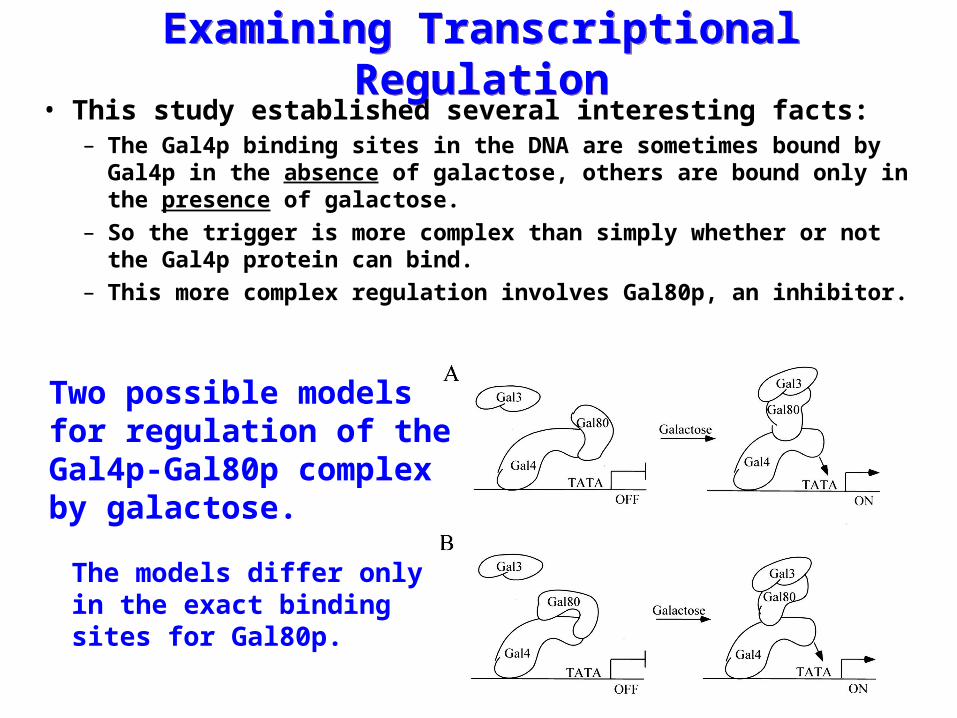
Examining Transcriptional RegulationExamining Transcriptional Regulation• This study established several interesting facts:
– The Gal4p binding sites in the DNA are sometimes bound by Gal4p in the absence of galactose, others are bound only in the presence of galactose.
– So the trigger is more complex than simply whether or not the Gal4p protein can bind.
– This more complex regulation involves Gal80p, an inhibitor.
Two possible modelsfor regulation of theGal4p-Gal80p complex by galactose.
The models differ onlyin the exact bindingsites for Gal80p.
How do Eukaryotic Transcriptional Regulators Work?
How do Eukaryotic Transcriptional Regulators Work?
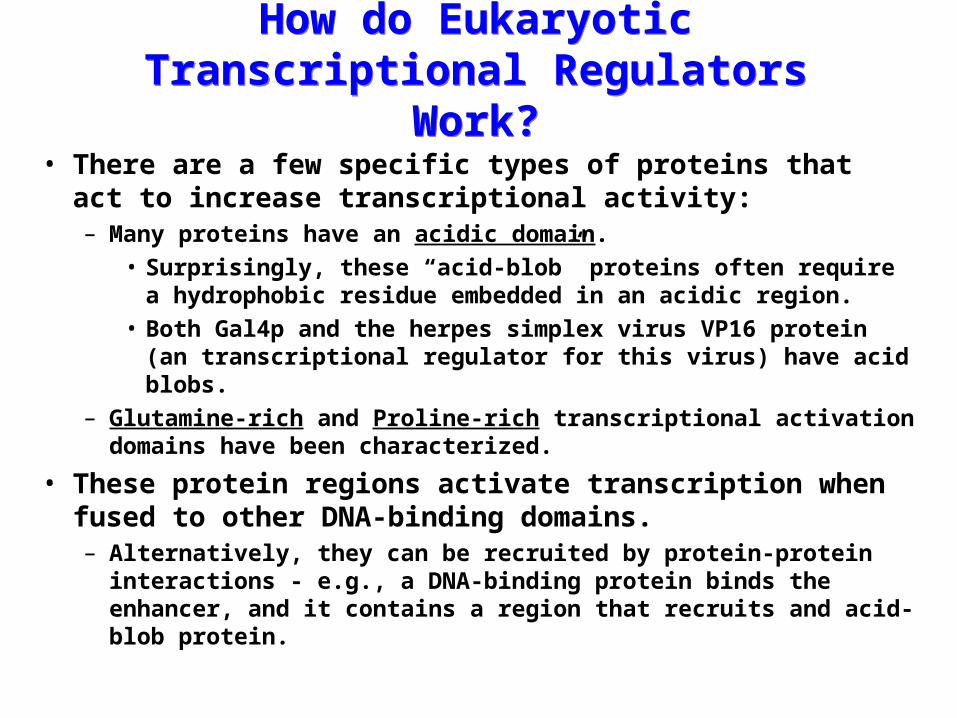
• There are a few specific types of proteins that act to increase transcriptional activity:– Many proteins have an acidic domain.
• Surprisingly, these “acid-blob” proteins often require a hydrophobic residue embedded in an acidic region.
• Both Gal4p and the herpes simplex virus VP16 protein (an transcriptional regulator for this virus) have acid blobs.
– Glutamine-rich and Proline-rich transcriptional activation domains have been characterized.
• These protein regions activate transcription when fused to other DNA-binding domains.– Alternatively, they can be recruited by protein-protein
interactions - e.g., a DNA-binding protein binds the enhancer, and it contains a region that recruits and acid-blob protein.
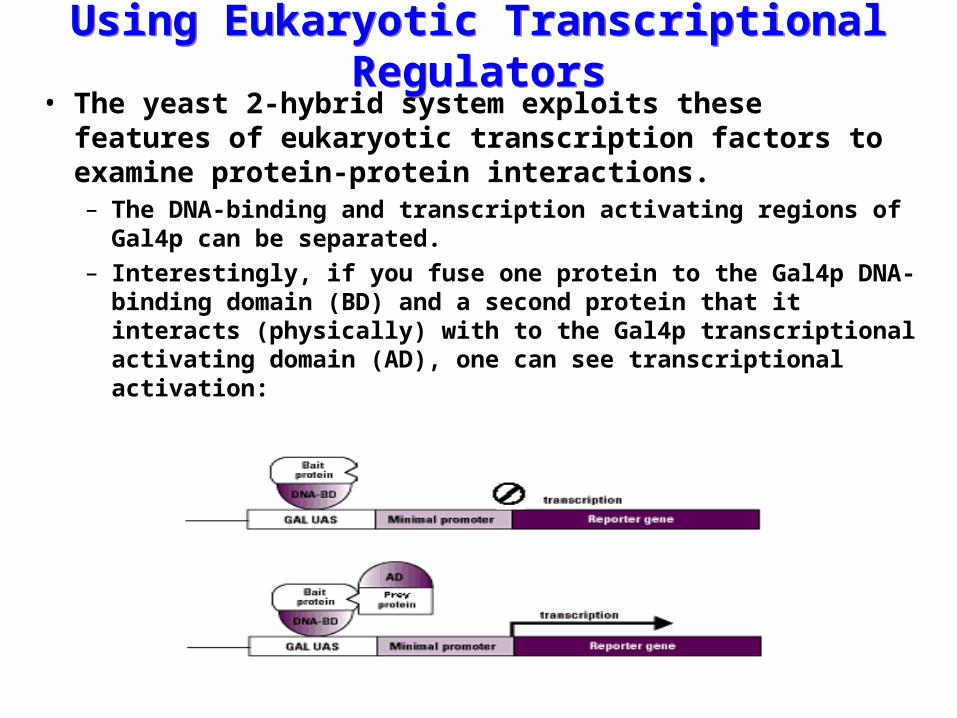
Using Eukaryotic Transcriptional RegulatorsUsing Eukaryotic Transcriptional Regulators• The yeast 2-hybrid system exploits these features of
eukaryotic transcription factors to examine protein-protein interactions.– The DNA-binding and transcription activating regions of Gal4p
can be separated.– Interestingly, if you fuse one protein to the Gal4p DNA-binding
domain (BD) and a second protein that it interacts (physically) with to the Gal4p transcriptional activating domain (AD), one can see transcriptional activation:
How do Eukaryotic Transcriptional Regulators Work?
How do Eukaryotic Transcriptional Regulators Work?
• Another interesting phenomenon that is sometimes seen with transcription factor is SQUELCHING.– Overexpression of transcription activators like Gal4p can
result in a general inhibition of transcriptional activity.– How does this happen?
– Presumably, specific transcription factors like Gal4p act by recruiting “basal” transcription factors.
• In fact, some basal factors that physically interact with these transcription activating domains have been found.
• Basal factors are factors involved in recruiting RNA polymerase II to a large number of promoters.
– So overexpressing proteins with these transcription activating domains can actually turn gene expression off, by competing for these factors.
How do Eukaryotic Transcriptional Regulators Work?
• At least one way is by altering the packing of DNA into chromatin.
• The role of chromatin structure in the regulation of transcription is an area of very active investigation.
• However, two important factors that play clear roles in transcriptional regulation are known:– DNA METHYLATION - A subset of cytosine (C) residues are
modified by methylation.– HISTONE ACETYLATION - Histones can be modified by
acetylation.
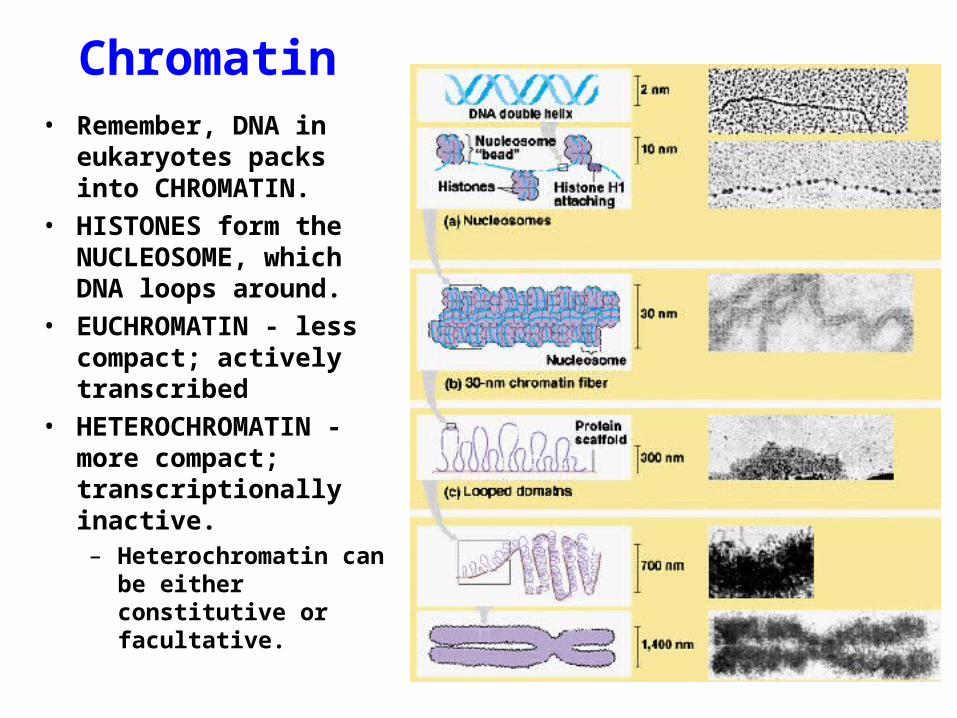
Chromatin• Remember, DNA in
eukaryotes packs into CHROMATIN.
• HISTONES form the NUCLEOSOME, which DNA loops around.
• EUCHROMATIN - less compact; actively transcribed
• HETEROCHROMATIN - more compact; transcriptionally inactive.– Heterochromatin can be
either constitutive or facultative.
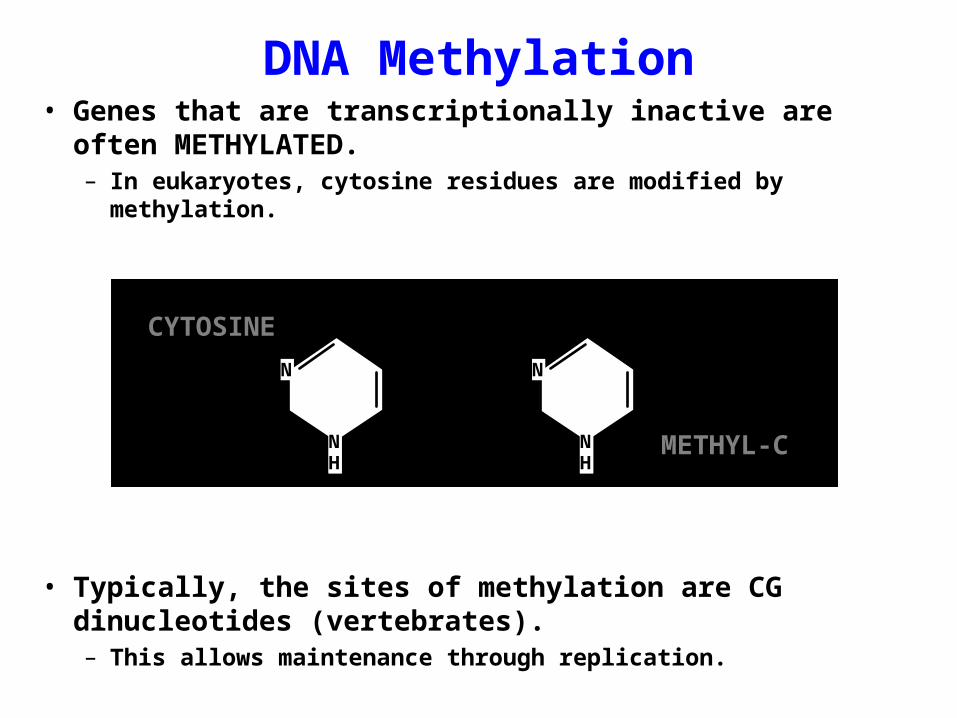
DNA Methylation• Genes that are transcriptionally inactive are often
METHYLATED.– In eukaryotes, cytosine residues are modified by methylation.
• Typically, the sites of methylation are CG dinucleotides (vertebrates).– This allows maintenance through replication.
NH2
O NHNH
N
NH2
O NHNH
NCH3
CYTOSINE
METHYL-C
Histone Acetylation
• HISTONES in transcriptionally active genes are often ACETYLATED.
• Acetylation is the modification of lysine residues in histones.– Reduces positive charge, weakens the interaction with DNA.– Makes DNA more accessible to RNA polymerase II
• Enzymes that ACETYLATE HISTONES are recruited to actively transcribed genes.
• Enzymes that remove acetyl groups from histones are recruited to methylated DNA.– There are additional types of histone modification as well,
such as methylation of the histones.
Genetic Imprinting
• Remember that DNA methylation can be maintained through replication.
• This allows the packing of chromatin to be passed on - just like a gene sequence.– However, differences in chromatin packing are not as stable
as gene sequences.• Heritable but potentially reversible changes in gene
expression are called EPIGENETIC phenomena– Vertebrates use these differences in chromatin packing to
IMPRINT certain patterns of gene regulation.– Some genes show MATERNAL IMPRINTING while other show
PATERNAL IMPRINTING.• The alleles of some genes that are inherited from the
relevant parent are methylated, and therefore are not expressed.

Prader-Willi & Angelman Syndromes
• Both of these genetic disorders are caused by deletion of a region of chromosome 15.
• However, the syndromes differ:– Prader-Willi Syndrome - obesity, mental retardation,
short stature. (abbreviated PWS)
– Angelman Syndrome - uncontrollable laughter, jerky movements, and other motor and mental symptoms. (abbreviated AS)
• Syndrome that develops depends upon the parent that provided the mutant chromosome.

PWS
AS
PWSMousemodel
ASMousemodel
From Annu Rev Genomics & Hum Genet
Prader-Willi & Angelman Syndromes
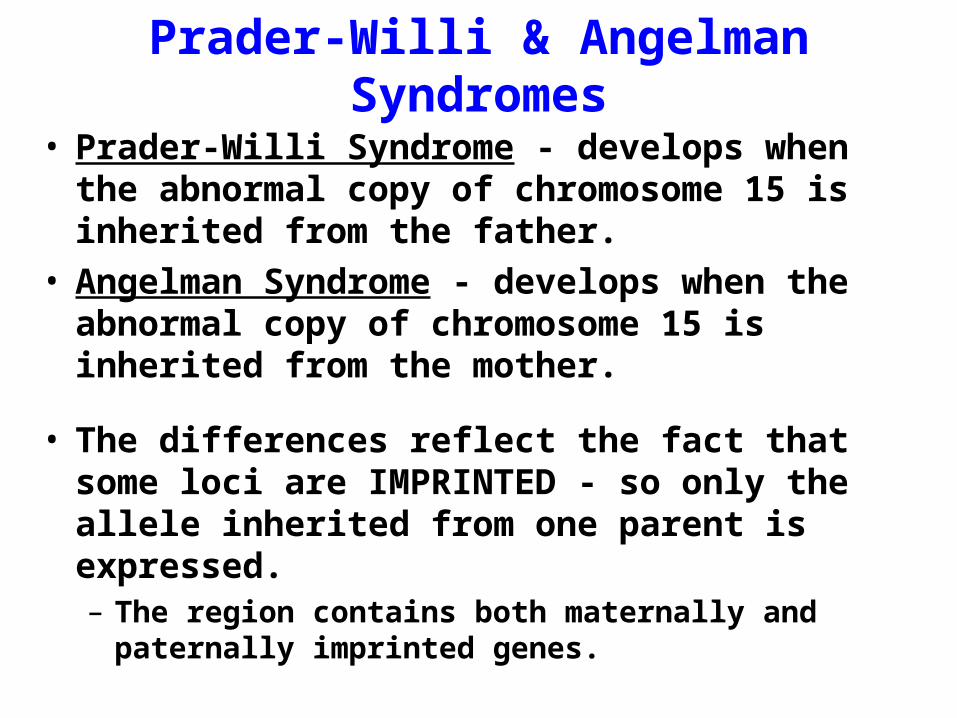
• Prader-Willi Syndrome - develops when the abnormal copy of chromosome 15 is inherited from the father.
• Angelman Syndrome - develops when the abnormal copy of chromosome 15 is inherited from the mother.
• The differences reflect the fact that some loci are IMPRINTED - so only the allele inherited from one parent is expressed.– The region contains both maternally and paternally
imprinted genes.
Methylation and Gene Regulation
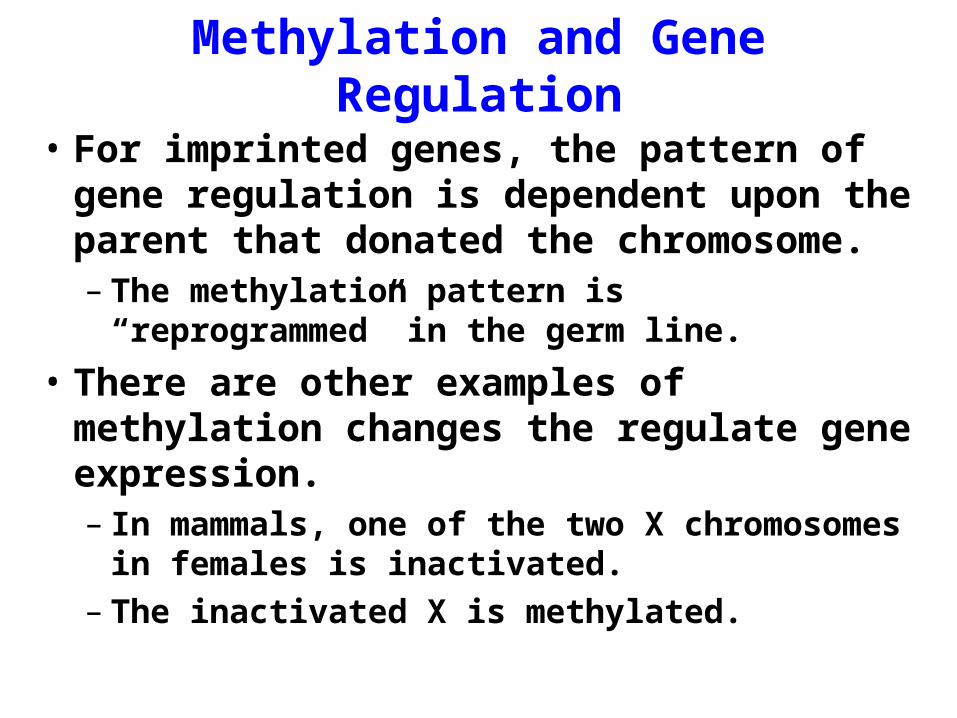
• For imprinted genes, the pattern of gene regulation is dependent upon the parent that donated the chromosome.– The methylation pattern is “reprogrammed”
in the germ line.
• There are other examples of methylation changes the regulate gene expression.– In mammals, one of the two X chromosomes
in females is inactivated.– The inactivated X is methylated.
POR LO TANTO EXPRESION DE GENES ES IMPORTANTE
PARA ENTENDER HERENCIA GENETICA
Genomics, Bioinformatics, and Gene Regulation
Marc S. Halfon, [email protected]
Department of BiochemistryCenter of Excellence in Bioinformatics and the Life Sciences
Based on presentation for UB/CCR Summer Program in Bioinformatics 2004
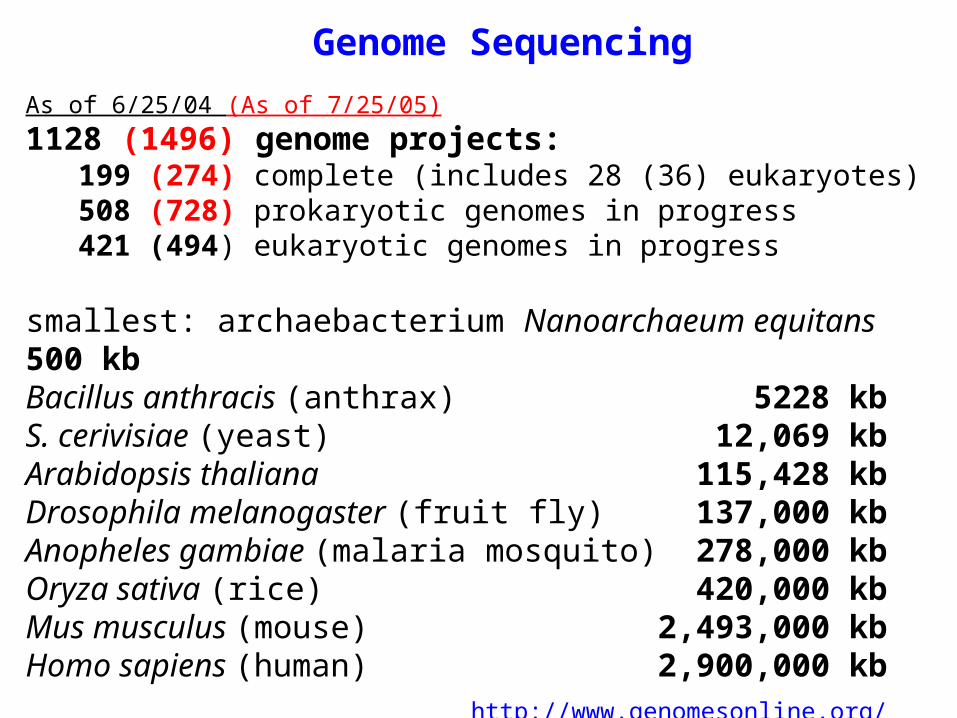
As of 6/25/04 (As of 7/25/05)
1128 (1496) genome projects: 199 (274) complete (includes 28 (36) eukaryotes) 508 (728) prokaryotic genomes in progress 421 (494) eukaryotic genomes in progress
smallest: archaebacterium Nanoarchaeum equitans 500 kbBacillus anthracis (anthrax) 5228 kbS. cerivisiae (yeast) 12,069 kbArabidopsis thaliana 115,428 kbDrosophila melanogaster (fruit fly) 137,000 kbAnopheles gambiae (malaria mosquito) 278,000 kbOryza sativa (rice) 420,000 kbMus musculus (mouse) 2,493,000 kbHomo sapiens (human) 2,900,000 kb
http://www.genomesonline.org/
Genome Sequencing
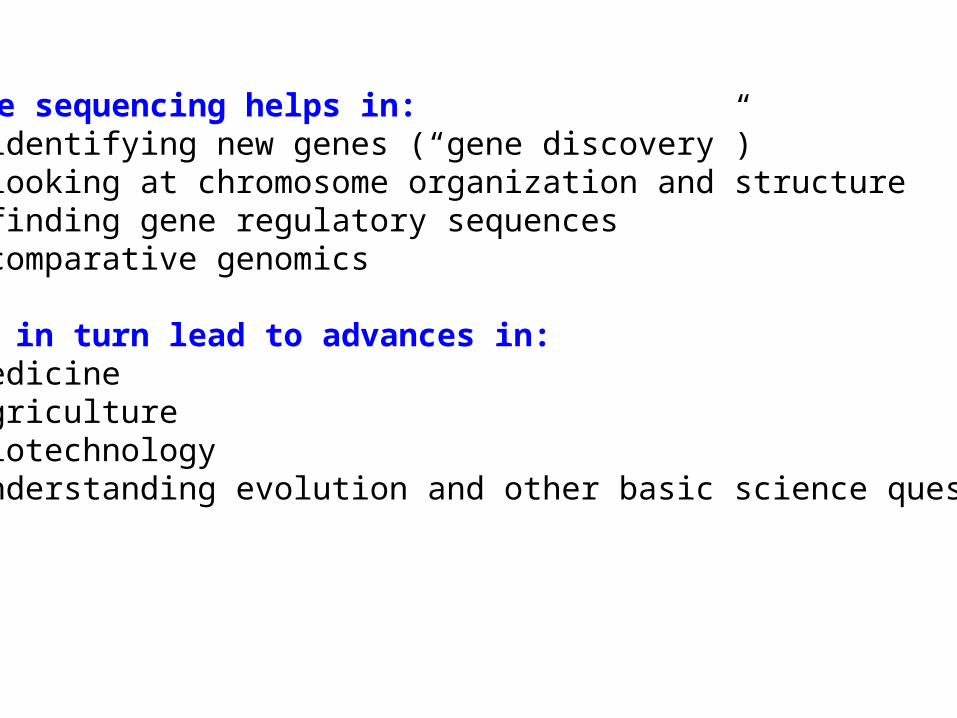
Genome sequencing helps in:• identifying new genes (“gene discovery”) • looking at chromosome organization and structure• finding gene regulatory sequences• comparative genomics
These in turn lead to advances in: •medicine•agriculture•biotechnology •understanding evolution and other basic science questions
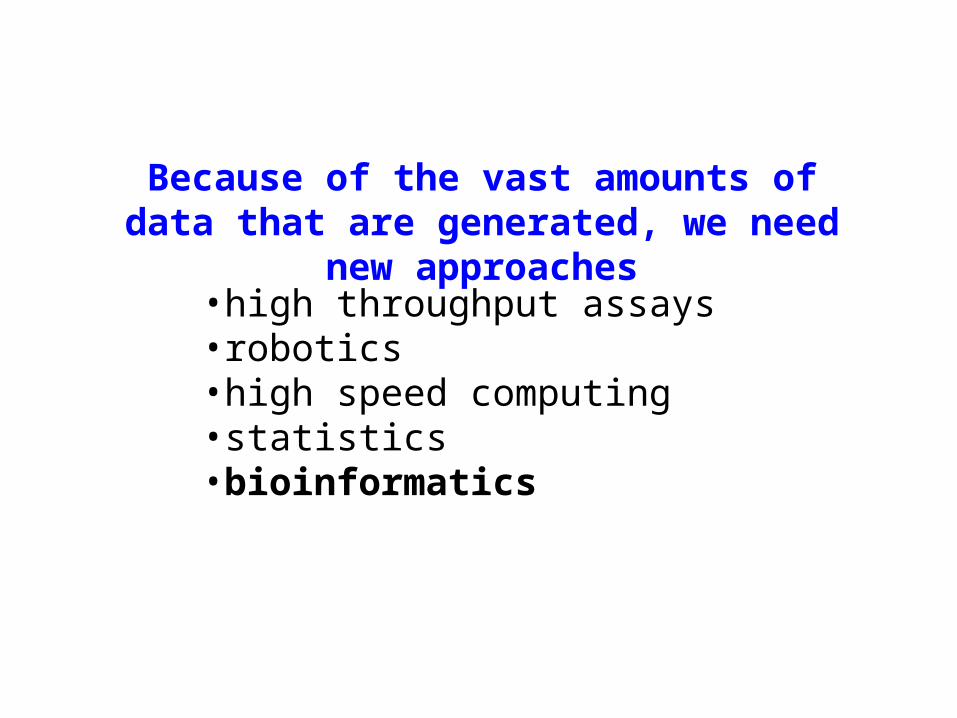
•high throughput assays•robotics•high speed computing•statistics •bioinformatics
Because of the vast amounts of data that are generated, we need new approaches
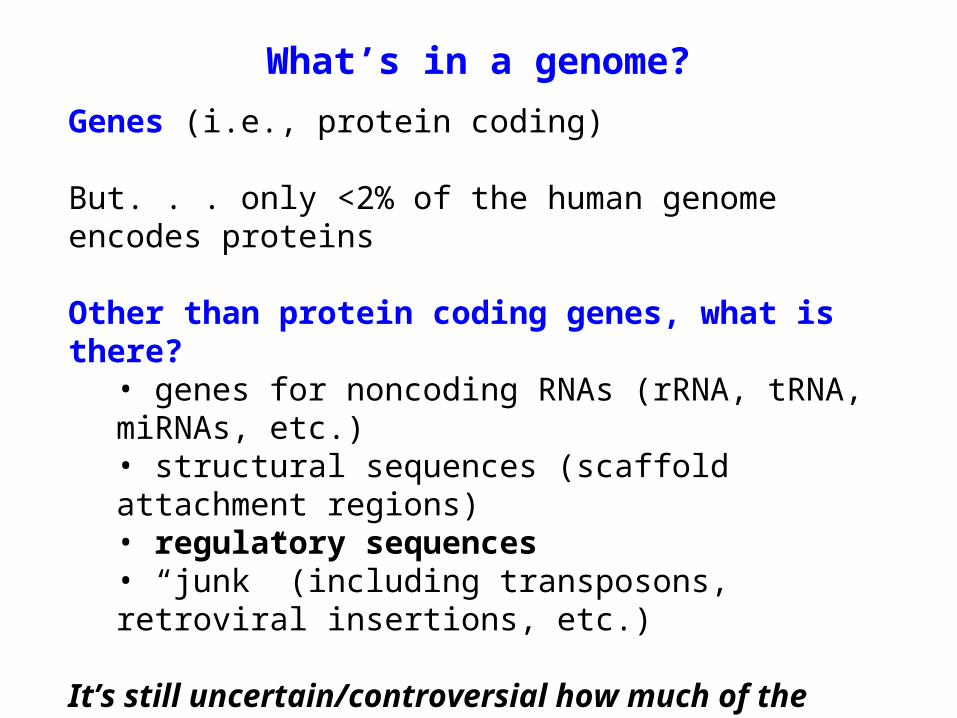
Genes (i.e., protein coding)
But. . . only <2% of the human genome encodes proteins
Other than protein coding genes, what is there?• genes for noncoding RNAs (rRNA, tRNA, miRNAs, etc.)• structural sequences (scaffold attachment regions)• regulatory sequences• “junk” (including transposons, retroviral insertions, etc.)
It’s still uncertain/controversial how much of the genome is composed of any of these classes
The answers will come from experimentation and bioinformatics. We will discuss further only gene regulation.
What’s in a genome?
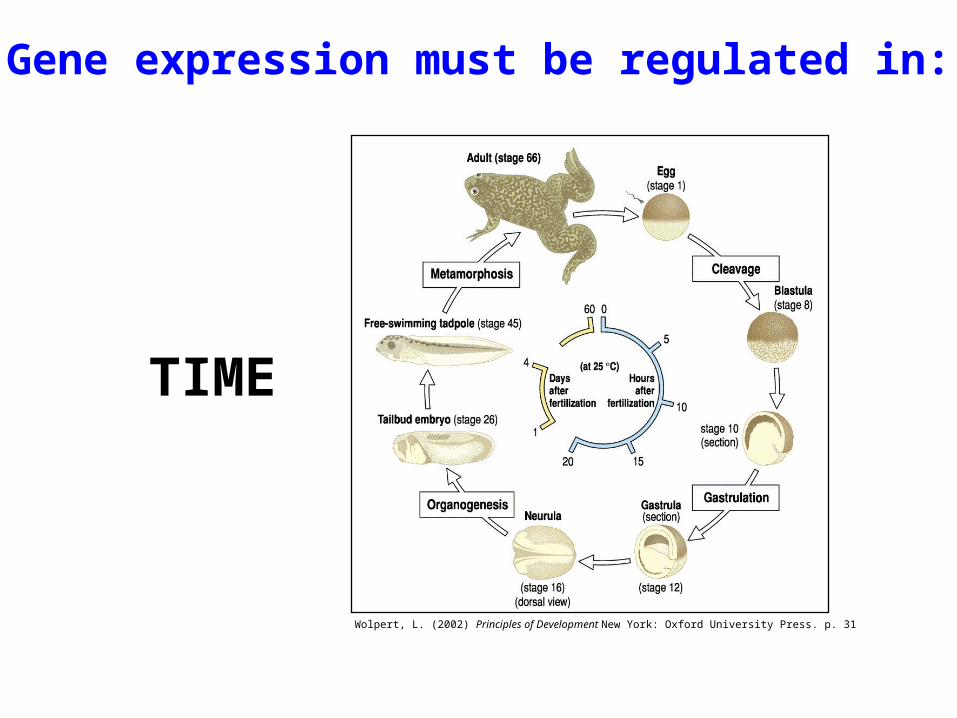
Gene expression must be regulated in:
TIME
Wolpert, L. (2002) Principles of Development New York: Oxford University Press. p. 31
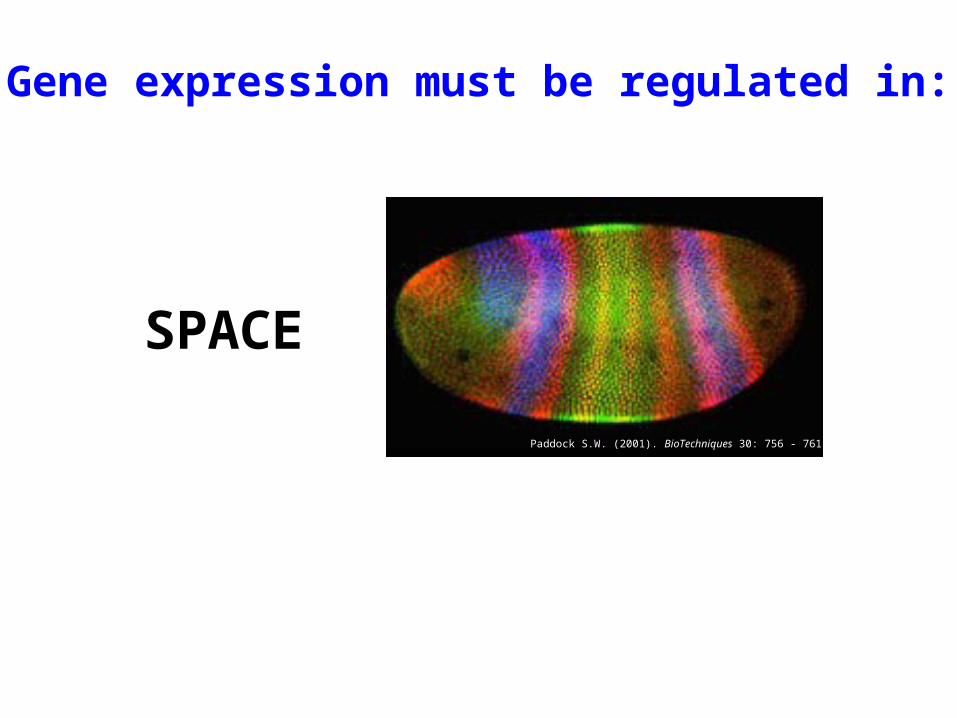
SPACE
Gene expression must be regulated in:
Paddock S.W. (2001). BioTechniques 30: 756 - 761.
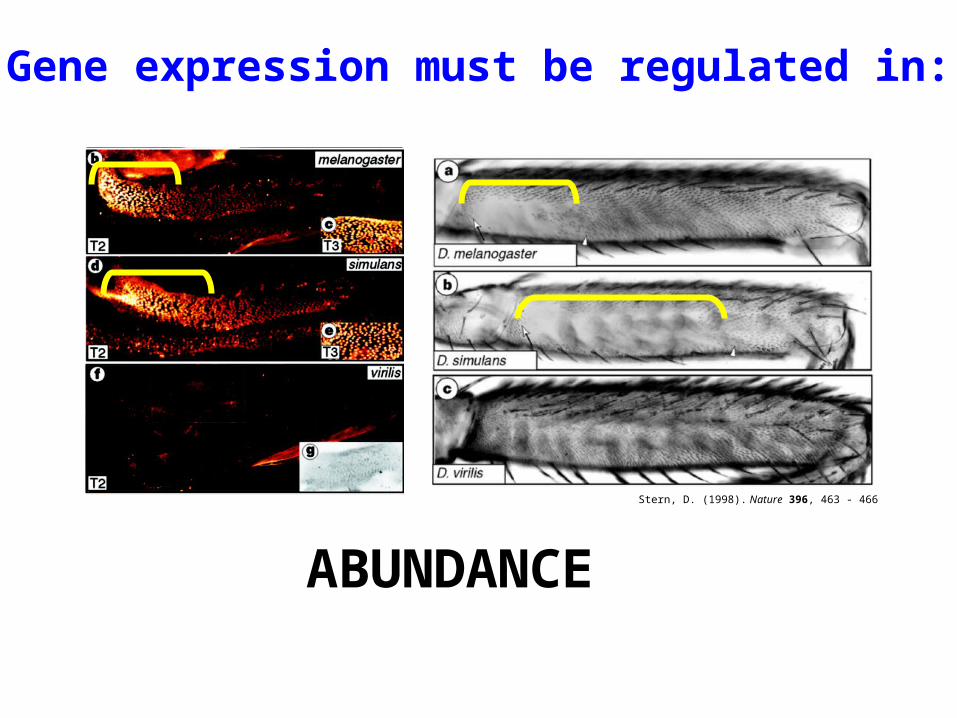
ABUNDANCE
Gene expression must be regulated in:
Stern, D. (1998). Nature 396, 463 - 466
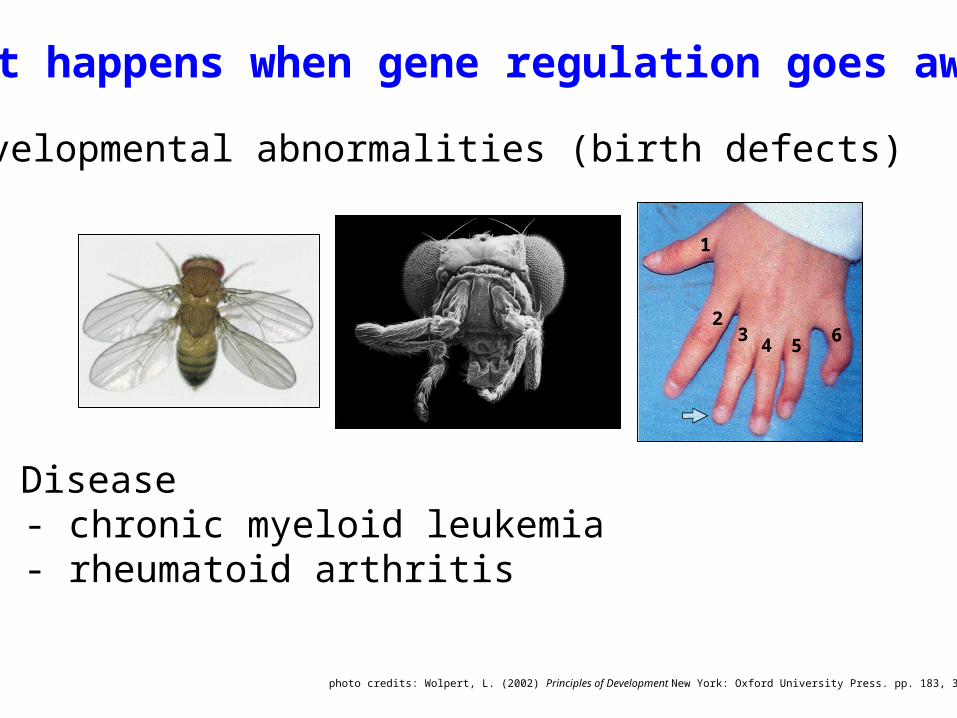
What happens when gene regulation goes awry?
• Disease- chronic myeloid leukemia- rheumatoid arthritis
1
23
4 56
• Developmental abnormalities (birth defects)
photo credits: Wolpert, L. (2002) Principles of Development New York: Oxford University Press. pp. 183, 340
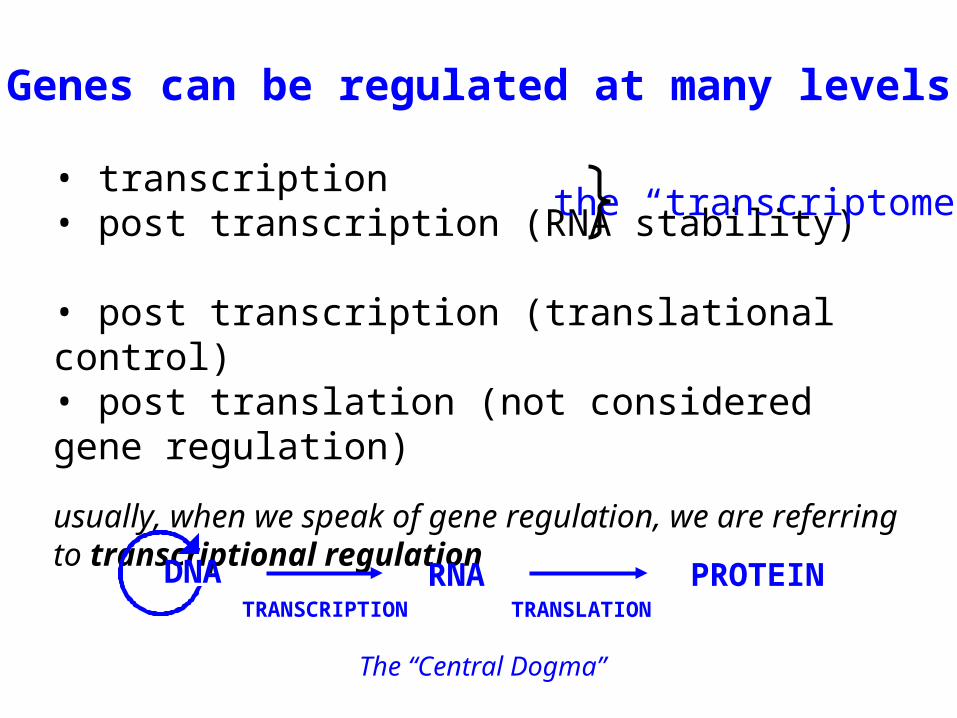
• transcription• post transcription (RNA stability)
• post transcription (translational control)• post translation (not considered gene regulation)
usually, when we speak of gene regulation, we are referring to transcriptional regulation
the “transcriptome”
Genes can be regulated at many levels
RNA PROTEINDNATRANSCRIPTION TRANSLATION
The “Central Dogma”
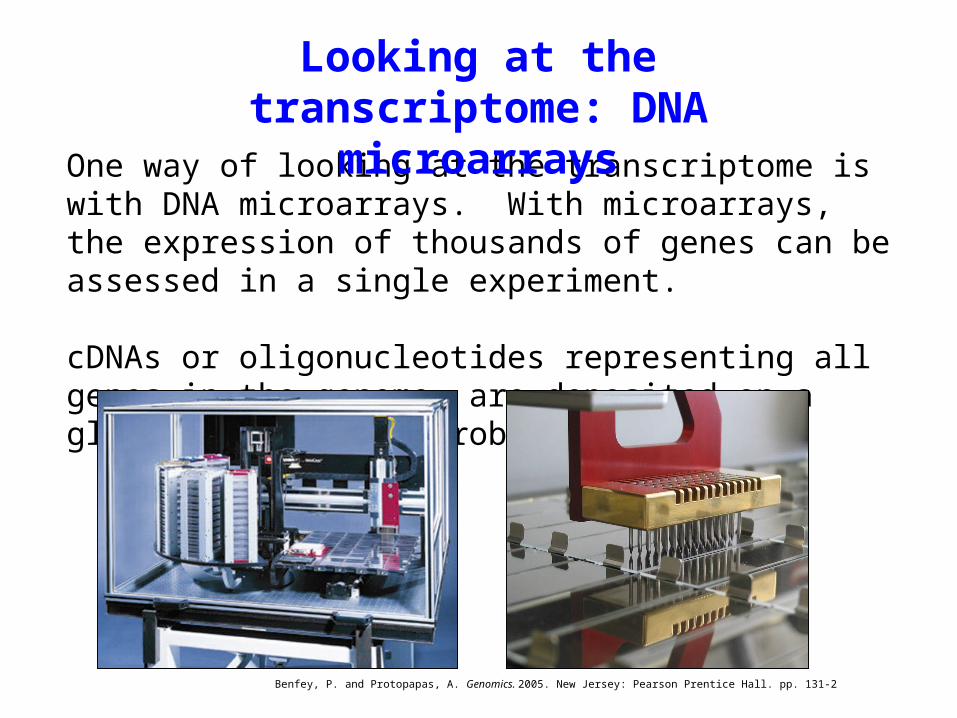
One way of looking at the transcriptome is with DNA microarrays. With microarrays, the expression of thousands of genes can be assessed in a single experiment.
cDNAs or oligonucleotides representing all genes in the genome are deposited on a glass slide using a robotic arrayer:
Looking at the transcriptome: DNA
microarrays
Benfey, P. and Protopapas, A. Genomics. 2005. New Jersey: Pearson Prentice Hall. pp. 131-2
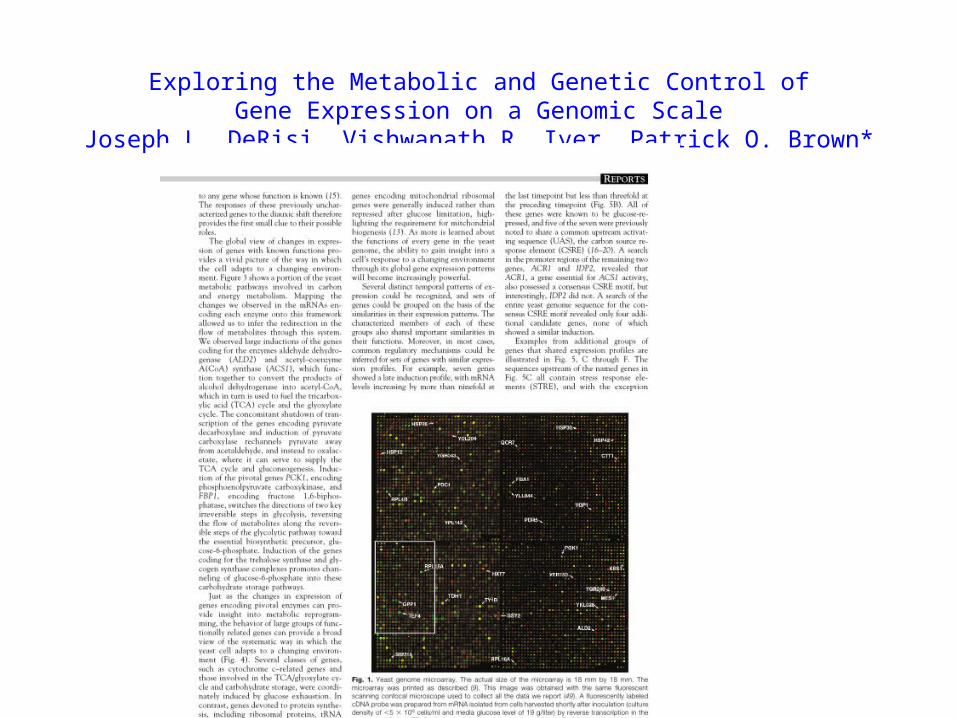
Exploring the Metabolic and Genetic Control ofGene Expression on a Genomic Scale
Joseph L. DeRisi, Vishwanath R. Iyer, Patrick O. Brown*
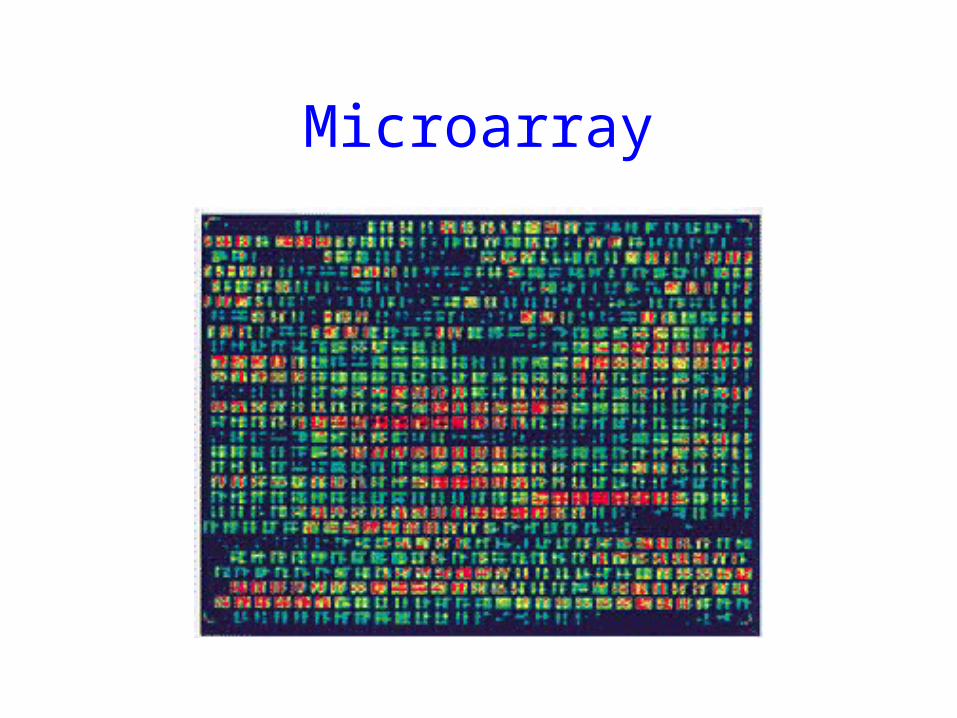
Microarray
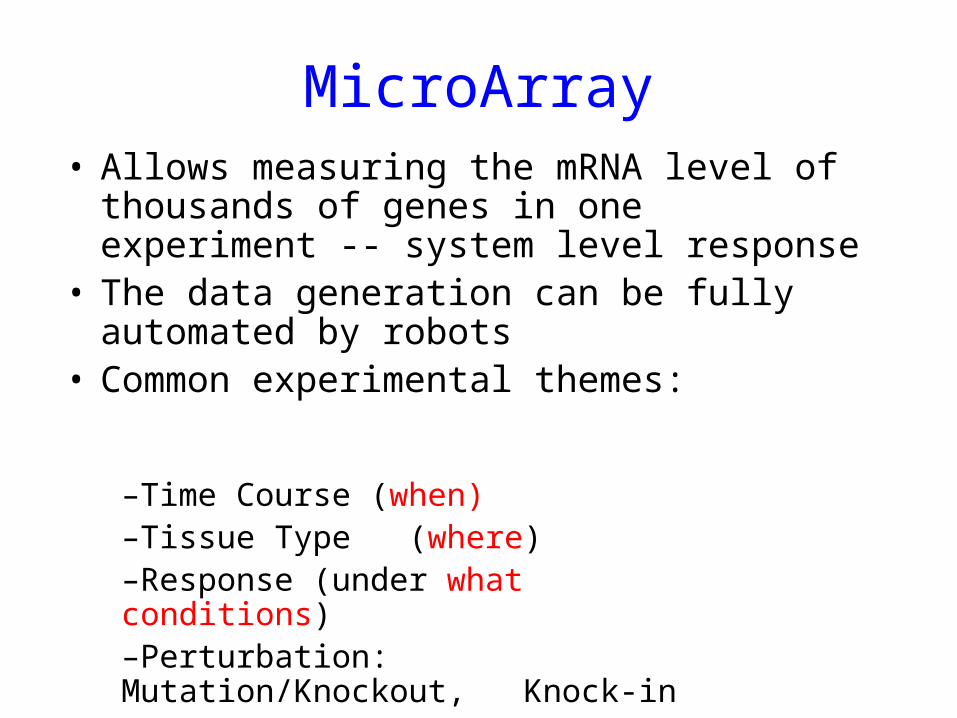
MicroArray• Allows measuring the mRNA level of thousands
of genes in one experiment -- system level response
• The data generation can be fully automated by robots
• Common experimental themes:
–Time Course (when)–Tissue Type (where)–Response (under what conditions)–Perturbation: Mutation/Knockout, Knock-in Over-expression
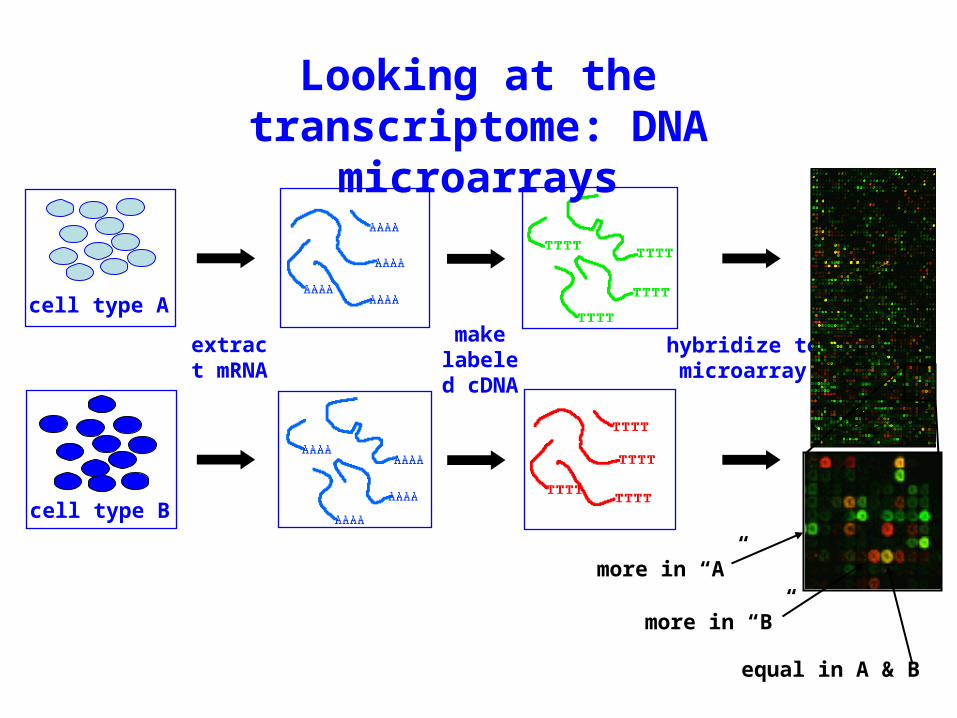
Looking at the transcriptome: DNA
microarrays
extract mRNA
make labeled cDNA
hybridize to microarray
cell type A
cell type B
more in “A”
more in “B”
equal in A & B
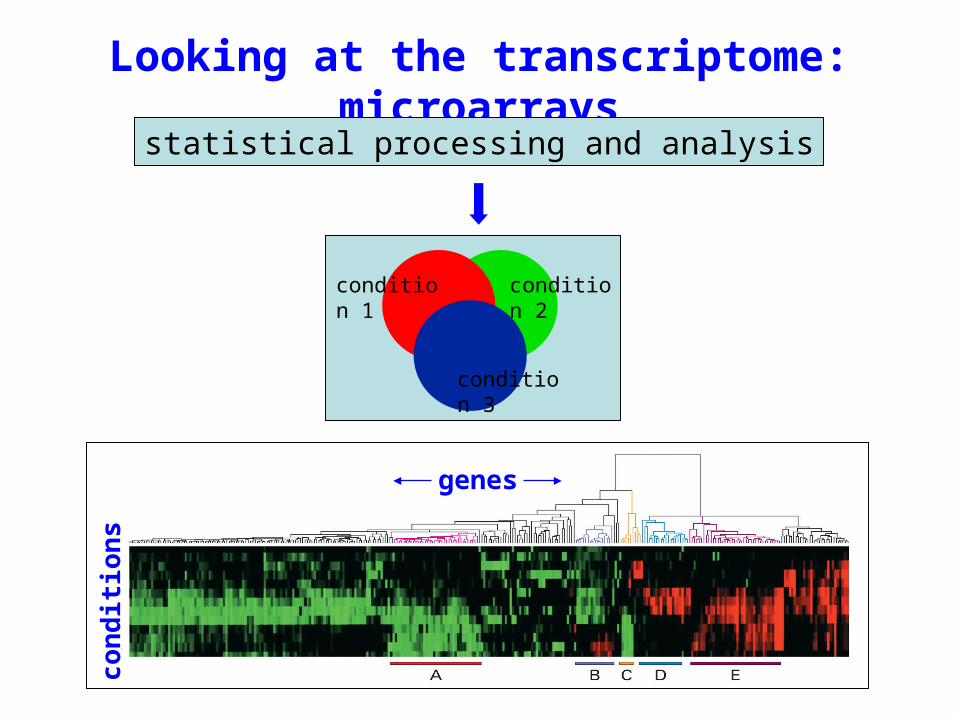
Looking at the transcriptome: microarrays
genes
co
nd
itio
ns
condition 1 condition 2
condition 3
statistical processing and analysis
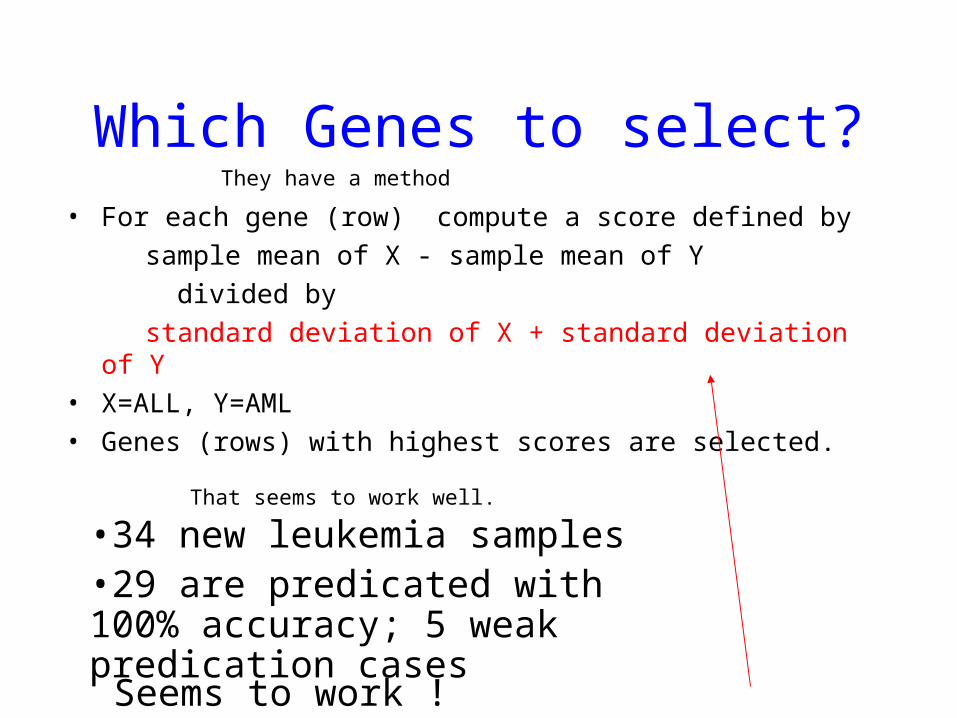
Which Genes to select? • For each gene (row) compute a score defined by
sample mean of X - sample mean of Y
divided by
standard deviation of X + standard deviation of Y
• X=ALL, Y=AML
• Genes (rows) with highest scores are selected.
Seems to work ! Improvement?
•34 new leukemia samples•29 are predicated with 100% accuracy; 5 weak predication cases
That seems to work well.
They have a method
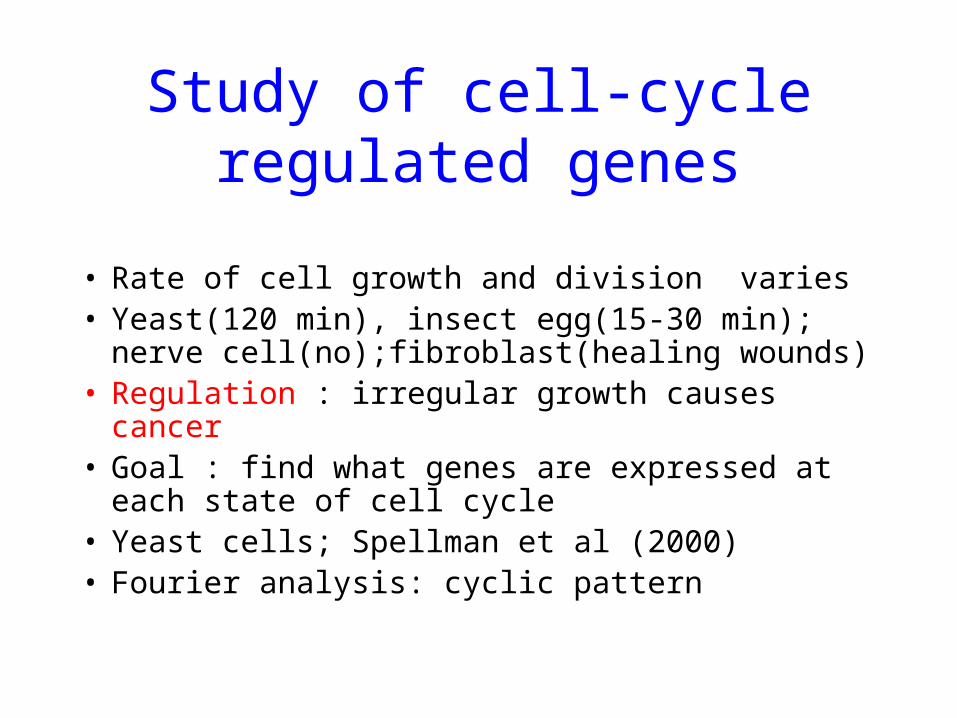
Study of cell-cycle regulated genes
• Rate of cell growth and division varies• Yeast(120 min), insect egg(15-30 min); nerve
cell(no);fibroblast(healing wounds)• Regulation : irregular growth causes cancer• Goal : find what genes are expressed at each state
of cell cycle• Yeast cells; Spellman et al (2000) • Fourier analysis: cyclic pattern
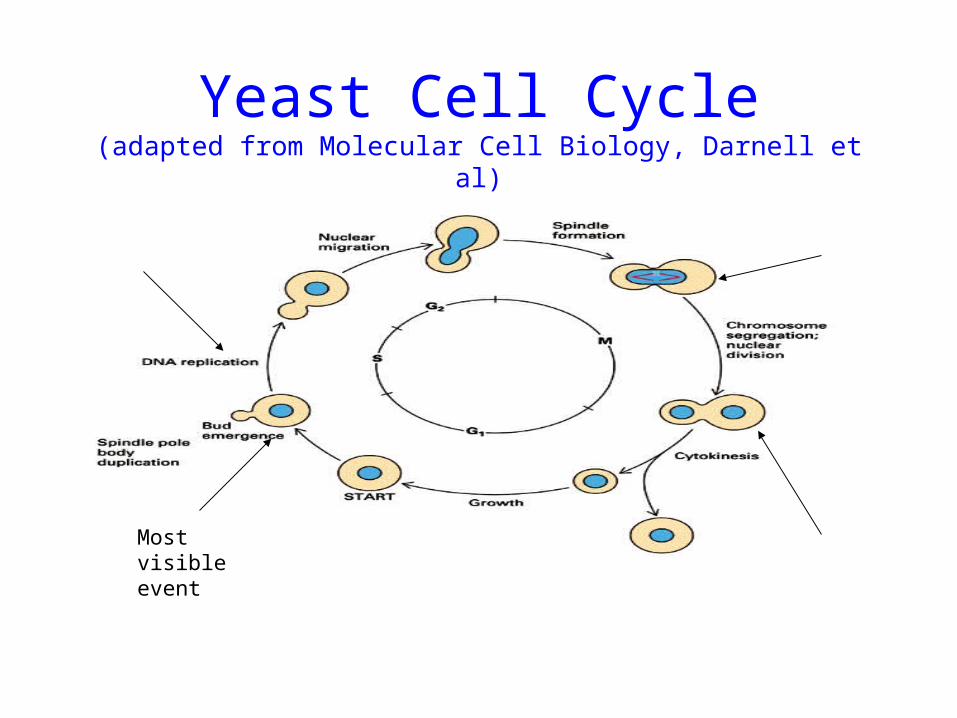
Yeast Cell Cycle(adapted from Molecular Cell Biology, Darnell et al)
Most visible event
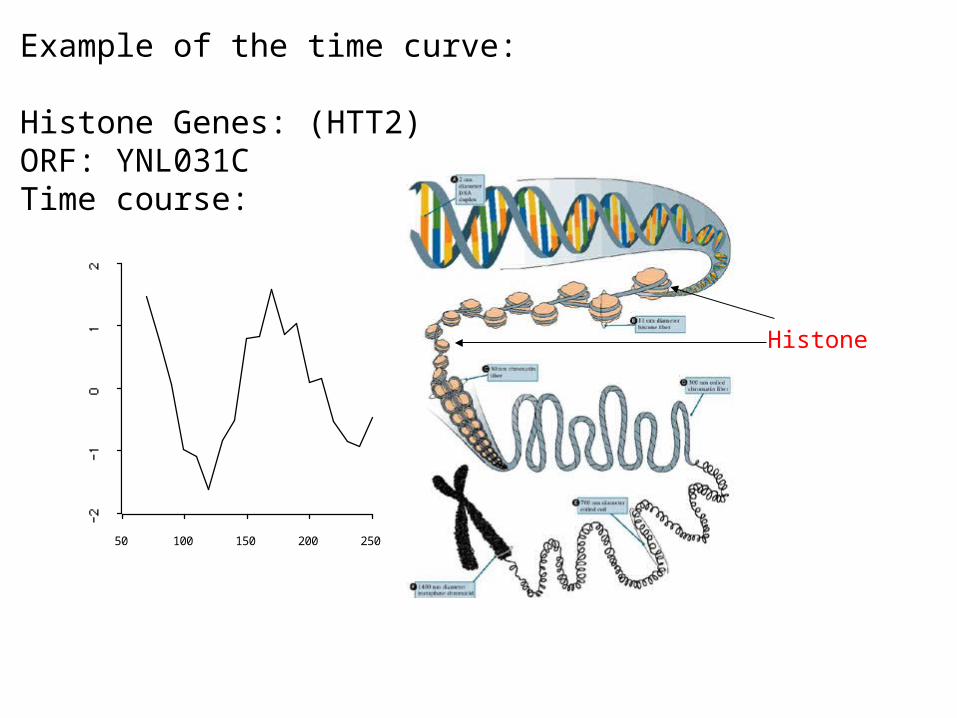
Example of the time curve:
Histone Genes: (HTT2)ORF: YNL031CTime course:
50 250100 150 200
Histone
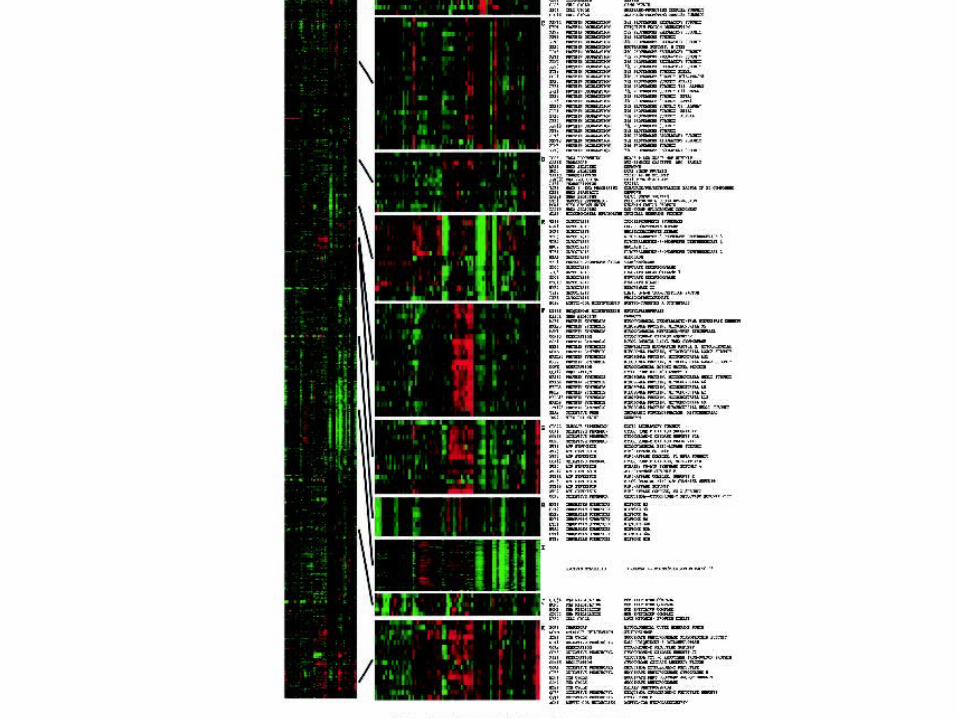
Why clustering make sense biologically?
Profile similarity implies functional association
The rationale is
Genes with high degree of expression similarity are likely to be functionally related and may participate in common pathways.
They may be co-regulated by common upstream regulatory factors.
Simply put,
Rationale behind massive gene expression analysis:
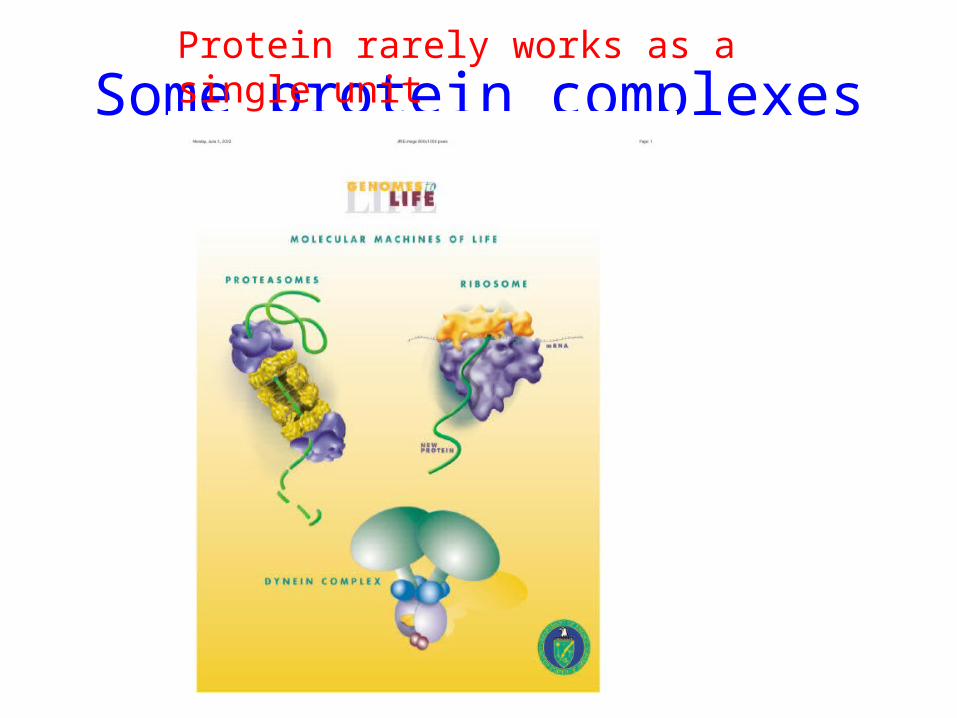
Some protein complexesProtein rarely works as a single unit
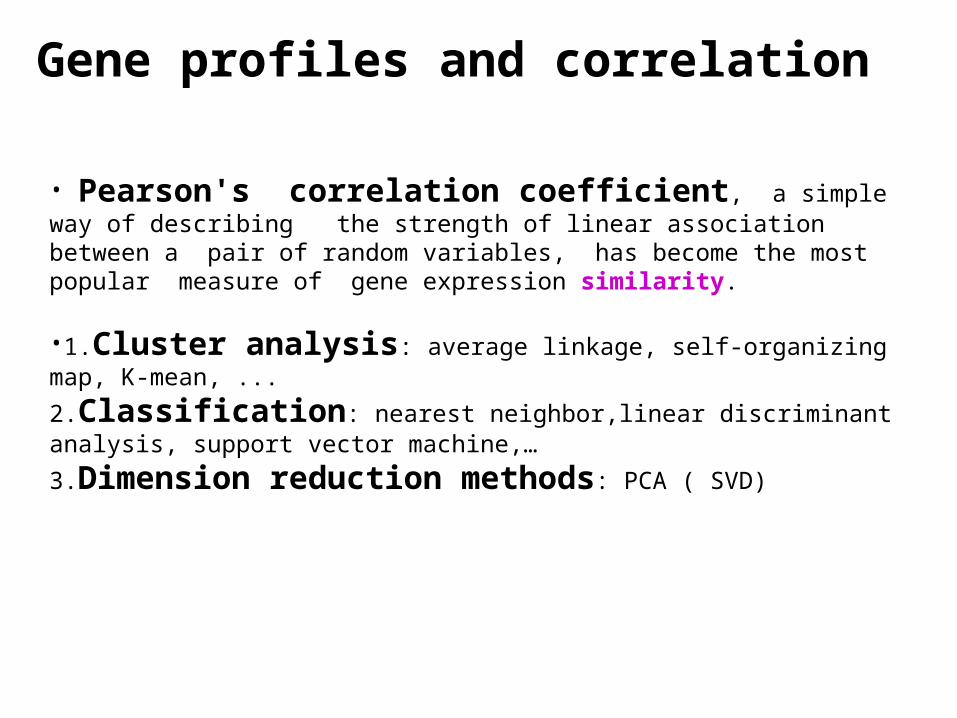
• Pearson's correlation coefficient, a simple way of describing the strength of linear association between a pair of random variables, has become the most popular measure of gene expression similarity.
•1.Cluster analysis: average linkage, self-organizing map, K-mean, ...
2.Classification: nearest neighbor,linear discriminant analysis, support vector machine,…
3.Dimension reduction methods: PCA ( SVD)
Gene profiles and correlation
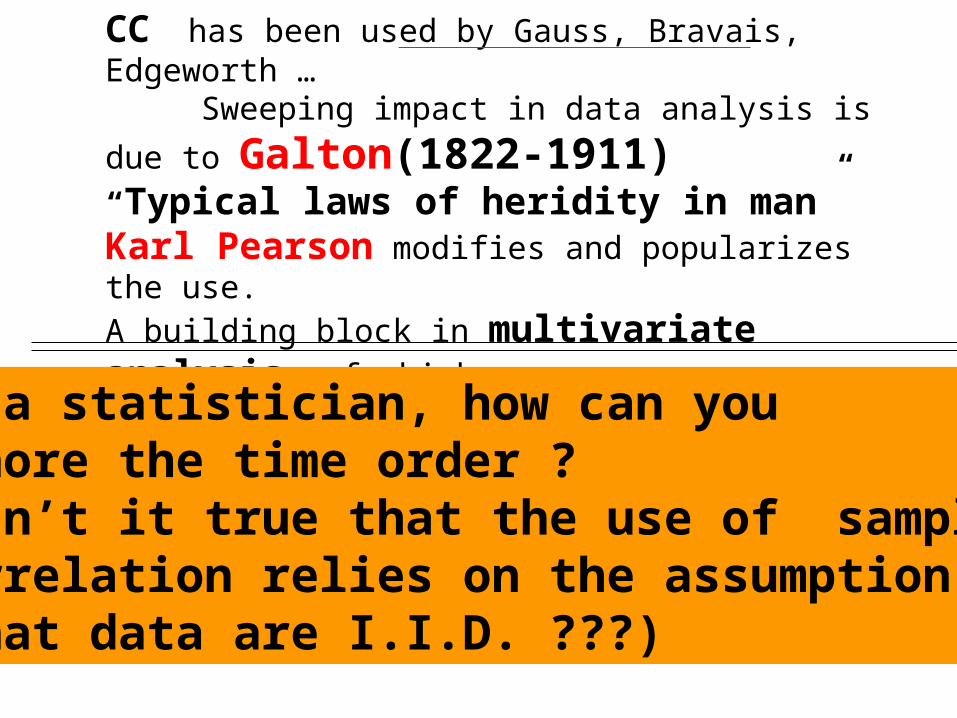
CC has been used by Gauss, Bravais, Edgeworth … Sweeping impact in data analysis is due to
Galton(1822-1911)
“Typical laws of heridity in man”
Karl Pearson modifies and popularizes the use.
A building block in multivariate analysis, of whichclustering, classification, dim. reduct. are recurrent themes
As a statistician, how can you ignore the time order ?(Isn’t it true that the use of sample correlation relies on the assumption that data are I.I.D. ???)
….acerca de probabilidades.
Microarrays can show us when and where genes are expressed. But what regulates this expression?
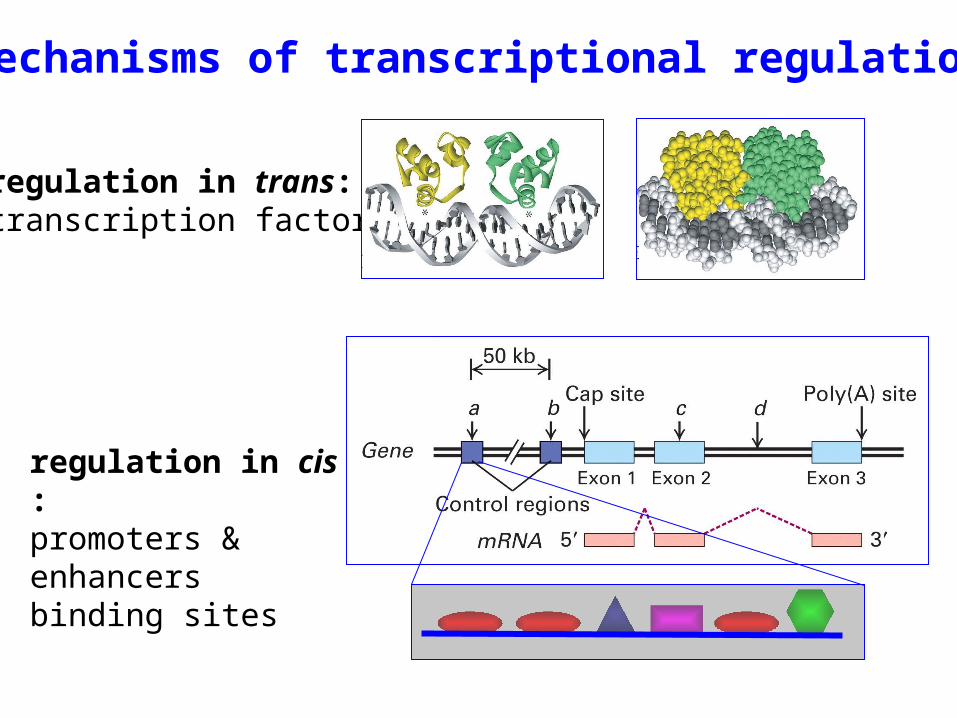
regulation in trans:transcription factors
Mechanisms of transcriptional regulation
regulation in cis :promoters & enhancersbinding sites
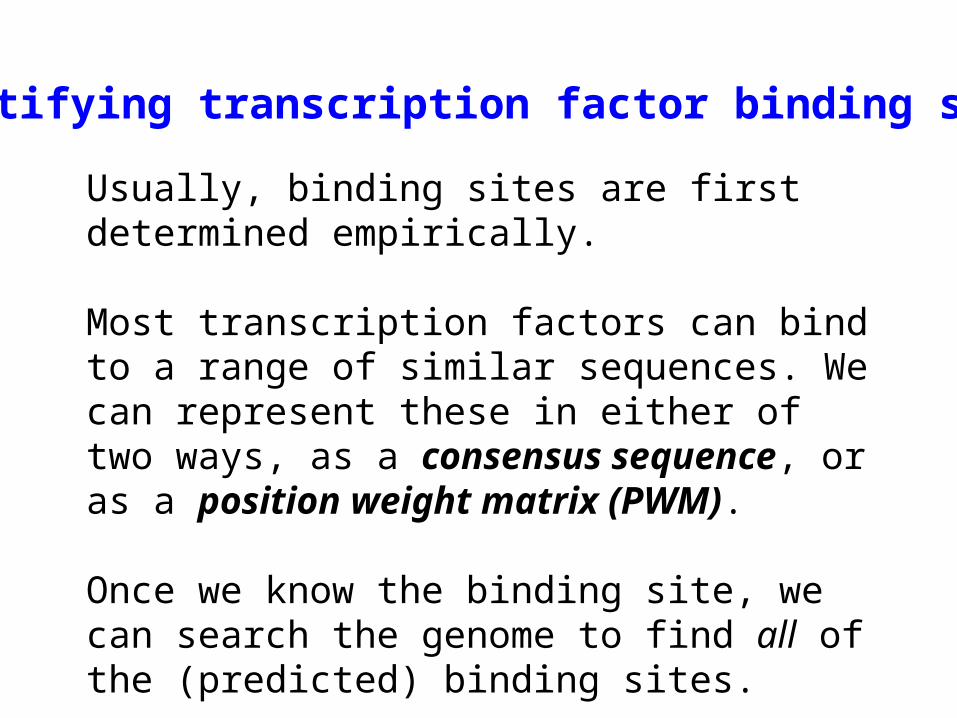
Identifying transcription factor binding sites
Usually, binding sites are first determined empirically.
Most transcription factors can bind to a range of similar sequences. We can represent these in either of two ways, as a consensus sequence, or as a position weight matrix (PWM).
Once we know the binding site, we can search the genome to find all of the (predicted) binding sites.
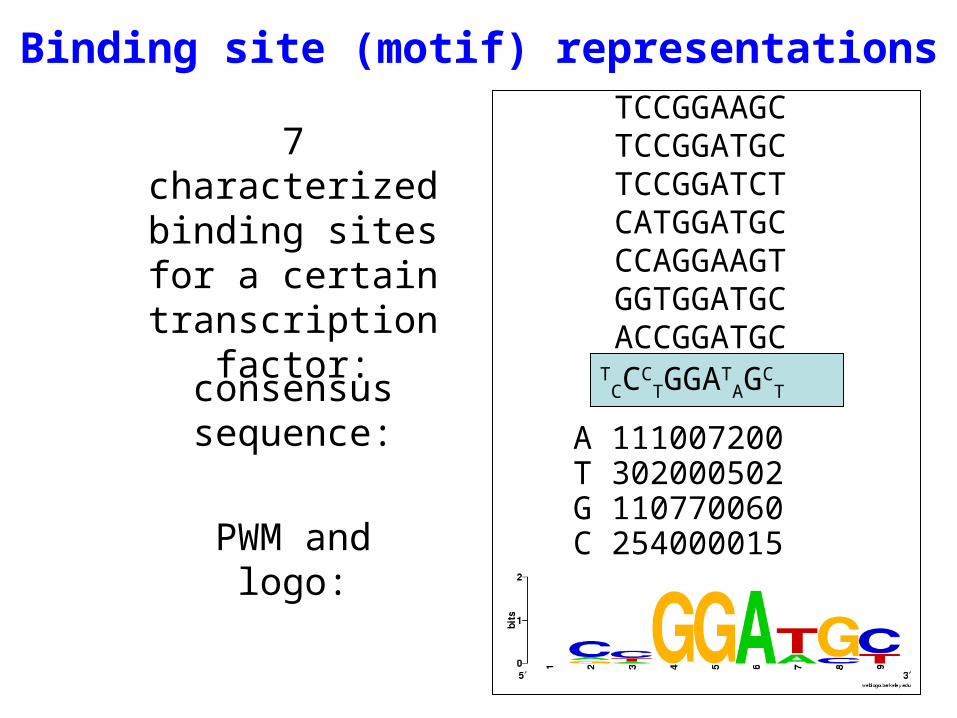
Binding site (motif) representationsTCCGGAAGCTCCGGATGCTCCGGATCTCATGGATGCCCAGGAAGTGGTGGATGCACCGGATGC
TCCC
TGGATAGC
T
A 111007200T 302000502G 110770060C 254000015
7 characterized binding sites for a
certain transcription factor:
consensus sequence:
PWM and logo:
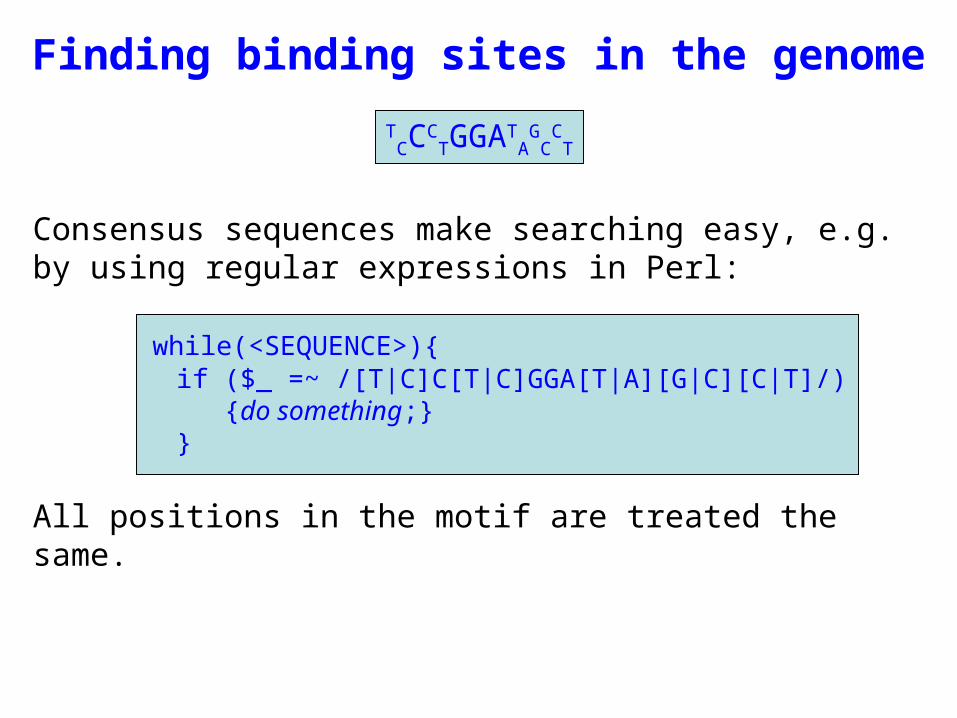
Consensus sequences make searching easy, e.g. by using regular expressions in Perl:
while(<SEQUENCE>){if ($_ =~ /[T|C]C[T|C]GGA[T|A][G|C][C|T]/)
{do something;}}
All positions in the motif are treated the same.
Finding binding sites in the genome
TCCC
TGGATAGCCT
Finding binding sites in the genome
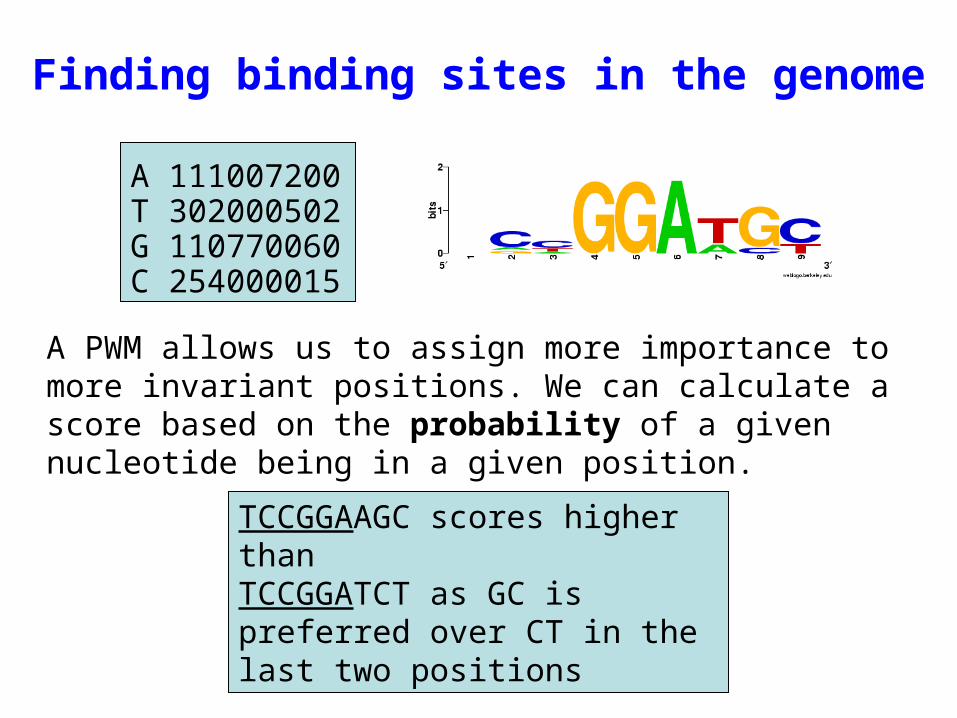
A 111007200T 302000502G 110770060C 254000015
A PWM allows us to assign more importance to more invariant positions. We can calculate a score based on the probability of a given nucleotide being in a given position.
TCCGGAAGC scores higher thanTCCGGATCT as GC is preferred over CT in the last two positions
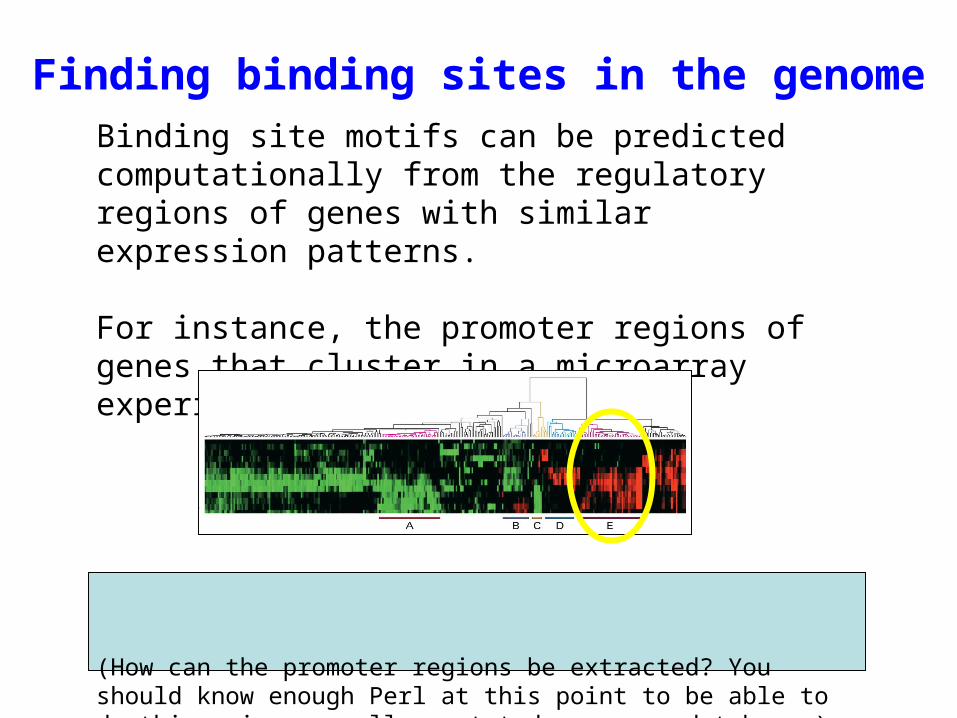
Finding binding sites in the genomeBinding site motifs can be predicted computationally from the regulatory regions of genes with similar expression patterns.
For instance, the promoter regions of genes that cluster in a microarray experiment can be used.
(How can the promoter regions be extracted? You should know enough Perl at this point to be able to do this, given a well-annotated sequence database.)
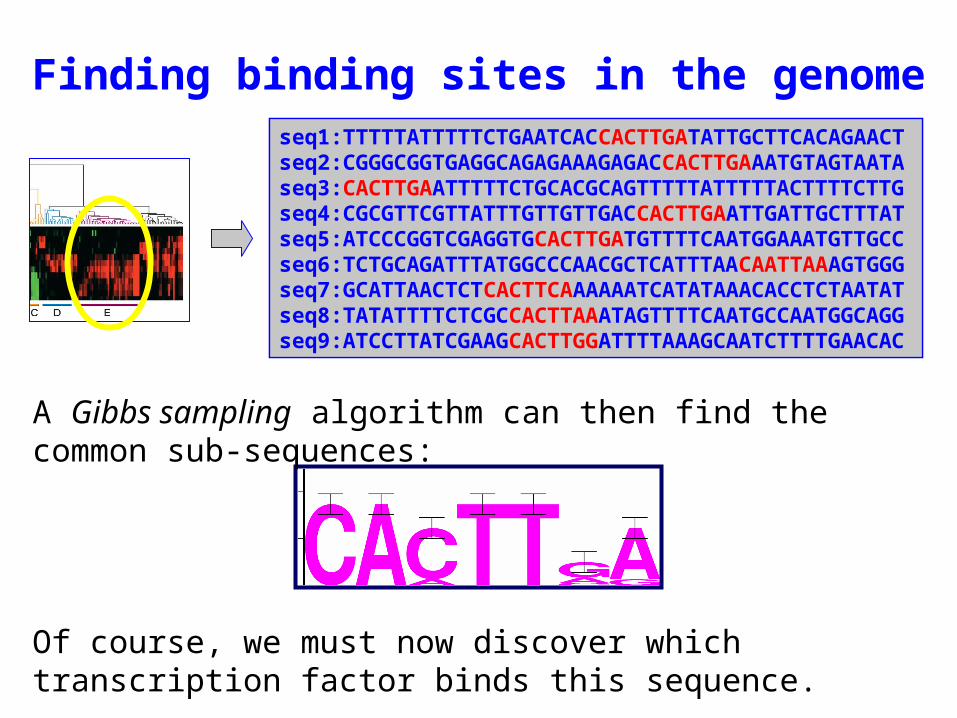
seq1:TTTTTATTTTTCTGAATCACCACTTGATATTGCTTCACAGAACTseq2:CGGGCGGTGAGGCAGAGAAAGAGACCACTTGAAATGTAGTAATAseq3:CACTTGAATTTTTCTGCACGCAGTTTTTATTTTTACTTTTCTTGseq4:CGCGTTCGTTATTTGTTGTTGACCACTTGAATTGATTGCTTTATseq5:ATCCCGGTCGAGGTGCACTTGATGTTTTCAATGGAAATGTTGCCseq6:TCTGCAGATTTATGGCCCAACGCTCATTTAACAATTAAAGTGGG seq7:GCATTAACTCTCACTTCAAAAAATCATATAAACACCTCTAATATseq8:TATATTTTCTCGCCACTTAAATAGTTTTCAATGCCAATGGCAGGseq9:ATCCTTATCGAAGCACTTGGATTTTAAAGCAATCTTTTGAACAC
Finding binding sites in the genomeseq1:TTTTTATTTTTCTGAATCACCACTTGATATTGCTTCACAGAACTseq2:CGGGCGGTGAGGCAGAGAAAGAGACCACTTGAAATGTAGTAATAseq3:CACTTGAATTTTTCTGCACGCAGTTTTTATTTTTACTTTTCTTGseq4:CGCGTTCGTTATTTGTTGTTGACCACTTGAATTGATTGCTTTATseq5:ATCCCGGTCGAGGTGCACTTGATGTTTTCAATGGAAATGTTGCCseq6:TCTGCAGATTTATGGCCCAACGCTCATTTAACAATTAAAGTGGG seq7:GCATTAACTCTCACTTCAAAAAATCATATAAACACCTCTAATATseq8:TATATTTTCTCGCCACTTAAATAGTTTTCAATGCCAATGGCAGGseq9:ATCCTTATCGAAGCACTTGGATTTTAAAGCAATCTTTTGAACAC
A Gibbs sampling algorithm can then find the common sub-sequences:
Of course, we must now discover which transcription factor binds this sequence.
Finding binding sites in the genome
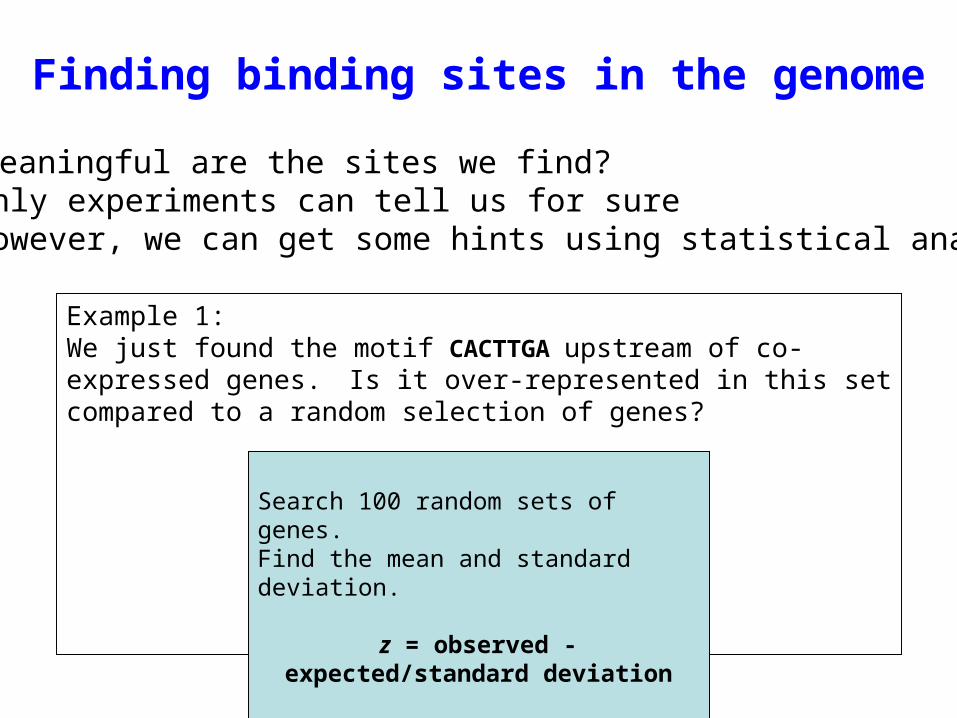
How meaningful are the sites we find?• Only experiments can tell us for sure• However, we can get some hints using statistical analysis
Example 1:We just found the motif CACTTGA upstream of co-expressed genes. Is it over-represented in this set compared to a random selection of genes?
Search 100 random sets of genes.Find the mean and standard deviation. z = observed - expected/standard deviation
Finding binding sites in the genome
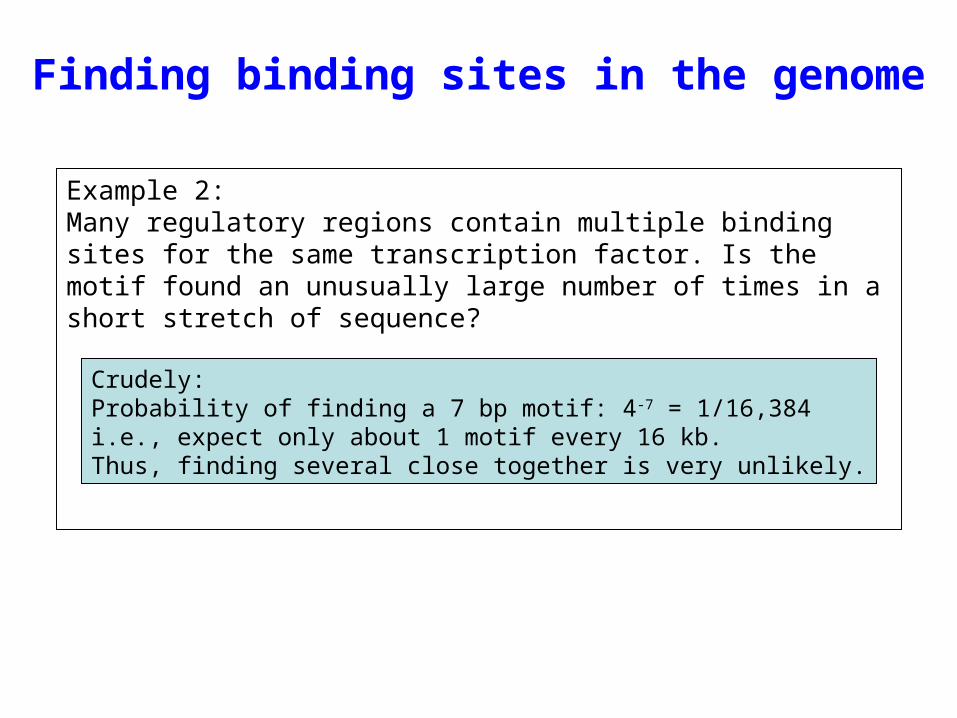
Example 2:Many regulatory regions contain multiple binding sites for the same transcription factor. Is the motif found an unusually large number of times in a short stretch of sequence?
Crudely:Probability of finding a 7 bp motif: 4-7 = 1/16,384i.e., expect only about 1 motif every 16 kb.Thus, finding several close together is very unlikely.
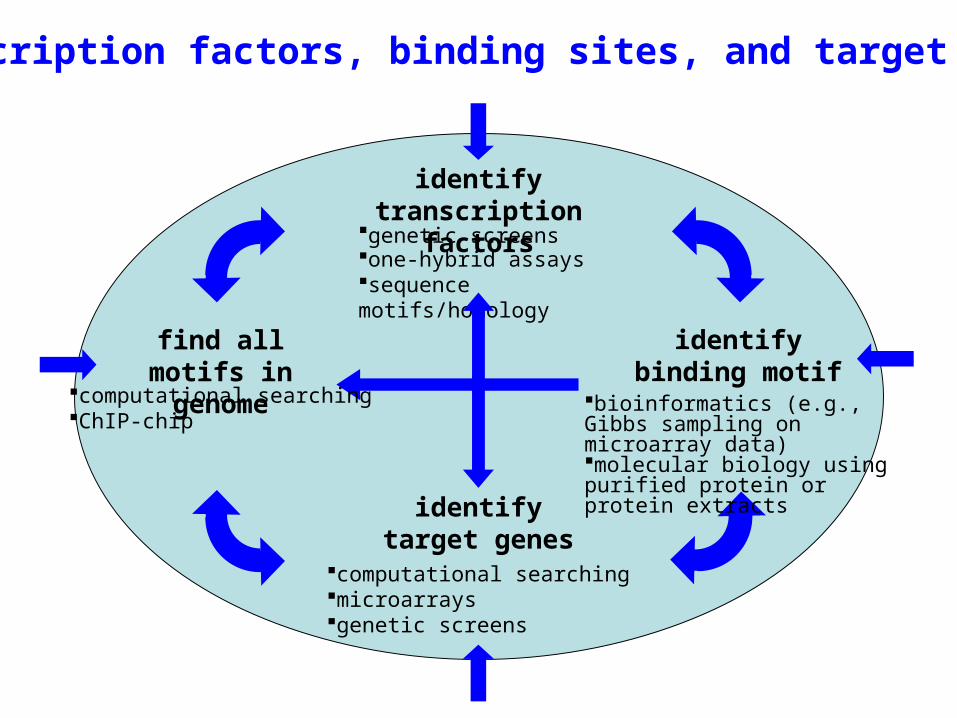
find all motifs in genome
identifytranscription
factors
identify binding motif
identify target genes
Transcription factors, binding sites, and target genes
computational searchingChIP-chip
computational searchingmicroarraysgenetic screens
bioinformatics (e.g., Gibbs sampling on microarray data)molecular biology using purified protein or protein extracts
genetic screensone-hybrid assayssequence motifs/homology
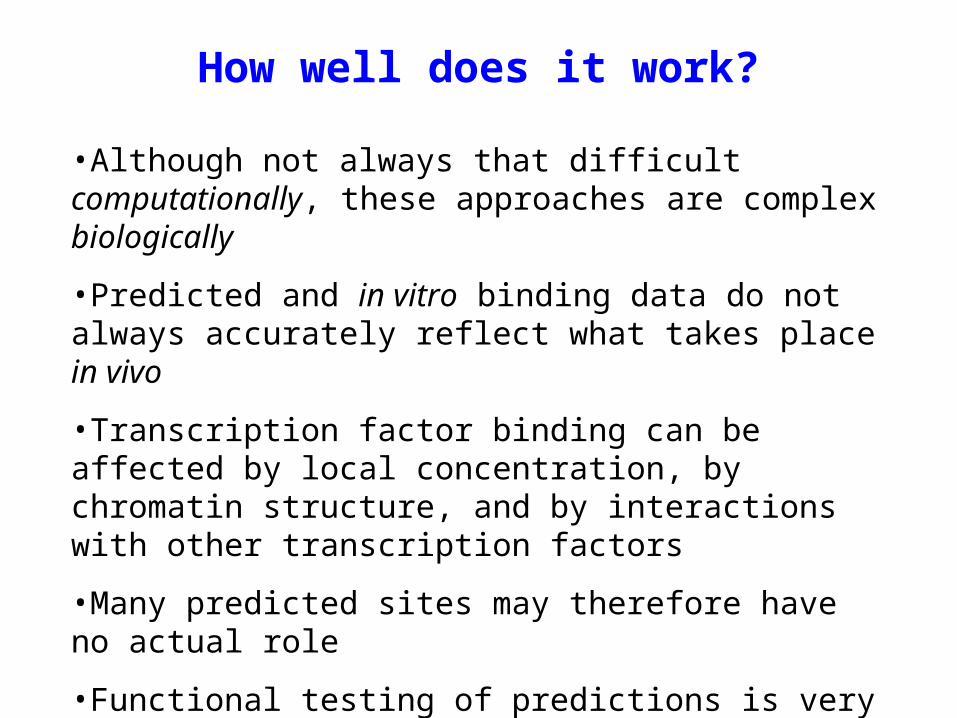
How well does it work?
•Although not always that difficult computationally, these approaches are complex biologically
•Predicted and in vitro binding data do not always accurately reflect what takes place in vivo
•Transcription factor binding can be affected by local concentration, by chromatin structure, and by interactions with other transcription factors
•Many predicted sites may therefore have no actual role
•Functional testing of predictions is very important
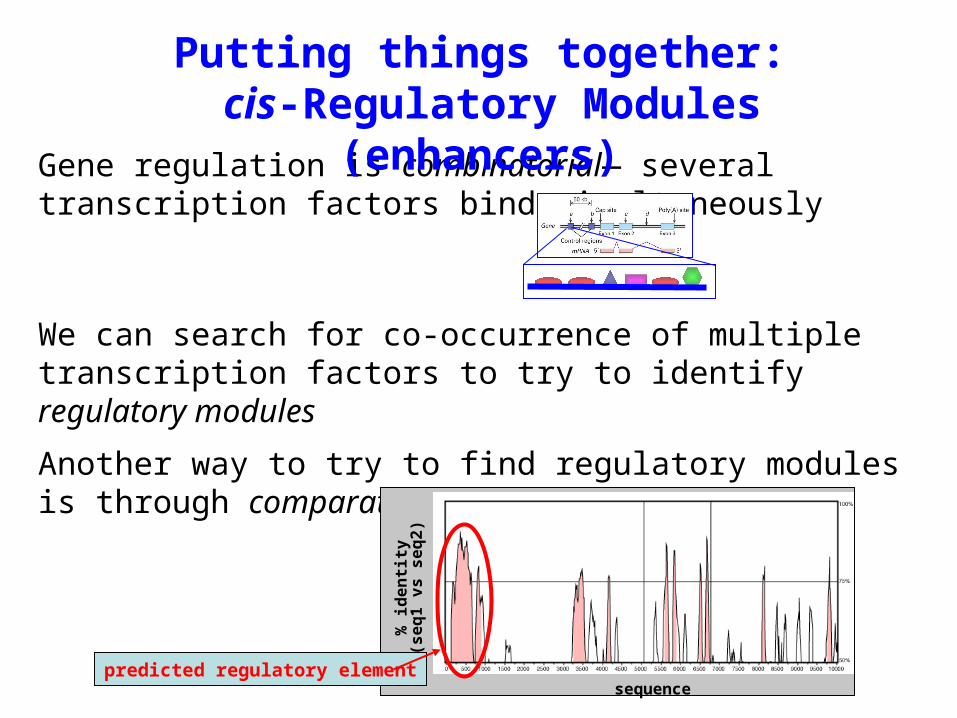
Gene regulation is combinatorial— several transcription factors bind simultaneously
We can search for co-occurrence of multiple transcription factors to try to identify regulatory modules
Another way to try to find regulatory modules is through comparative genomics
Putting things together: cis-Regulatory Modules (enhancers)
sequence
% i
de
nti
ty(s
eq
1 v
s s
eq
2)
predicted regulatory element
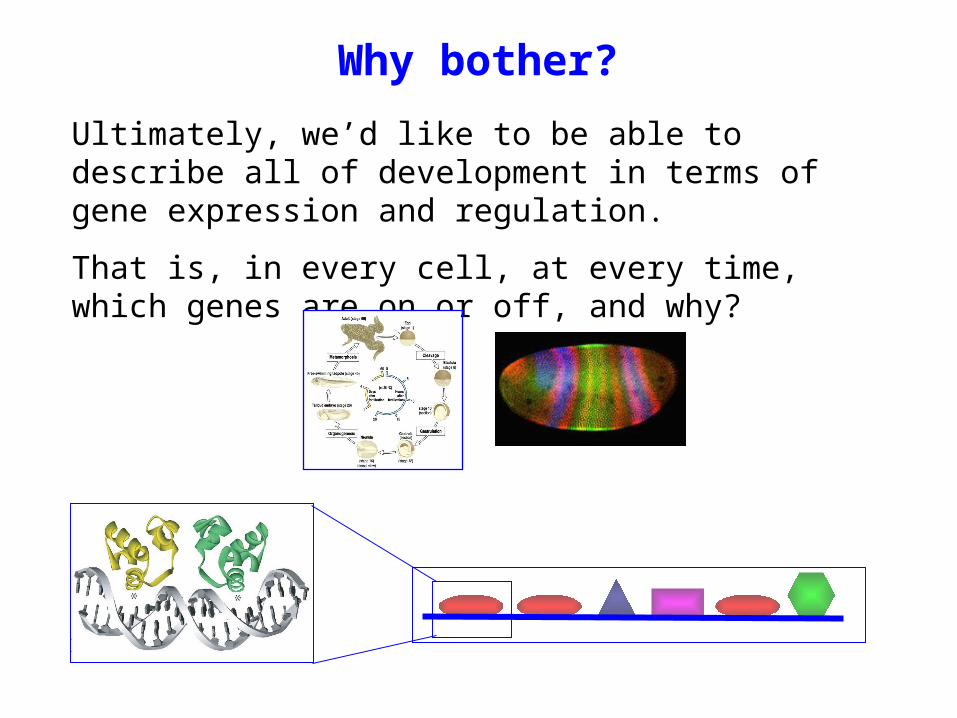
Why bother?
Ultimately, we’d like to be able to describe all of development in terms of gene expression and regulation.
That is, in every cell, at every time, which genes are on or off, and why?
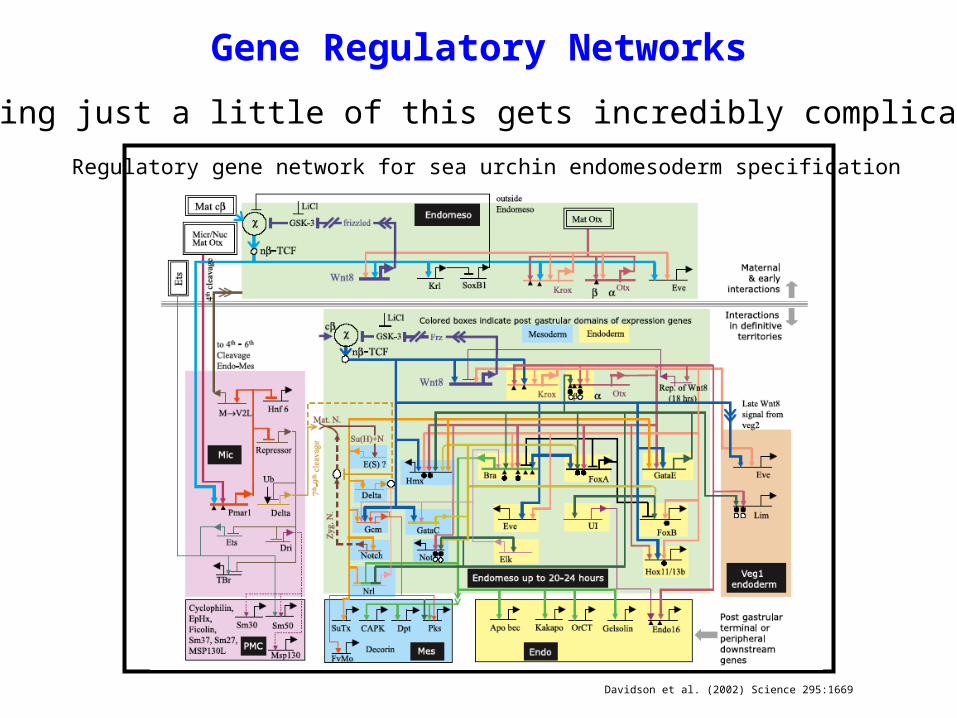
Davidson et al. (2002) Science 295:1669
Even knowing just a little of this gets incredibly complicated:
Regulatory gene network for sea urchin endomesoderm specification
Gene Regulatory Networks
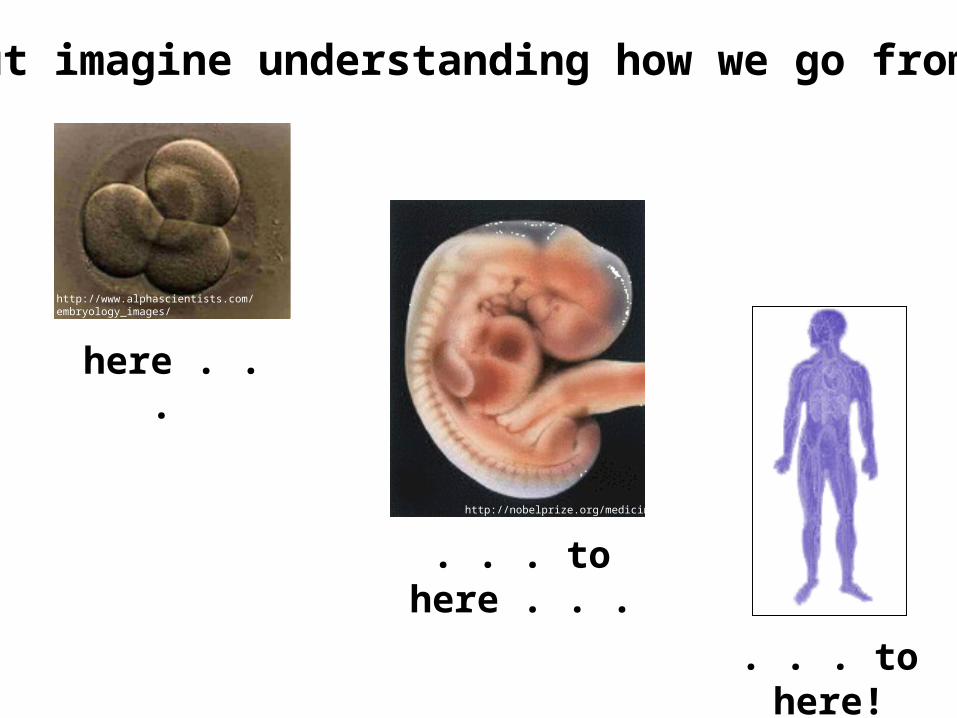
But imagine understanding how we go from
here . . .
. . . to here!
. . . to here . . .
http://nobelprize.org/medicine
http://www.alphascientists.com/embryology_images/cleavage_stage_embryos.html
Further Reading:
Wasserman, W. W. and A. Sandelin (2004). "Applied Bioinformatics For The Identification Of Regulatory Elements." Nature Reviews Genetics 5(4): 276-287.
Halfon, M. S. and A. M. Michelson (2002). "Exploring Genetic Regulatory Networks in Metazoan Development: Methods and Models." Physiol Genomics 10(3): 131-43.
Davidson, E. H. (2001). Genomic Regulatory Systems. San Diego, Academic Press.
Carroll, S. B., J. K. Grenier, et al. (2001). From DNA to Diversity. Molecular Genetics and the Evolution of Animal Design. Massachusetts, Blackwell Science.