Embed Size (px)
Citation preview

How can ET-praxis find his feet in the age of
genomics ?
Practitioners` Forum
Frank Becker
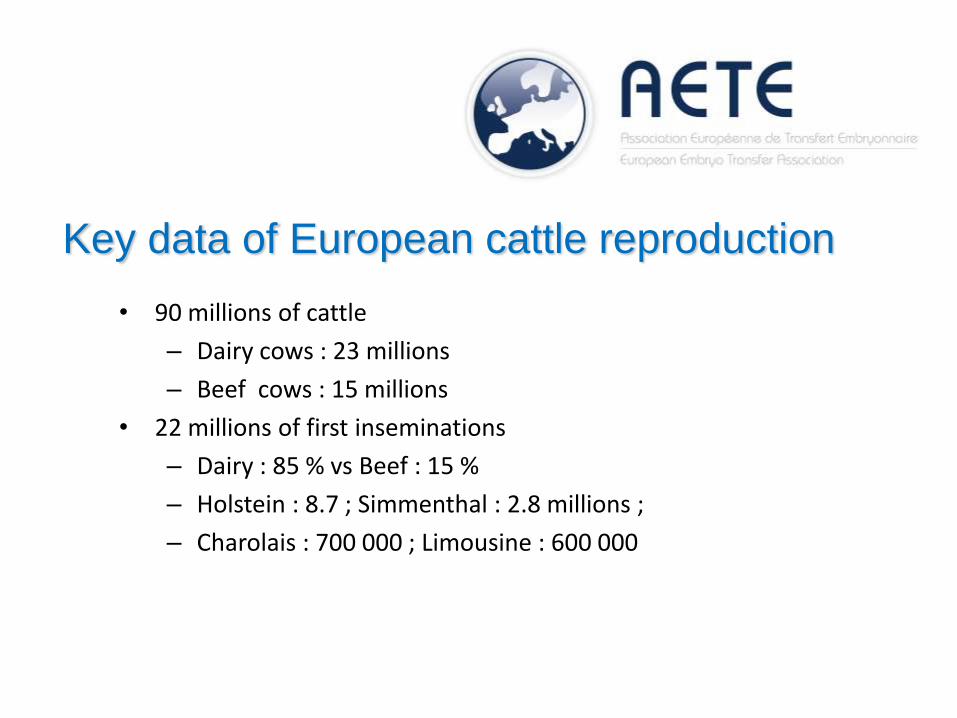
Key data of European cattle reproduction
• 90 millions of cattle
– Dairy cows : 23 millions
– Beef cows : 15 millions
• 22 millions of first inseminations
– Dairy : 85 % vs Beef : 15 %
– Holstein : 8.7 ; Simmenthal : 2.8 millions ;
– Charolais : 700 000 ; Limousine : 600 000
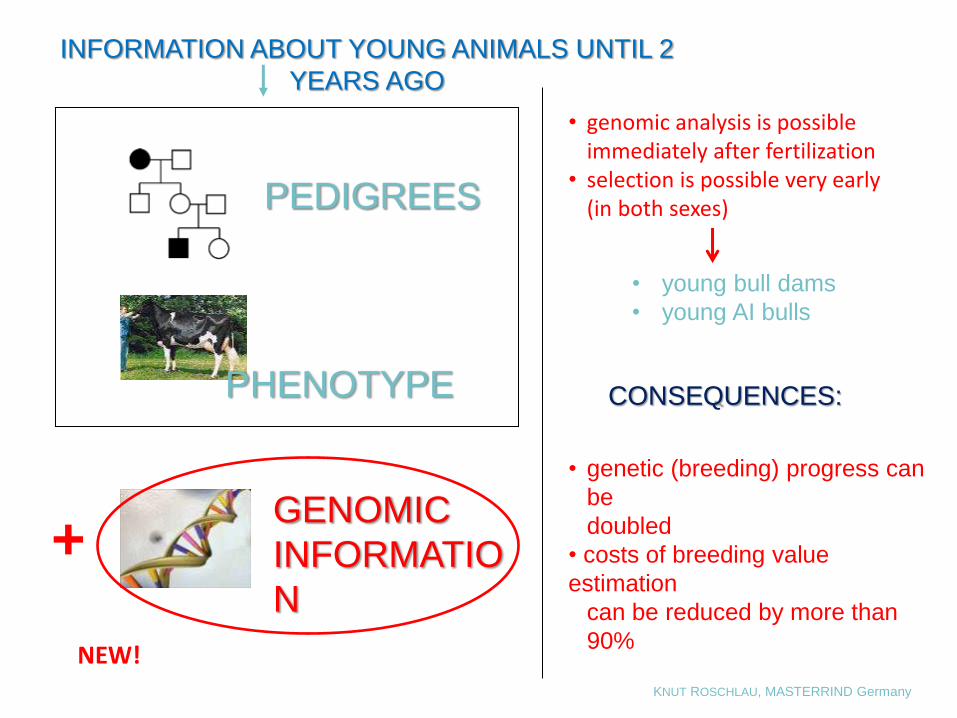
PEDIGREES
PHENOTYPE
INFORMATION ABOUT YOUNG ANIMALS UNTIL 2
YEARS AGO
GENOMIC
INFORMATIO
N
+
NEW!
CONSEQUENCES:
• genetic (breeding) progress can
be
doubled
• costs of breeding value
estimation
can be reduced by more than
90%
• young bull dams
• young AI bulls
• genomic analysis is possible immediately after fertilization
• selection is possible very early (in both sexes)
KNUT ROSCHLAU, MASTERRIND Germany
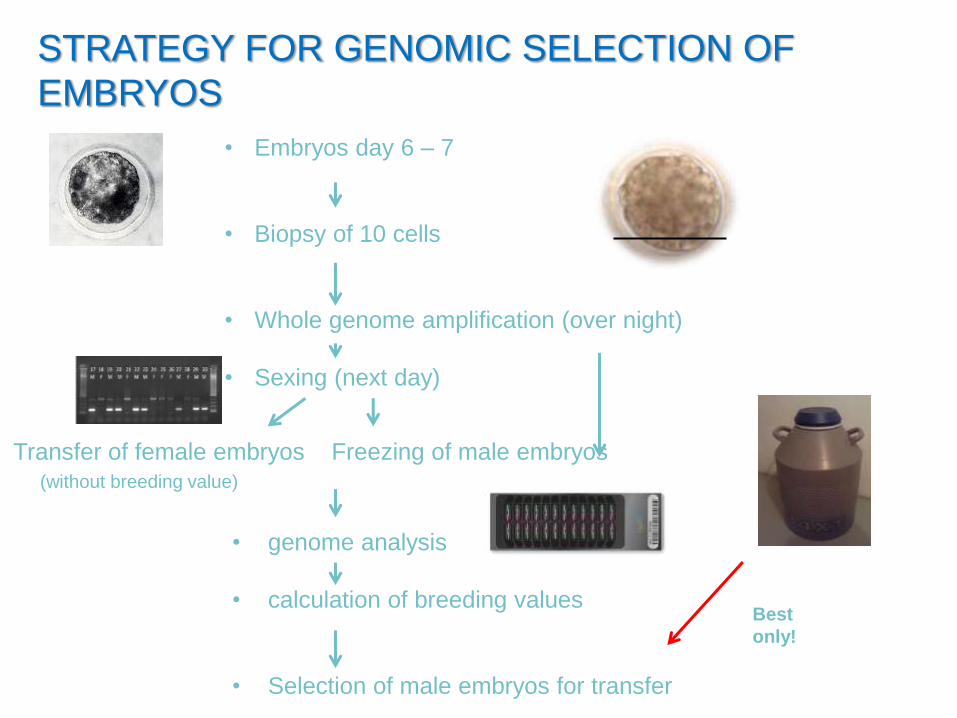
STRATEGY FOR GENOMIC SELECTION OF
EMBRYOS
• Embryos day 6 – 7
• Biopsy of 10 cells
• Whole genome amplification (over night)
• Sexing (next day)
Transfer of female embryos Freezing of male embryos
• genome analysis
• calculation of breeding values
• Selection of male embryos for transfer
(without breeding value)
Best
only!
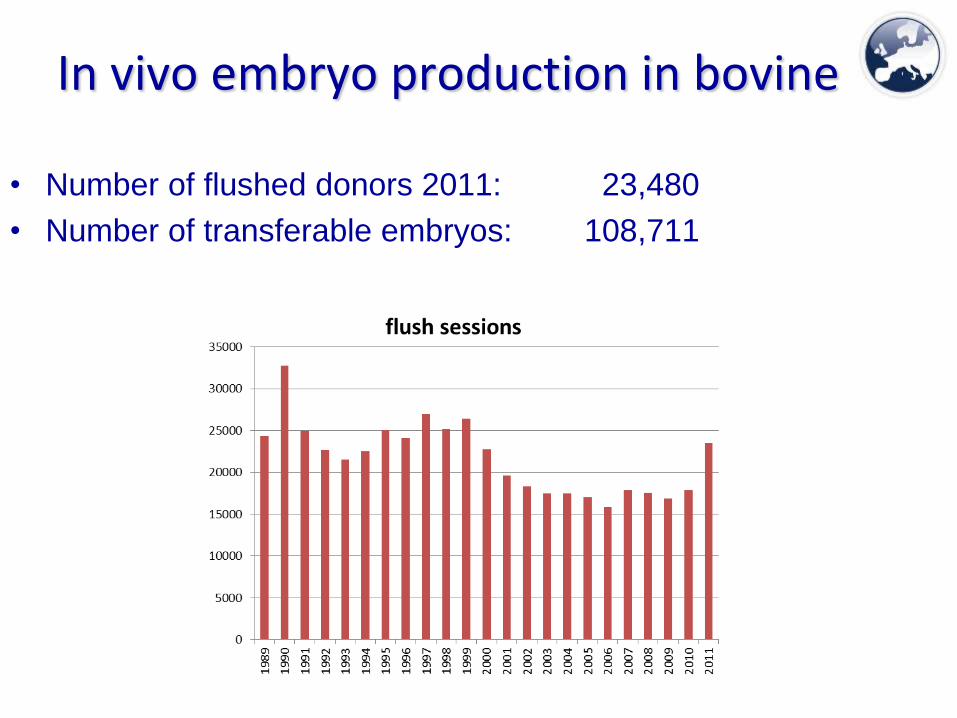
In vivo embryo production in bovine
• Number of flushed donors 2011: 23,480
• Number of transferable embryos: 108,711
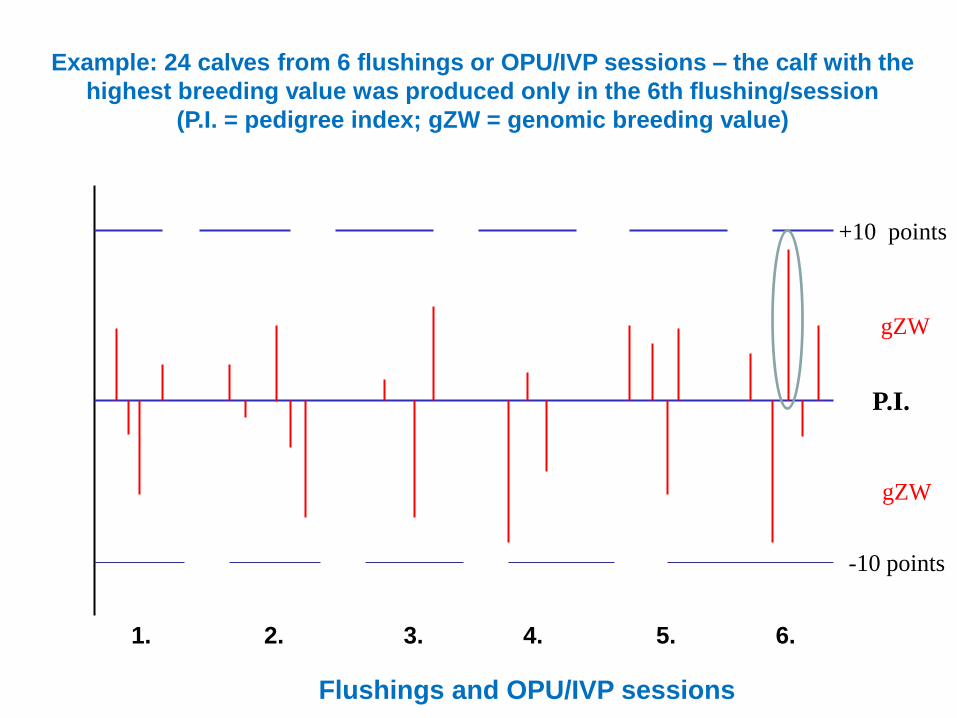
P.I.
+10 points
-10 points
Flushings and OPU/IVP sessions
1. 2. 3. 4. 5. 6.
Example: 24 calves from 6 flushings or OPU/IVP sessions – the calf with the
highest breeding value was produced only in the 6th flushing/session
(P.I. = pedigree index; gZW = genomic breeding value)
gZW
gZW
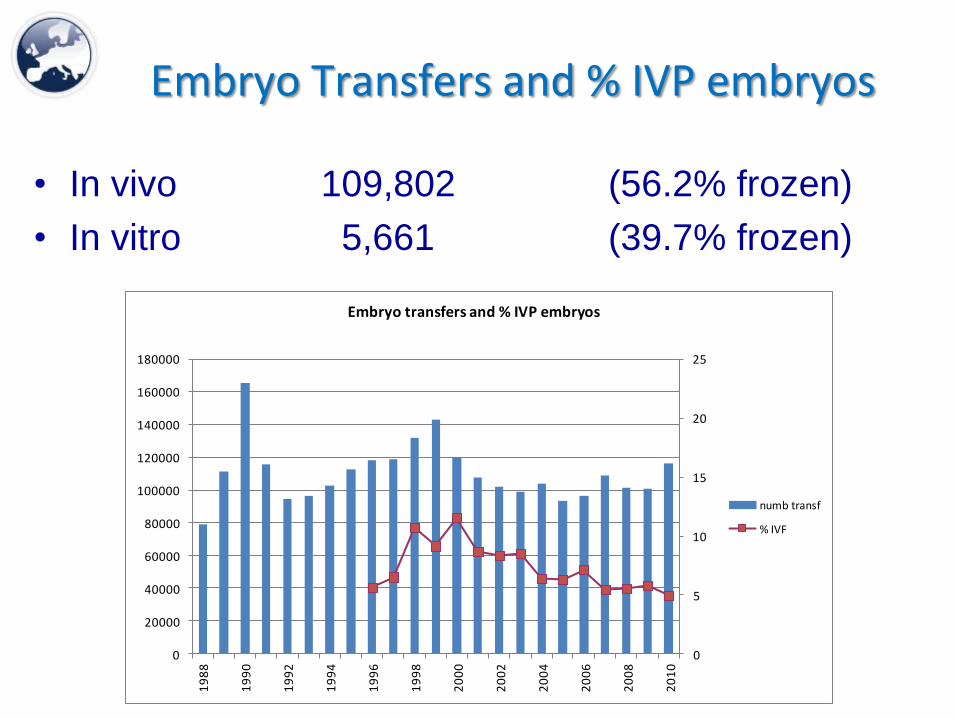
Embryo Transfers and % IVP embryos
0
5
10
15
20
25
0
20000
40000
60000
80000
100000
120000
140000
160000
180000
19
88
19
90
19
92
19
94
19
96
19
98
20
00
20
02
20
04
20
06
20
08
20
10
Embryo transfers and % IVP embryos
numb transf
% IVF
• In vivo 109,802 (56.2% frozen)
• In vitro 5,661 (39.7% frozen)
0
1000
2000
3000
4000
5000
6000
7000
8000
9000
10000
19
96
19
97
19
98
19
99
20
00
20
01
20
02
20
03
20
04
20
05
20
06
20
07
20
08
20
09
20
10
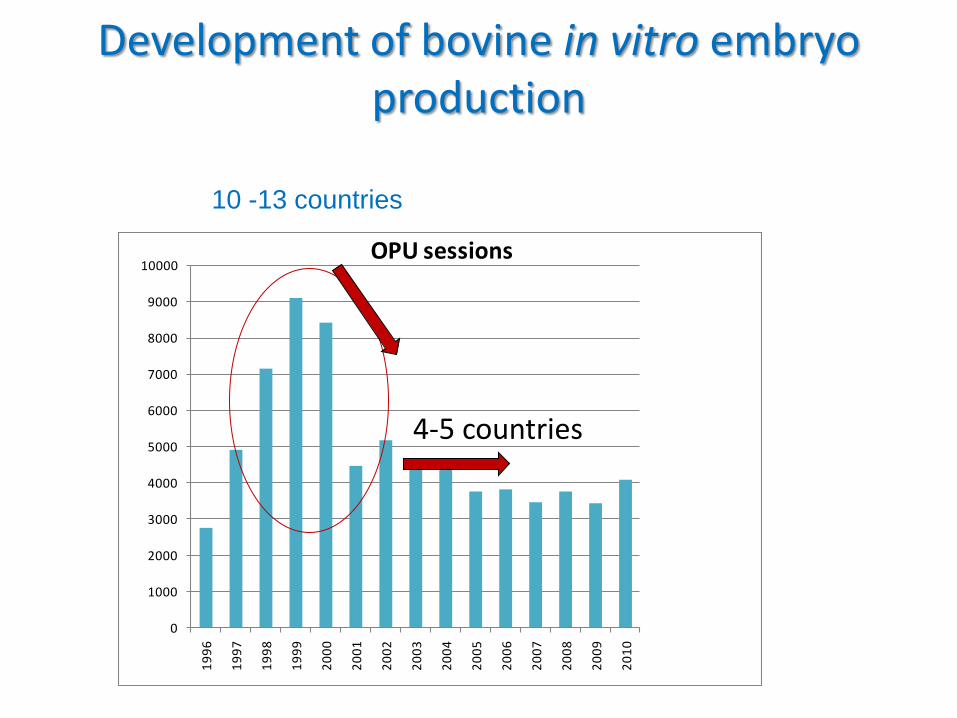
OPU sessions
10 -13 countries
4-5 countries
Development of bovine in vitro embryo production
Source Knijn H, AETE Workshop 2012: Oocyte collection; what is new?
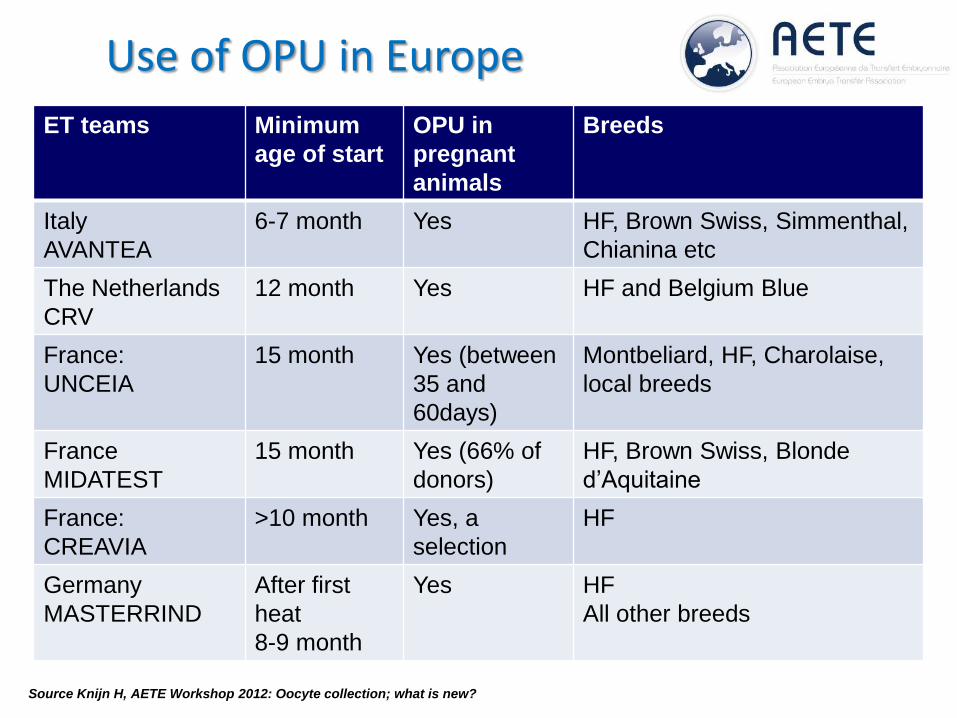
Use of OPU in Europe
ET teams Minimum
age of start
OPU in
pregnant
animals
Breeds
Italy
AVANTEA
6-7 month Yes HF, Brown Swiss, Simmenthal,
Chianina etc
The Netherlands
CRV
12 month Yes HF and Belgium Blue
France:
UNCEIA
15 month Yes (between
35 and
60days)
Montbeliard, HF, Charolaise,
local breeds
France
MIDATEST
15 month Yes (66% of
donors)
HF, Brown Swiss, Blonde
d’Aquitaine
France:
CREAVIA
>10 month Yes, a
selection
HF
Germany
MASTERRIND
After first
heat
8-9 month
Yes HF
All other breeds
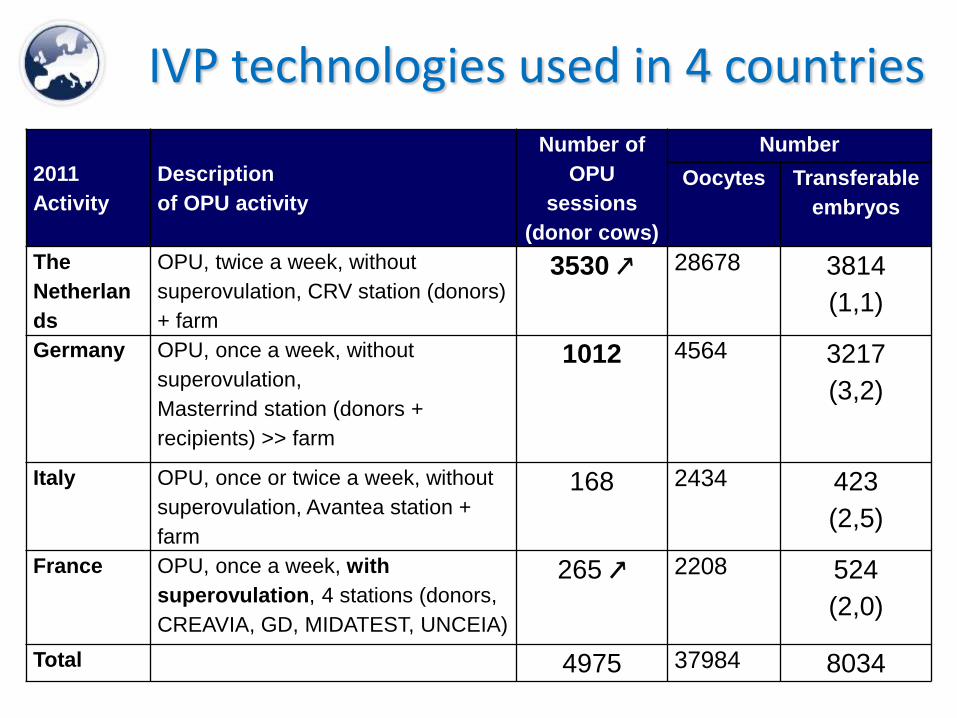
IVP technologies used in 4 countries
2011
Activity
Description
of OPU activity
Number of
OPU
sessions
(donor cows)
Number
Oocytes Transferable
embryos
The
Netherlan
ds
OPU, twice a week, without
superovulation, CRV station (donors)
+ farm
3530 ↗ 28678 3814
(1,1)
Germany OPU, once a week, without
superovulation,
Masterrind station (donors +
recipients) >> farm
1012 4564 3217
(3,2)
Italy OPU, once or twice a week, without
superovulation, Avantea station +
farm
168 2434 423
(2,5)
France OPU, once a week, with
superovulation, 4 stations (donors,
CREAVIA, GD, MIDATEST, UNCEIA)
265 ↗ 2208 524
(2,0)
Total 4975 37984 8034
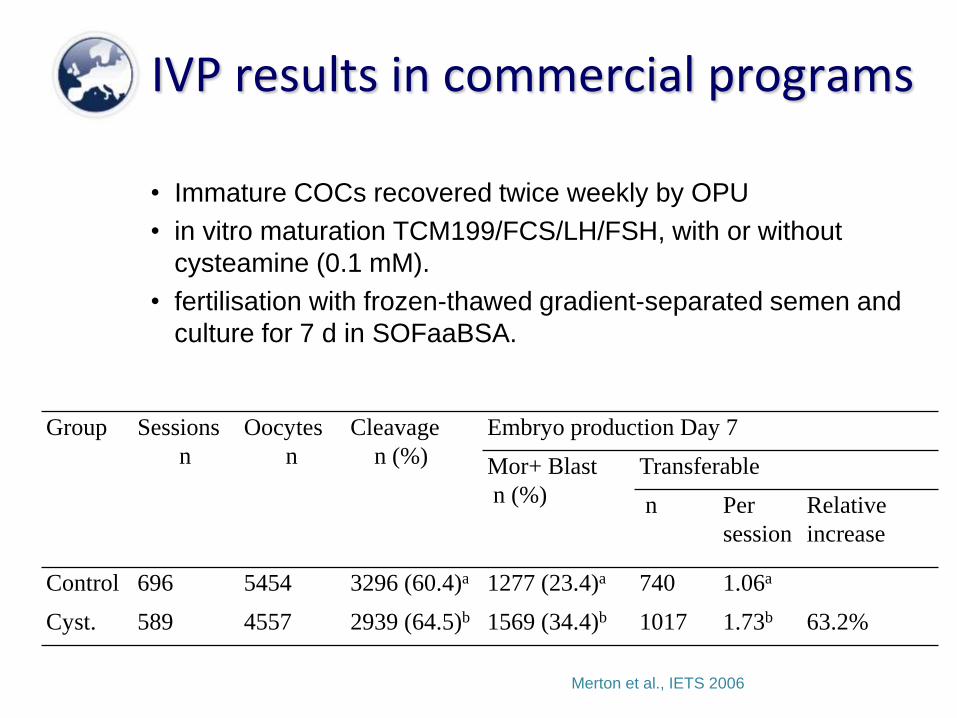
IVP results in commercial programs
• Immature COCs recovered twice weekly by OPU
• in vitro maturation TCM199/FCS/LH/FSH, with or without
cysteamine (0.1 mM).
• fertilisation with frozen-thawed gradient-separated semen and
culture for 7 d in SOFaaBSA.
Group Sessions
n
Oocytes
n
Cleavage
n (%)
Embryo production Day 7
Mor+ Blast
n (%)
Transferable
n Per
session
Relative
increase
Control 696 5454 3296 (60.4)a 1277 (23.4)a 740 1.06a
Cyst. 589 4557 2939 (64.5)b 1569 (34.4)b 1017 1.73b 63.2%
Merton et al., IETS 2006
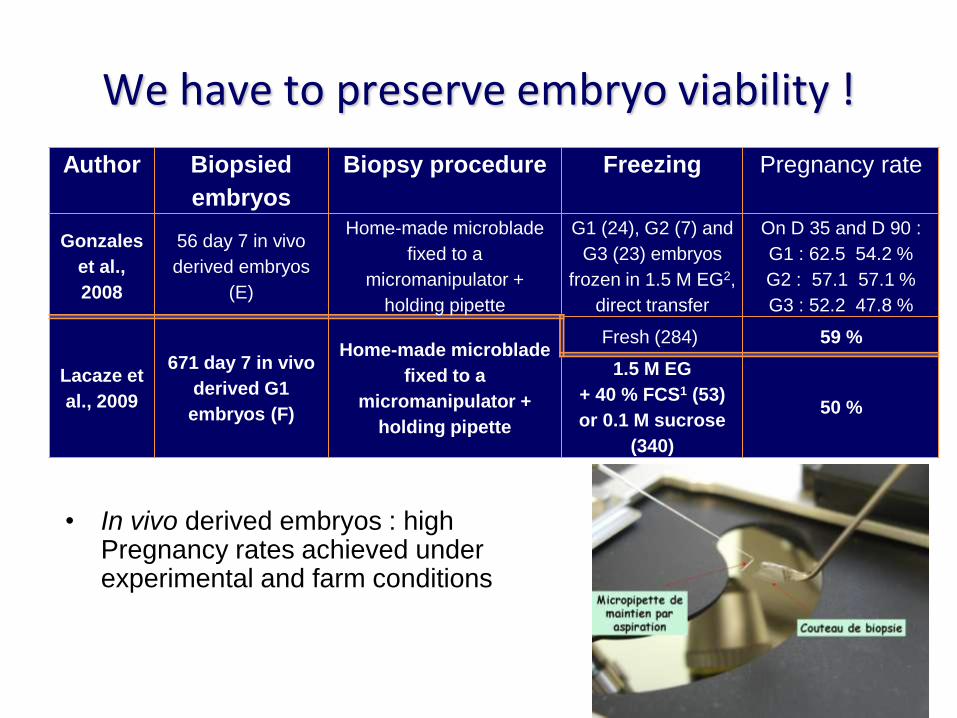
We have to preserve embryo viability !
• In vivo derived embryos : high Pregnancy rates achieved under experimental and farm conditions
Author Biopsied
embryos
Biopsy procedure Freezing Pregnancy rate
Gonzales
et al.,
2008
56 day 7 in vivo
derived embryos
(E)
Home-made microblade
fixed to a
micromanipulator +
holding pipette
G1 (24), G2 (7) and
G3 (23) embryos
frozen in 1.5 M EG2,
direct transfer
On D 35 and D 90 :
G1 : 62.5 54.2 %
G2 : 57.1 57.1 %
G3 : 52.2 47.8 %
Lacaze et
al., 2009
671 day 7 in vivo
derived G1
embryos (F)
Home-made microblade
fixed to a
micromanipulator +
holding pipette
Fresh (284) 59 %
1.5 M EG
+ 40 % FCS1 (53)
or 0.1 M sucrose
(340)
50 %
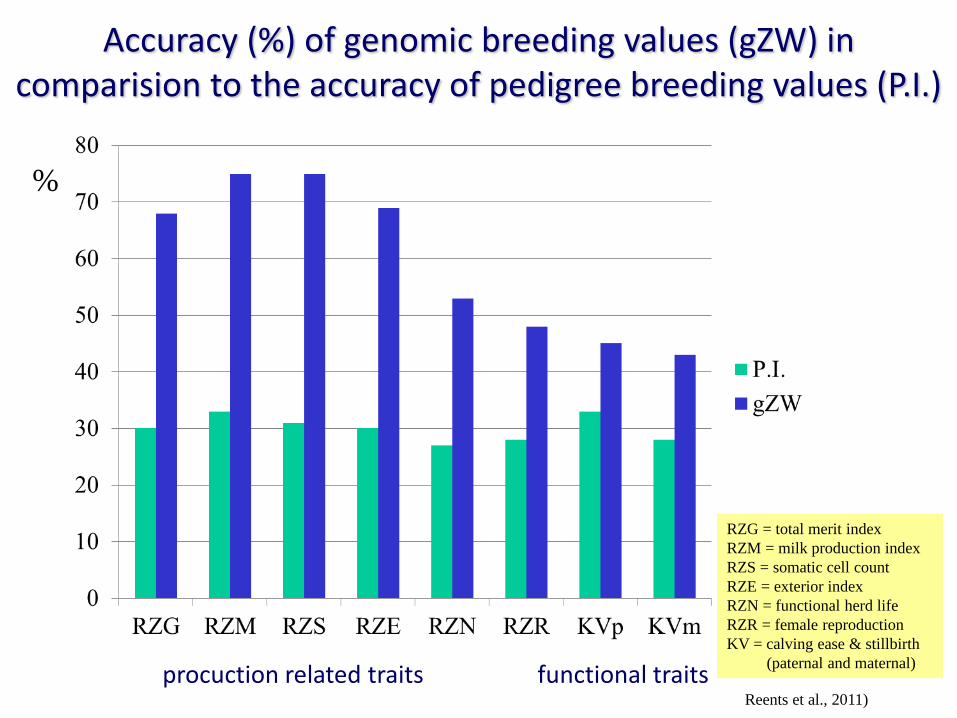
%
Accuracy (%) of genomic breeding values (gZW) in comparision to the accuracy of pedigree breeding values (P.I.)
procuction related traits functional traits
RZG = total merit index
RZM = milk production index
RZS = somatic cell count
RZE = exterior index
RZN = functional herd life
RZR = female reproduction
KV = calving ease & stillbirth
(paternal and maternal)
Reents et al., 2011)
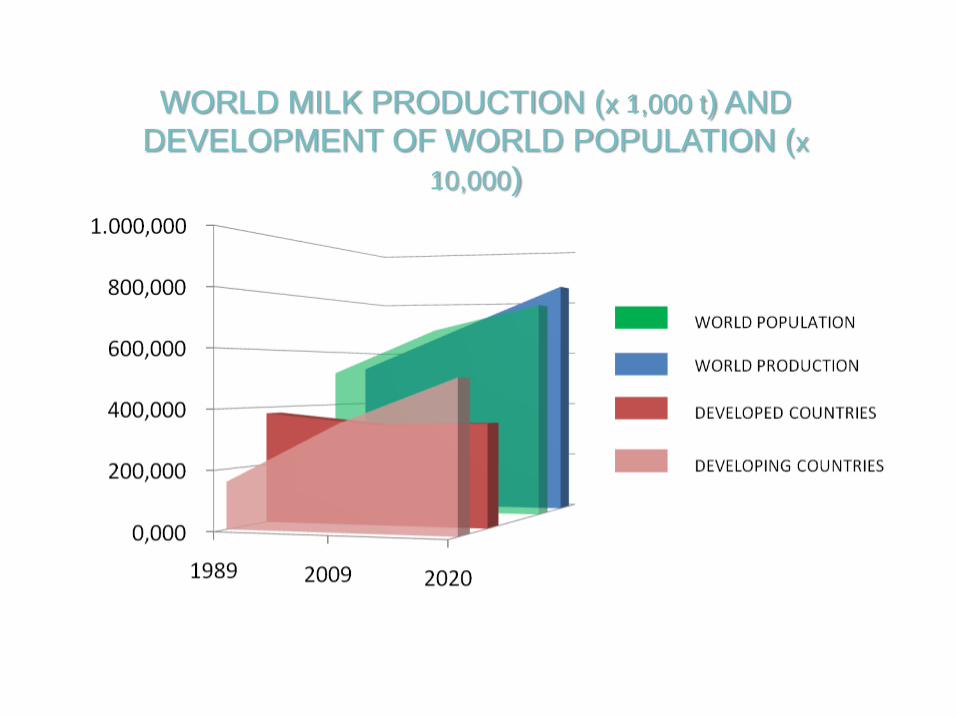
WORLD MILK PRODUCTION (x 1,000 t) AND
DEVELOPMENT OF WORLD POPULATION (x
10,000)
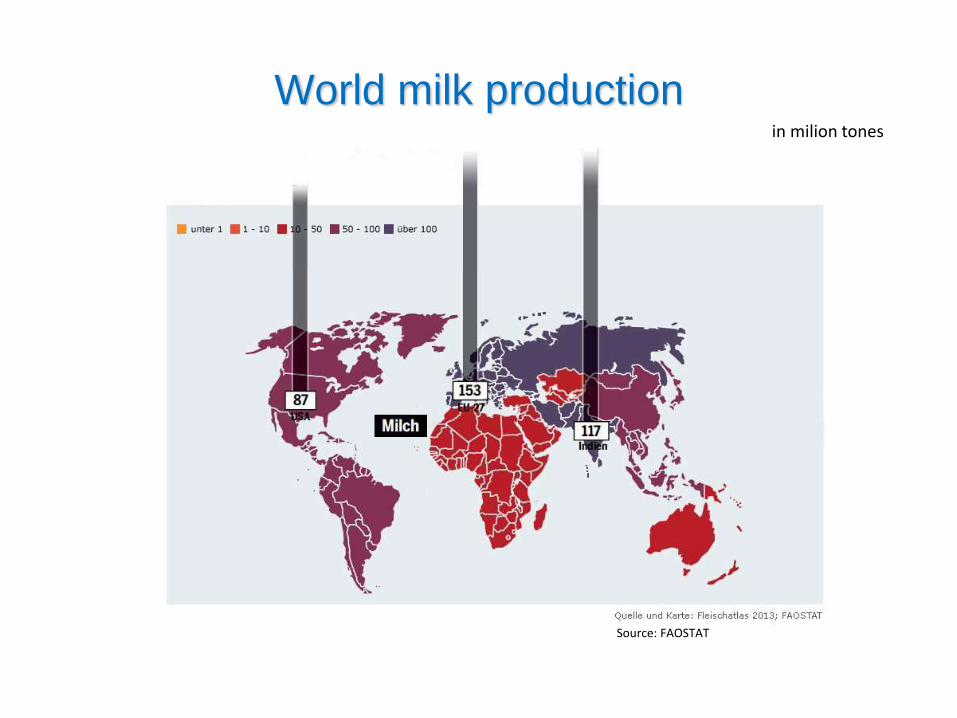
World milk production in milion tones
Source: FAOSTAT
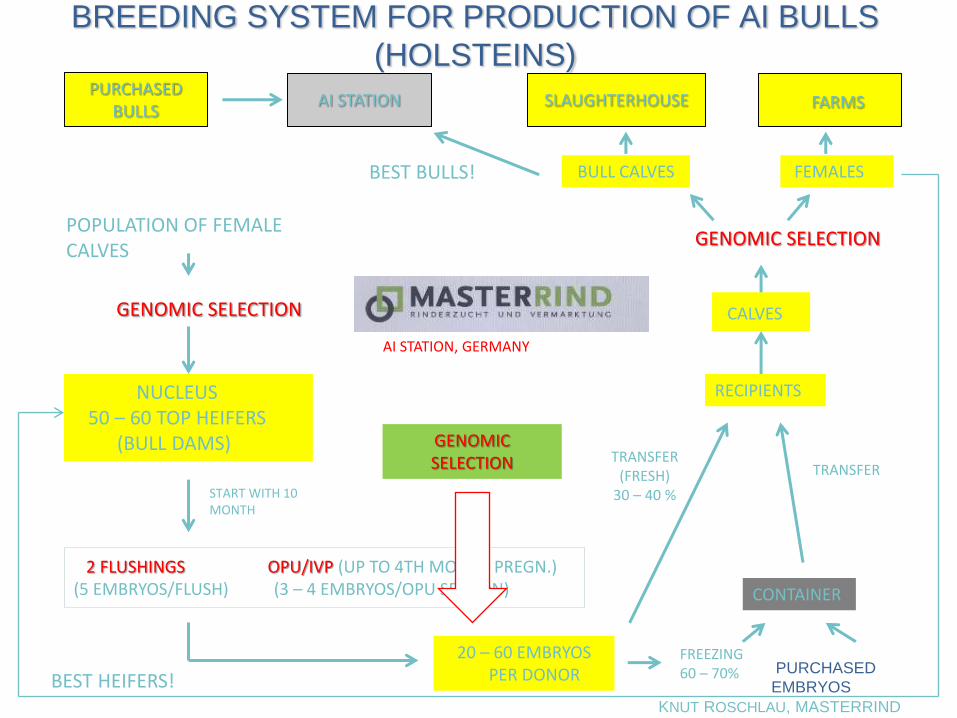
BREEDING SYSTEM FOR PRODUCTION OF AI BULLS
(HOLSTEINS)
PURCHASED
EMBRYOS
POPULATION OF FEMALE CALVES
GENOMIC SELECTION
NUCLEUS 50 – 60 TOP HEIFERS (BULL DAMS)
2 FLUSHINGS OPU/IVP (UP TO 4TH MONTH PREGN.) (5 EMBRYOS/FLUSH) (3 – 4 EMBRYOS/OPU SESSION)
START WITH 10 MONTH
20 – 60 EMBRYOS PER DONOR
RECIPIENTS
TRANSFER (FRESH)
30 – 40 %
FREEZING 60 – 70%
CONTAINER
CALVES
GENOMIC SELECTION
FEMALES
FARMS
BEST HEIFERS!
BULL CALVES
SLAUGHTERHOUSE AI STATION
BEST BULLS!
PURCHASED BULLS
AI STATION, GERMANY
GENOMIC SELECTION TRANSFER
KNUT ROSCHLAU, MASTERRIND
Germany
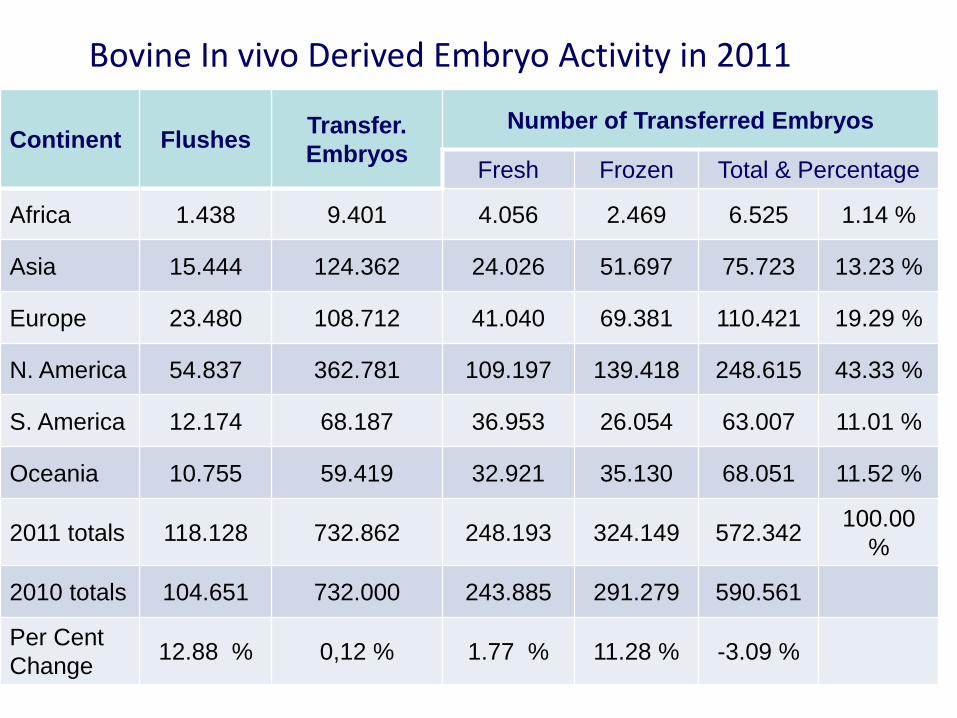
Continent Flushes Transfer.
Embryos
Number of Transferred Embryos
Fresh Frozen Total & Percentage
Africa 1.438 9.401 4.056 2.469 6.525 1.14 %
Asia 15.444 124.362 24.026 51.697 75.723 13.23 %
Europe 23.480 108.712 41.040 69.381 110.421 19.29 %
N. America 54.837 362.781 109.197 139.418 248.615 43.33 %
S. America 12.174 68.187 36.953 26.054 63.007 11.01 %
Oceania 10.755 59.419 32.921 35.130 68.051 11.52 %
2011 totals 118.128 732.862 248.193 324.149 572.342 100.00
%
2010 totals 104.651 732.000 243.885 291.279 590.561
Per Cent
Change 12.88 % 0,12 % 1.77 % 11.28 % -3.09 %
Bovine In vivo Derived Embryo Activity in 2011
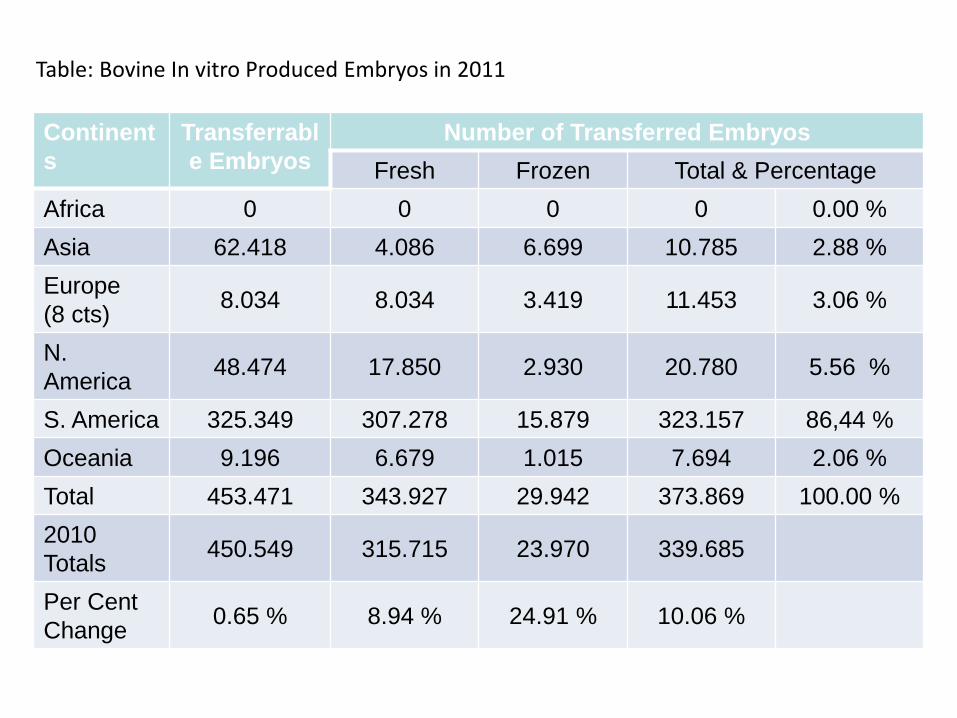
Continent
s
Transferrabl
e Embryos
Number of Transferred Embryos
Fresh Frozen Total & Percentage
Africa 0 0 0 0 0.00 %
Asia 62.418 4.086 6.699 10.785 2.88 %
Europe
(8 cts) 8.034 8.034 3.419 11.453 3.06 %
N.
America 48.474 17.850 2.930 20.780 5.56 %
S. America 325.349 307.278 15.879 323.157 86,44 %
Oceania 9.196 6.679 1.015 7.694 2.06 %
Total 453.471 343.927 29.942 373.869 100.00 %
2010
Totals 450.549 315.715 23.970 339.685
Per Cent
Change 0.65 % 8.94 % 24.91 % 10.06 %
Table: Bovine In vitro Produced Embryos in 2011
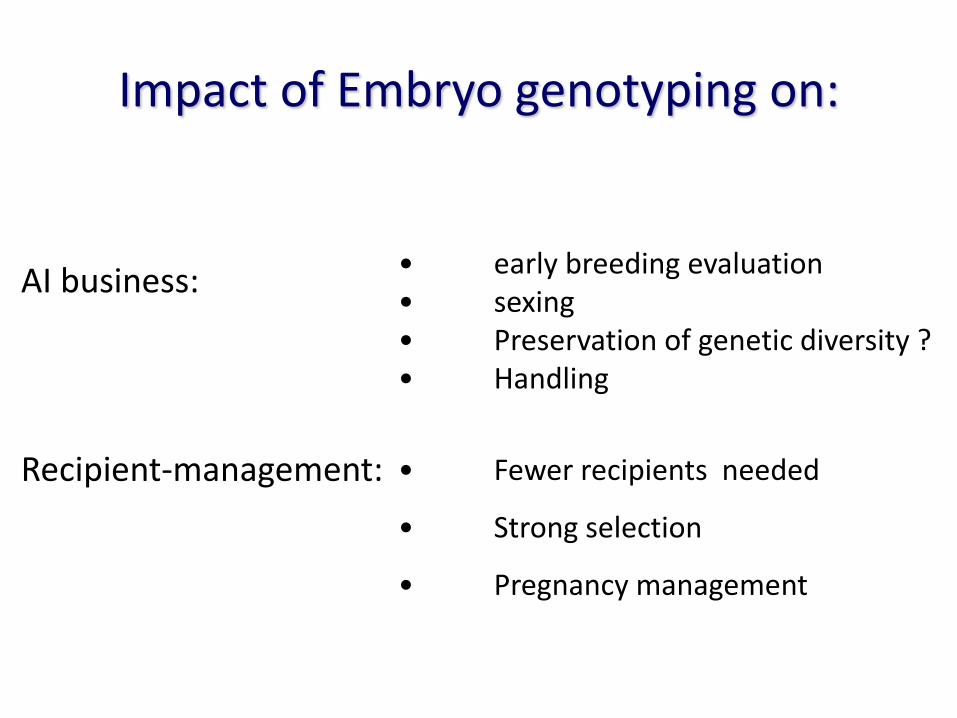
Impact of Embryo genotyping on:
• early breeding evaluation • sexing • Preservation of genetic diversity ? • Handling
AI business:
Recipient-management: • Fewer recipients needed
• Strong selection
• Pregnancy management

Thank you for your attention!
Acknowledgement : K. Roschlau, C. Ponsart,
H. Knin, S. Merton
S. Lacase, P. Vos