Embed Size (px)
Citation preview
1
Practices of child rearing in the remote north and suburban regions in Albania
Prepared by Prof. Dr. Adem Tamo & Prof. Dr. Theodhori Karaj
Project Coordinator: Prof As. Dr. Edmond Rapti
Study Report Prepared by the Human Development Center, Tirana, Albania
2007
2
CONTENT 1. Preface 3 2. Executive summary 4
2.1 Findings of the study 4
3. Methodology 9 4. Study results 10
5. Parents’ roles (Who takes care of the child) 10
5.1 Child’s feeding practices 11 5.2 Feeding practices of children from zero to six months 11 5.3 Feeding practices of children from six to nine months 15 5.4 Feeding practices of children from nine to twelve months 17 5.5 Feeding practices of children from twelve to thirtysix months 19
6. Parents’ information on child’s general development 28 6.1 Parents’ information of the child’s physical and motor development 28 6.2 Parents’ information on the child’s linguistic and cognitive development 34 6.3 Parents’ information on child’s emotional and social development 38
7. Data on the stimulation of child’s linguistic-cognitive and emotional-social
development 40 7.1 Traces on the conditions and physical circumstances applied to stimulate child’s development 40 7.2 Parents’ use of the conditions available for the child development 43 7.3 Parents’ evaluation on the pre schoolers’ abilities 45
8. Data on children’s gender treatment differences 46 9. Recommendations 47
10. Appendix (study tools) 49
3
INTRODUCTION The study presented in this report is part of the activities that UNICEF Albania conducted to identify the current practices of the rearing and development of children from zero to six months in the remote northern and suburban areas in Albania. The study was conducted at the initial stage of a five year program carried out by UNICEF Albania. The findings of the study will be the foundation for interventions by UNICEF and other public and non public agencies in the area of early childhood in Albania. Acknowledgment We would like to thank the UNICEF office in Albania as well as Ms. Mirlinda Bushati for the interest, support and endeavours to the project coordination. The assistance and recommendations provided were very valuable to the study. The study report is a result of the work performed by a team under the guidance of Prof. Dr. Theodhori Karaj and Prof. Dr. Adem Tamo. On this occasion we would like to thank the interviewers’ team and MA. Anila Sulstarova, MA. Migena Buka, Mirlinda Hoço, Nadja Kallçiu, Ornela Zhilla,
Anisa Çela as well as the senior project coordinator Prof. As. Edmond Rapti.
4
EXECUTIVE SUMMARY Introduction The purpose of the study is to provide a detailed description of the knowledge and practices of child rearing and care that impact the physical, cognitive, social and emotional development of children from zero to six years of age in the distant areas of North Albania and the suburban areas in Tirana and Durres. The findings of the study will be used by UNICEF and other organisations in the context of the implementation of the programs on early childhood in Albania. The data were obtained from the interviews with child care providers (mostly mothers). The sample was randomly selected in Peshkopi, Kukes, Has, Bathore and Kenete. The study utilises a combination of qualitative and quantitative methods. The interviews were conducted by the interviewers team involved in the study. The data were collected in August-November 2006. Findings of the study Child Care
1. Women in the household are the main care providers for children from zero to six years old in the areas subject to the study: initially the mother, later the grandmother and to a considerable extent the old sisters of the child.
2. Mothers are the main care providers; they feed, clean, dress, stimulate, and immediately meet the needs of children from zero to six years of age (96.1%).
3. Fathers’ involvement in providing the basic care to the child is very low (0.8%). This is more characteristic in rural families.
4. Fathers’ involvement, when it actually happens, consists of playing with the child rather than feeding, dressing or providing other services to it.
5. Women and other females in the household have deeply implanted in their mind the idea that they should be the main child care providers (91.3%).
Child feeding practices
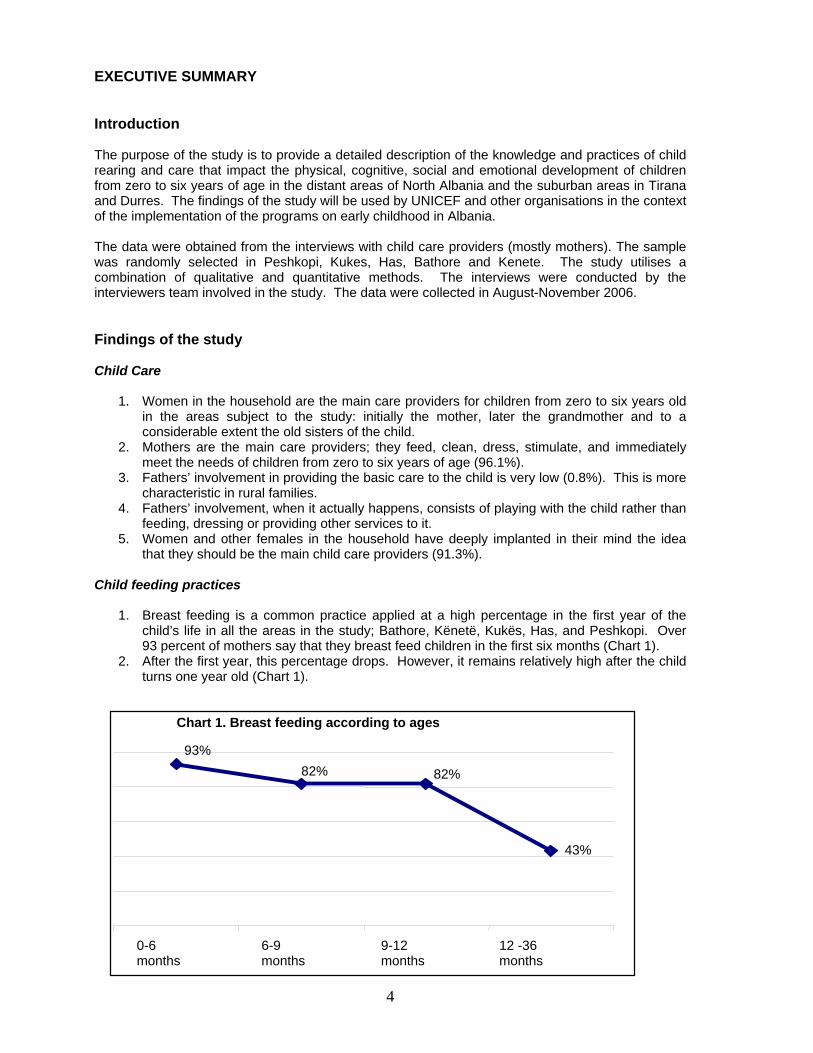
1. Breast feeding is a common practice applied at a high percentage in the first year of the child’s life in all the areas in the study; Bathore, Kënetë, Kukës, Has, and Peshkopi. Over 93 percent of mothers say that they breast feed children in the first six months (Chart 1).
2. After the first year, this percentage drops. However, it remains relatively high after the child turns one year old (Chart 1).
Chart 1. Breast feeding according to ages
43%
82%82%
93%
0-6 months
6-9 months
9-12 months
12 -36 months
5
3. Although breast feeding accounts for a high percentage, mothers and other respondents are
not aware in details of the specific benefits of breast feeding both for the child and the mother herself.
4. About 70 percent of mothers responded that they began breast feeding three hours after the birth; meanwhile the time recommended is one to two hours after the birth.
5. 82.2 percent of the respondents admit that breast feeding is the only food for a child from zero to six months old. However, 12.7 percent or one out of eight mothers think that breast feeding is not exclusive for the first six months of the child’s life.
6. The percentage of respondents in rural areas who disagree with the fact that breast feeding is the only food for a child up to six months is twice as high as mothers in urban areas (18.5% against 7.4%).
7. Although a high percentage of the respondents consider breast feeding as the only food for a sixth month child, over 40 percent of them say that they have provided their children with supplemental food since the first six months of their life.
8. In many cases, due to the over-estimation of the values of breast milk, the supplemental food is introduced later than recommended. 13 percent of six to nine month age group and 10 percent of nine to twelve month old age group are not provided with any food in addition to the breast milk.
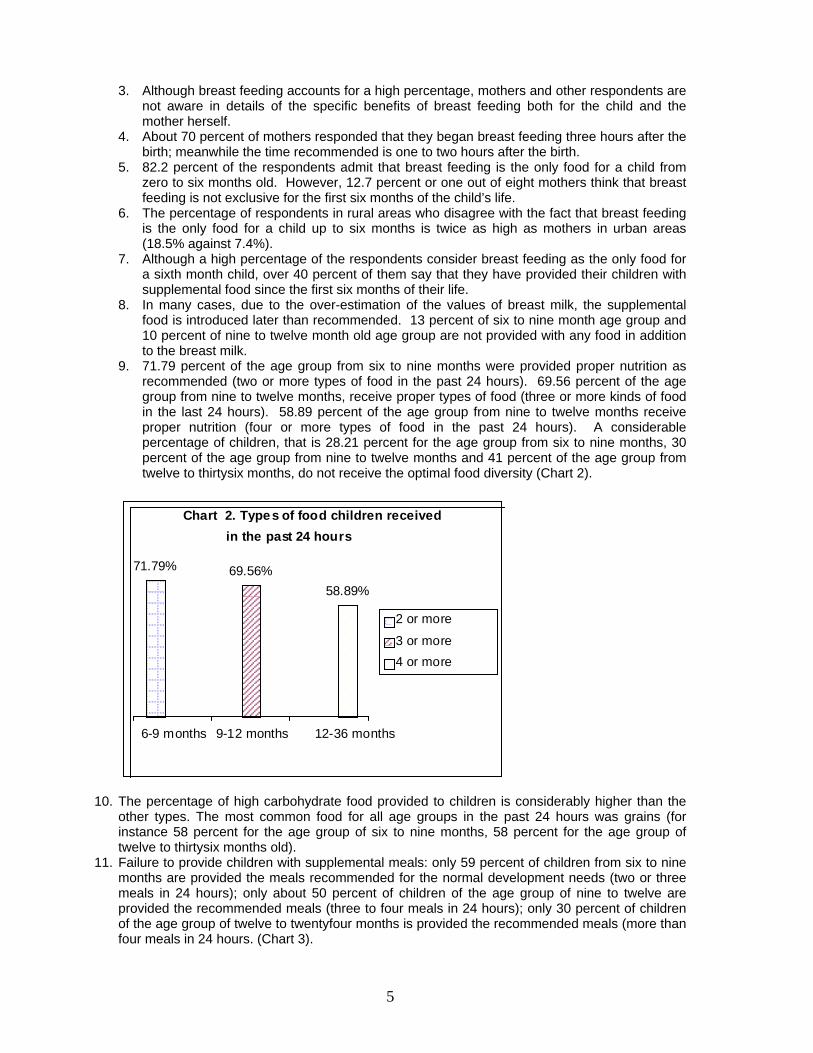
9. 71.79 percent of the age group from six to nine months were provided proper nutrition as recommended (two or more types of food in the past 24 hours). 69.56 percent of the age group from nine to twelve months, receive proper types of food (three or more kinds of food in the last 24 hours). 58.89 percent of the age group from nine to twelve months receive proper nutrition (four or more types of food in the past 24 hours). A considerable percentage of children, that is 28.21 percent for the age group from six to nine months, 30 percent of the age group from nine to twelve months and 41 percent of the age group from twelve to thirtysix months, do not receive the optimal food diversity (Chart 2).
Chart 2. Type s of food children received
in the past 24 hours
71.79% 69.56% 58.89%
6-9 months 9-12 months 12-36 months
2 or more
3 or more
4 or more
10. The percentage of high carbohydrate food provided to children is considerably higher than the
other types. The most common food for all age groups in the past 24 hours was grains (for instance 58 percent for the age group of six to nine months, 58 percent for the age group of twelve to thirtysix months old).
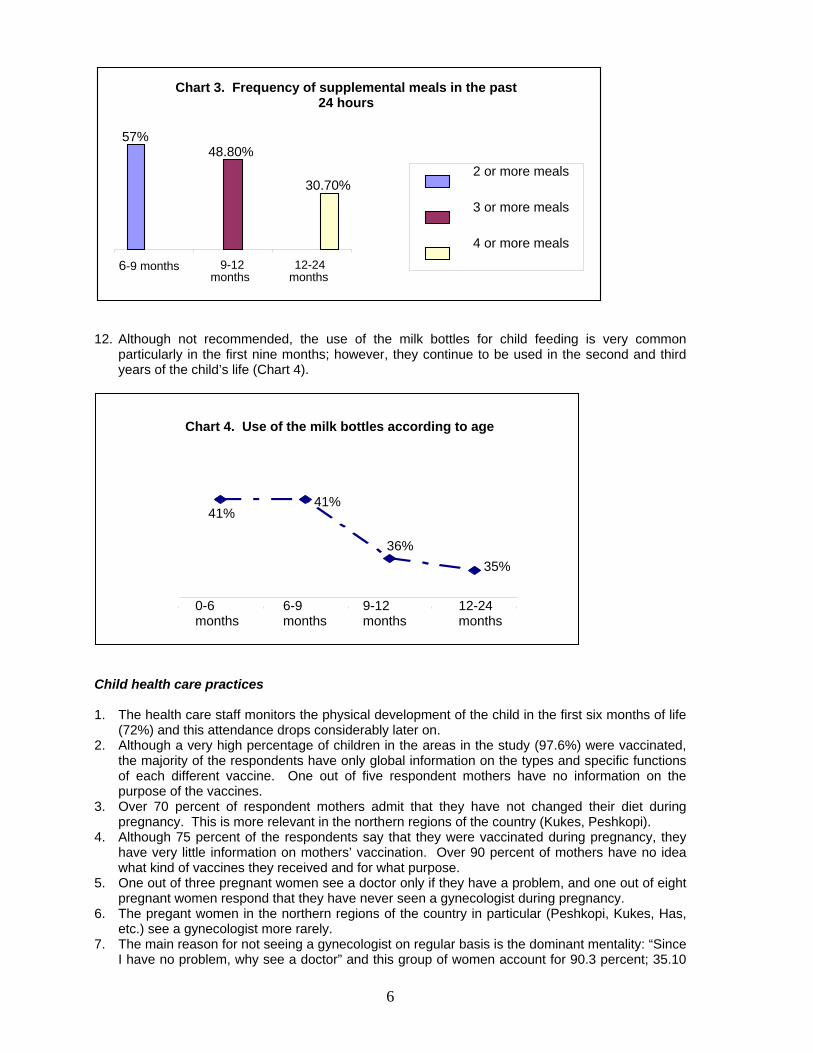
11. Failure to provide children with supplemental meals: only 59 percent of children from six to nine months are provided the meals recommended for the normal development needs (two or three meals in 24 hours); only about 50 percent of children of the age group of nine to twelve are provided the recommended meals (three to four meals in 24 hours); only 30 percent of children of the age group of twelve to twentyfour months is provided the recommended meals (more than four meals in 24 hours. (Chart 3).
6
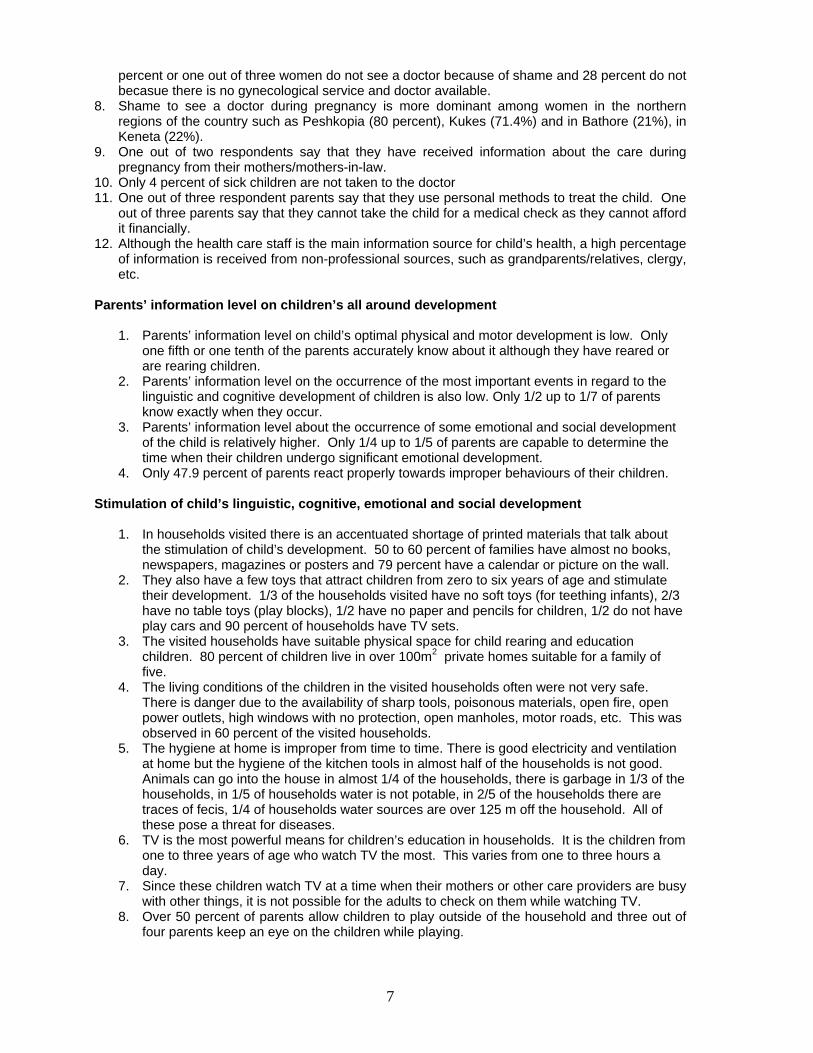
12. Although not recommended, the use of the milk bottles for child feeding is very common
particularly in the first nine months; however, they continue to be used in the second and third years of the child’s life (Chart 4).
Child health care practices 1. The health care staff monitors the physical development of the child in the first six months of life
(72%) and this attendance drops considerably later on. 2. Although a very high percentage of children in the areas in the study (97.6%) were vaccinated,
the majority of the respondents have only global information on the types and specific functions of each different vaccine. One out of five respondent mothers have no information on the purpose of the vaccines.
3. Over 70 percent of respondent mothers admit that they have not changed their diet during pregnancy. This is more relevant in the northern regions of the country (Kukes, Peshkopi).
4. Although 75 percent of the respondents say that they were vaccinated during pregnancy, they have very little information on mothers’ vaccination. Over 90 percent of mothers have no idea what kind of vaccines they received and for what purpose.
5. One out of three pregnant women see a doctor only if they have a problem, and one out of eight pregnant women respond that they have never seen a gynecologist during pregnancy.
6. The pregant women in the northern regions of the country in particular (Peshkopi, Kukes, Has, etc.) see a gynecologist more rarely.
7. The main reason for not seeing a gynecologist on regular basis is the dominant mentality: “Since I have no problem, why see a doctor” and this group of women account for 90.3 percent; 35.10
Chart 4. Use of the milk bottles according to age
41%
35%
36%
41%
0-6 months
6-9 months
9-12 months
12-24 months
Chart 3. Frequency of supplemental meals in the past 24 hours
57%
48.80%
30.70%
6-9 months 9-12months
12-24 months
2 or more meals
3 or more meals
4 or more meals
7
percent or one out of three women do not see a doctor because of shame and 28 percent do not becasue there is no gynecological service and doctor available.
8. Shame to see a doctor during pregnancy is more dominant among women in the northern regions of the country such as Peshkopia (80 percent), Kukes (71.4%) and in Bathore (21%), in Keneta (22%).
9. One out of two respondents say that they have received information about the care during pregnancy from their mothers/mothers-in-law.
10. Only 4 percent of sick children are not taken to the doctor 11. One out of three respondent parents say that they use personal methods to treat the child. One
out of three parents say that they cannot take the child for a medical check as they cannot afford it financially.
12. Although the health care staff is the main information source for child’s health, a high percentage of information is received from non-professional sources, such as grandparents/relatives, clergy, etc.
Parents’ information level on children’s all around development
1. Parents’ information level on child’s optimal physical and motor development is low. Only one fifth or one tenth of the parents accurately know about it although they have reared or are rearing children.
2. Parents’ information level on the occurrence of the most important events in regard to the linguistic and cognitive development of children is also low. Only 1/2 up to 1/7 of parents know exactly when they occur.
3. Parents’ information level about the occurrence of some emotional and social development of the child is relatively higher. Only 1/4 up to 1/5 of parents are capable to determine the time when their children undergo significant emotional development.
4. Only 47.9 percent of parents react properly towards improper behaviours of their children.
Stimulation of child’s linguistic, cognitive, emotional and social development
1. In households visited there is an accentuated shortage of printed materials that talk about the stimulation of child’s development. 50 to 60 percent of families have almost no books, newspapers, magazines or posters and 79 percent have a calendar or picture on the wall.
2. They also have a few toys that attract children from zero to six years of age and stimulate their development. 1/3 of the households visited have no soft toys (for teething infants), 2/3 have no table toys (play blocks), 1/2 have no paper and pencils for children, 1/2 do not have play cars and 90 percent of households have TV sets.
3. The visited households have suitable physical space for child rearing and education children. 80 percent of children live in over 100m2 private homes suitable for a family of five.
4. The living conditions of the children in the visited households often were not very safe. There is danger due to the availability of sharp tools, poisonous materials, open fire, open power outlets, high windows with no protection, open manholes, motor roads, etc. This was observed in 60 percent of the visited households.
5. The hygiene at home is improper from time to time. There is good electricity and ventilation at home but the hygiene of the kitchen tools in almost half of the households is not good. Animals can go into the house in almost 1/4 of the households, there is garbage in 1/3 of the households, in 1/5 of households water is not potable, in 2/5 of the households there are traces of fecis, 1/4 of households water sources are over 125 m off the household. All of these pose a threat for diseases.
6. TV is the most powerful means for children’s education in households. It is the children from one to three years of age who watch TV the most. This varies from one to three hours a day.
7. Since these children watch TV at a time when their mothers or other care providers are busy with other things, it is not possible for the adults to check on them while watching TV.
8. Over 50 percent of parents allow children to play outside of the household and three out of four parents keep an eye on the children while playing.
8
9. Parents are interested in stimulating child’s development. However, as mentioned above, because of the shortage of toys and printed materials, it is hard to presume to what extent they are used for children. 30.5 percent of children attend kindergarden.
10. The main reason mentioned for not attending kindergarden is that parents themselves are day care providers. It is evident the fact that kindergardens are underestimated when it comes to options it provides to child development.
11. The respondents revealed shortage of parential skills. This is more evident when it comes to their involvement in playing with children, their reaction to children’s delicate questions, their endeavours to discipline them and manage conflicts.
12. Parents are not well informed of the parameters that children have to meet before going to school. The most important parameters from the point of view of 1/2-1/3 of parents are: child’s skills to meet independently his/her personal needs, good physical development, skills to differentiate between colors and shapes, singing and dancing, as well as motor skills. As the rest of parents underrate these parameters, it is understandable that they shift the burden of child development onto the school.
Children’s gender differentiation
1. The study shows that girls are expected to do housework earlier than boys are asked to do any kind of job. It also reveals that girls associate with girls and boys associate with boys. Girls are brought up in a way to make them feel dependent on others whereas boys are brought up to be independent. Parents are tolerant of boys and intolerant of girls.
2. Gender differentiation among children is evident at an early age. Parents adopt different attitudes when it comes to trusting children. Girls are discriminated compared to boys. There are contradictions between parents’ trust and practices they apply when dealing with boys and girls.
CHILD DEVELOPMENT PRACTICES IN THE REMOTE NORTH AND SUB URBAN REGIONS IN ALBANIA
INTRODUCTION Goals of the study The goals of the study was to provide a detailed picture about the knowledge and practices related to child rearing that impact the general physicial, cognitive, social and emotional development of children from zero to six years of age in the remote regions in the north of Albania and sub urban areas in Tirana and Durres. At the same time the study also intended to give recommendations concerning the actions that the government agencies and civil society should take in order to improve the early childhool situation in the areas inr the study. These goals were achieved by studying such issues as who takes care of the child in the householdy (the roles and responsibilities of mother, father, grandparents, etc); child feeding practices, child health care, hygiene at home, child physical, mental, emotional and personality stimulation, knowledge about child development, differentiations in treating boys and girls, etc. Methodology Sample selection The study is based on a sample of 800 people (mainly mothers) with children aging from zero to six years old in the northern regions of Peshkopia, Kukes and Has as well as in the suburban areas in Bathore and Kenete. The sample has been randomnly selected, intending to guarantee a broad geographic representation, the family size, the education level as well as the age groups from zero to six in all the above regions. The study is structured in a way intending to draw general conclusions based on the data collected on these regions.
9
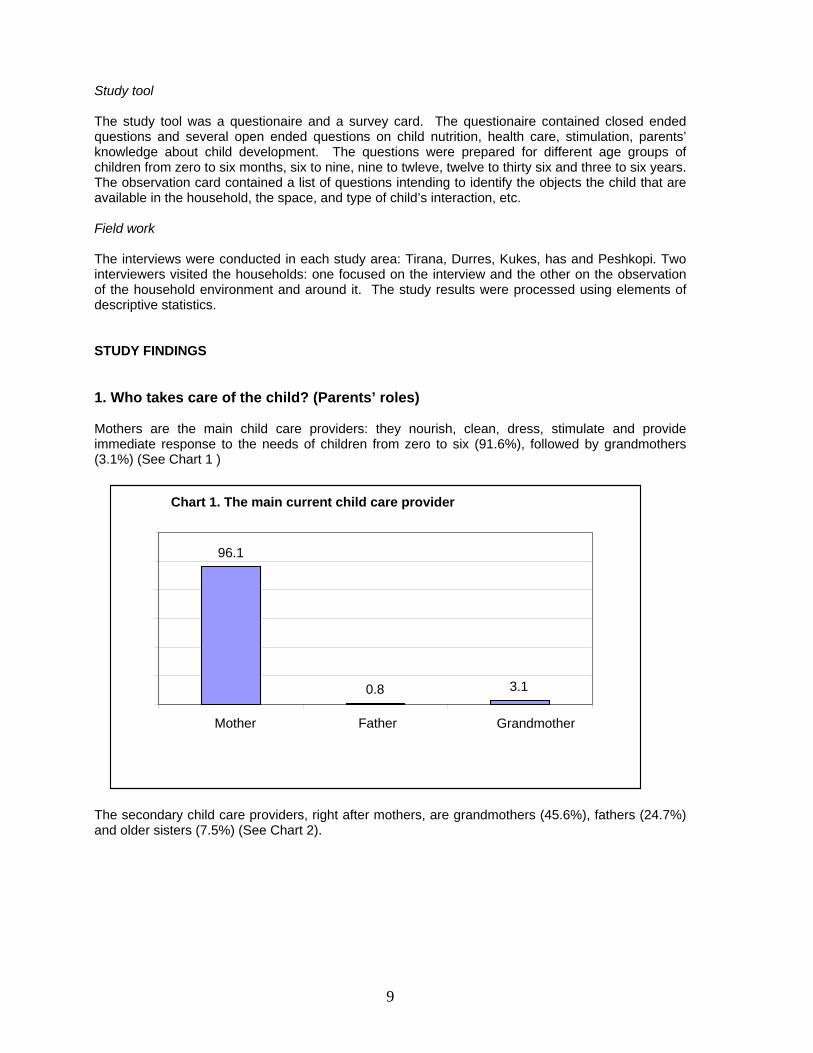
Study tool The study tool was a questionaire and a survey card. The questionaire contained closed ended questions and several open ended questions on child nutrition, health care, stimulation, parents’ knowledge about child development. The questions were prepared for different age groups of children from zero to six months, six to nine, nine to twleve, twelve to thirty six and three to six years. The observation card contained a list of questions intending to identify the objects the child that are available in the household, the space, and type of child’s interaction, etc. Field work The interviews were conducted in each study area: Tirana, Durres, Kukes, has and Peshkopi. Two interviewers visited the households: one focused on the interview and the other on the observation of the household environment and around it. The study results were processed using elements of descriptive statistics. STUDY FINDINGS 1. Who takes care of the child? (Parents’ roles) Mothers are the main child care providers: they nourish, clean, dress, stimulate and provide immediate response to the needs of children from zero to six (91.6%), followed by grandmothers (3.1%) (See Chart 1 )
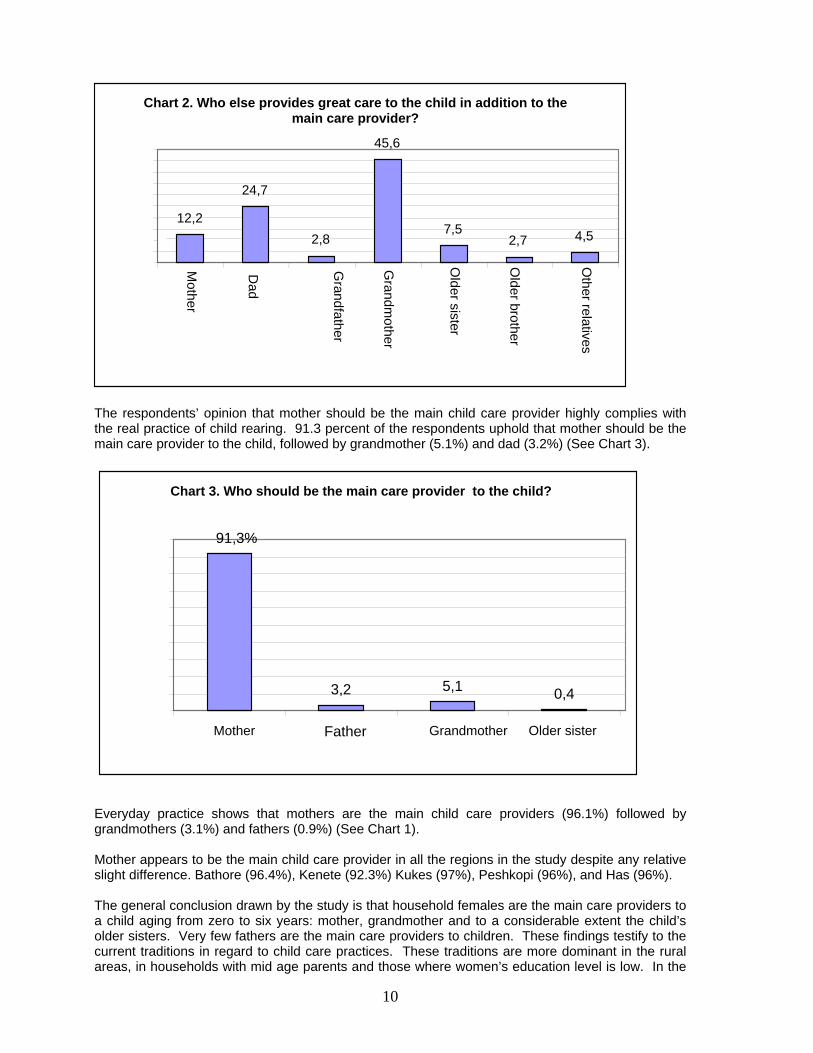
The secondary child care providers, right after mothers, are grandmothers (45.6%), fathers (24.7%) and older sisters (7.5%) (See Chart 2).
Chart 1. The main current child care provider
96.1
0.8 3.1
Mother Father Grandmother
10
The respondents’ opinion that mother should be the main child care provider highly complies with the real practice of child rearing. 91.3 percent of the respondents uphold that mother should be the main care provider to the child, followed by grandmother (5.1%) and dad (3.2%) (See Chart 3).
Everyday practice shows that mothers are the main child care providers (96.1%) followed by grandmothers (3.1%) and fathers (0.9%) (See Chart 1). Mother appears to be the main child care provider in all the regions in the study despite any relative slight difference. Bathore (96.4%), Kenete (92.3%) Kukes (97%), Peshkopi (96%), and Has (96%). The general conclusion drawn by the study is that household females are the main care providers to a child aging from zero to six years: mother, grandmother and to a considerable extent the child’s older sisters. Very few fathers are the main care providers to children. These findings testify to the current traditions in regard to child care practices. These traditions are more dominant in the rural areas, in households with mid age parents and those where women’s education level is low. In the
Chart 2. Who else provides great care to the child in addition to the main care provider?
12,2
24,7
2,8
45,6
7,52,7 4,5
Mother
Dad
Grandfather
Grandm
other
Older sister
Older brother
Other relatives
Chart 3. Who should be the main care provider to the child?
91,3%
3,2 5,1 0,4
Mother Father Grandmother Older sister
11
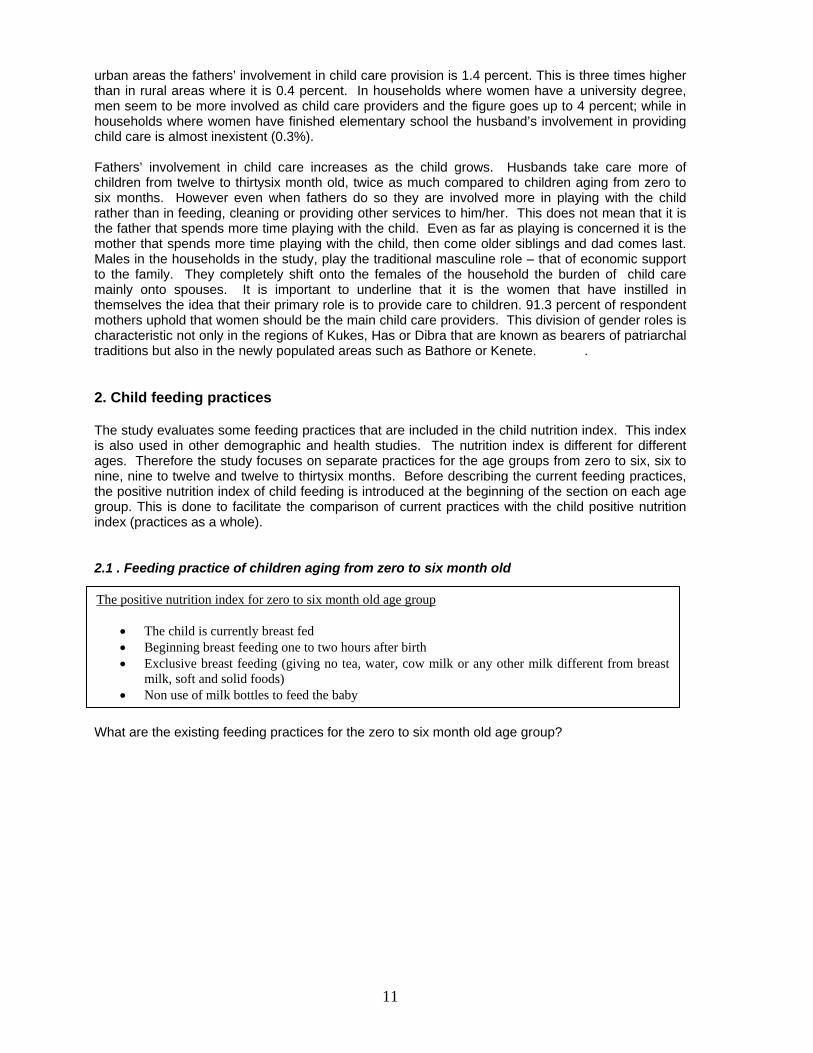
urban areas the fathers’ involvement in child care provision is 1.4 percent. This is three times higher than in rural areas where it is 0.4 percent. In households where women have a university degree, men seem to be more involved as child care providers and the figure goes up to 4 percent; while in households where women have finished elementary school the husband’s involvement in providing child care is almost inexistent (0.3%). Fathers’ involvement in child care increases as the child grows. Husbands take care more of children from twelve to thirtysix month old, twice as much compared to children aging from zero to six months. However even when fathers do so they are involved more in playing with the child rather than in feeding, cleaning or providing other services to him/her. This does not mean that it is the father that spends more time playing with the child. Even as far as playing is concerned it is the mother that spends more time playing with the child, then come older siblings and dad comes last. Males in the households in the study, play the traditional masculine role – that of economic support to the family. They completely shift onto the females of the household the burden of child care mainly onto spouses. It is important to underline that it is the women that have instilled in themselves the idea that their primary role is to provide care to children. 91.3 percent of respondent mothers uphold that women should be the main child care providers. This division of gender roles is characteristic not only in the regions of Kukes, Has or Dibra that are known as bearers of patriarchal traditions but also in the newly populated areas such as Bathore or Kenete. . 2. Child feeding practices The study evaluates some feeding practices that are included in the child nutrition index. This index is also used in other demographic and health studies. The nutrition index is different for different ages. Therefore the study focuses on separate practices for the age groups from zero to six, six to nine, nine to twelve and twelve to thirtysix months. Before describing the current feeding practices, the positive nutrition index of child feeding is introduced at the beginning of the section on each age group. This is done to facilitate the comparison of current practices with the child positive nutrition index (practices as a whole). 2.1 . Feeding practice of children aging from zero to six month old
What are the existing feeding practices for the zero to six month old age group?
The positive nutrition index for zero to six month old age group
The child is currently breast fed Beginning breast feeding one to two hours after birth Exclusive breast feeding (giving no tea, water, cow milk or any other milk different from breast
milk, soft and solid foods) Non use of milk bottles to feed the baby
12
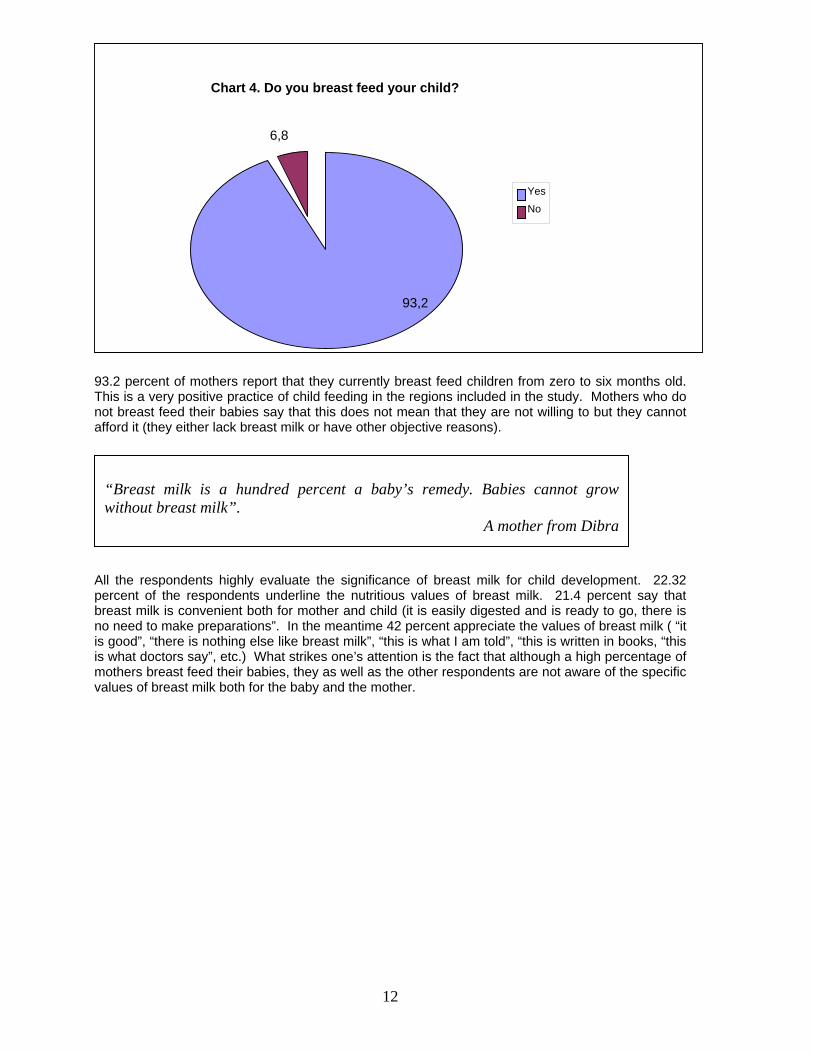
93.2 percent of mothers report that they currently breast feed children from zero to six months old. This is a very positive practice of child feeding in the regions included in the study. Mothers who do not breast feed their babies say that this does not mean that they are not willing to but they cannot afford it (they either lack breast milk or have other objective reasons).
All the respondents highly evaluate the significance of breast milk for child development. 22.32 percent of the respondents underline the nutritious values of breast milk. 21.4 percent say that breast milk is convenient both for mother and child (it is easily digested and is ready to go, there is no need to make preparations”. In the meantime 42 percent appreciate the values of breast milk ( “it is good”, “there is nothing else like breast milk”, “this is what I am told”, “this is written in books, “this is what doctors say”, etc.) What strikes one’s attention is the fact that although a high percentage of mothers breast feed their babies, they as well as the other respondents are not aware of the specific values of breast milk both for the baby and the mother.
Chart 4. Do you breast feed your child?
93,2
6,8
Yes
No
“Breast milk is a hundred percent a baby’s remedy. Babies cannot grow without breast milk”.
A mother from Dibra
13
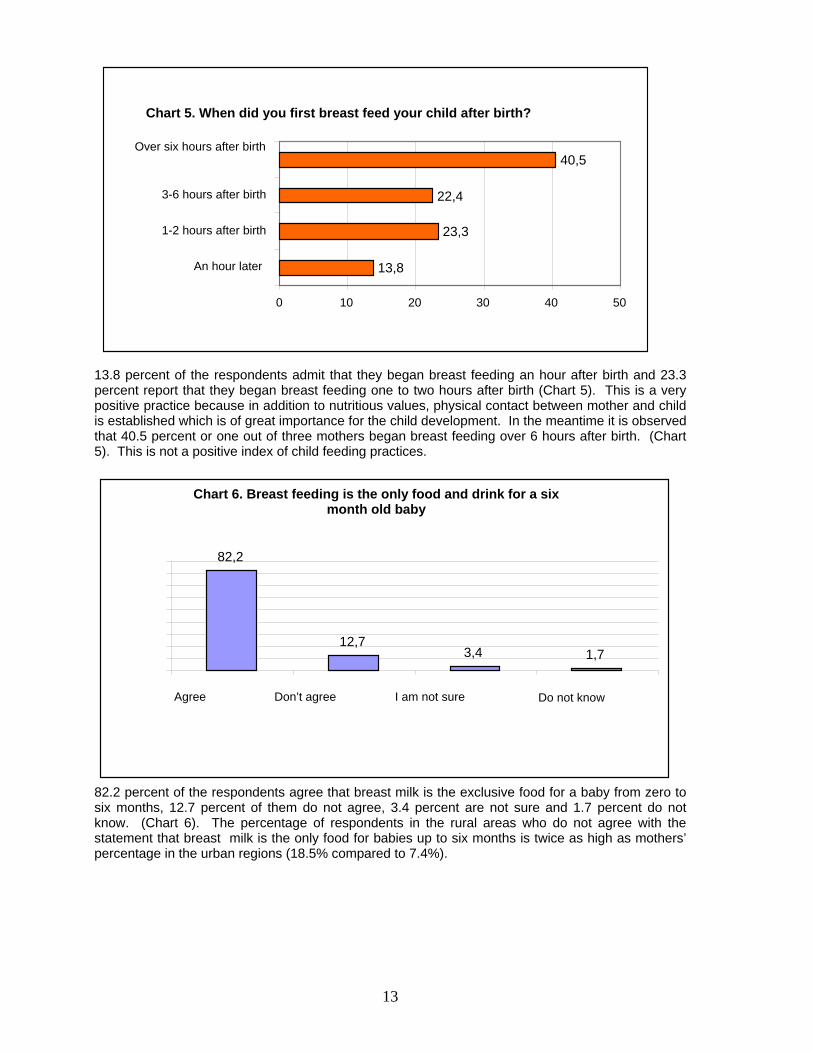
13.8 percent of the respondents admit that they began breast feeding an hour after birth and 23.3 percent report that they began breast feeding one to two hours after birth (Chart 5). This is a very positive practice because in addition to nutritious values, physical contact between mother and child is established which is of great importance for the child development. In the meantime it is observed that 40.5 percent or one out of three mothers began breast feeding over 6 hours after birth. (Chart 5). This is not a positive index of child feeding practices.
82.2 percent of the respondents agree that breast milk is the exclusive food for a baby from zero to six months, 12.7 percent of them do not agree, 3.4 percent are not sure and 1.7 percent do not know. (Chart 6). The percentage of respondents in the rural areas who do not agree with the statement that breast milk is the only food for babies up to six months is twice as high as mothers’ percentage in the urban regions (18.5% compared to 7.4%).
Chart 6. Breast feeding is the only food and drink for a six month old baby
82,2
12,73,4 1,7
Agree Don’t agree I am not sure Do not know
Chart 5. When did you first breast feed your child after birth?
13,8
23,3
22,4
40,5
0 10 20 30 40 50
An hour later
1-2 hours after birth
3-6 hours after birth
Over six hours after birth
14
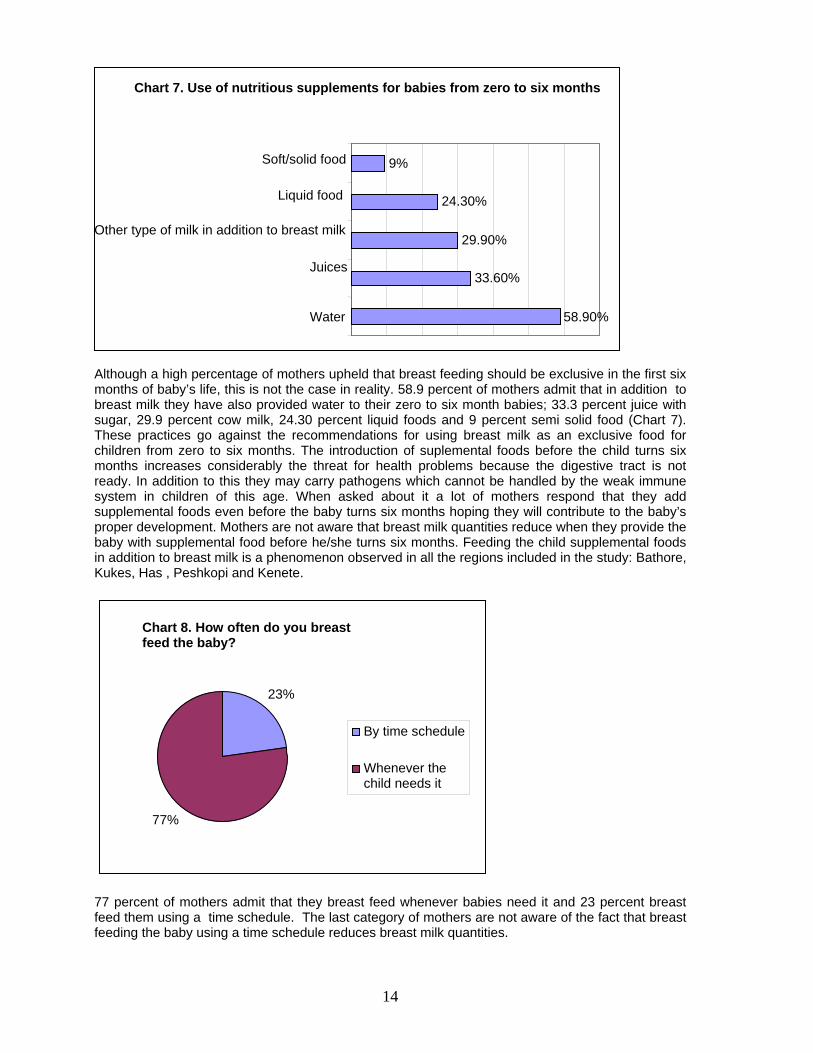
Although a high percentage of mothers upheld that breast feeding should be exclusive in the first six months of baby’s life, this is not the case in reality. 58.9 percent of mothers admit that in addition to breast milk they have also provided water to their zero to six month babies; 33.3 percent juice with sugar, 29.9 percent cow milk, 24.30 percent liquid foods and 9 percent semi solid food (Chart 7). These practices go against the recommendations for using breast milk as an exclusive food for children from zero to six months. The introduction of suplemental foods before the child turns six months increases considerably the threat for health problems because the digestive tract is not ready. In addition to this they may carry pathogens which cannot be handled by the weak immune system in children of this age. When asked about it a lot of mothers respond that they add supplemental foods even before the baby turns six months hoping they will contribute to the baby’s proper development. Mothers are not aware that breast milk quantities reduce when they provide the baby with supplemental food before he/she turns six months. Feeding the child supplemental foods in addition to breast milk is a phenomenon observed in all the regions included in the study: Bathore, Kukes, Has , Peshkopi and Kenete.
77 percent of mothers admit that they breast feed whenever babies need it and 23 percent breast feed them using a time schedule. The last category of mothers are not aware of the fact that breast feeding the baby using a time schedule reduces breast milk quantities.
Chart 7. Use of nutritious supplements for babies from zero to six months
58.90%
33.60%
29.90%
24.30%
9%
Water
Juices
Other type of milk in addition to breast milk
Liquid food
Soft/solid food
Chart 8. How often do you breast feed the baby?
23%
77%
By time schedule
Whenever the child needs it
15
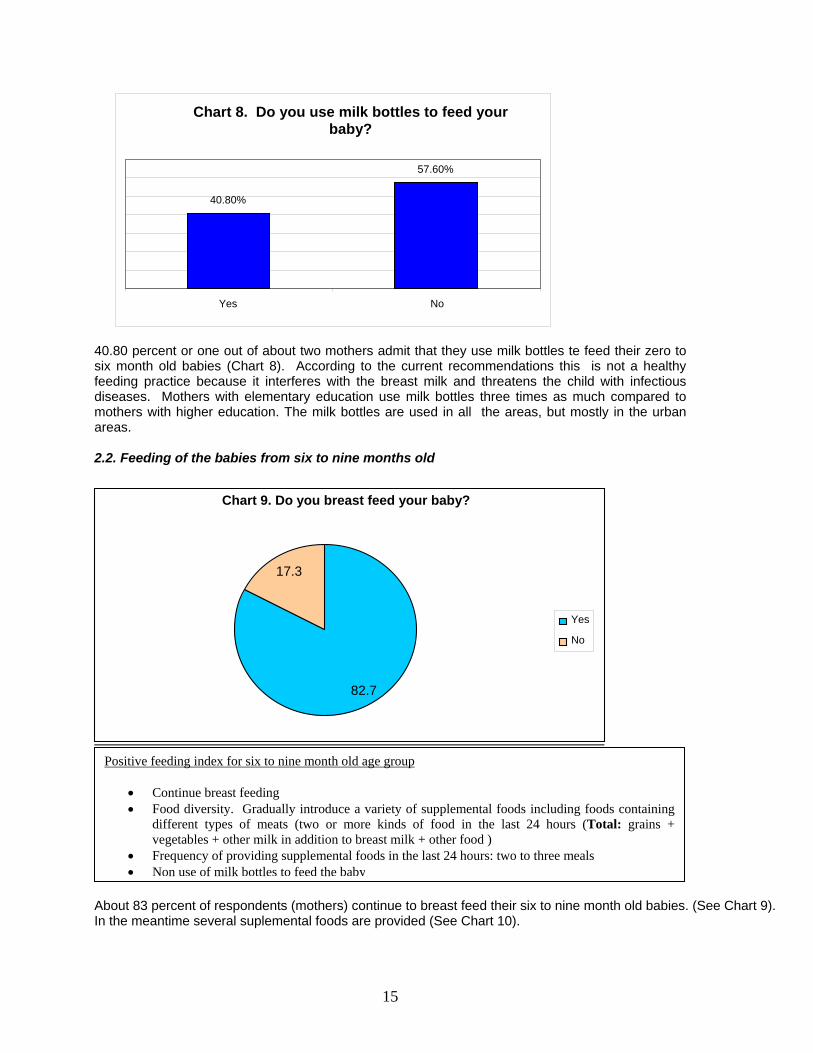
40.80 percent or one out of about two mothers admit that they use milk bottles te feed their zero to six month old babies (Chart 8). According to the current recommendations this is not a healthy feeding practice because it interferes with the breast milk and threatens the child with infectious diseases. Mothers with elementary education use milk bottles three times as much compared to mothers with higher education. The milk bottles are used in all the areas, but mostly in the urban areas. 2.2. Feeding of the babies from six to nine months old
About 83 percent of respondents (mothers) continue to breast feed their six to nine month old babies. (See Chart 9). In the meantime several suplemental foods are provided (See Chart 10).
Chart 9. Do you breast feed your baby?
82.7
17.3
Yes
No
Chart 8. Do you use milk bottles to feed your baby?
40.80%
57.60%
Yes No
Positive feeding index for six to nine month old age group
Continue breast feeding Food diversity. Gradually introduce a variety of supplemental foods including foods containing
different types of meats (two or more kinds of food in the last 24 hours (Total: grains + vegetables + other milk in addition to breast milk + other food )
Frequency of providing supplemental foods in the last 24 hours: two to three meals Non use of milk bottles to feed the baby
16
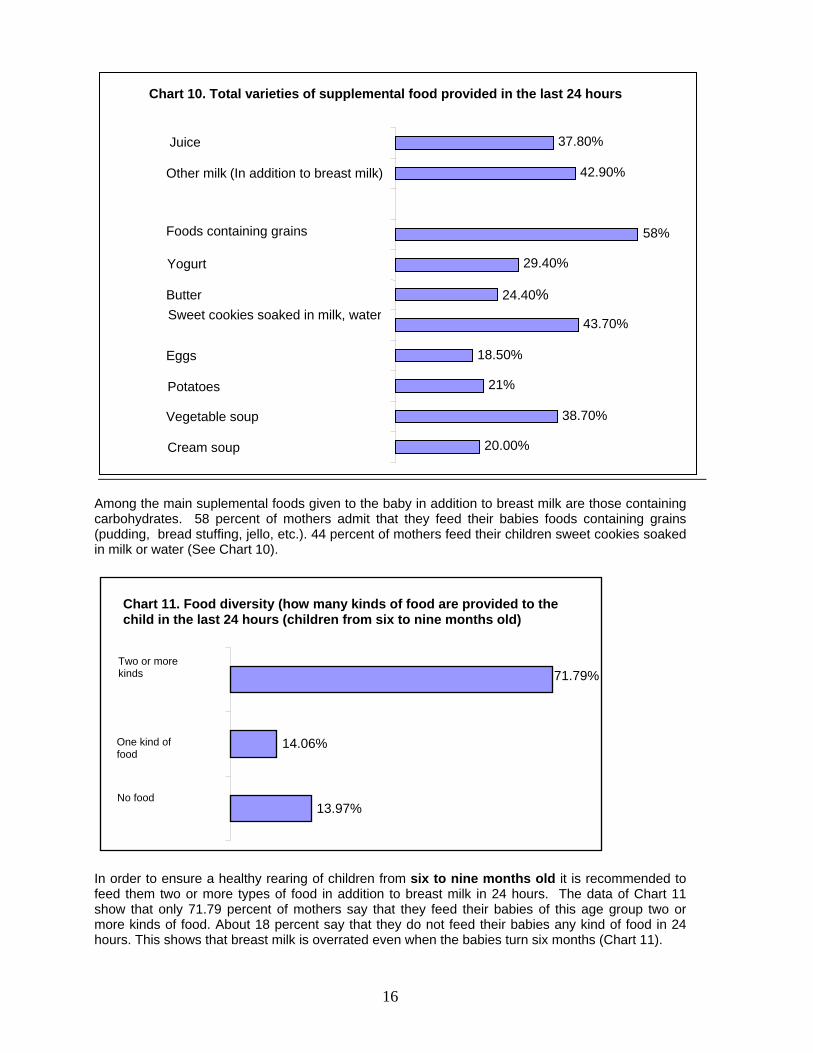
Among the main suplemental foods given to the baby in addition to breast milk are those containing carbohydrates. 58 percent of mothers admit that they feed their babies foods containing grains (pudding, bread stuffing, jello, etc.). 44 percent of mothers feed their children sweet cookies soaked in milk or water (See Chart 10).
In order to ensure a healthy rearing of children from six to nine months old it is recommended to feed them two or more types of food in addition to breast milk in 24 hours. The data of Chart 11 show that only 71.79 percent of mothers say that they feed their babies of this age group two or more kinds of food. About 18 percent say that they do not feed their babies any kind of food in 24 hours. This shows that breast milk is overrated even when the babies turn six months (Chart 11).
Chart 11. Food diversity (how many kinds of food are provided to the child in the last 24 hours (children from six to nine months old)
13.97%
14.06%
71.79%
No food
One kind of food
Two or more kinds
Chart 10. Total varieties of supplemental food provided in the last 24 hours
20.00%
38.70%
21%
18.50%
43.70%
24.40%
29.40%
58%
42.90%
37.80%
Cream soup
Vegetable soup
Potatoes
Eggs
Sweet cookies soaked in milk, water
Butter
Yogurt
Foods containing grains
Other milk (In addition to breast milk)
Juice
17
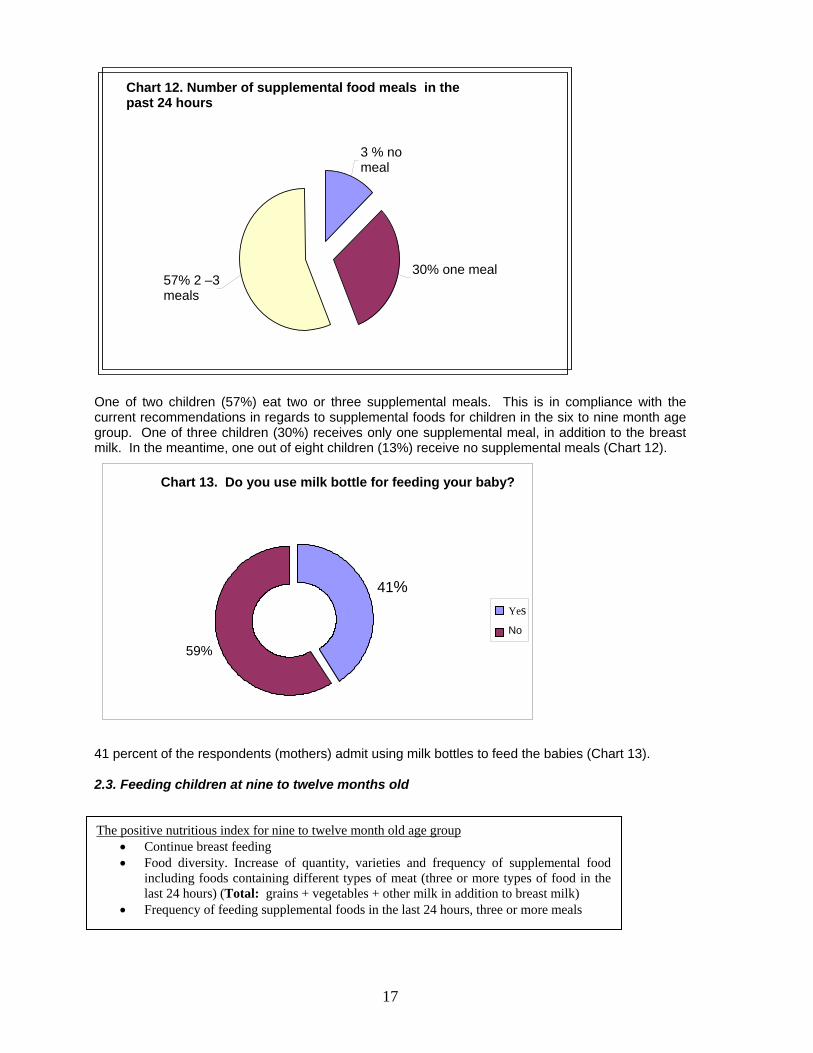
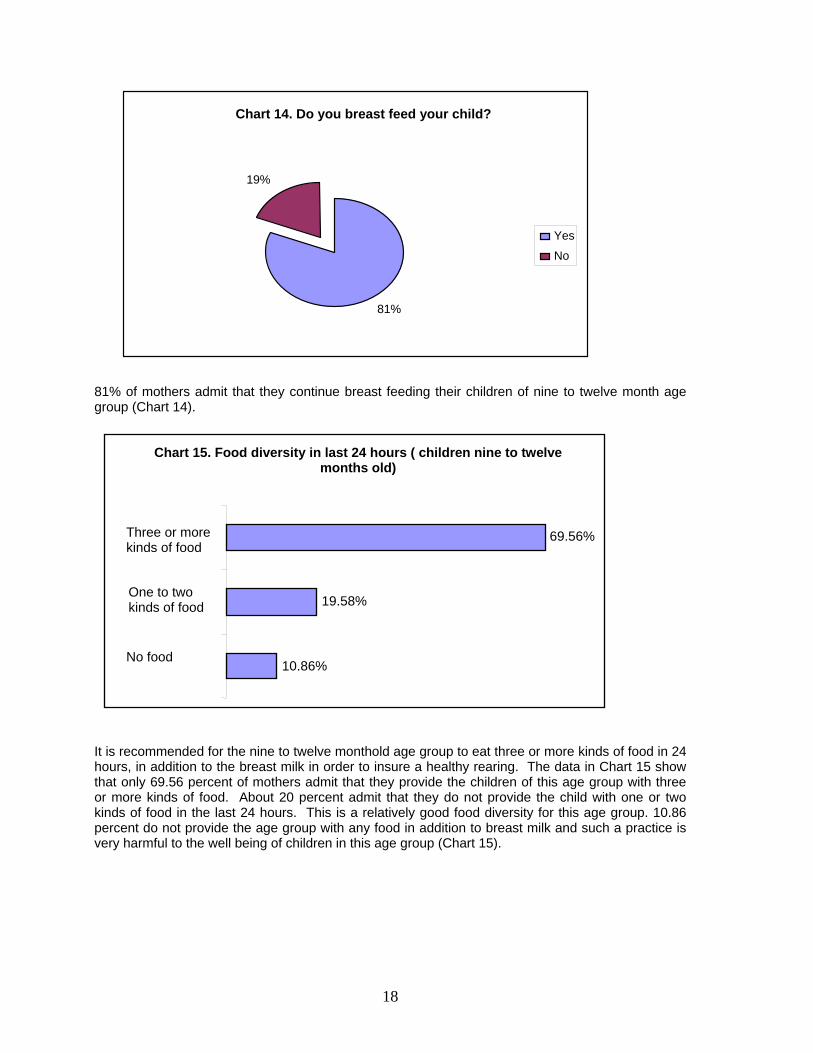
One of two children (57%) eat two or three supplemental meals. This is in compliance with the current recommendations in regards to supplemental foods for children in the six to nine month age group. One of three children (30%) receives only one supplemental meal, in addition to the breast milk. In the meantime, one out of eight children (13%) receive no supplemental meals (Chart 12). 41 percent of the respondents (mothers) admit using milk bottles to feed the babies (Chart 13). 2.3. Feeding children at nine to twelve months old
Chart 12. Number of supplemental food meals in the past 24 hours
30% one meal 57% 2 –3
meals
3 % no meal
The positive nutritious index for nine to twelve month old age group Continue breast feeding Food diversity. Increase of quantity, varieties and frequency of supplemental food
including foods containing different types of meat (three or more types of food in the last 24 hours) (Total: grains + vegetables + other milk in addition to breast milk)
Frequency of feeding supplemental foods in the last 24 hours, three or more meals
Chart 13. Do you use milk bottle for feeding your baby?
59%
41%
Yes
No
18
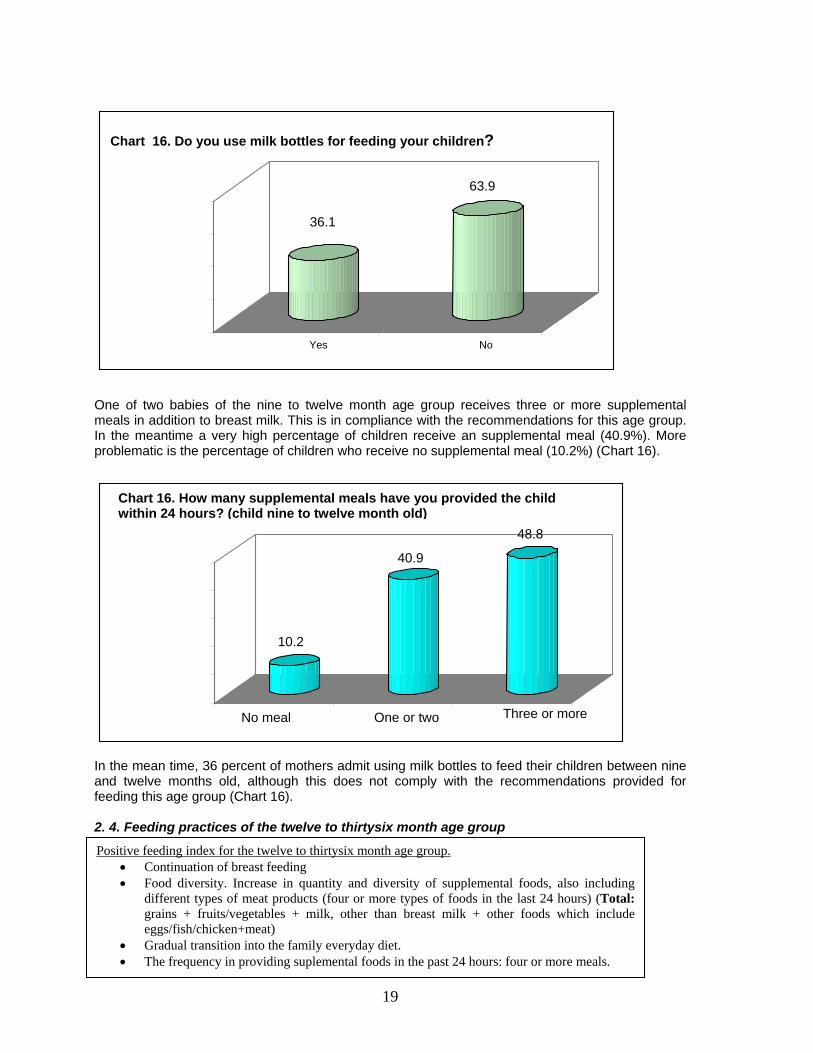
81% of mothers admit that they continue breast feeding their children of nine to twelve month age group (Chart 14).
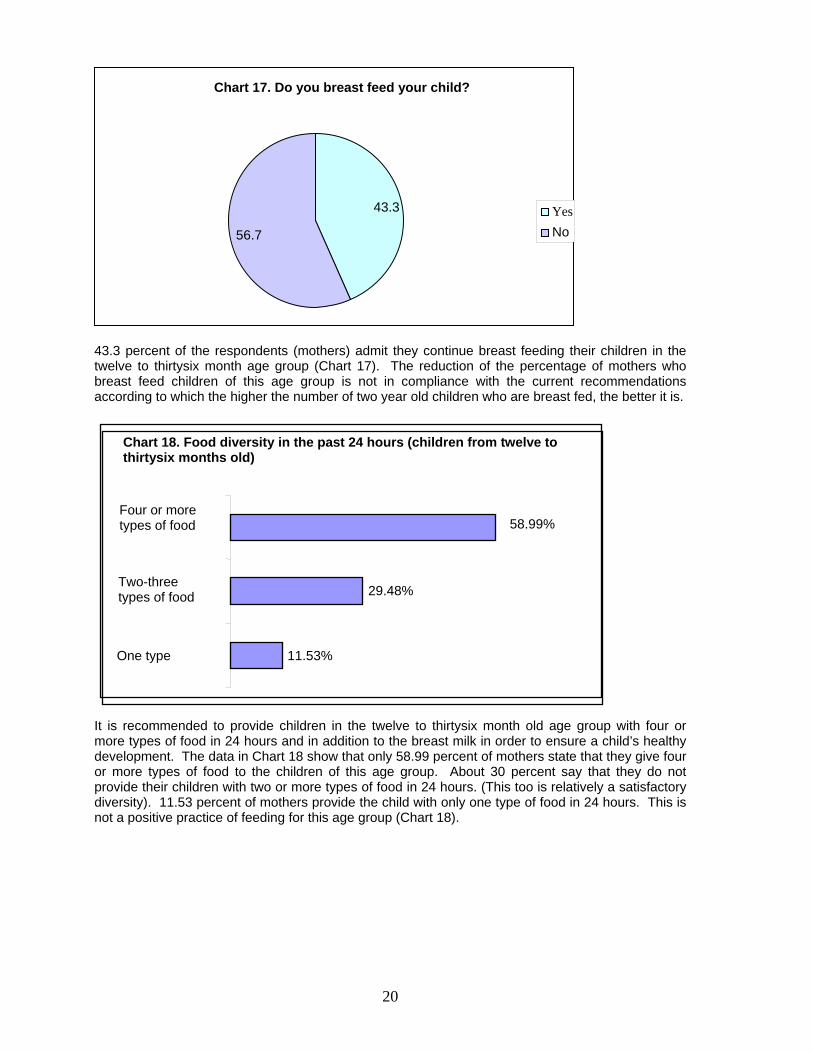
It is recommended for the nine to twelve monthold age group to eat three or more kinds of food in 24 hours, in addition to the breast milk in order to insure a healthy rearing. The data in Chart 15 show that only 69.56 percent of mothers admit that they provide the children of this age group with three or more kinds of food. About 20 percent admit that they do not provide the child with one or two kinds of food in the last 24 hours. This is a relatively good food diversity for this age group. 10.86 percent do not provide the age group with any food in addition to breast milk and such a practice is very harmful to the well being of children in this age group (Chart 15).
Chart 15. Food diversity in last 24 hours ( children nine to twelve months old)
10.86%
19.58%
69.56%
No food
One to two kinds of food
Three or more kinds of food
Chart 14. Do you breast feed your child?
81%
19%
Yes No
19
One of two babies of the nine to twelve month age group receives three or more supplemental meals in addition to breast milk. This is in compliance with the recommendations for this age group. In the meantime a very high percentage of children receive an supplemental meal (40.9%). More problematic is the percentage of children who receive no supplemental meal (10.2%) (Chart 16).
In the mean time, 36 percent of mothers admit using milk bottles to feed their children between nine and twelve months old, although this does not comply with the recommendations provided for feeding this age group (Chart 16). 2. 4. Feeding practices of the twelve to thirtysix month age group
10.2
40.9
48.8
No meal One or two
Three or more
Chart 16. How many supplemental meals have you provided the child within 24 hours? (child nine to twelve month old)
36.1
63.9
Yes No
Chart 16. Do you use milk bottles for feeding your children?
Positive feeding index for the twelve to thirtysix month age group. Continuation of breast feeding Food diversity. Increase in quantity and diversity of supplemental foods, also including
different types of meat products (four or more types of foods in the last 24 hours) (Total: grains + fruits/vegetables + milk, other than breast milk + other foods which include eggs/fish/chicken+meat)
Gradual transition into the family everyday diet. The frequency in providing suplemental foods in the past 24 hours: four or more meals.
20
43.3 percent of the respondents (mothers) admit they continue breast feeding their children in the twelve to thirtysix month age group (Chart 17). The reduction of the percentage of mothers who breast feed children of this age group is not in compliance with the current recommendations according to which the higher the number of two year old children who are breast fed, the better it is.
It is recommended to provide children in the twelve to thirtysix month old age group with four or more types of food in 24 hours and in addition to the breast milk in order to ensure a child’s healthy development. The data in Chart 18 show that only 58.99 percent of mothers state that they give four or more types of food to the children of this age group. About 30 percent say that they do not provide their children with two or more types of food in 24 hours. (This too is relatively a satisfactory diversity). 11.53 percent of mothers provide the child with only one type of food in 24 hours. This is not a positive practice of feeding for this age group (Chart 18).
Chart 18. Food diversity in the past 24 hours (children from twelve to thirtysix months old)
11.53%
29.48%
58.99%
One type
Two-three types of food
Four or more types of food
Chart 17. Do you breast feed your child?
43.3
56.7
Yes
No
21
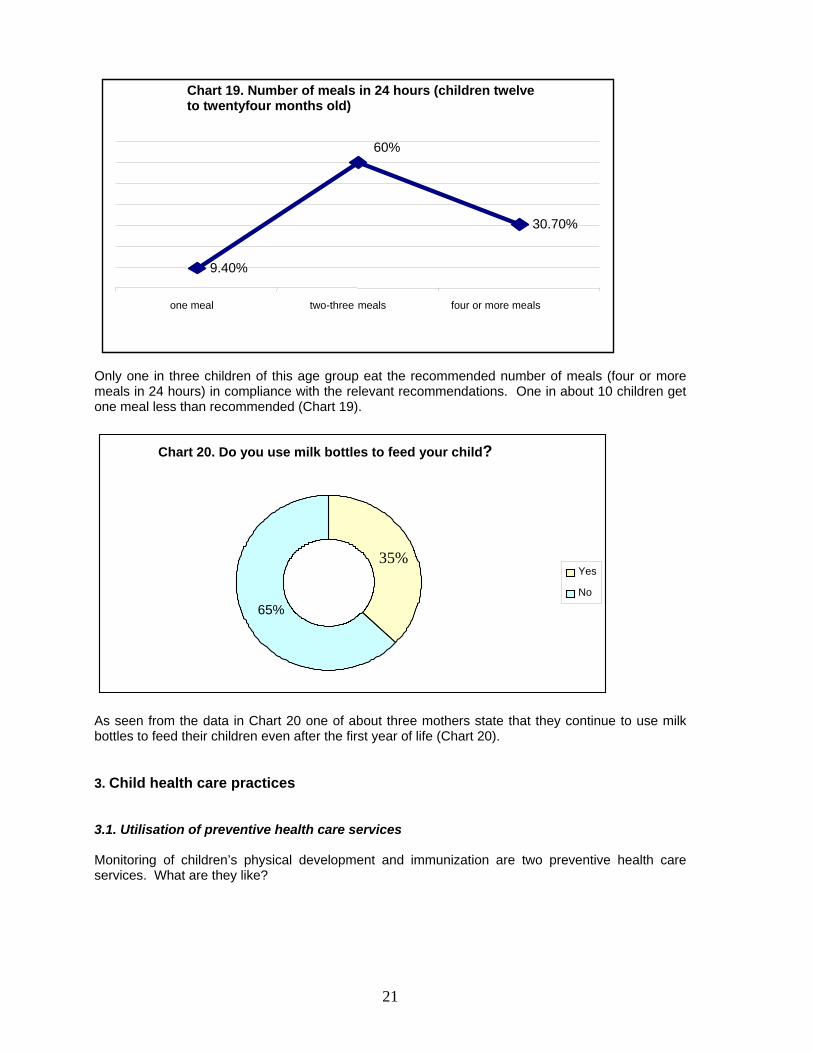
Only one in three children of this age group eat the recommended number of meals (four or more meals in 24 hours) in compliance with the relevant recommendations. One in about 10 children get one meal less than recommended (Chart 19).
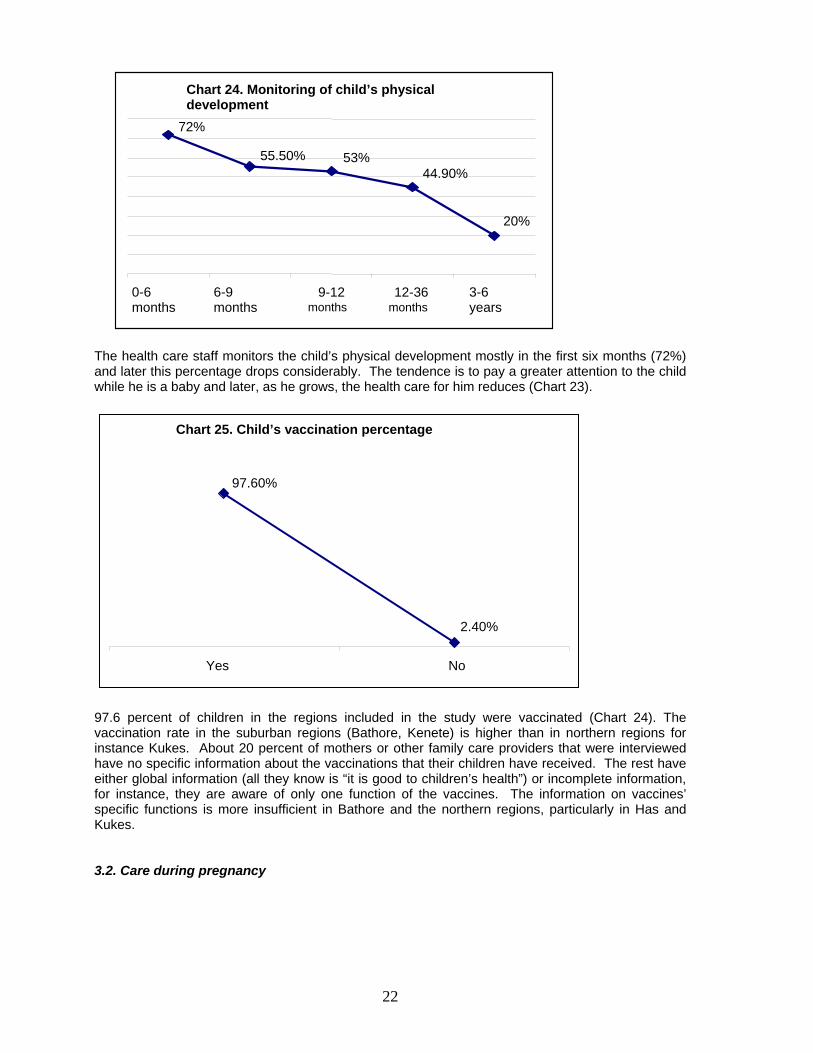
As seen from the data in Chart 20 one of about three mothers state that they continue to use milk bottles to feed their children even after the first year of life (Chart 20). 3. Child health care practices 3.1. Utilisation of preventive health care services Monitoring of children’s physical development and immunization are two preventive health care services. What are they like?
Chart 20. Do you use milk bottles to feed your child?
35%
65%
Yes
No
Chart 19. Number of meals in 24 hours (children twelve to twentyfour months old)
9.40%
60%
30.70%
one meal two-three meals four or more meals
22
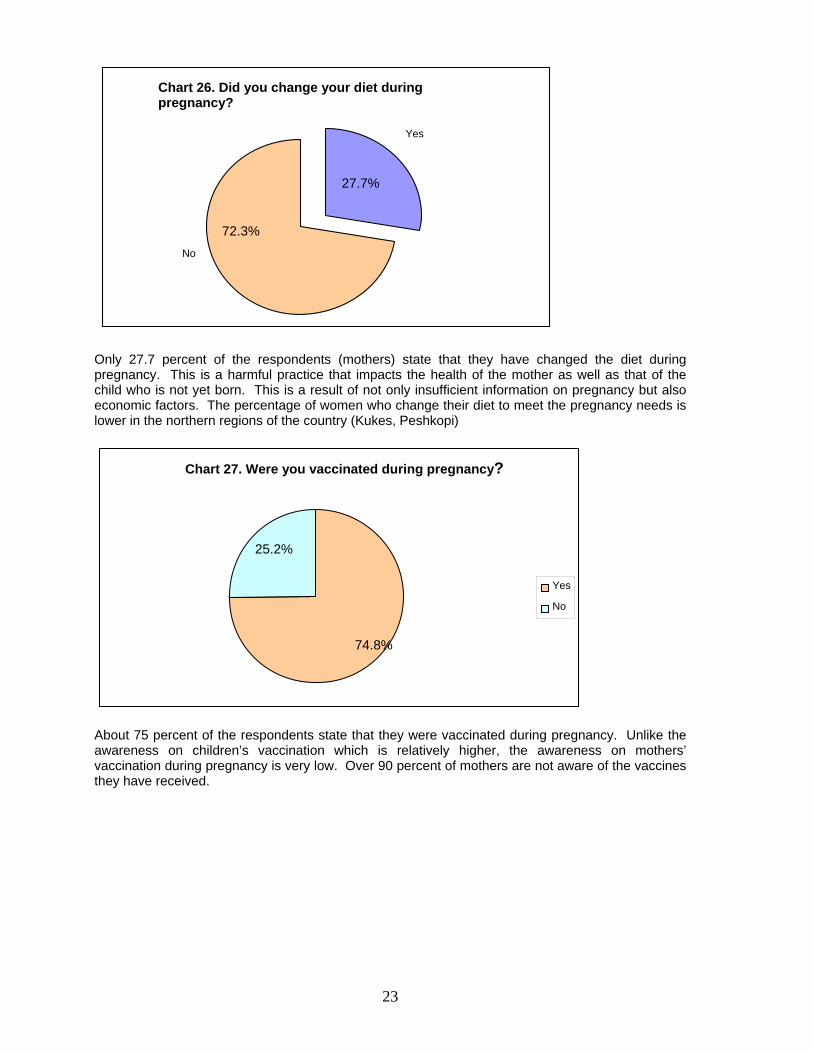
The health care staff monitors the child’s physical development mostly in the first six months (72%) and later this percentage drops considerably. The tendence is to pay a greater attention to the child while he is a baby and later, as he grows, the health care for him reduces (Chart 23).
97.6 percent of children in the regions included in the study were vaccinated (Chart 24). The vaccination rate in the suburban regions (Bathore, Kenete) is higher than in northern regions for instance Kukes. About 20 percent of mothers or other family care providers that were interviewed have no specific information about the vaccinations that their children have received. The rest have either global information (all they know is “it is good to children’s health”) or incomplete information, for instance, they are aware of only one function of the vaccines. The information on vaccines’ specific functions is more insufficient in Bathore and the northern regions, particularly in Has and Kukes. 3.2. Care during pregnancy
Chart 24. Monitoring of child’s physical development
20%
44.90%53%
72%
55.50%
0-6 months
6-9 months
9-12months
12-36months
3-6 years
Chart 25. Child’s vaccination percentage
2.40%
97.60%
Yes No
23
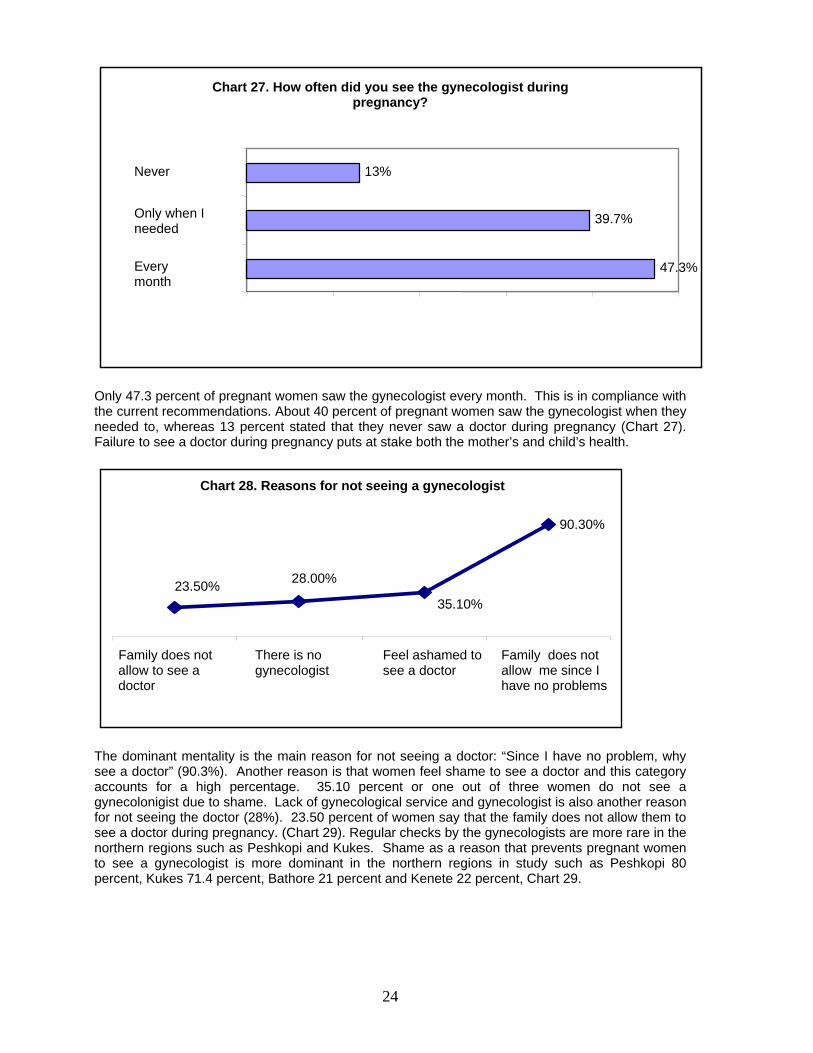
Only 27.7 percent of the respondents (mothers) state that they have changed the diet during pregnancy. This is a harmful practice that impacts the health of the mother as well as that of the child who is not yet born. This is a result of not only insufficient information on pregnancy but also economic factors. The percentage of women who change their diet to meet the pregnancy needs is lower in the northern regions of the country (Kukes, Peshkopi)
About 75 percent of the respondents state that they were vaccinated during pregnancy. Unlike the awareness on children’s vaccination which is relatively higher, the awareness on mothers’ vaccination during pregnancy is very low. Over 90 percent of mothers are not aware of the vaccines they have received.
Chart 27. Were you vaccinated during pregnancy?
74.8%
25.2%
Yes
No
Chart 26. Did you change your diet during pregnancy?
27.7%
72.3%
Yes
No
24
Only 47.3 percent of pregnant women saw the gynecologist every month. This is in compliance with the current recommendations. About 40 percent of pregnant women saw the gynecologist when they needed to, whereas 13 percent stated that they never saw a doctor during pregnancy (Chart 27). Failure to see a doctor during pregnancy puts at stake both the mother’s and child’s health.
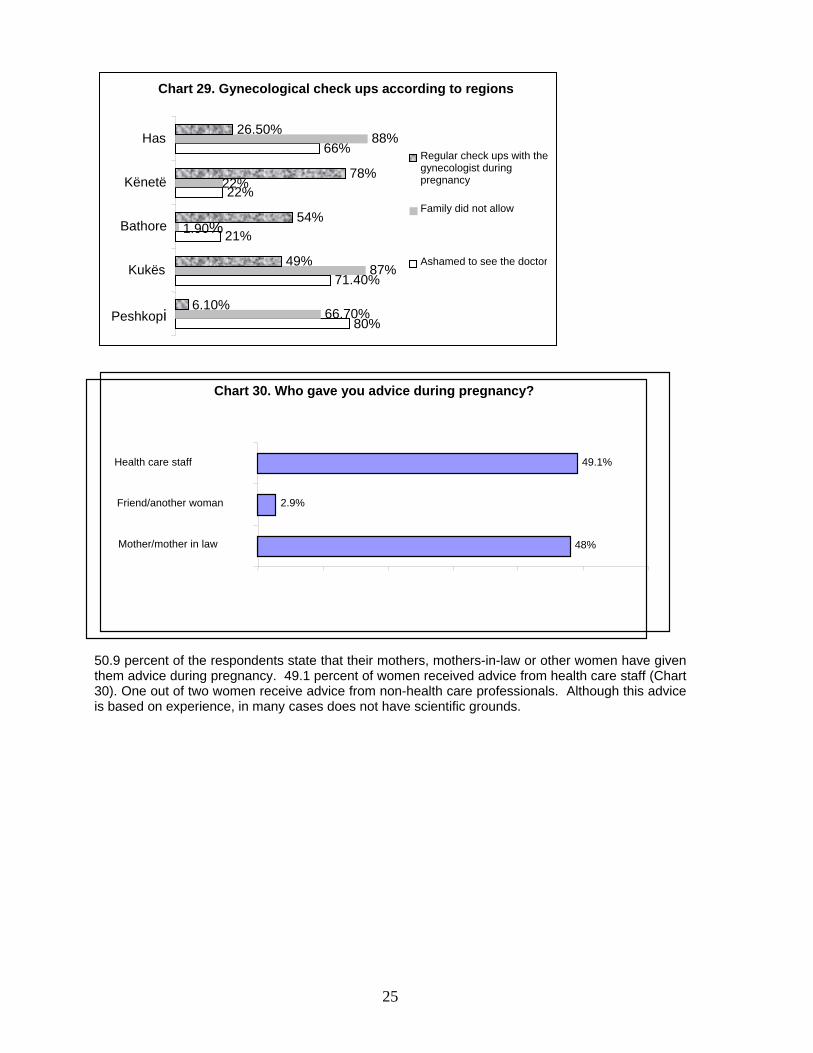
The dominant mentality is the main reason for not seeing a doctor: “Since I have no problem, why see a doctor” (90.3%). Another reason is that women feel shame to see a doctor and this category accounts for a high percentage. 35.10 percent or one out of three women do not see a gynecolonigist due to shame. Lack of gynecological service and gynecologist is also another reason for not seeing the doctor (28%). 23.50 percent of women say that the family does not allow them to see a doctor during pregnancy. (Chart 29). Regular checks by the gynecologists are more rare in the northern regions such as Peshkopi and Kukes. Shame as a reason that prevents pregnant women to see a gynecologist is more dominant in the northern regions in study such as Peshkopi 80 percent, Kukes 71.4 percent, Bathore 21 percent and Kenete 22 percent, Chart 29.
Chart 27. How often did you see the gynecologist during pregnancy?
47.3%
39.7%
13%
Every month
Only when I needed
Never
Chart 28. Reasons for not seeing a gynecologist
90.30%
35.10%
28.00%23.50%
Family does not allow to see a doctor
There is no gynecologist
Feel ashamed to see a doctor
Family does not allow me since I have no problems
25
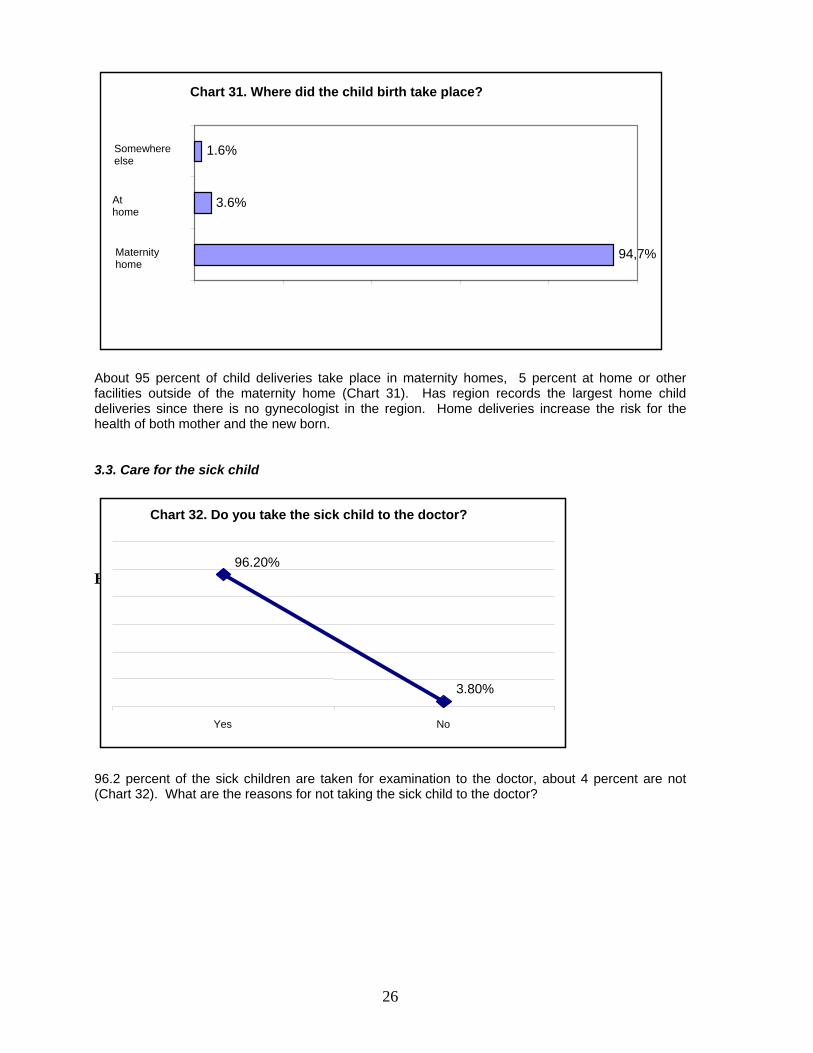
50.9 percent of the respondents state that their mothers, mothers-in-law or other women have given them advice during pregnancy. 49.1 percent of women received advice from health care staff (Chart 30). One out of two women receive advice from non-health care professionals. Although this advice is based on experience, in many cases does not have scientific grounds.
Chart 30. Who gave you advice during pregnancy?
48%
2.9%
49.1%
Mother/mother in law
Friend/another woman
Health care staff
Chart 29. Gynecological check ups according to regions
80%
71.40%
21%
22%
66%
66.70%
87%
1.90%
22%
88%
6.10%
49%
54%
78%
26.50%
Peshkopi
Kukës
Bathore
Kënetë
HasRegular check ups with the gynecologist during pregnancy
Family did not allow
Ashamed to see the doctor
26
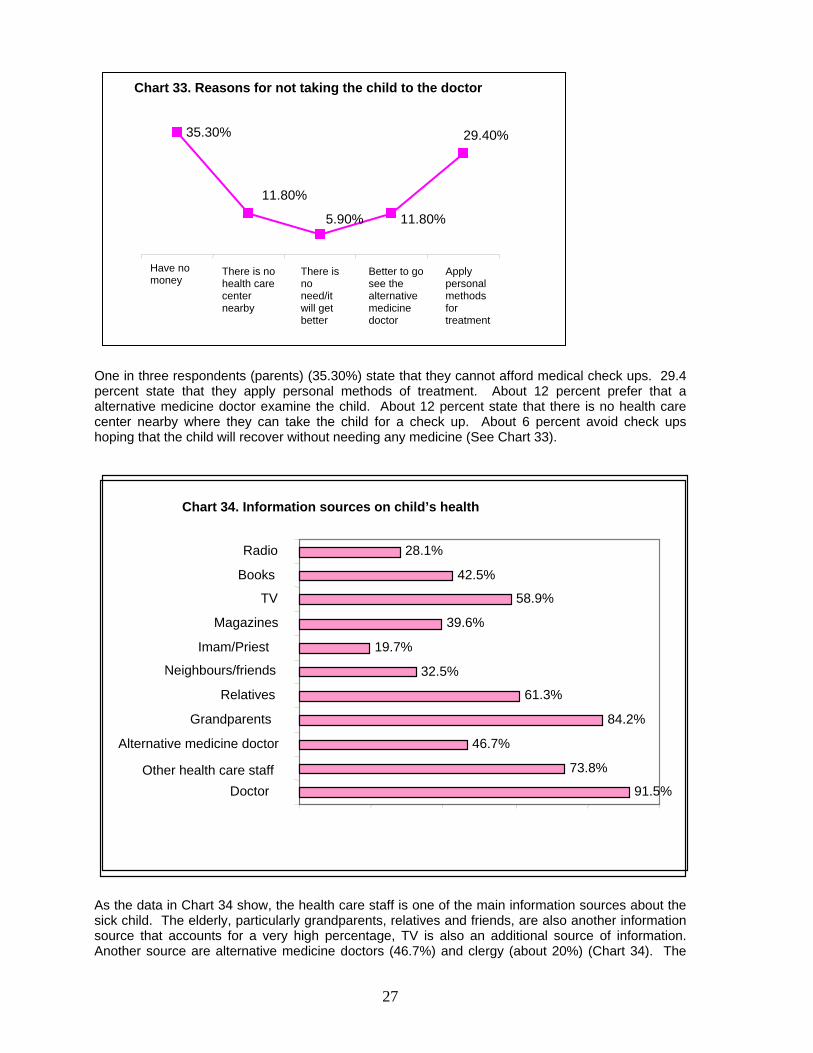
About 95 percent of child deliveries take place in maternity homes, 5 percent at home or other facilities outside of the maternity home (Chart 31). Has region records the largest home child deliveries since there is no gynecologist in the region. Home deliveries increase the risk for the health of both mother and the new born. 3.3. Care for the sick child Error! 96.2 percent of the sick children are taken for examination to the doctor, about 4 percent are not (Chart 32). What are the reasons for not taking the sick child to the doctor?
Chart 31. Where did the child birth take place?
94,7%
3.6%
1.6%
Maternity home
At home
Somewhere else
Chart 32. Do you take the sick child to the doctor?
96.20%
3.80%
Yes No
27
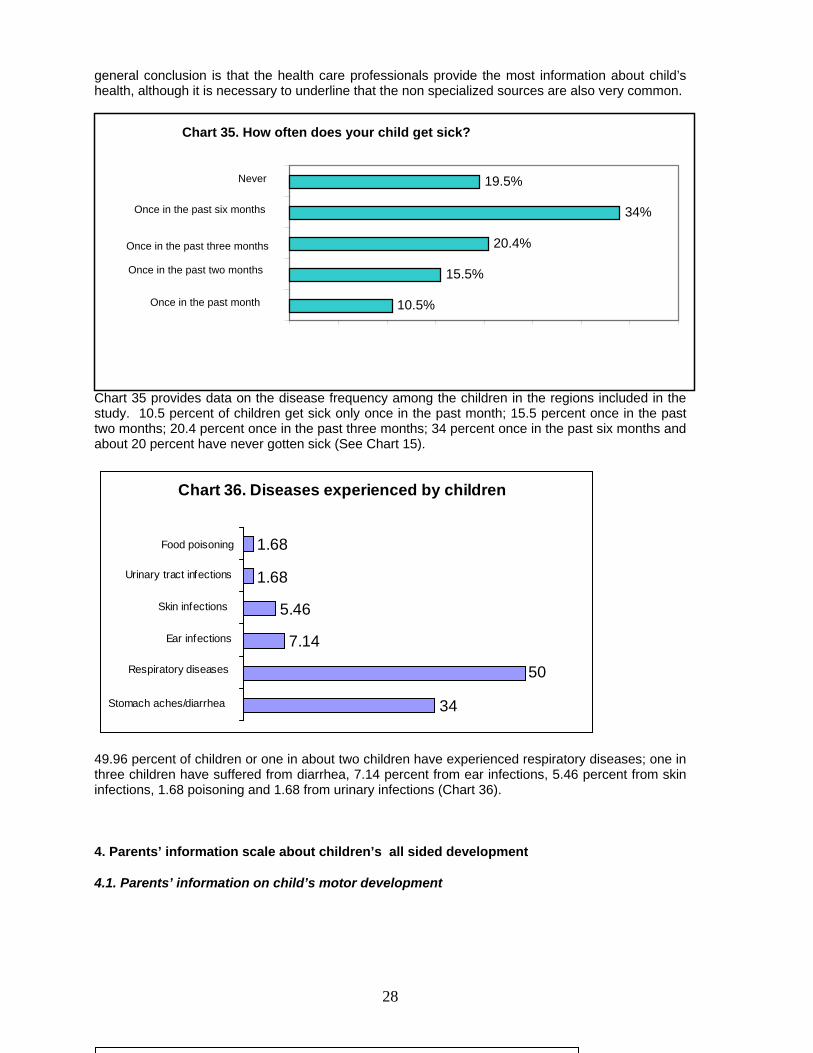
One in three respondents (parents) (35.30%) state that they cannot afford medical check ups. 29.4 percent state that they apply personal methods of treatment. About 12 percent prefer that a alternative medicine doctor examine the child. About 12 percent state that there is no health care center nearby where they can take the child for a check up. About 6 percent avoid check ups hoping that the child will recover without needing any medicine (See Chart 33).
As the data in Chart 34 show, the health care staff is one of the main information sources about the sick child. The elderly, particularly grandparents, relatives and friends, are also another information source that accounts for a very high percentage, TV is also an additional source of information. Another source are alternative medicine doctors (46.7%) and clergy (about 20%) (Chart 34). The
Chart 33. Reasons for not taking the child to the doctor
35.30%
11.80%
5.90% 11.80%
29.40%
Have no money
There is no health care center nearby
There is no need/it will get better
Better to go see the alternative medicine doctor
Apply personal methods for treatment
Chart 34. Information sources on child’s health
91.5%
73.8%
46.7%
84.2%
61.3%
32.5%
19.7%
39.6%
58.9%
42.5%
28.1%
Doctor Other health care staff
Alternative medicine doctor
Grandparents
Relatives
Neighbours/friends
Imam/Priest
Magazines
TV
Books
Radio
28
general conclusion is that the health care professionals provide the most information about child’s health, although it is necessary to underline that the non specialized sources are also very common.
Chart 35 provides data on the disease frequency among the children in the regions included in the study. 10.5 percent of children get sick only once in the past month; 15.5 percent once in the past two months; 20.4 percent once in the past three months; 34 percent once in the past six months and about 20 percent have never gotten sick (See Chart 15).
Chart 36. Diseases experienced by children
34
50
7.14
5.46
1.68
1.68
Stomach aches/diarrhea
Respiratory diseases
Ear infections
Skin infections
Urinary tract infections
Food poisoning
49.96 percent of children or one in about two children have experienced respiratory diseases; one in three children have suffered from diarrhea, 7.14 percent from ear infections, 5.46 percent from skin infections, 1.68 poisoning and 1.68 from urinary infections (Chart 36).
4. Parents’ information scale about children’s all sided development
4.1. Parents’ information on child’s motor development
Chart 35. How often does your child get sick?
10.5%
15.5%
20.4%
34%
19.5%
Once in the past month
Once in the past two months
Once in the past three months
Once in the past six months
Never
29
Error!
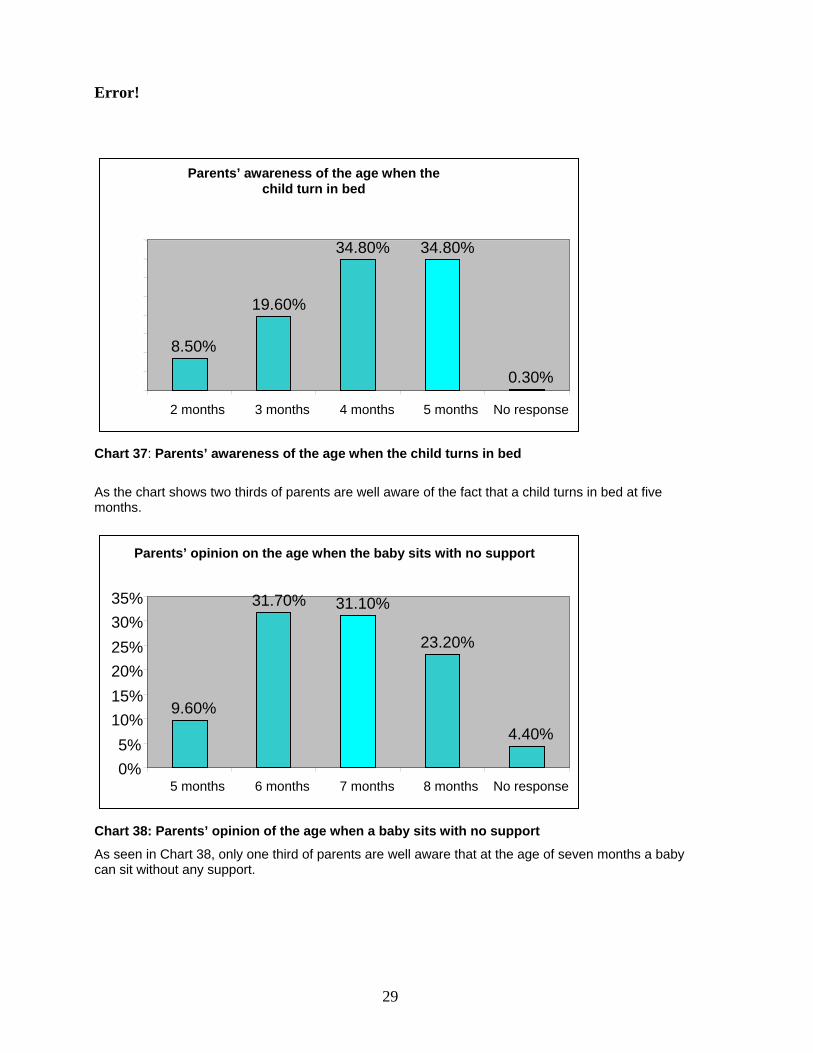
Chart 37: Parents’ awareness of the age when the child turns in bed
As the chart shows two thirds of parents are well aware of the fact that a child turns in bed at five months.
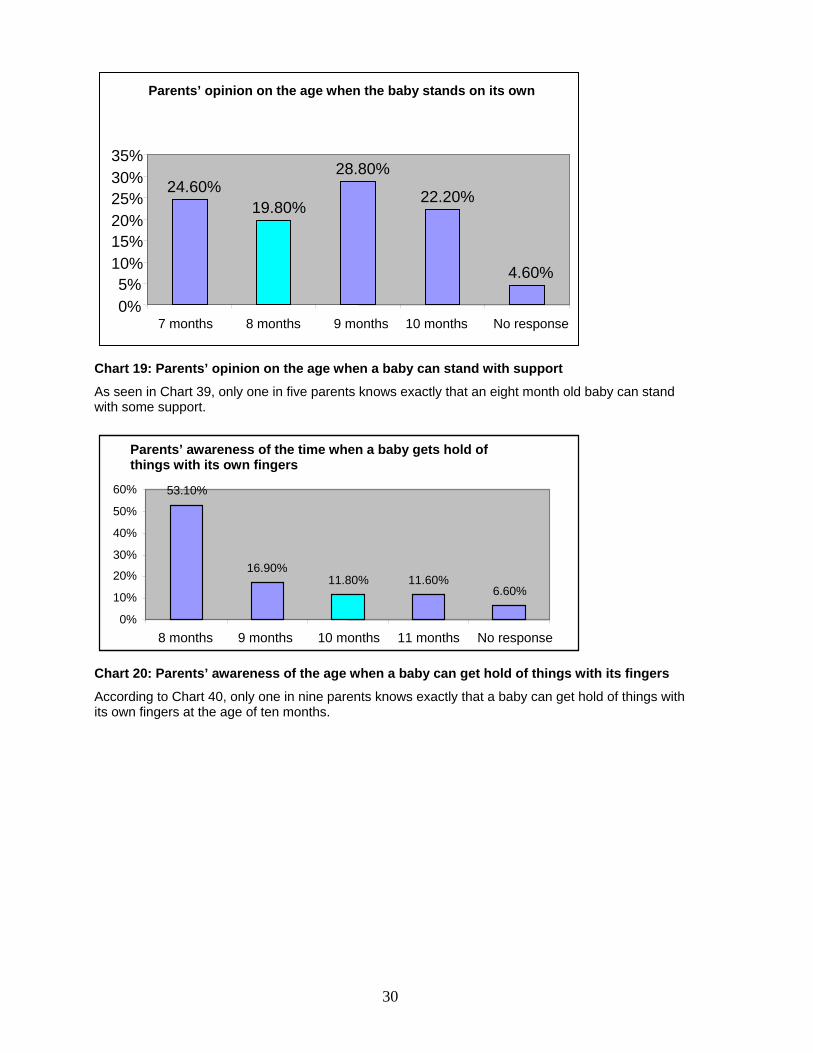
Chart 38: Parents’ opinion of the age when a baby sits with no support
As seen in Chart 38, only one third of parents are well aware that at the age of seven months a baby can sit without any support.
Parents’ opinion on the age when the baby sits with no support
9.60%
31.70% 31.10%
23.20%
4.40%
0%
5%
10%
15%
20%
25%
30%
35%
5 months 6 months 7 months 8 months No response
Parents’ awareness of the age when the child turn in bed
8.50%
19.60%
34.80% 34.80%
0.30%
2 months 3 months 4 months 5 months No response
30
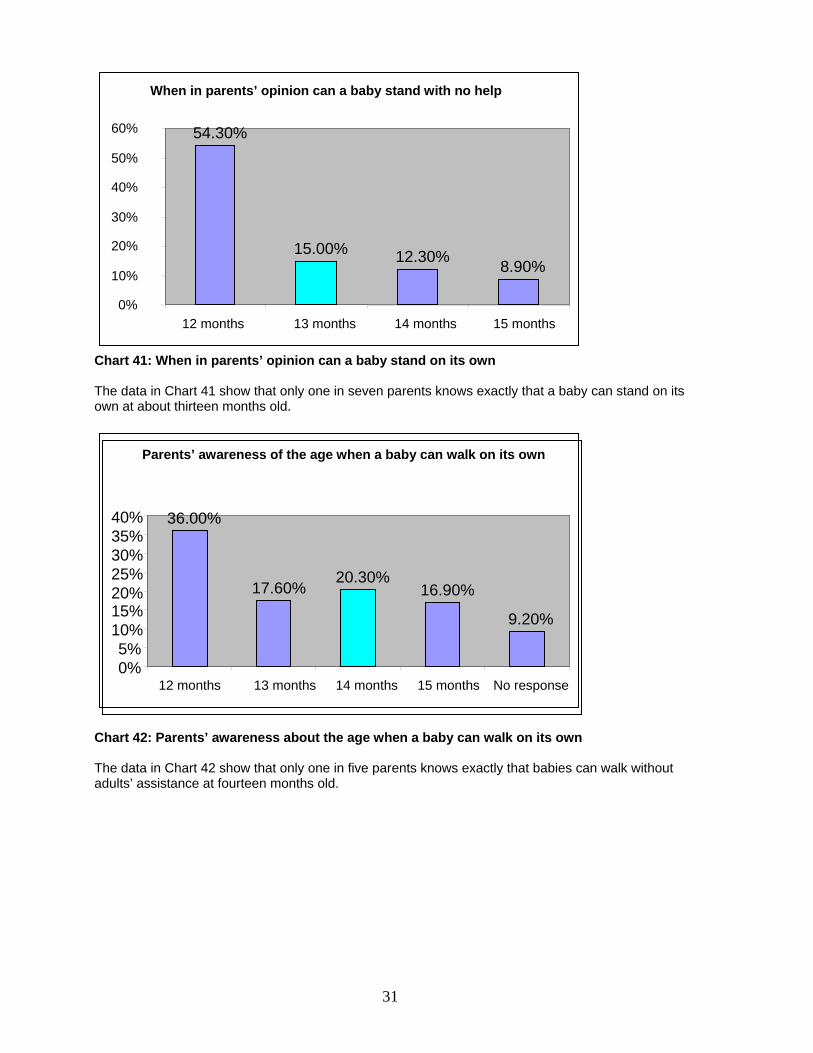
Chart 19: Parents’ opinion on the age when a baby can stand with support
As seen in Chart 39, only one in five parents knows exactly that an eight month old baby can stand with some support.
Chart 20: Parents’ awareness of the age when a baby can get hold of things with its fingers
According to Chart 40, only one in nine parents knows exactly that a baby can get hold of things with its own fingers at the age of ten months.
Parents’ opinion on the age when the baby stands on its own
24.60%19.80%
28.80%
22.20%
4.60%
0%5%
10%15%20%25%30%35%
7 months 8 months
9 months
10 months
No response
Parents’ awareness of the time when a baby gets hold of things with its own fingers
53.10%
16.90%11.80% 11.60%
6.60%
0%
10%
20%
30%
40%
50%
60%
8 months 9 months 10 months 11 months No response
31
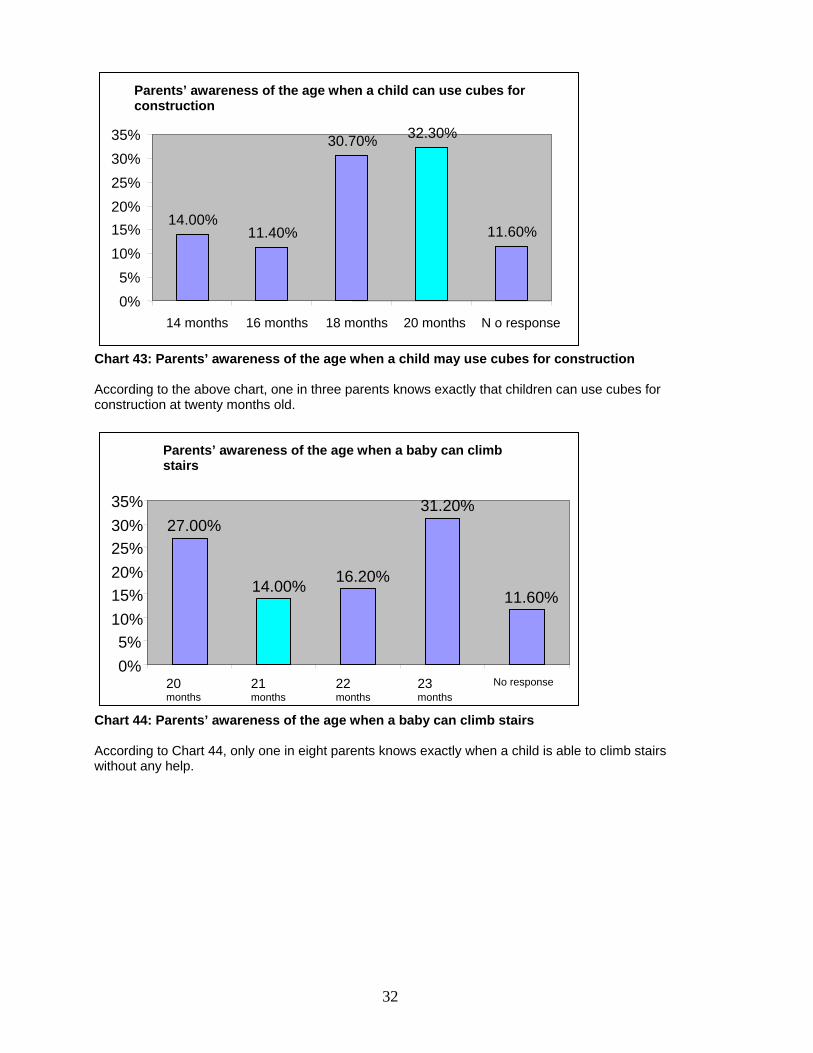
Chart 41: When in parents’ opinion can a baby stand on its own The data in Chart 41 show that only one in seven parents knows exactly that a baby can stand on its own at about thirteen months old.
Chart 42: Parents’ awareness about the age when a baby can walk on its own The data in Chart 42 show that only one in five parents knows exactly that babies can walk without adults’ assistance at fourteen months old.
When in parents’ opinion can a baby stand with no help
54.30%
15.00% 12.30%8.90%
0%
10%
20%
30%
40%
50%
60%
12 months 13 months 14 months 15 months
Parents’ awareness of the age when a baby can walk on its own
36.00%
17.60%20.30%
16.90%
9.20%
0%5%
10%15%20%25%30%35%40%
12 months 13 months 14 months 15 months No response
32
Chart 43: Parents’ awareness of the age when a child may use cubes for construction According to the above chart, one in three parents knows exactly that children can use cubes for construction at twenty months old.
Chart 44: Parents’ awareness of the age when a baby can climb stairs According to Chart 44, only one in eight parents knows exactly when a child is able to climb stairs without any help.
Parents’ awareness of the age when a child can use cubes for construction
14.00%11.40%
30.70% 32.30%
11.60%
0%
5%
10%
15%
20%
25%
30%
35%
14 months 16 months 18 months 20 months N o response
Parents’ awareness of the age when a baby can climb stairs
27.00%
14.00%16.20%
31.20%
11.60%
0%
5%
10%
15%
20%
25%
30%
35%
20 months
21 months
22 months
23 months
No response
33
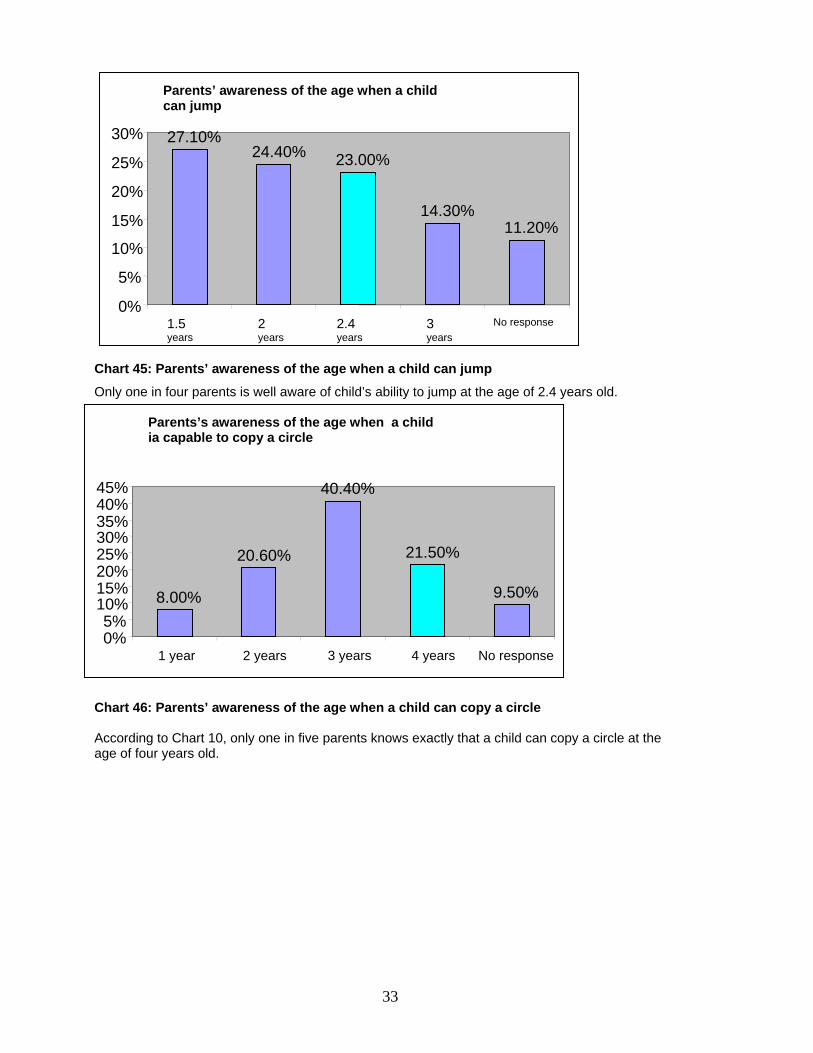
Chart 45: Parents’ awareness of the age when a child can jump
Only one in four parents is well aware of child’s ability to jump at the age of 2.4 years old.
Chart 46: Parents’ awareness of the age when a child can copy a circle According to Chart 10, only one in five parents knows exactly that a child can copy a circle at the age of four years old.
Parents’ awareness of the age when a child can jump
27.10%24.40% 23.00%
14.30%11.20%
0%
5%
10%
15%
20%
25%
30%
1.5 years
2 years
2.4 years
3 years
No response
Parents’s awareness of the age when a child ia capable to copy a circle
8.00%
20.60%
40.40%
21.50%
9.50%
0%5%
10%15%20%25%30%35%40%45%
1 year 2 years 3 years
4 years
No response
34
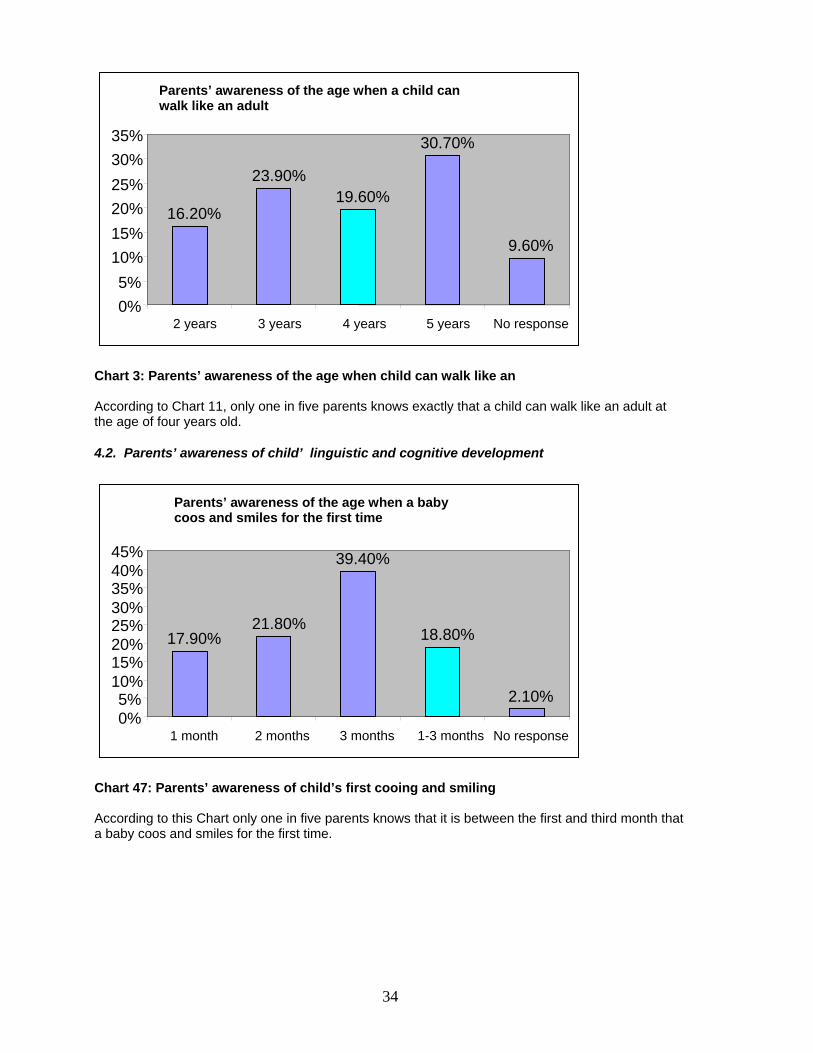
Chart 3: Parents’ awareness of the age when child can walk like an According to Chart 11, only one in five parents knows exactly that a child can walk like an adult at the age of four years old.
4.2. Parents’ awareness of child’ linguistic and cognitive development
Chart 47: Parents’ awareness of child’s first cooing and smiling According to this Chart only one in five parents knows that it is between the first and third month that a baby coos and smiles for the first time.
Parents’ awareness of the age when a child can walk like an adult
16.20%
23.90%19.60%
30.70%
9.60%
0%
5%
10%
15%
20%
25%
30%
35%
2 years 3 years 4 years 5 years No response
Parents’ awareness of the age when a baby coos and smiles for the first time
17.90%21.80%
39.40%
18.80%
2.10%0%5%
10%15%20%25%30%35%40%45%
1 month 2 months 3 months
1-3 months
No response
35
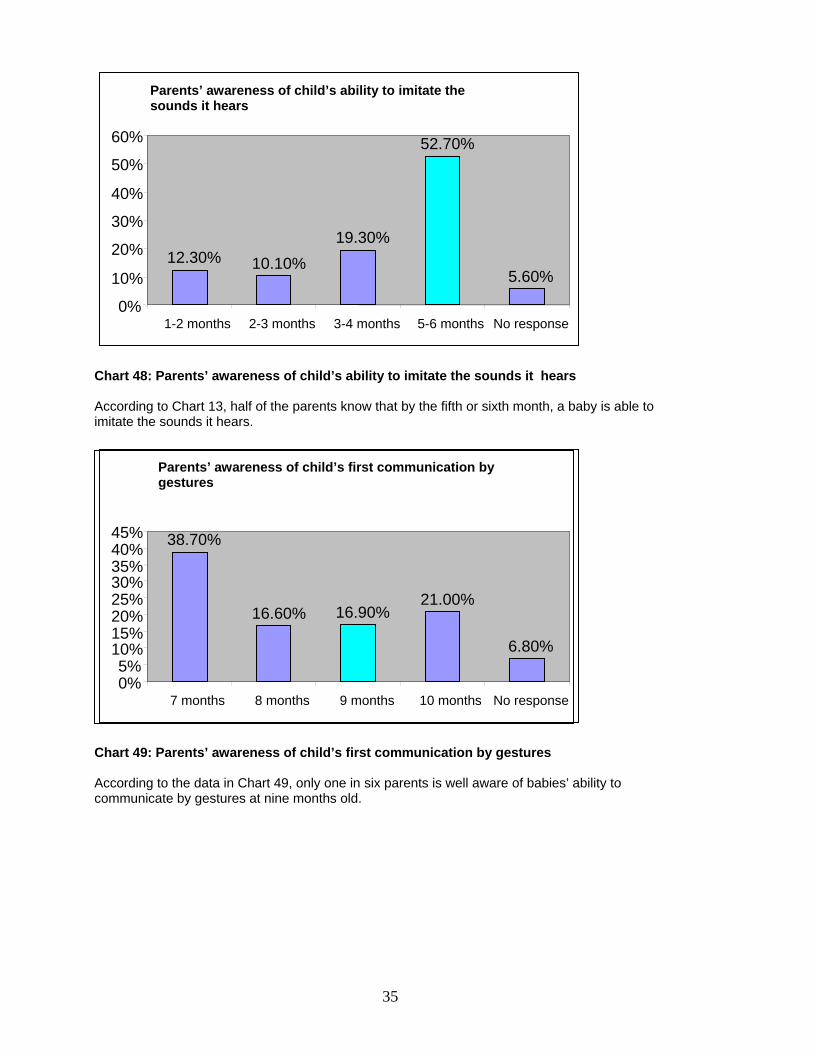
Chart 48: Parents’ awareness of child’s ability to imitate the sounds it hears According to Chart 13, half of the parents know that by the fifth or sixth month, a baby is able to imitate the sounds it hears.
Chart 49: Parents’ awareness of child’s first communication by gestures According to the data in Chart 49, only one in six parents is well aware of babies’ ability to communicate by gestures at nine months old.
Parents’ awareness of child’s ability to imitate the sounds it hears
12.30% 10.10%
19.30%
52.70%
5.60%
0%
10%
20%
30%
40%
50%
60%
1-2 months 2-3 months 3-4 months 5-6 months No response
Parents’ awareness of child’s first communication by gestures
38.70%
16.60% 16.90%21.00%
6.80%
0%5%
10%15%20%25%30%35%40%45%
7 months 8 months 9 months 10 months No response
36
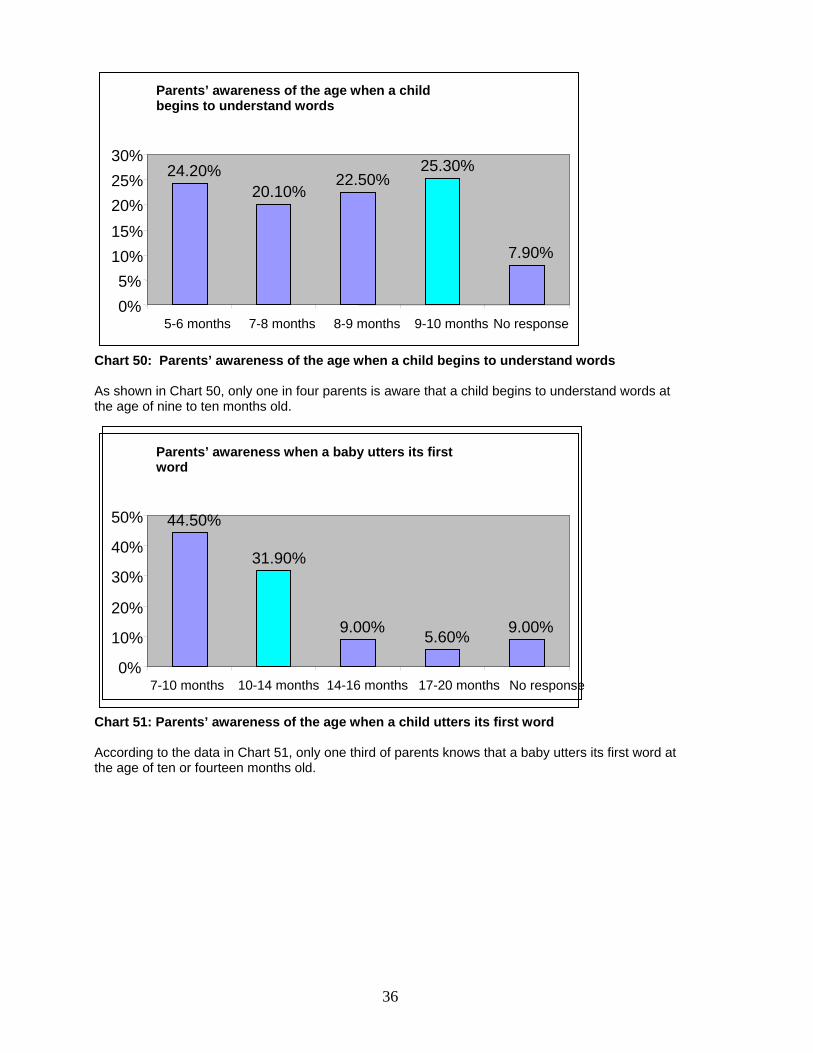
Chart 50: Parents’ awareness of the age when a child begins to understand words As shown in Chart 50, only one in four parents is aware that a child begins to understand words at the age of nine to ten months old.
Chart 51: Parents’ awareness of the age when a child utters its first word According to the data in Chart 51, only one third of parents knows that a baby utters its first word at the age of ten or fourteen months old.
Parents’ awareness of the age when a child begins to understand words
24.20%20.10%
22.50%25.30%
7.90%
0%
5%
10%
15%
20%
25%
30%
5-6 months 7-8 months 8-9 months 9-10 months No response
Parents’ awareness when a baby utters its first word
44.50%
31.90%
9.00%5.60%
9.00%
0%
10%
20%
30%
40%
50%
7-10 months 10-14 months
14-16 months
17-20 months
No response
37
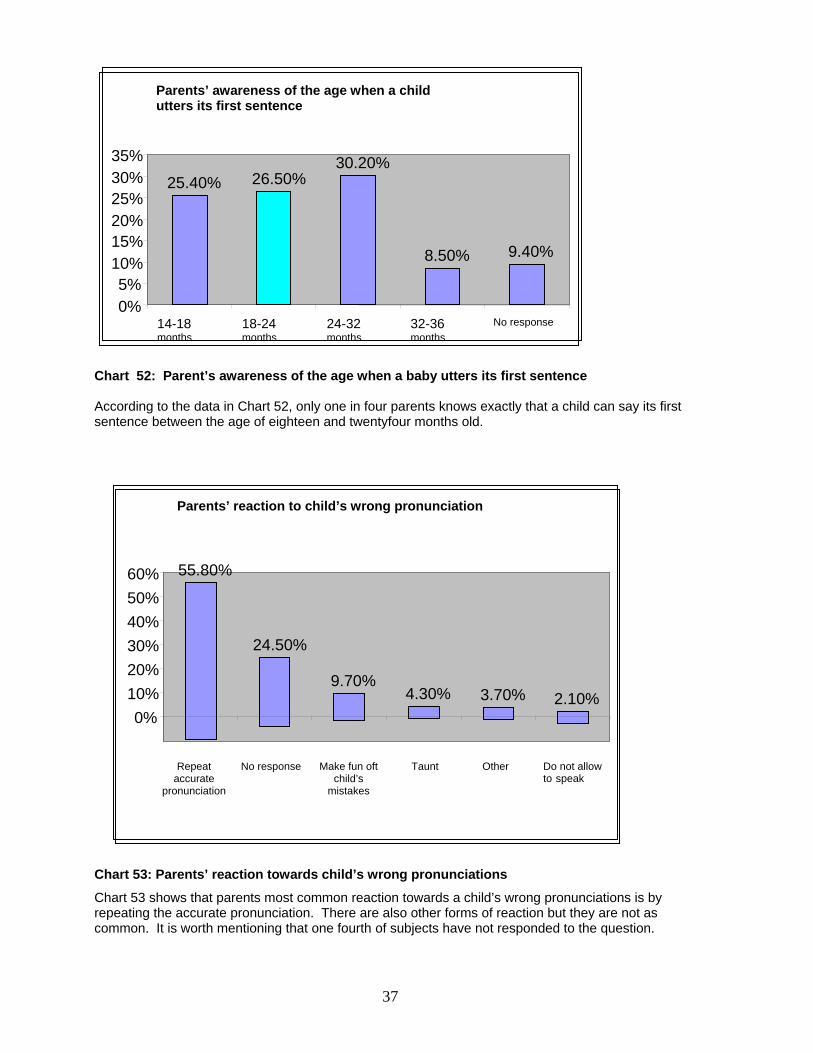
Chart 52: Parent’s awareness of the age when a baby utters its first sentence According to the data in Chart 52, only one in four parents knows exactly that a child can say its first sentence between the age of eighteen and twentyfour months old.
Chart 53: Parents’ reaction towards child’s wrong pronunciations
Chart 53 shows that parents most common reaction towards a child’s wrong pronunciations is by repeating the accurate pronunciation. There are also other forms of reaction but they are not as common. It is worth mentioning that one fourth of subjects have not responded to the question.
Parents’ awareness of the age when a child utters its first sentence
25.40% 26.50%30.20%
8.50% 9.40%
0%5%
10%15%20%25%30%35%
14-18 months
18-24 months
24-32 months
32-36 months
No response
Parents’ reaction to child’s wrong pronunciation
55.80%
24.50%
9.70%4.30% 3.70% 2.10%
0%
10%
20%
30%
40%
50%
60%
Repeat accurate
pronunciation
No response Make fun oft child’s
mistakes
Taunt Other Do not allow to speak
38
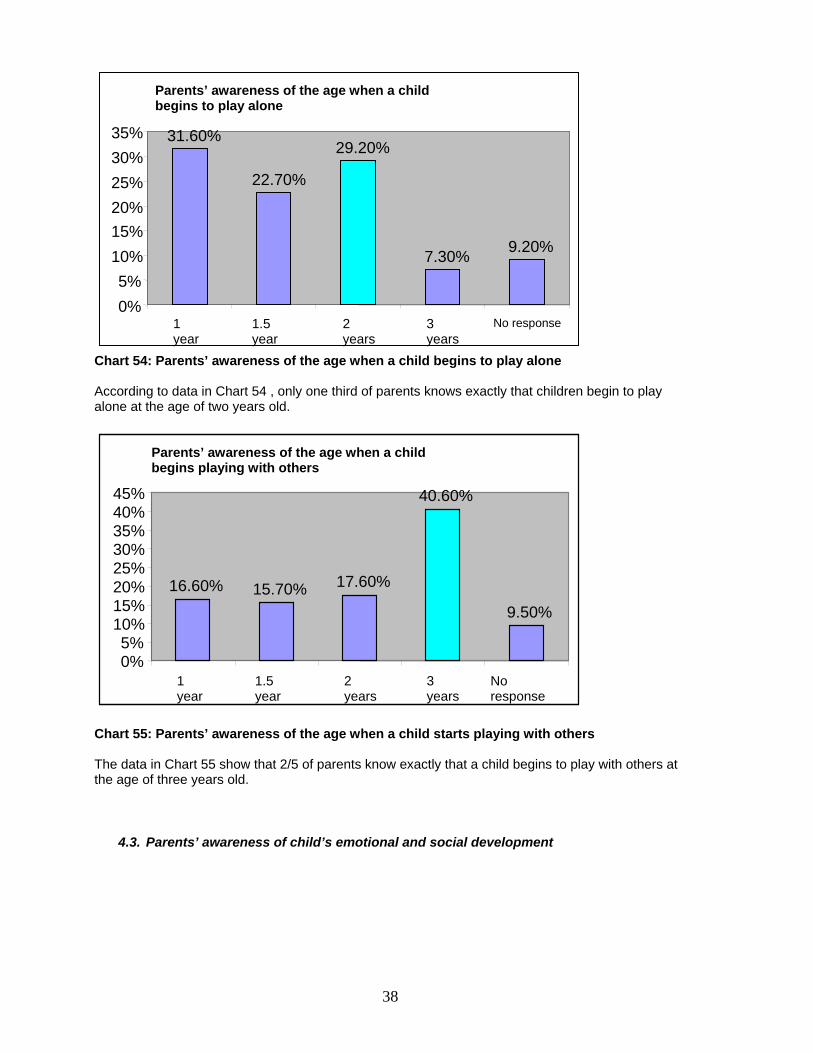
Chart 54: Parents’ awareness of the age when a child begins to play alone According to data in Chart 54 , only one third of parents knows exactly that children begin to play alone at the age of two years old.
Chart 55: Parents’ awareness of the age when a child starts playing with others The data in Chart 55 show that 2/5 of parents know exactly that a child begins to play with others at the age of three years old.
4.3. Parents’ awareness of child’s emotional and social development
Parents’ awareness of the age when a child begins playing with others
16.60% 15.70% 17.60%
40.60%
9.50%
0%5%
10%15%20%25%30%35%40%45%
1 year
1.5 year
2 years
3 years
No response
Parents’ awareness of the age when a child begins to play alone
31.60%
22.70%
29.20%
7.30%9.20%
0%
5%
10%
15%
20%
25%
30%
35%
1 year
1.5 year
2 years
3 years
No response
39
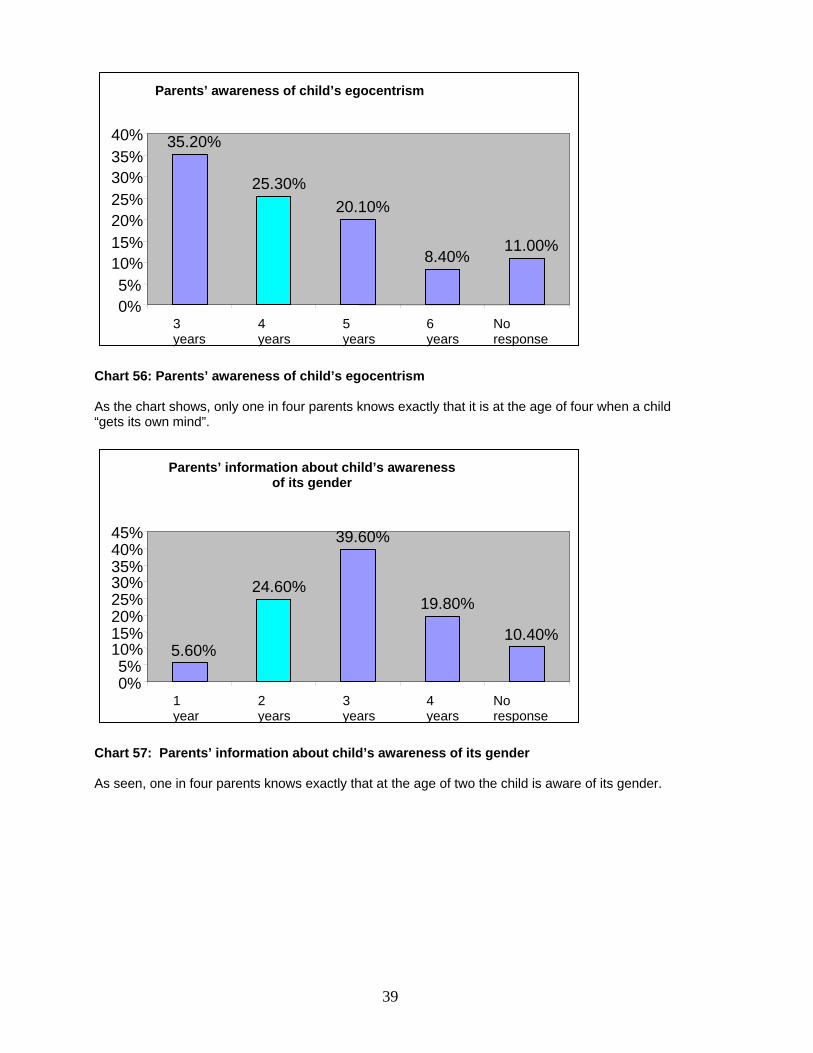
Chart 56: Parents’ awareness of child’s egocentrism As the chart shows, only one in four parents knows exactly that it is at the age of four when a child “gets its own mind”.
Chart 57: Parents’ information about child’s awareness of its gender As seen, one in four parents knows exactly that at the age of two the child is aware of its gender.
Parents’ information about child’s awareness of its gender
5.60%
24.60%
39.60%
19.80%
10.40%
0%5%
10%15%20%25%30%35%40%45%
1 year
2 years
3 years
4 years
No response
Parents’ awareness of child’s egocentrism
35.20%
25.30%
20.10%
8.40%11.00%
0%5%
10%15%20%25%30%35%40%
3 years
4 years
5 years
6 years
No response
40
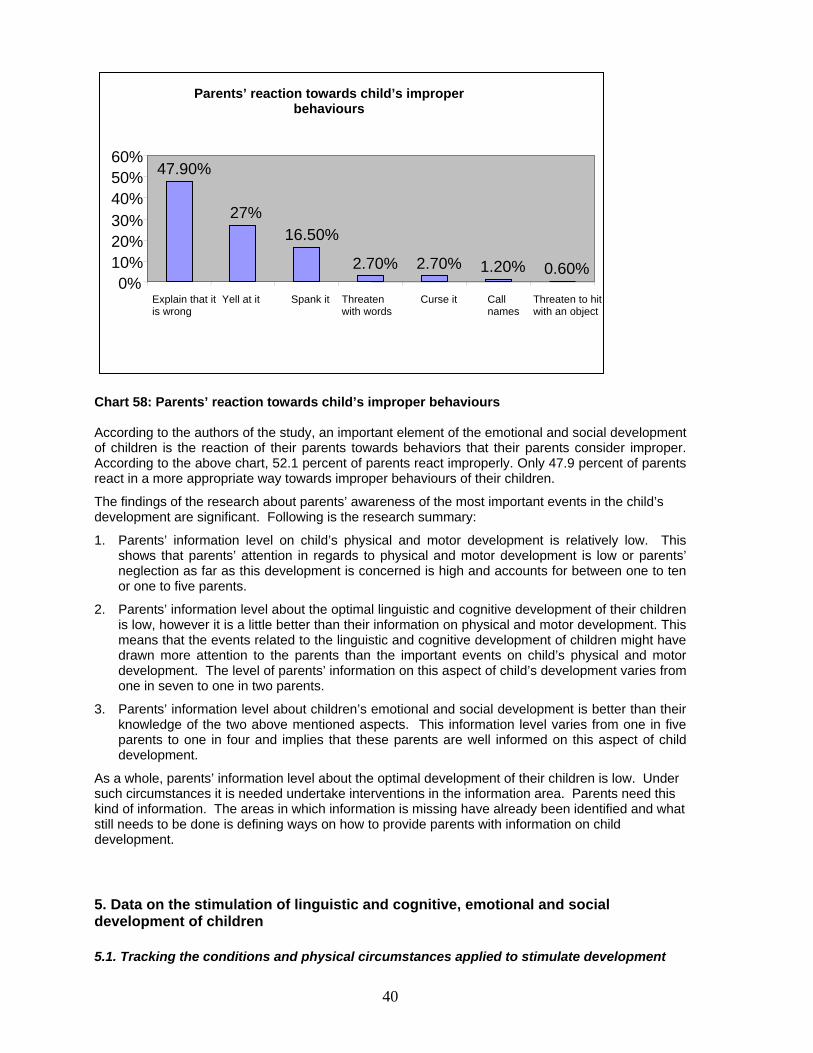
Chart 58: Parents’ reaction towards child’s improper behaviours According to the authors of the study, an important element of the emotional and social development of children is the reaction of their parents towards behaviors that their parents consider improper. According to the above chart, 52.1 percent of parents react improperly. Only 47.9 percent of parents react in a more appropriate way towards improper behaviours of their children.
The findings of the research about parents’ awareness of the most important events in the child’s development are significant. Following is the research summary:
1. Parents’ information level on child’s physical and motor development is relatively low. This shows that parents’ attention in regards to physical and motor development is low or parents’ neglection as far as this development is concerned is high and accounts for between one to ten or one to five parents.
2. Parents’ information level about the optimal linguistic and cognitive development of their children is low, however it is a little better than their information on physical and motor development. This means that the events related to the linguistic and cognitive development of children might have drawn more attention to the parents than the important events on child’s physical and motor development. The level of parents’ information on this aspect of child’s development varies from one in seven to one in two parents.
3. Parents’ information level about children’s emotional and social development is better than their knowledge of the two above mentioned aspects. This information level varies from one in five parents to one in four and implies that these parents are well informed on this aspect of child development.
As a whole, parents’ information level about the optimal development of their children is low. Under such circumstances it is needed undertake interventions in the information area. Parents need this kind of information. The areas in which information is missing have already been identified and what still needs to be done is defining ways on how to provide parents with information on child development.
5. Data on the stimulation of linguistic and cognitive, emotional and social development of children 5.1. Tracking the conditions and physical circumstances applied to stimulate development
Parents’ reaction towards child’s improper behaviours
47.90%
27%16.50%
2.70% 2.70% 1.20% 0.60%0%
10%20%30%40%50%60%
Explain that it is wrong
Yell at it Spank it Threaten with words
Curse it Call names
Threaten to hit with an object
41
The research team conducted several surveys with households bearing children from zero to six years of age. The purpose of the survey was to track the means and situations that parents applied to stimulate the linguistic and cognitive, social and emotional development of their children. To this end, a special survey card was prepared for use at a time when other team members were involved in interviewing the family members.
Following is a summary containing only the data related to child development stimulation.
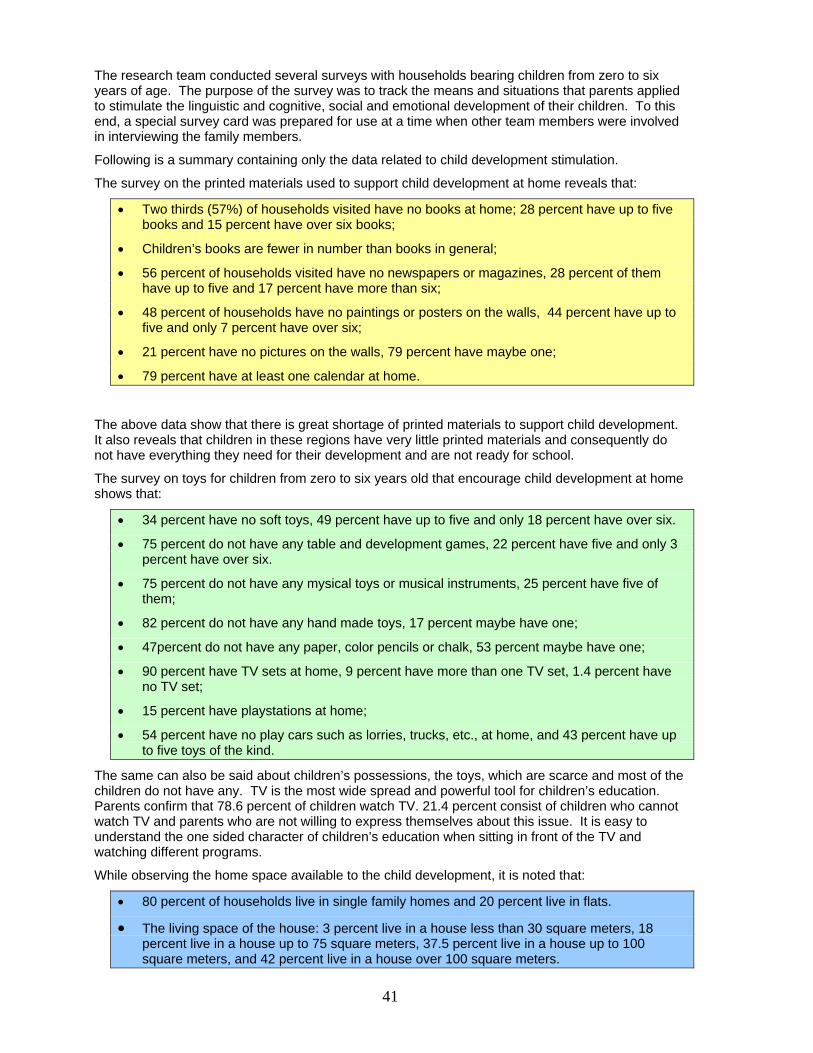
The survey on the printed materials used to support child development at home reveals that:
Two thirds (57%) of households visited have no books at home; 28 percent have up to five books and 15 percent have over six books;
Children’s books are fewer in number than books in general;
56 percent of households visited have no newspapers or magazines, 28 percent of them have up to five and 17 percent have more than six;
48 percent of households have no paintings or posters on the walls, 44 percent have up to five and only 7 percent have over six;
21 percent have no pictures on the walls, 79 percent have maybe one;
79 percent have at least one calendar at home.
The above data show that there is great shortage of printed materials to support child development. It also reveals that children in these regions have very little printed materials and consequently do not have everything they need for their development and are not ready for school.
The survey on toys for children from zero to six years old that encourage child development at home shows that:
34 percent have no soft toys, 49 percent have up to five and only 18 percent have over six.
75 percent do not have any table and development games, 22 percent have five and only 3 percent have over six.
75 percent do not have any mysical toys or musical instruments, 25 percent have five of them;
82 percent do not have any hand made toys, 17 percent maybe have one;
47percent do not have any paper, color pencils or chalk, 53 percent maybe have one;
90 percent have TV sets at home, 9 percent have more than one TV set, 1.4 percent have no TV set;
15 percent have playstations at home;
54 percent have no play cars such as lorries, trucks, etc., at home, and 43 percent have up to five toys of the kind.
The same can also be said about children’s possessions, the toys, which are scarce and most of the children do not have any. TV is the most wide spread and powerful tool for children’s education. Parents confirm that 78.6 percent of children watch TV. 21.4 percent consist of children who cannot watch TV and parents who are not willing to express themselves about this issue. It is easy to understand the one sided character of children’s education when sitting in front of the TV and watching different programs.
While observing the home space available to the child development, it is noted that:
80 percent of households live in single family homes and 20 percent live in flats.
The living space of the house: 3 percent live in a house less than 30 square meters, 18 percent live in a house up to 75 square meters, 37.5 percent live in a house up to 100 square meters, and 42 percent live in a house over 100 square meters.
42
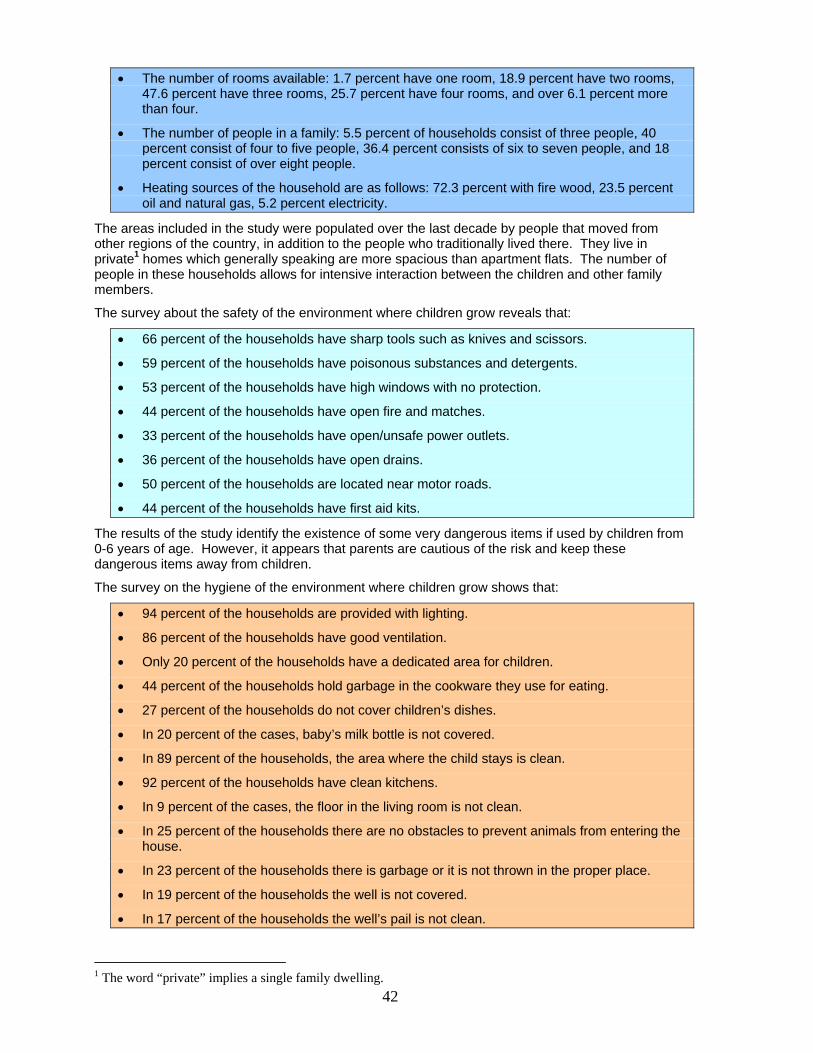
The number of rooms available: 1.7 percent have one room, 18.9 percent have two rooms, 47.6 percent have three rooms, 25.7 percent have four rooms, and over 6.1 percent more than four.
The number of people in a family: 5.5 percent of households consist of three people, 40 percent consist of four to five people, 36.4 percent consists of six to seven people, and 18 percent consist of over eight people.
Heating sources of the household are as follows: 72.3 percent with fire wood, 23.5 percent oil and natural gas, 5.2 percent electricity.
The areas included in the study were populated over the last decade by people that moved from other regions of the country, in addition to the people who traditionally lived there. They live in private1 homes which generally speaking are more spacious than apartment flats. The number of people in these households allows for intensive interaction between the children and other family members.
The survey about the safety of the environment where children grow reveals that:
66 percent of the households have sharp tools such as knives and scissors.
59 percent of the households have poisonous substances and detergents.
53 percent of the households have high windows with no protection.
44 percent of the households have open fire and matches.
33 percent of the households have open/unsafe power outlets.
36 percent of the households have open drains.
50 percent of the households are located near motor roads.
44 percent of the households have first aid kits.
The results of the study identify the existence of some very dangerous items if used by children from 0-6 years of age. However, it appears that parents are cautious of the risk and keep these dangerous items away from children.
The survey on the hygiene of the environment where children grow shows that:
94 percent of the households are provided with lighting.
86 percent of the households have good ventilation.
Only 20 percent of the households have a dedicated area for children.
44 percent of the households hold garbage in the cookware they use for eating.
27 percent of the households do not cover children’s dishes.
In 20 percent of the cases, baby’s milk bottle is not covered.
In 89 percent of the households, the area where the child stays is clean.
92 percent of the households have clean kitchens.
In 9 percent of the cases, the floor in the living room is not clean.
In 25 percent of the households there are no obstacles to prevent animals from entering the house.
In 23 percent of the households there is garbage or it is not thrown in the proper place.
In 19 percent of the households the well is not covered.
In 17 percent of the households the well’s pail is not clean.
1 The word “private” implies a single family dwelling.
43
91 percent of the households have more than two containers to keep water.
73 percent of the households have more than 75 liters of water.
23 percent of the households do not cover the water containers.
45 percent of the households do not have clean bathroom tissue.
In 43 percent of the households there are traces of or actual feces inside the house. The same is true for the staircases.
In 42 percent of the cases, there are animal feces inside the house as well as the staircase.
In 43 percentage of the households feces are found as close to the house as 4 meters.
In 14 percent of the cases, the child has no underwear.
In 15 percent of the households the faucet is not well protected.
In 26 percent of the households, the faucet that provides drinking water is over 125 meters away from the house.
In 23 percent of the households, the bathroom is located outside of the house.
Analyzing the hygienic conditions in the households included in the study, we come to the conclusion that children are in danger to get diseases. There is a great need for intervention and improvement.
5.2. Parents use of the conditions available for child development
Having the financial resources and means to raise and develop their children is one aspect. The other aspect is the use of the conditions available for the child upbringing and development. As far as this is concerned, important findings resulted from our study.
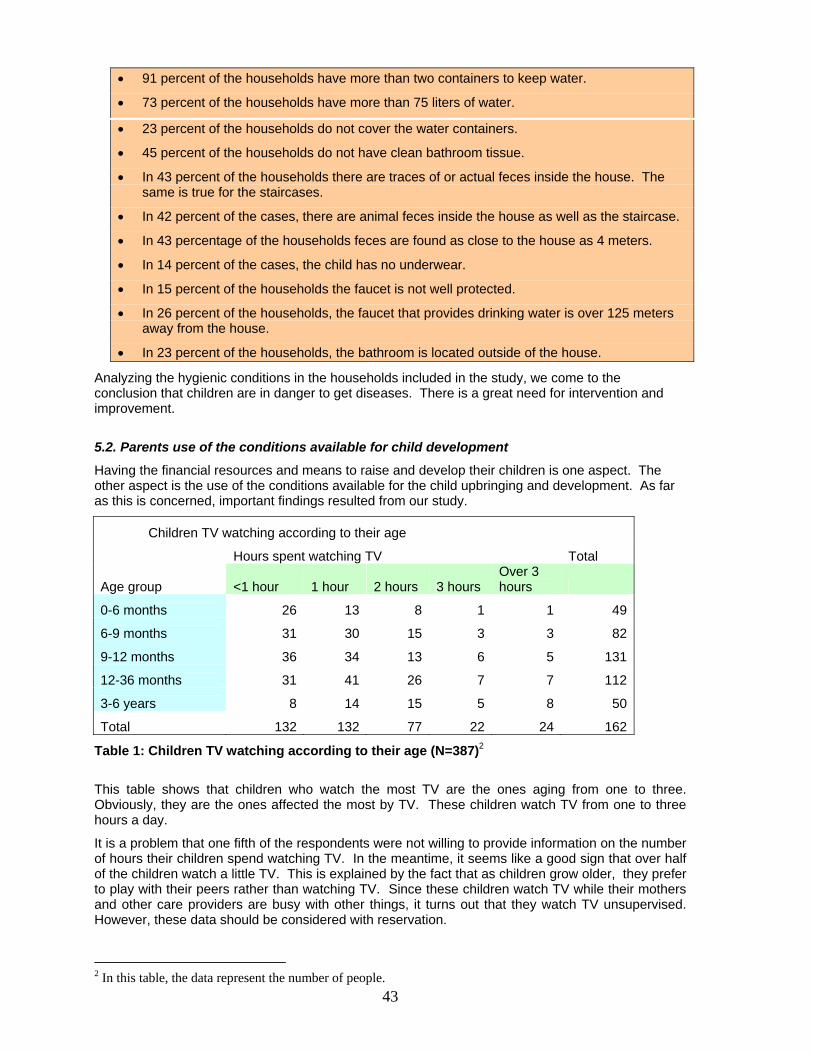
Children TV watching according to their age
Age group
Hours spent watching TV Total
<1 hour 1 hour 2 hours 3 hours Over 3 hours
0-6 months 26 13 8 1 1 49
6-9 months 31 30 15 3 3 82
9-12 months 36 34 13 6 5 131
12-36 months 31 41 26 7 7 112
3-6 years 8 14 15 5 8 50
Total 132 132 77 22 24 162
Table 1: Children TV watching according to their age (N=387)2
This table shows that children who watch the most TV are the ones aging from one to three. Obviously, they are the ones affected the most by TV. These children watch TV from one to three hours a day.
It is a problem that one fifth of the respondents were not willing to provide information on the number of hours their children spend watching TV. In the meantime, it seems like a good sign that over half of the children watch a little TV. This is explained by the fact that as children grow older, they prefer to play with their peers rather than watching TV. Since these children watch TV while their mothers and other care providers are busy with other things, it turns out that they watch TV unsupervised. However, these data should be considered with reservation.
2 In this table, the data represent the number of people.
44
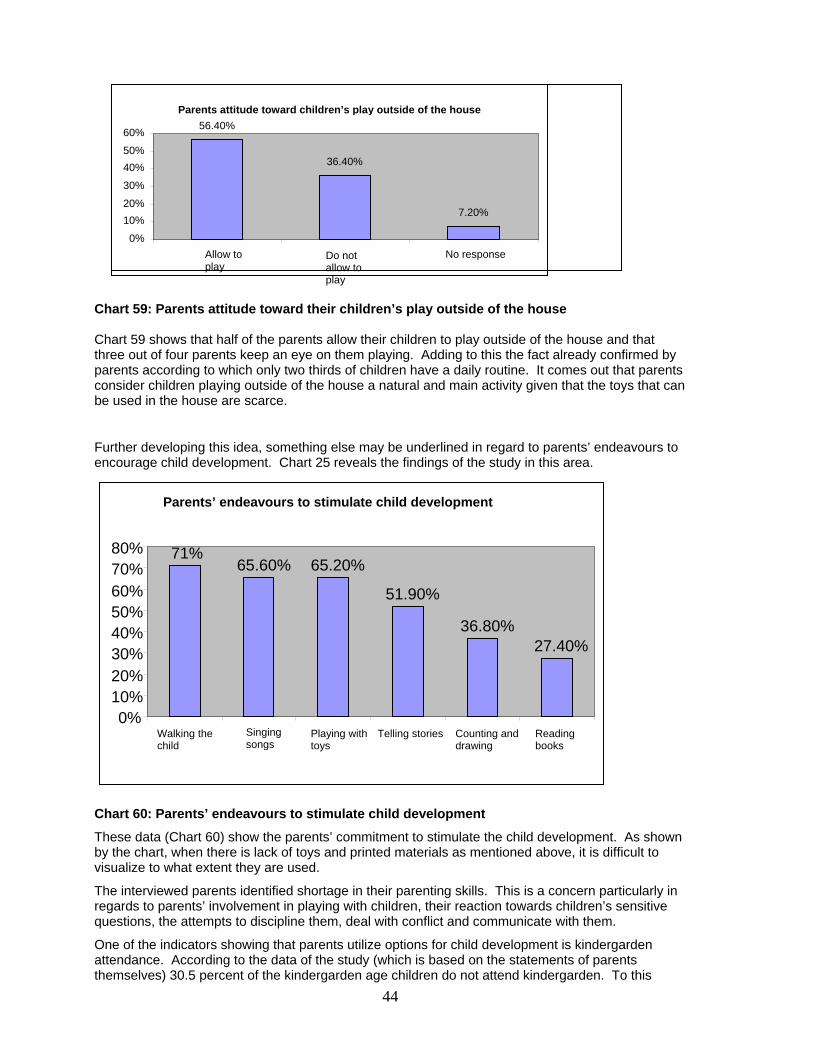
Chart 59: Parents attitude toward their children’s play outside of the house Chart 59 shows that half of the parents allow their children to play outside of the house and that three out of four parents keep an eye on them playing. Adding to this the fact already confirmed by parents according to which only two thirds of children have a daily routine. It comes out that parents consider children playing outside of the house a natural and main activity given that the toys that can be used in the house are scarce.
Further developing this idea, something else may be underlined in regard to parents’ endeavours to encourage child development. Chart 25 reveals the findings of the study in this area.
Chart 60: Parents’ endeavours to stimulate child development
These data (Chart 60) show the parents’ commitment to stimulate the child development. As shown by the chart, when there is lack of toys and printed materials as mentioned above, it is difficult to visualize to what extent they are used.
The interviewed parents identified shortage in their parenting skills. This is a concern particularly in regards to parents’ involvement in playing with children, their reaction towards children’s sensitive questions, the attempts to discipline them, deal with conflict and communicate with them.
One of the indicators showing that parents utilize options for child development is kindergarden attendance. According to the data of the study (which is based on the statements of parents themselves) 30.5 percent of the kindergarden age children do not attend kindergarden. To this
Parents attitude toward children’s play outside of the house
56.40%
36.40%
7.20%
0%
10%
20%
30%
40%
50%
60%
Allow to play
Do not allow to play
No response
Parents’ endeavours to stimulate child development
71%65.60% 65.20%
51.90%
36.80%27.40%
0%10%20%30%40%50%60%70%80%
Walking the child
Singing songs
Playing with toys
Telling stories Counting anddrawing
Reading books
45
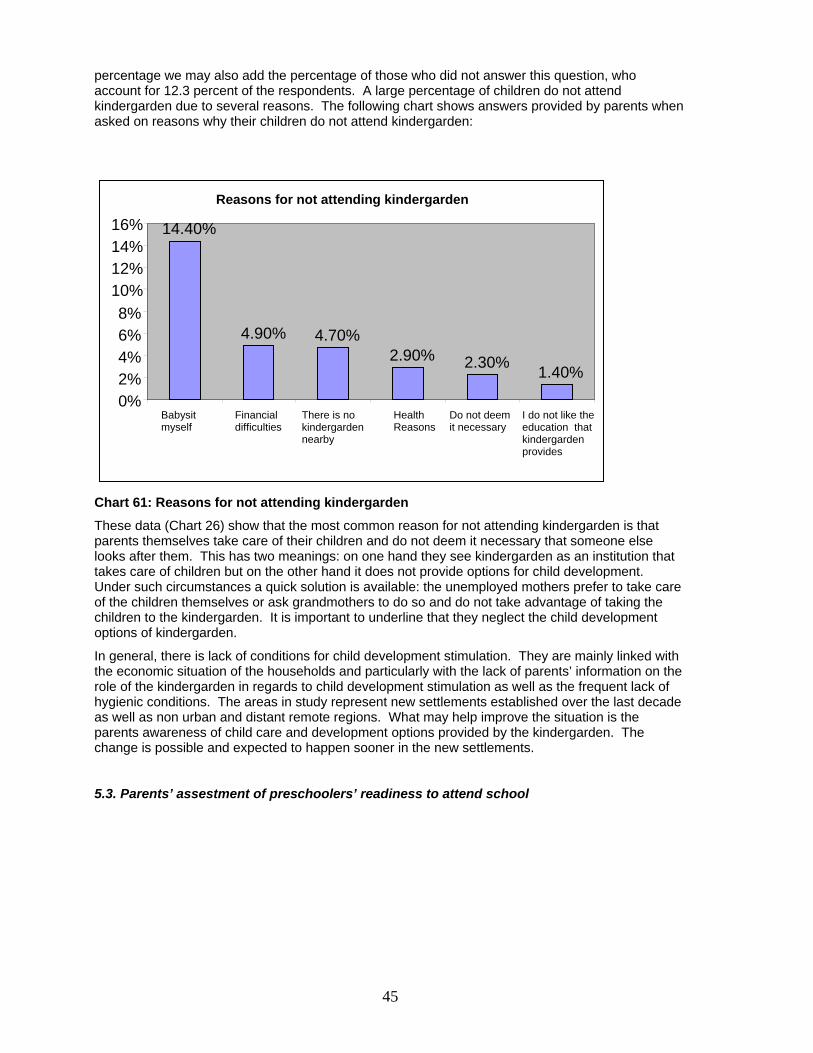
percentage we may also add the percentage of those who did not answer this question, who account for 12.3 percent of the respondents. A large percentage of children do not attend kindergarden due to several reasons. The following chart shows answers provided by parents when asked on reasons why their children do not attend kindergarden:
Chart 61: Reasons for not attending kindergarden
These data (Chart 26) show that the most common reason for not attending kindergarden is that parents themselves take care of their children and do not deem it necessary that someone else looks after them. This has two meanings: on one hand they see kindergarden as an institution that takes care of children but on the other hand it does not provide options for child development. Under such circumstances a quick solution is available: the unemployed mothers prefer to take care of the children themselves or ask grandmothers to do so and do not take advantage of taking the children to the kindergarden. It is important to underline that they neglect the child development options of kindergarden.
In general, there is lack of conditions for child development stimulation. They are mainly linked with the economic situation of the households and particularly with the lack of parents’ information on the role of the kindergarden in regards to child development stimulation as well as the frequent lack of hygienic conditions. The areas in study represent new settlements established over the last decade as well as non urban and distant remote regions. What may help improve the situation is the parents awareness of child care and development options provided by the kindergarden. The change is possible and expected to happen sooner in the new settlements. 5.3. Parents’ assestment of preschoolers’ readiness to attend school
Reasons for not attending kindergarden
14.40%
4.90% 4.70%2.90% 2.30%
1.40%
0%2%4%6%8%
10%12%14%16%
Babysit myself
Financial difficulties
There is no kindergarden nearby
Health Reasons
Do not deem it necessary
I do not like the education that kindergarden provides
46
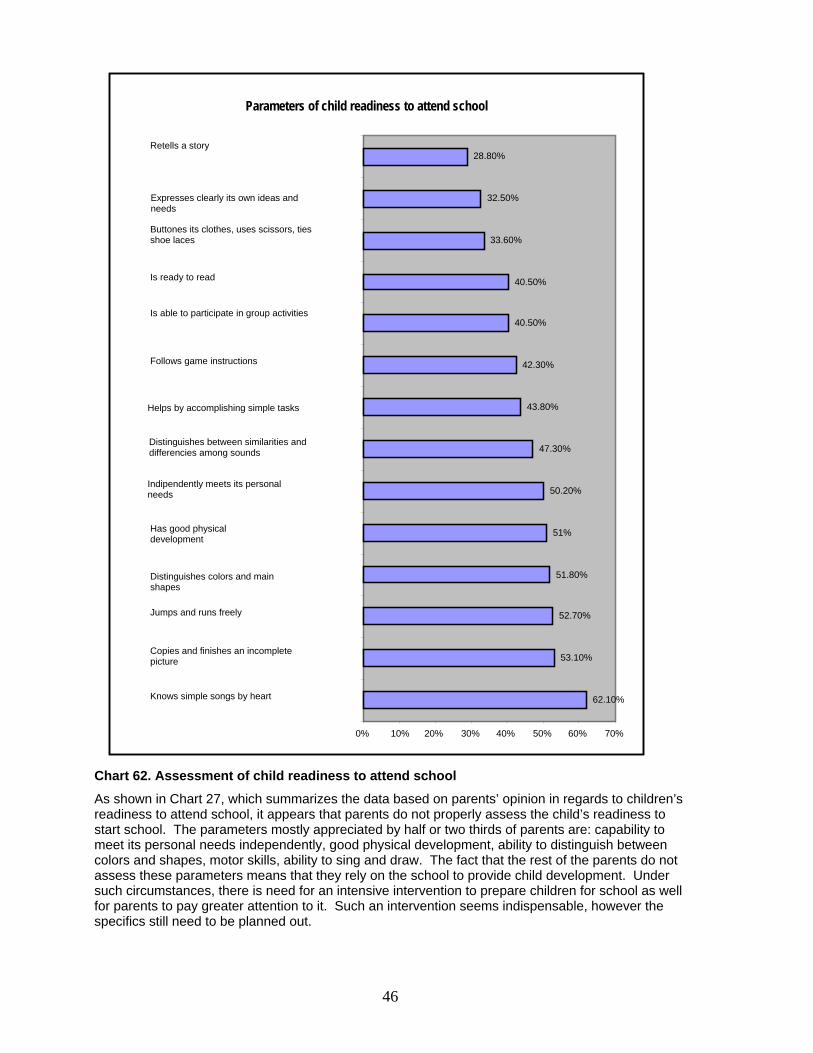
Chart 62. Assessment of child readiness to attend school
As shown in Chart 27, which summarizes the data based on parents’ opinion in regards to children’s readiness to attend school, it appears that parents do not properly assess the child’s readiness to start school. The parameters mostly appreciated by half or two thirds of parents are: capability to meet its personal needs independently, good physical development, ability to distinguish between colors and shapes, motor skills, ability to sing and draw. The fact that the rest of the parents do not assess these parameters means that they rely on the school to provide child development. Under such circumstances, there is need for an intensive intervention to prepare children for school as well for parents to pay greater attention to it. Such an intervention seems indispensable, however the specifics still need to be planned out.
Parameters of child readiness to attend school
62.10%
53.10%
52.70%
51.80%
51%
50.20%
47.30%
43.80%
42.30%
40.50%
40.50%
33.60%
32.50%
28.80%
0% 10% 20% 30% 40% 50% 60% 70%
Knows simple songs by heart
Copies and finishes an incomplete picture
Jumps and runs freely
Distinguishes colors and main shapes
Has good physical development
Indipendently meets its personal needs
Distinguishes between similarities and differencies among sounds
Helps by accomplishing simple tasks
Follows game instructions
Is able to participate in group activities
Is ready to read
Buttones its clothes, uses scissors, ties shoe laces
Expresses clearly its own ideas and needs
Retells a story
47
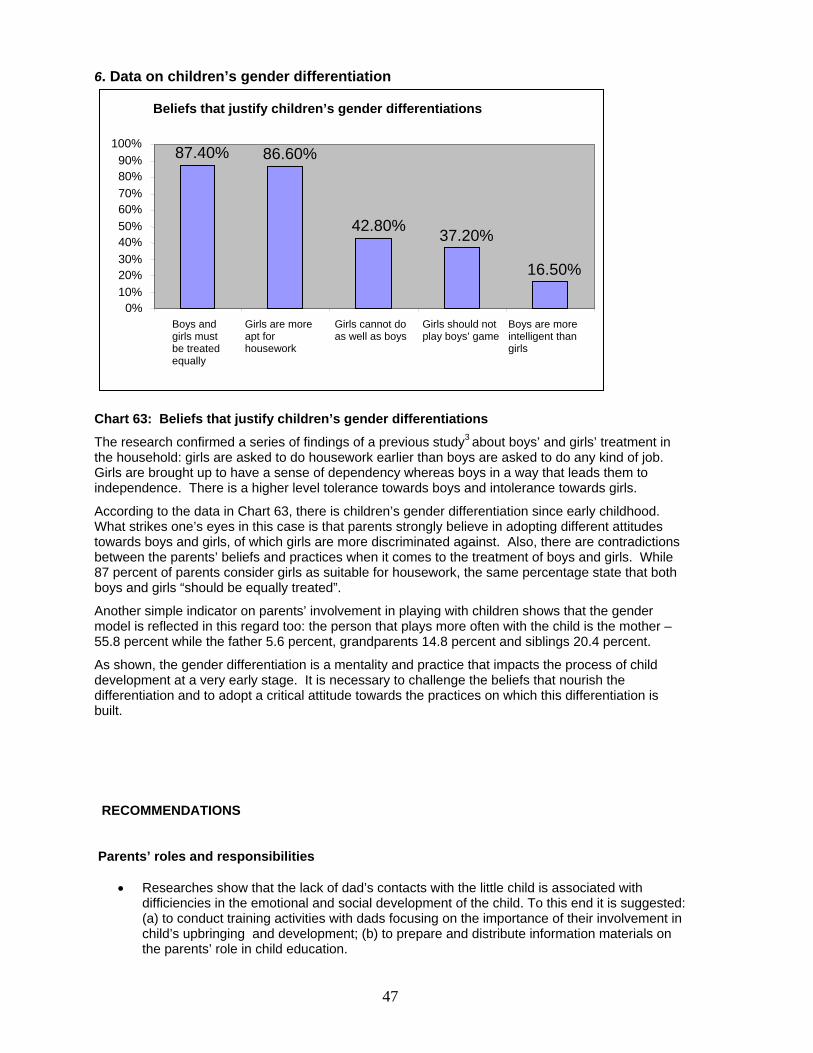
6. Data on children’s gender differentiation
Chart 63: Beliefs that justify children’s gender differentiations
The research confirmed a series of findings of a previous study3 about boys’ and girls’ treatment in the household: girls are asked to do housework earlier than boys are asked to do any kind of job. Girls are brought up to have a sense of dependency whereas boys in a way that leads them to independence. There is a higher level tolerance towards boys and intolerance towards girls.
According to the data in Chart 63, there is children’s gender differentiation since early childhood. What strikes one’s eyes in this case is that parents strongly believe in adopting different attitudes towards boys and girls, of which girls are more discriminated against. Also, there are contradictions between the parents’ beliefs and practices when it comes to the treatment of boys and girls. While 87 percent of parents consider girls as suitable for housework, the same percentage state that both boys and girls “should be equally treated”.
Another simple indicator on parents’ involvement in playing with children shows that the gender model is reflected in this regard too: the person that plays more often with the child is the mother – 55.8 percent while the father 5.6 percent, grandparents 14.8 percent and siblings 20.4 percent.
As shown, the gender differentiation is a mentality and practice that impacts the process of child development at a very early stage. It is necessary to challenge the beliefs that nourish the differentiation and to adopt a critical attitude towards the practices on which this differentiation is built.
RECOMMENDATIONS Parents’ roles and responsibilities
Researches show that the lack of dad’s contacts with the little child is associated with difficiencies in the emotional and social development of the child. To this end it is suggested: (a) to conduct training activities with dads focusing on the importance of their involvement in child’s upbringing and development; (b) to prepare and distribute information materials on the parents’ role in child education.
Beliefs that justify children’s gender differentiations
87.40% 86.60%
42.80%37.20%
16.50%
0%10%
20%30%
40%50%
60%70%
80%90%
100%
Boys and girls must be treated equally
Girls are more apt for housework
Girls cannot do as well as boys
Girls should not play boys’ game
Boys are more intelligent than girls
48
The research findings show that mothers are child’s main care providers while grandmothers, dads, and older siblings, play a secondary role as far as child care is concerned. Based on these findings it is recommended to include all these family actors in the training activities focusing on child’s rearing and development.
Feeding practices
Run home based programs on early childhood to be attended by mothers and other
important care takers (grandmothers, older sisters, etc.,) aiming at providing them with information on breast feeding, the dangers resulting from early or late introduction to supplemental food and use of milk bottles.
Trainings on early childhood for health care employees to brief them on the breast feeding components, the best time for introducing supplemental food and diet components that are necessary to meet the child’s growing and development needs.
Prepare and distribute information materials on breast feeding recommended techniques, the nutrition needs of the child from zero to three years old, and the proper feeding ways.
Practices of child health care
Educate parents to take the child’s to regular check ups in order to monitor its growth and development. As a very good preventive measure, these check ups should not be done only duringthe first year of the child’s life.
Prepare information materials on vaccinations, the timing and purpose of each vaccine. Prepare information materials on pregnancy, nutrition needs during pregnancy, different
threats and diseases that may affect the mother and the child. Educate mothers to have regular monthly check ups during pregnancy
Conduct home based programs on early childhood intending to brief parents and other care takers on the importance and the need for regular check ups as the main preventive measure and educate them to distinguish between the symptoms that need immediate professional treatment and diseases that may be treated at home.
Conduct health education programs on the management of early childhood diseases by visiting households and organizing trainings with parent groups, as well as using more intensively the electronic and written media.
Parents’ Information Level on the child’s all round development
Parents’ information on the physical, mental, linguistic, emotional and moral development of children from zero to six years old.
Stimulation of linguistic, cognitive, emotional and social development of children
Parents need to develop and improve their parenting skills. To this end it is necessary to conduct different training courses to enable them to apply the obtained information.
The less privileged households may be assisted with packets of printed materials, inexpensive books and means for writing. Toys that other people do not use any longer or those rinovated by the institutions may be collected and given to the less privileged households.
Parents may be trained to take actions to improve children’s safety at home.
The awareness campaigns are needed to improve the hygiene of food, house, water, bathrooms, and yard where children play.
It is possible to improve TV programs: morning broadcasts may better address the needs of children from zero to six years old who are reared at home.
Parents’ awareness of children’s games and their all round impact on the development of child’s personality is a necessity. Moreover, parents should be educated to play with their children because this impacts their development.
49
Where possible it is expected to increase the percentage of children who go to day care (kindergarten). Kindergartens play an indispensable role for children’s development.
The respondent parents discovered shortcomings in their parenting skills. This is observed in: parents’ involvement in playing with children, parents’ reaction to delicate questions that children may ask, endeavours to discipline children, resolve conflicts, communicate with them, etc.
Children’s preparation for school should be a priority. Special intensive programs may be also developed for children who do not go to kindergartens and who later join the same classrooms with the children who are well prepared for school. This may be considered as an additional duty of kindergartens where they are available.
Children’ gender differentiations
Beliefs that support girls’ discrimination and favour boys should be challenged. To achieve this, publications, trainings and public awareness campaigns may be used.
APPENDIX Questionaire on the child rearing practices (age 0-3) Interviewer’s name: ___________________________________________ Respondent’s name: ___________________________________________ Date/Time: ___________________________________________ Venue: ___________________________________________ No_____ ___________________________________________ Greetings! Thanks for accepting to be part of this study. First we would like to introduce ourselves, who we are and what the focus of our work is. Our names are: ................... & ....................... We are helping with a study aiming at showing how Albanian parents rear their children. We want to realize which are the parents’ positive attitudes and what are the general misconceptions and misunderstandings about child care. We want to assure you that your name and address will not be recorded, reported or made public to any other person or organisation for any reason. Only the researchers will review this information for the study purposes. One of us will walk around your household and write down notes. The interview will last about 45 minutes. I. General information 1. Who responds to the questionaire? 1. Mother 2.Father 3. Grandmother 4. Grandfather 5. Other family members 2. Household location 1. Village 2. Town 3. Age 1. Up to 25 years old 2. 25-40 3. Over 40 4. Employment status: 1. Housewife 2. Employed 5. Faith: 1. Orthodox 2. Moselm 3. Catholic 4. Other 6. Education 1. Elementary 2. High school 3 University 4.No education 7. How many children do you have? 1. One 2. Two 3. Three 4. Over three 8. Do all the children have birth certificates? 1. Yes 2. No If not, please state why:______________________________________________ 9. Child’s age (this is the goal of the study): 1. 0-6 months 2. 6-9 months 3. 9-12 months 4. 12-36 months 5. 3-6 years old 10. Sex of the baby that is the object of the study: 1. Boy 2. Girl
50
11. How many people are there in the household: 1. Only mother, father and children (small family) 2. Mothr, father, children and other people (extended family) II. Who takes care of the baby 12. Who is the main care provider (who feeds, cleans, dresses) mostly the child (that is the purpose of the study) (Mark only one response)? 1. Mother 2. Father 3. Grandfather 4. Grandmother 4. Older sister 5. Older brother 6. Other family members 13. Who, in addition to the main care provider, takes more care of the child (who feeds, cleans, dresses) (Mark only one response): 1. Mother 2. Father 3.Grandfather 4. Grandmother 4. Older sister 5. Older brother 6. Other family members 14. In your opinion, who should be the main care provider for the child (who feeds, cleans, dresses)? (mark one response): 1. Mother 2. Father 3.Grandfather 4. Grandmother 4. Older sister 5. Older brother 6. Other family members III. Baby feeding practices a) Attention! Question for the care providers of babies from zero to six months old 15. Do you breast feed your baby? 1. Yes 2. No 16. When did you first breast feed the baby:
1. About one hour after birth 2. One to two hours after birth
3. Three to six hours after birth 4. Over six hours after birth
17. Why is it important to breast feed your baby? _______________________________________________________________________________________ 18. How long should you breast feed your baby? 1. Until one year 2. Up to one year and a half 3. Up to two years 4. Up to two and a half years 5. Up to three years 6. Even after three years 19. How often do you breast feed your baby in a day: 1. As much as it needs 2. By a time schedule 20. What do you think: Is breast feeding the only food and drink that a child needs in the first six months. 1. Agree 2. Do not agree 3. I am not sure 4. I do not know 21. Who helped you more with breast feeding?
51
1. Your mother/mother-in-law 2. Another woman/your friend 3. Health care staff 22. Do you use milk bottles to feed your baby? 1. Yes 2. No Did you give any of the following to your baby in the last 24 hours: 23. Water 1. Yes 2. No 24. Milk in addition to breast milk (for instance cow milk etc.) 1. Yes 2. No 25. Different types of juices with sugar 1. Yes 2. No 26. Liquid food 1. Yes 2. No 27. Solid food 1. Yes 2. No 28. What do you do if the baby refuses to eat? Be nice to the child in order to make him eat (play, pat it or change the food, etc. ) Make him eat Leave the baby alone Yell at the baby Spank it It is not a problem 29. Who helps the child eat when provided with supplemental food? 1. Mother 2. Other family members 3. No one 30. How often has the health care staff/nurse visited your household and checked your baby in the first year (mark only one option)
1. Every month 2. Every three months 3. Every six months 4. When called/needed 5. Never 6. Others, specify the time of visits: ______________________________ 31. The baby should be able to turn its head when hearing familiar sounds when it is only one month old. 1. Agree 2. Do not agree 3. I am not sure 4. I do not know 32. It is important to play with and to talk to the baby as often as possible, show objects, colors and shapes. 1. Agree 2. Do not agree 3. I am not sure 4. I do not know 33. The baby may establish eye contact and smile. 1. Agree 2. Do not agree 3. I am not sure 4.I do not know b) Attention! Questions for care providers of children from six to nine months old 34. Do you breast feed your baby? 1. Yes 2. No
52
35. When did you begin breast feeding your baby after birth: 1. About one hour after birth 2. One to three hours after birth 3. Three to six hours after birth 4. Over six hours after birth 36. Why do you think breast feeding for your child is important? __________________________________________________________________________________________ 37. How long should you breast feed your baby? 1. Up to one year 2. Up to one year and a half 3. Up to two years 4. Up to two and a half years 5. Up to three years 6. Even over three years 38. How often do you breast feed your baby in a day? 1. As much as it needs 2. By a time schedule 39. Breast feeding is the only food and drink that the baby needs in the first six months. 1. Agree 2. Do not agree 3. I am not sure 4. I do not know 40. Who helped you more with breast feeding?
1. Your mother/mother-in-law 2. Another woman/your friend 3. Health care staff 41. Do you use milk bottles for feeding your baby? 1. Yes 2. No (Food diversity) Which of the following food items did you provide your baby with in the last 24 hours: 42. Vegetable puree (crushed vegetable) (vitamins, minerals) 1. Yes 2. No 43. Vegetable soup (minerals, vitamins) 1. Yes 2. No 44. Potatoes (mashed or in a different form) (carbohydrates) 1. Yes 2. No 45. Fruit puree (crushed fruit) (vitamins, carbohydrates) 1. Yes 2. Jo 46. Corn flour drink (fermented corn flour) (carbohydrates) 1. Yes 2. No 47. Deserts/Cookies (carbohydrates) 1. Yes 2. Jo 48. Food containing grains (flour, starch, rice, etc.) such as pudding,
stuffing, rice soup, gelatin (carbohydrates) 1. Yes 2. No 49. Butter (proteins, fats) 1. Yes 2. No 50. Other milk in addition to breast milk (cow, sheep, etc.) (proteins, fats) 1. Yes 2. No 51. Yogurt/buttermilk (proteins,fats) 1. Yes 2. No 52. Meat/Chicken/Fish (proteins/fats) 1. Yes 2. No 53. Egg/Yolk (proteins) 1. Yes 2. No 54. Different teas 1. Yes 2. No 55. Juice (carbohydrates, vitamins, minerals) 1. Yes 2. No 56. Water (minerals) 1. Yes 2. No 57. Other foods in addition to the above list. Specify:_________________________ _____________________________________________________________________________ _____________________________________________________________________________ (Meal frequency in 24 hours)
53
How many suplemental meals have you provided your baby with in the last 24 hours? 1. No meal 2. One meal 3. Two to three meals 59. What do you do in case your baby refuses to eat? 1. Be nice to the baby in order to make it eat (play with the baby, pat it, change the food, etc.) 2. Make the baby eat 3. Leave the baby alone 4. Yell at the baby 5. Spank the baby 6. It is not a problem 60. Who helps the child eat when provided with supplemental food? 1. Mother 2. Other family members 3. No one 61. How often did the health care staff/nurse visited your household to check on the baby during the first year? (mark only one option)
1. Every month 2. Every three months 3. Every six months 4. When called/there is need 5. Never 6. Others, please specify the time of visits:
______________________________ 62. How often do you bathe the baby? (mark one option) 1. Everyday 2. Three times a week 3. Twice a week
4. Once a week Stimulation 63. Do you let the child crawl to explore objects? 1. Yes 2. No 64. Baby may pick up items using the index finger and thumb 1. Agree 2. Do not agree 3. I am not sure 4. I do not know 65. Baby should be able to try its own spoon and glass. 1. Agree 2. Do not agree. 3. I am not sure 4. I do not know 66. It is important to talk to and play with the baby as much as possible, to show him objects, colors and shapes. 1. Agree 2. Do not agree 3. I am not sure 4. I do not know c) Attention! Questions for care providers of children from nine-twelve months old 67. Do you breast feed your baby? 1. Yes 2. No
54
68. When did you begin breast feeding your baby: 1. One hour after birth 2. One to two hours after birth 3. Three to six hours after birth 4. Over six hours after birth 69. Why do you think breast feeding is important for your baby? ________________________________________________________________________________ 70. How long should you breast feed your baby ? 1. Up to a year 2. Up to one year and a half 3. Up to two years 4. Up to two years and a half 5. Up to three years 6. Over three years 71. What do you think of the following statement: Breast feeding is the only food and drink that the baby needs in the first six months of its life. 1. Yes 2. No 3. I am not sure 4. I do not know 72. Has the health care staff shown/instructed you how to breast feed your baby? 1. Yes 2. No 73. How many times a day do you breast feed your baby?
1. As much as it needs 2. By a time schedule 74. Who helped you more with breast feeding methods?
1. Your mother/mother-in-law 2. Another woman /your friend 3. Health care staff 75. Do you use milk bottles to feed your baby? 1. Yes 2. No (Food diversity ) Which of the following food items did you feed you child in the last 24 hours? 76. Vegetable puree (pureed vegetables) (vitamins, minerals) 1. Yes 2. No 77. Vegetable soup (minerals vitamins) 1. Yes 2. No 78. Potatoes (mashe or in another form) (carbohydrates) 1. Yes 2. No 79. Fruit puree (crushed fruit) (vitamins, carbohydrates) 1. Yes 2. No 80. Corn flour drink (fermented corn flour) (carbohydrates) 1. Yes 2. No 81. Deserts/Cookies (carbohydrates) 1. Yes 2. No 82. Food containing grains (flour, starch, rice, etc.) 83. PSD pudding, stuffing, rice soup, starch desert, gelatin (carbohydrates)1. Yes 2.
No 84. Butter (proteins, fats) 1. Yes 2. No 85. Other milk in addition to breast milk (cow/sheep, etc.) (Proteins, fats) 1. Yes 2. No 86. Yogurt/butter milk (proteins/fats) 1. Yes 2. No 87. Meat/Chicken/Fish (proteins/fats) 1. Yes 2. No 88. Egg/Yolk (proteins) 1. Yes 2. No 89. Different teas 1. Yes 2. No 90. Juice (carbohydrates, vitamins, minerals) 1. Yes 2. No 91. Water (mineral) 1. Yes 2. No 92. Other types of food in addition to the above list. Specify:_____________________________
55
_____________________________________________________________________________ _____________________________________________________________________________ (Meal frequency in 24 hours) How many supplemental meals have you provided your baby with in the last 24 hours? 1. No meal 2. One to two 3. Three or more meals 93. What do you do if your child refuses to eat? 76. Be nice to him in order to make him eat (play with him, pat it, change the food, etc.) 77. Make him eat 78. Leave it alone 79. Yell at it 80. Spank it 81. It is not a problem 94. Who helps the child eat when provided with supplemental food? 1. Mother 2. Other family members 3. No one 95. How often has the health care staff/nurse visited and checked up on your child during the first year of its life (mark only one option)
1. Every month 2. Every three months 3. Every six months 4. When called/needed 5. Never 96. How often do you bathe the baby? (mark only one option) 1. Every day 2. Three times a week 3. Twice a week
4. Once a week 97. It is important to talk to and play with the baby as much as possible, show it objects, colors and shapes. 1. Agree 2. Do not agree 3. I am not sure 4. I do not know d) Attention! Questions only for care providers of children from 12 to 35 months old 98. Do you breast feed your child? 1. Yes 2. No 99. When did your start breast feeding your baby? 1. About one hour after birth 2. One to two hours after birth 3. Three to six hours after birth 4. Over six hours after birth 100. In your opinion, why is breast feeding important for your baby? ________________________________________________________________________________ 101. How long should you breast feed your baby? 1. Up to one year 2. Up to one year and a half 3. Up to two years
56
4. Up to two and a half years 5. Up to three years 6. Over three years 102. How often do you breast feed your baby in a day: 1. Whenever needed 2. By a time schedule 103. Do you think that breast feeding is the only food and drink that a baby needs in the first six months of its life? 1. Yes 2. No 3. I am not sure 4. I do not know 104. Has the health care provider shown/instructed you how to breast feed your baby? 1. Yes 2. No 105. Who helped you more with breast feeding methods? 1. Your mother/mother-in law
2. Another woman/friend 3. Health care staff
106. Do you use milk bottles to feed your baby? 1. Yes 2. No (Food diversity) Which of the following food items did you feed you child in the last 24 hours? 107. Vegetable puree (crushed vegetables), (vitamins, minerals) 1. Yes 2. No 108. Vegetable soup (minerals, vitamins) 1. Yes 2. No 109. Potatoes (mashed or in a different form) (carbohydrates) 1. Yes 2. No 110. Fruit puree (crushed fruit) (vitamins, carbohydrates) 1. Yes 2. No 111. Corn flour drink (fermented corn flour) (carbohydrates) 1. Yes 2. No 112. Deserts/Cookies (carbohydrates) 1. Yes 2. No 113. Food containing grains (flour, starch, rice, etc) 114. PSD pudding, stuffing, rice soup, gelatin (carbohydrates) 1. Yes 2. No 115. Butter (proteins, fats) 1. Yes 2. No 116. Other milk in addition to breast milk (cow, sheep, etc.) (proteins, fats)1. Yes 2. No 117. Yogurt/buttermilk (proteins/fats) 1. Yes 2. No 118. Meat/Chicken/Fish (proteins/fats) 1. Yes 2. No 119. Eggs/Yolk (proteins) 1. Yes 2. No 120. Different teas 1. Yes 2. No 121. Fruit juice (carbohydrates, vitamins, minerals) 1. Yes 2. No 122. Water (minerals ) 1. Yes 2. No 123. Other types of food in addition to the above list. Specify:__________________________ _____________________________________________________________________________ _____________________________________________________________________________ (meal frequency in 24 hours) 124. How often (how many meals) did you provide supplemental food to your child in the last 24
hours? 1. No meal 2. Two to three meals 3. Four or more meals 124. What do you do if the child refuses to eat?
1. Be nice to it in order to make it eat (play with the child, pat it, change the food, etc.) 2. Make it eat 3. Leave the child alone 4. Yell at him 5. Spank 6. It is not a problem
57
125. Who helps the child eat when it is given supplemental food?
1. Mother 2. Other family members 3. No one
126. How often do you bathe your child? 1. Every day 2. Three times a week 3. Twice a week
4. Once a week 127. It is important to speak to and play with the baby as often as possible, show it objects, colors and shapes. 1. Agree 2. Do not agree 3. I am not sure 4. I do not know Questions only about twentyfour to thirtysix month old age group 128. Does the child eat together with the family? 1. Yes 2. No 129. Does the child eat on his own? 1. Yes 2. No 130. Does your child have a toothbrush? 1. Yes 2. No If YES, how many times a day does it brush its teeth? ___________________________________________ 131. Have you taught your child to wash its hands? 1. Yes 2. No IV. Health care/hygiene practices Use of preventive health care services 132. Did the doctor check your child last month for its normal physical development? 1. Yes 2. No 133. Is your child vaccinated?
1. Yes 2. No
If YES, are you aware why vaccination is important for your child and what vaccinations did it get? ________________________________________________________________________________ ________________________________________________________________________________ (Pregnancy care) 134. Did you change your diet (eating regimen) when you were pregnant?
58
1. Yes 2. No If yes, tell us how you changed it ___________________________________________________________________________________________________________________________________________________________________________________________________________________________________________________________________________ ______________________________________________-____________________________________________ 135. How often did you see a doctor (gynecologist) during pregnancy: 1. Regularly (every two months) 2. Only when I needed to (Not regularly) 3. Never If you did not have a regular check up why did you not: 136. There is no gynecologist where I live 1. Yes 2. No 137. I feel ashamed to see a doctor 1. Yes 2. No 138. Family members do not allow me to see a doctor 1. Yes 2. No 139. I do not need to as long as I have no health problem 1. Yes 2. No 140. Other reasons: specify ___________________________________________________________________- ________________________________________________________________________________ 141. Were you ever vaccinated during pregnancy? 1. Yes 2. No If yes, what vaccination did you get? __________________________________________________ 142. Whose advice was more valuable for you during pregnancy? 1. Your mother/mother-in-law 2. Another woman /your friend 3. Health care staff 143. Where did the delivery happen? 1. Maternity 2. Home 3. Somewhere else. (Child health care) Which are the information sources you refer to about your child’s health and care (please mark all that fall under the following categories) 144. Doctor 1. Yes 2. No 145. Other health care staff (pharmacist, nurse, etc.) 1. Yes 2. No 146. Alternative medicine doctors 1. Yes 2. No 147. Grandparents/elderly 1. Yes 2. No 148. Relatives 1. Yes 2. No 149. Neighbours/friends 1. Yes 2. No 150. Imam/priest, clergy 1. Yes 2. No 151. Magazines/reviews 1. Yes 2. No 152. TV 1. Yes 2. No 153. Books 1. Yes 2. No 154. Radio 1. Yes 2. No 155. Others, please specify: ______________________________ 156. Do you take the sick child to the doctor? 1. Yes 2. No 157. If NOT, what is the main reason (mark only an option)
1. I cannot afford it 2. There is no health care center nearby 3. There is no need to
59
4. I would rather go to the alternative medicine doctor 5. Use my personal experience for treatment 6. I better consult a clergy (go to a Holy place) 7. Others, please specify: ______________________________
158. How often does your child get sick (Please mark only an option) 1. At least once a month 2. Twice a month 3. Once in the last three months 4. Once in the last six months 5. Never 159. What are the reasons you went to see a doctor in the last six months? ____________________________________ ______________________________________________________________________________________________________________________________________________________________________________________________________________________________________________________________________________ V. Physical, mental, emotional and social stimulation of the child by the care providers 160. Do you let your children play outside of the house? 1. Yes 2. No 161. Do you keep an eye on your children while playing? 1. Yes 2. No 162. Does your child has a daily regimen? 1. Yes 2. No 163. What do you do in your household when your child does not properly pronouce sounds or certain words?
1. Ask him not to speak 2. Repeat properly what the child pronounces wrong 3. Mimic it 4. Tease it 5. Others
164. Does your child watch TV? 1. Yes 2. No If yes, how many hours a day does it watch TV?
1. less than one hour 2. about one hour 3. about two hours 4. about three hours 5. over three hours a day
166. What do you do with the child when it is up? ____________________________________________________________________ ____________________________________________________________________ ____________________________________________________________________ ____________________________________________________________________ 167. What is your reaction when the child asks a lot of delicate questions? ____________________________________________________________________ ____________________________________________________________________ ____________________________________________________________________ What conditions should a child meet to enter school? 168. independently meets its personal needs 1. Yes 2. No 169. has good physical development 1. Yes 2. No 170. is able to participate in joint group activities 1. Yes 2. No
60
171. is capable to read 1. Yes 2. No 172. is capable to listen to a story and retell it properly 1. Yes 2. No 173. is capable to follow the game and other new activity instructions 1. Yes 2. No 174. clearly expresses its ideas and needs to the others 1. Yes 2. No 175. helps at home by completing simple tasks 1. Yes 2. No 176. distinguishes among colors and basic shapes 1. Yes 2. No 177. distinguishes similarities and differences among sounds 1. Yes 2. No 178. knows simple songs by heart 1. Yes 2. No 179. jumps and runs easily 1. Yes 2. No 180. buttons clothes, tighs shoe laces, cuts with scissors 1. Yes 2. No 181. copies simple shapes, completes a circle and a triangle 1. Yes 2. No 182. Does your child go to kindergarten? 1. Yes 2. No If not, please say why (write down everything that falls under one of the following) 183. There is no kindergarten nearby 1. Yes 2. No 184. Financial hardships 1. Yes 2. No 185. Child is in poor health/often gets sick 1. Yes 2. No 186. I myself want to look after it 1. Yes 2. No 187. I do not think it is necessary 1. Yes 2. No 188. I do not like the education system 1. Yes 2. No 189. Others, please specify: _____________________________________________ 190. How many hours altogether do you play with your child? (choose only one option)
1. Zero 2. Less than one hour 3. Over one hour 4. Two to three hours 5. Over three hours
191. Who plays more with the child? (mark only one optiont) 1. Mother 2. Father 3. Grandparents 4. Other siblings 192. What games do you play with your child? ________________________________________________________________________________ ________________________________________________________________________________ 193. What are the family activities you conduct (including the child)? ____________________________________________________________________ ____________________________________________________________________ ____________________________________________________________________ ____________________________________________________________________ In which of the following activities with the CHILD were you or another family member over fifteen years old involved with last week? 194. Read books to the child or look at pictures together Yes No 195. TelI stories to the child Yes No 196. Sing songs with the child (or to the child) Yes No 197. Take walks with the child Yes No 198. Play with toys together with the child Yes No 199. Spend time with the child (counting objects, drawing) Yes No 200. Which are dad’s activities with the child in your household? ________________________________________________________________________________ ________________________________________________________________________________ ________________________________________________________________________________
61
201. Do you think that girls should not play with boy toys? 1. Yes 2. No 3. I am not sure 4. I do not know 202. Do you believe that boys are naturally smarter than girls? 1. Yes 2. No 3. I am not sure 4. I do not know 203. Do you think that boys and girls should be treated equally? 1. Yes 2. No 3. I am not sure 4. I do not know 204. Girls are better at housework while boys are better at working out of the house. 1. Yes 2. No 3. I am not sure 4. I do not know 205. Do you think that girls can do as well in life as boys? 1. Yes 2. No 3. I am not sure 4. I do not know 206. What would you do if your child would behave very improperly (mark only one response)
1. Yell at it 2. Curse at it 3. Spank it 4. Explain that what it is doing is wrong 5. Threaten with words 6. Call names 7. Threaten to hit it with an object
THE END
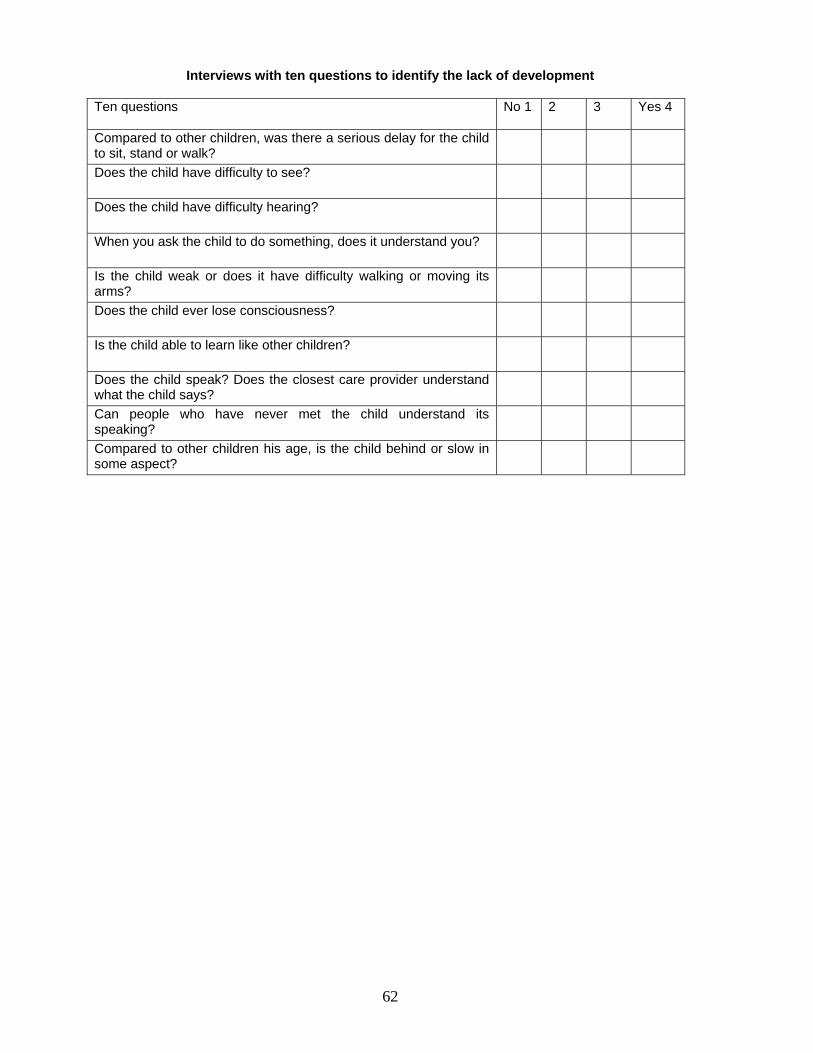
62
Interviews with ten questions to identify the lack of development Ten questions No 1 2 3
Yes 4
Compared to other children, was there a serious delay for the child to sit, stand or walk?
Does the child have difficulty to see?
Does the child have difficulty hearing?
When you ask the child to do something, does it understand you?
Is the child weak or does it have difficulty walking or moving its arms?
Does the child ever lose consciousness?
Is the child able to learn like other children?
Does the child speak? Does the closest care provider understand what the child says?
Can people who have never met the child understand its speaking?
Compared to other children his age, is the child behind or slow in some aspect?
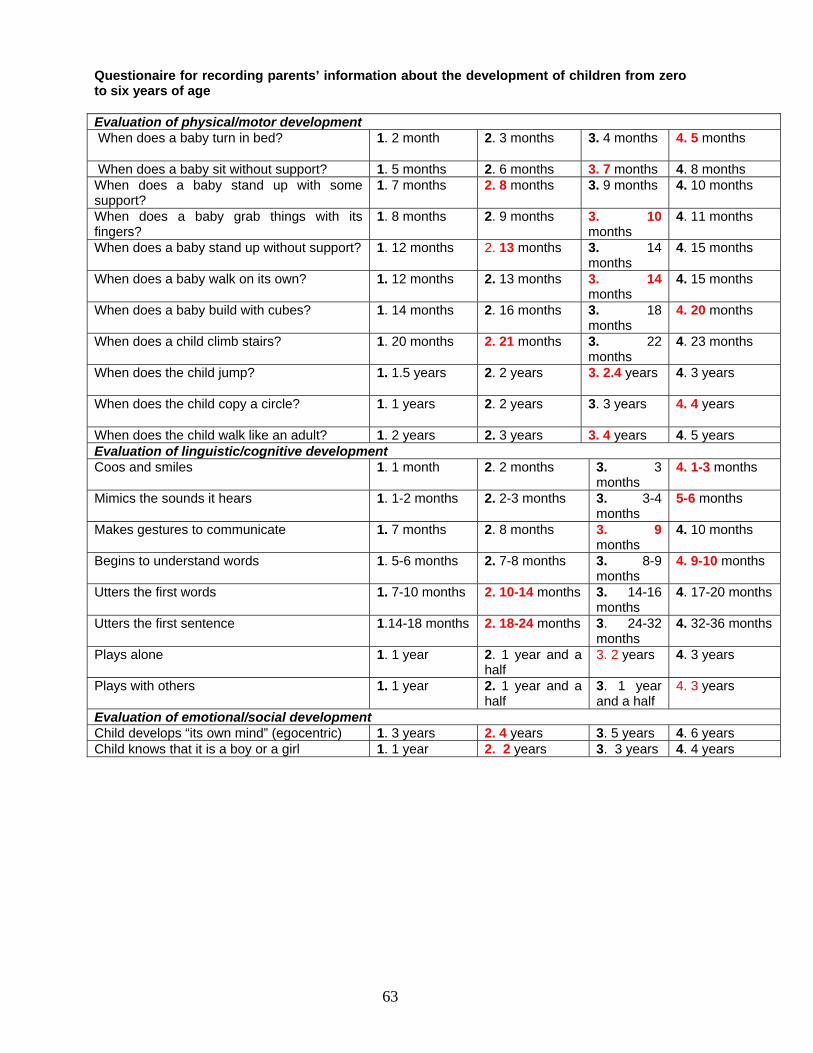
63
Questionaire for recording parents’ information about the development of children from zero to six years of age Evaluation of physical/motor development When does a baby turn in bed? 1. 2 month
2. 3 months 3. 4 months 4. 5 months
When does a baby sit without support? 1. 5 months 2. 6 months 3. 7 months 4. 8 months When does a baby stand up with some support?
1. 7 months
2. 8 months 3. 9 months 4. 10 months
When does a baby grab things with its fingers?
1. 8 months
2. 9 months 3. 10 months
4. 11 months
When does a baby stand up without support? 1. 12 months 2. 13 months 3. 14 months
4. 15 months
When does a baby walk on its own? 1. 12 months 2. 13 months 3. 14 months
4. 15 months
When does a baby build with cubes? 1. 14 months 2. 16 months 3. 18 months
4. 20 months
When does a child climb stairs? 1. 20 months
2. 21 months 3. 22 months
4. 23 months
When does the child jump? 1. 1.5 years
2. 2 years 3. 2.4 years 4. 3 years
When does the child copy a circle? 1. 1 years
2. 2 years 3. 3 years 4. 4 years
When does the child walk like an adult? 1. 2 years 2. 3 years 3. 4 years 4. 5 years Evaluation of linguistic/cognitive development Coos and smiles 1. 1 month
2. 2 months 3. 3
months 4. 1-3 months
Mimics the sounds it hears 1. 1-2 months 2. 2-3 months 3. 3-4 months
5-6 months
Makes gestures to communicate 1. 7 months 2. 8 months 3. 9 months
4. 10 months
Begins to understand words 1. 5-6 months 2. 7-8 months 3. 8-9 months
4. 9-10 months
Utters the first words 1. 7-10 months 2. 10-14 months 3. 14-16 months
4. 17-20 months
Utters the first sentence 1.14-18 months 2. 18-24 months 3. 24-32 months
4. 32-36 months
Plays alone 1. 1 year 2. 1 year and a half
3. 2 years 4. 3 years
Plays with others 1. 1 year 2. 1 year and a half
3. 1 year and a half
4. 3 years
Evaluation of emotional/social development Child develops “its own mind” (egocentric) 1. 3 years 2. 4 years 3. 5 years 4. 6 years Child knows that it is a boy or a girl 1. 1 year 2. 2 years 3. 3 years 4. 4 years