Embed Size (px)
Citation preview
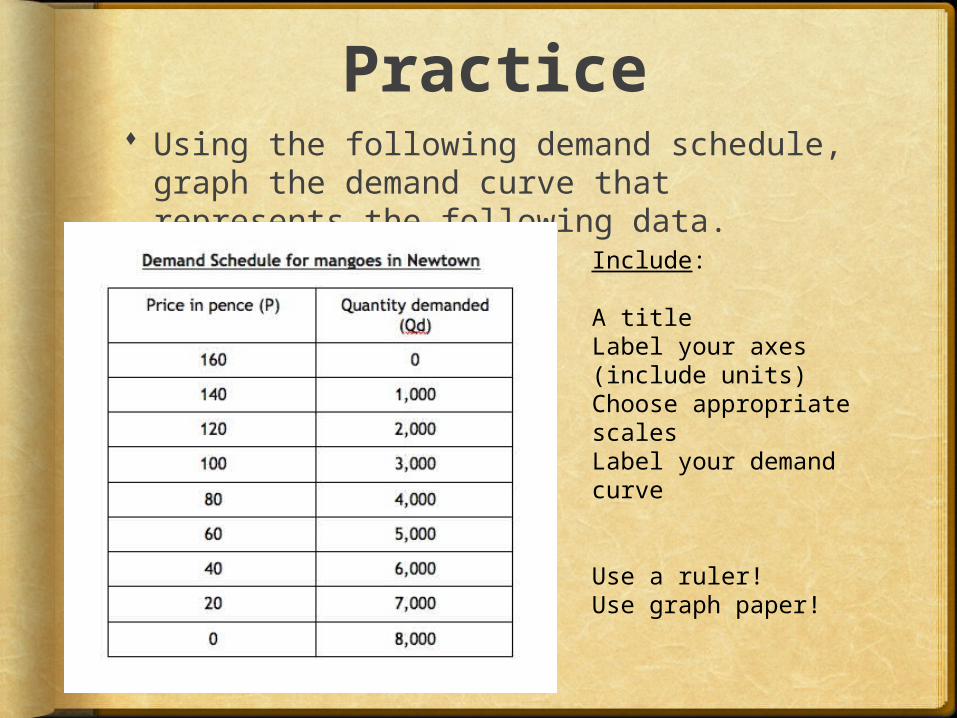
Practice Using the following demand schedule,
graph the demand curve that represents the following data.
Include:
A titleLabel your axes (include units)Choose appropriate scalesLabel your demand curve
Use a ruler!Use graph paper!
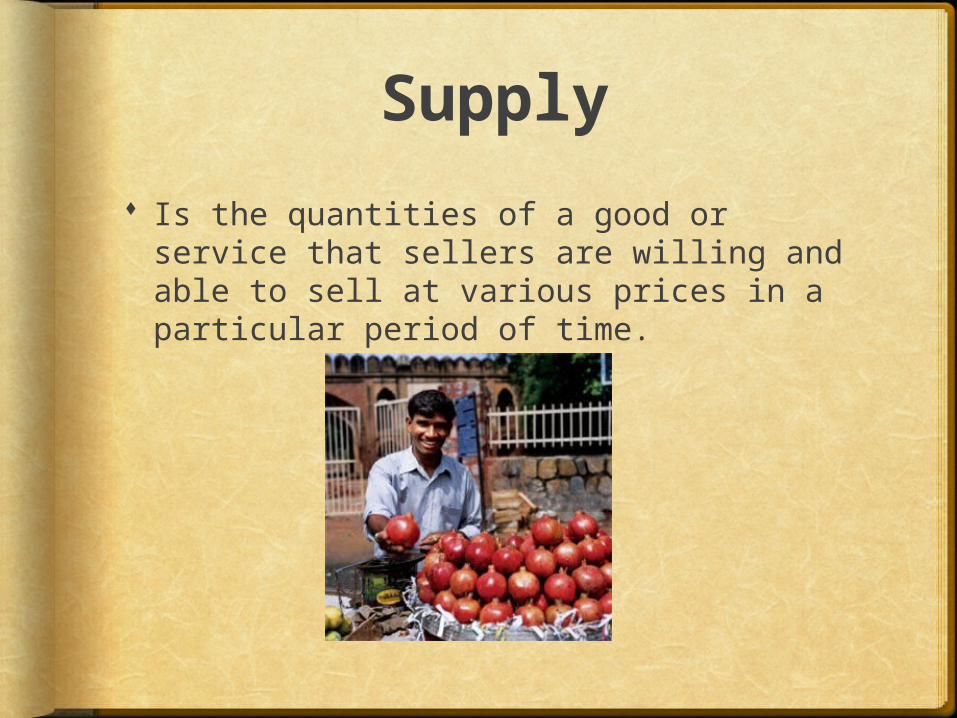
Supply
Is the quantities of a good or service that sellers are willing and able to sell at various prices in a particular period of time.
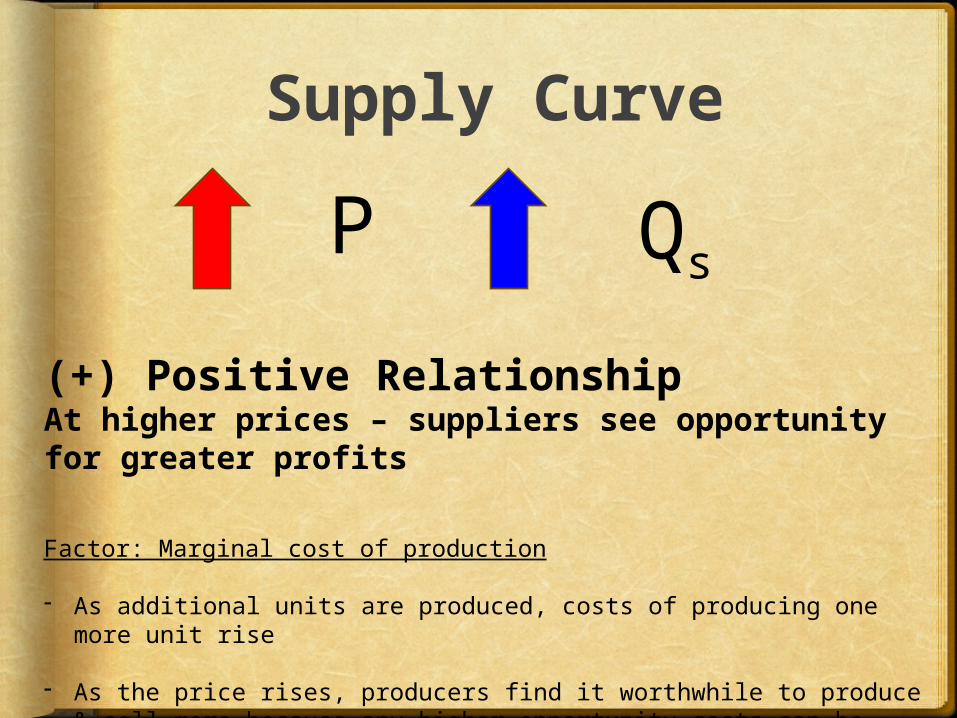
Supply Curve
P Qs
(+) Positive RelationshipAt higher prices – suppliers see opportunity for greater profits
Factor: Marginal cost of production
- As additional units are produced, costs of producing one more unit rise
- As the price rises, producers find it worthwhile to produce & sell more because any higher opportunity costs can be covered by the higher price.
Principles of Microeconomics, 2nd Canadian Edition Slide 1-4 Copyright © 2005 McGraw-Hill Ryerson Limited
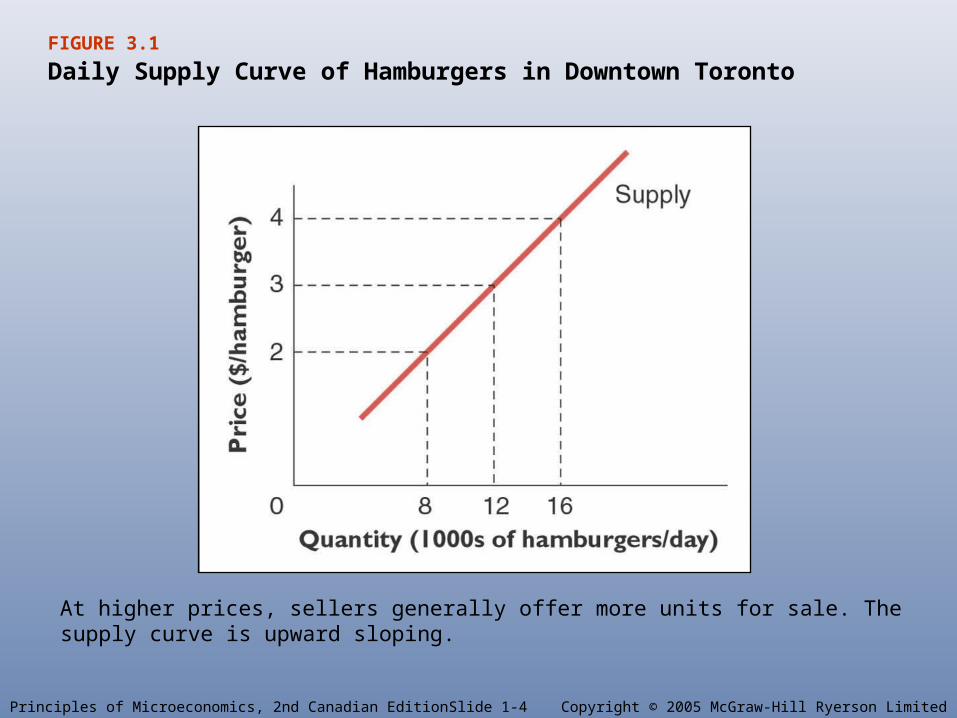
FIGURE 3.1
Daily Supply Curve of Hamburgers in Downtown Toronto
At higher prices, sellers generally offer more units for sale. The supply curve is upward sloping.
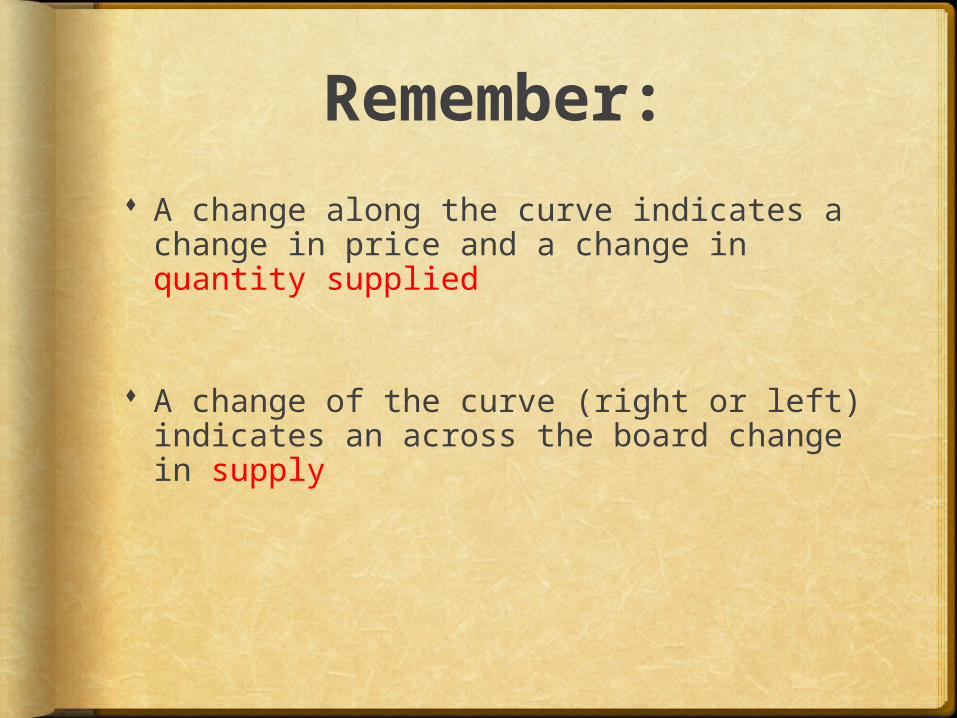
Remember:
A change along the curve indicates a change in price and a change in quantity supplied
A change of the curve (right or left) indicates an across the board change in supply
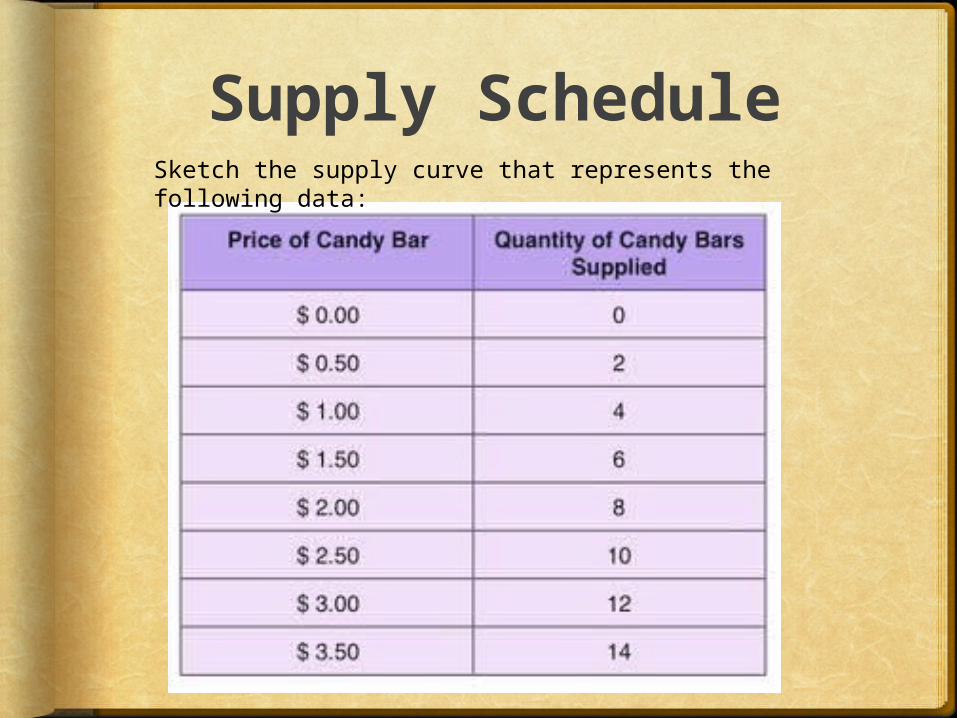
Supply ScheduleSketch the supply curve that represents the following data:

Activity
Wheat: Buyers and Sellers Game
Market Equilibrium Equilibrium = “State of Rest” for economy
Assuming “other things” (such as weather, or incomes) remain the same, does any individual buyer / seller want to change their behavior ?
When all buyers and sellers are satisfied with their respective quantities at the market price, market is balanced No pressure for change in price or quantity
The intersection of the supply and demand curves defines the unique price at which Quantity Demanded = Quantity Supplied
Equilibrium has two components The equilibrium price
The price the good sells and is bought for The equilibrium quantity
The quantity that will be bought and sold
Principles of Microeconomics, 2nd Canadian Edition Slide 1-9 Copyright © 2005 McGraw-Hill Ryerson Limited
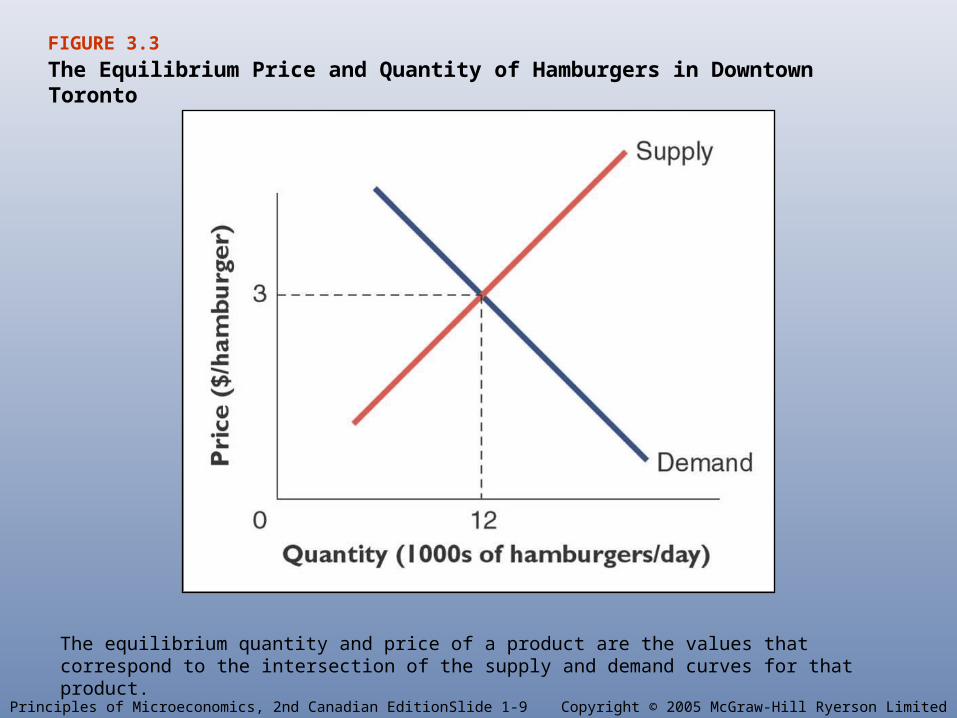
FIGURE 3.3
The Equilibrium Price and Quantity of Hamburgers in Downtown Toronto
The equilibrium quantity and price of a product are the values that correspond to the intersection of the supply and demand curves for that product.
Principles of Microeconomics, 2nd Canadian Edition Slide 1-10 Copyright © 2005 McGraw-Hill Ryerson Limited
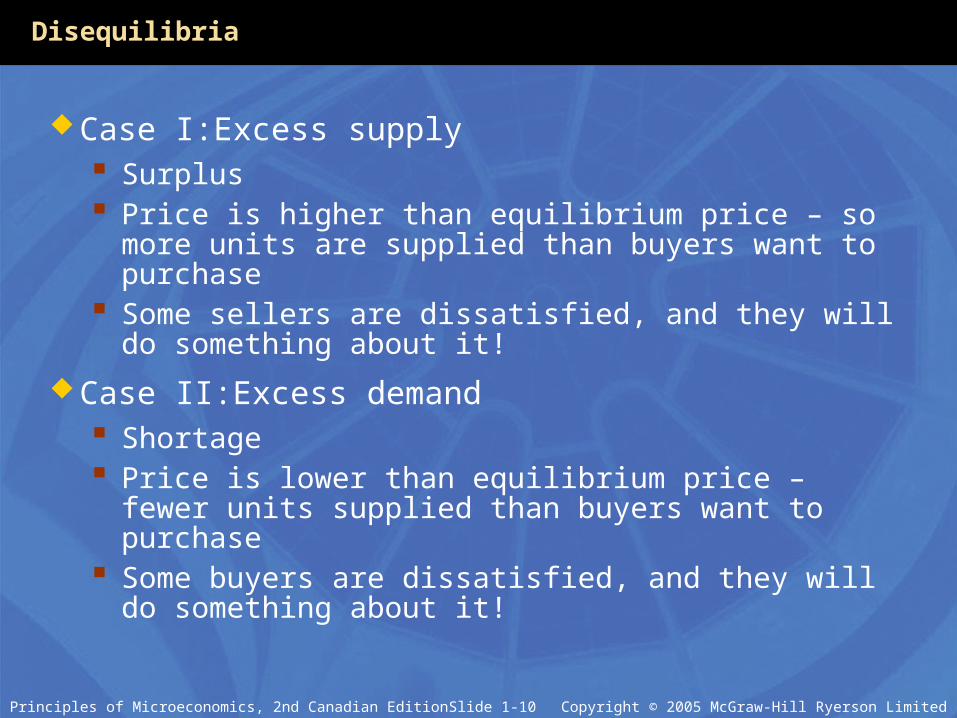
Disequilibria
Case I:Excess supply Surplus Price is higher than equilibrium price – so more units
are supplied than buyers want to purchase Some sellers are dissatisfied, and they will do
something about it!
Case II:Excess demand Shortage Price is lower than equilibrium price – fewer units
supplied than buyers want to purchase Some buyers are dissatisfied, and they will do
something about it!
Principles of Microeconomics, 2nd Canadian Edition Slide 1-11 Copyright © 2005 McGraw-Hill Ryerson Limited
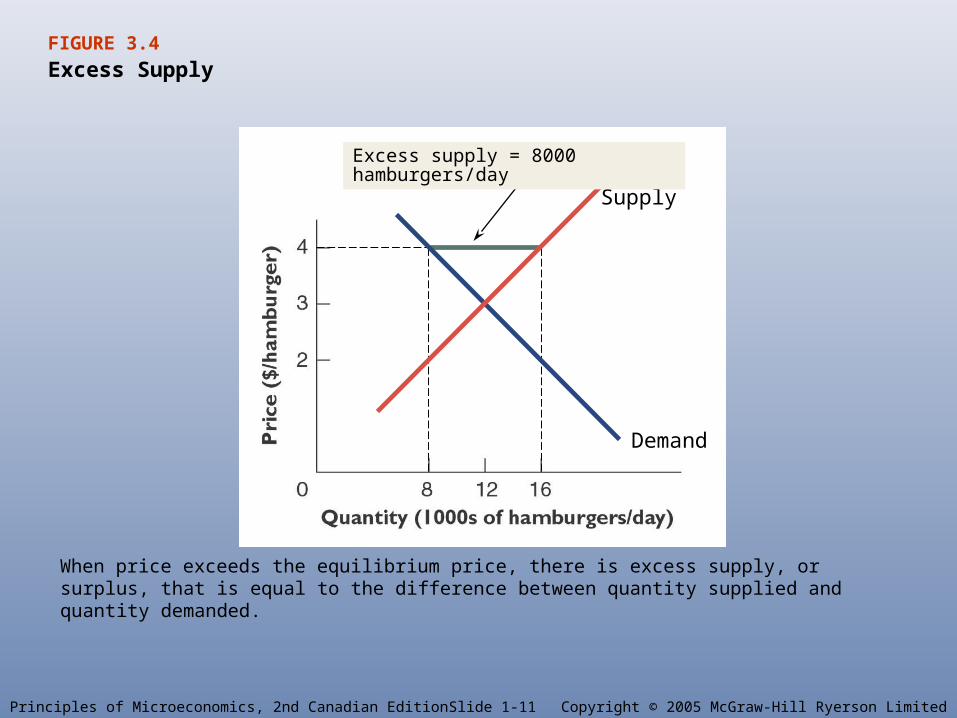
Excess Supply
When price exceeds the equilibrium price, there is excess supply, or surplus, that is equal to the difference between quantity supplied and quantity demanded.
FIGURE 3.4
Supply
Demand
Excess supply = 8000 hamburgers/day
Principles of Microeconomics, 2nd Canadian Edition Slide 1-12 Copyright © 2005 McGraw-Hill Ryerson Limited
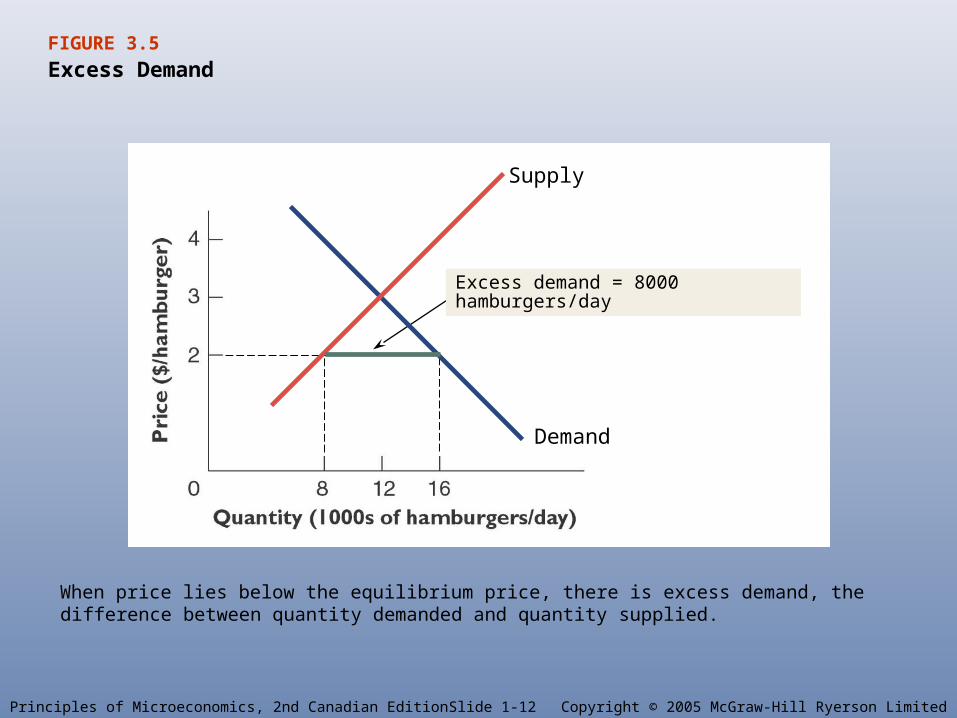
FIGURE 3.5
Excess Demand
When price lies below the equilibrium price, there is excess demand, the difference between quantity demanded and quantity supplied.
Supply
Demand
Excess demand = 8000 hamburgers/day
Return to Equilibrium
Markets have a tendency to eliminate excess supply and excess demand.
Surplus (unsold goods) leads frustrated producers, who cannot sell all
their production at the current price, to decrease the price
Shortage (not finding goods to buy) leads frustrated consumers, who are willing to
pay more than the current price, but who cannot get goods at the current price, to bid more – which increases the price
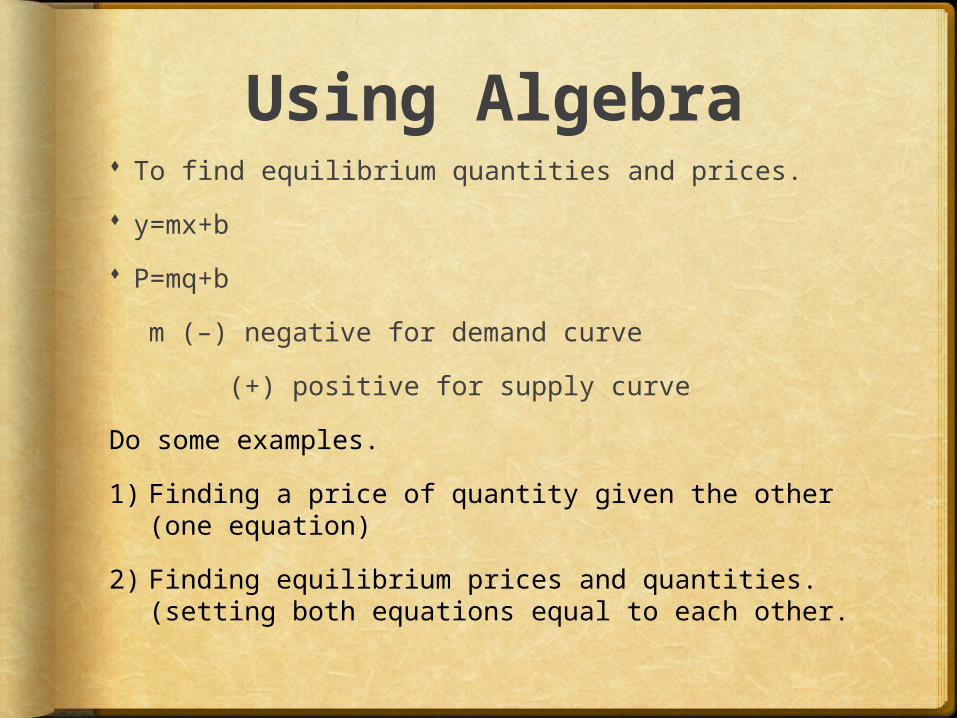
Using Algebra To find equilibrium quantities and prices.
y=mx+b
P=mq+b
m (–) negative for demand curve
(+) positive for supply curve
Do some examples.
1) Finding a price of quantity given the other (one equation)
2) Finding equilibrium prices and quantities. (setting both equations equal to each other.

Do Practice Questions!
Practice Questions.
…then an Assignment.