Embed Size (px)
DESCRIPTION
exam 3
Citation preview

1
OPRE 3333
Practice Problems for Exam 3
Chapter 5, 8 and Chapter 12
Chapter 5:
1. Which of the following data patterns best describes the scenario shown in the given time series plot?
a. Linear trend pattern b. Logarithmic trend c. Exponential trend d. Seasonal pattern Answer: D

2
2. all forecasts to two decimal places.). Compute MSE and a forecast for month 11.
Forecast Error Error^2
1 19 2 25 19 6 36
3 22 20.02 1.98 3.92
4 29 20.36 8.64 74.70
5 27 21.83 5.17 26.77
6 33 22.71 10.29 105.97
7 38 24.46 13.54 183.45
8 35 26.76 8.24 67.92
9 47 28.16 18.84 354.97
10 42 31.36 10.64 113.16
33.17
107.43
MSE = 107.43 �̂�11 = 42(0.17) + 0.83(31.36) = 33.17
Week Values
Exponential
Smoothing, a=0.17
Forecasted Value
1 19
2 25
3 22
4 29
5 27
6 33
7 38
8 35
9 47
10 42

3
3. The below time series gives the indices of Industrial Production in U.S for 10 consecutive years.
Year IP
1 79.62
2 86.54
3 88.14
4 89.23
5 93.45
6 97.4
7 99.34
8 96.98
9 100.22
10 103.56
a. What type of pattern exists in the data based on the time series plot.? b. Use the excel output and find the forecast for t = 11?
0
20
40
60
80
100
120
0 2 4 6 8 10 12
IP
Year (t)

4
Excel output:
Answer:
a. The time series plot shows a linear trend. From the above output, the regression estimates for the y-intercept and slope that minimize MSE for this time series are b0 = 80.458 and b1 = 2.36, which result in the following forecasts, errors: b. �̂�11= b0 + b1t = 80.458 + 2.36(11) = 106.438.

5
4. The following times series shows the demand for a particular product over the past 10 months.
Month Value
1 324
2 311
3 303
4 314
5 323
6 313
7 302
8 315
9 312
10 326
a. The exponential smoothing values for the time series has been computed using α = 0.2. Compute MSE
and a forecast for month 11. b. The three-month moving average forecast for the time series has been. Compute MSE and a forecast for
month 11. b. Compare the three-month moving average forecast with the exponential smoothing forecast using α = 0.2. Which appears to provide the better forecast based on MSE?
a. Smoothing constant α = 0.2
α 0.2
Month Value Forecast Forecast Error Squared Forecast Error
1 324
2 311 324.00 -13.00 169.00
3 303 321.40 -18.40 338.56
4 314 317.72 -3.72 13.84
5 323 316.98 6.02 36.29
6 313 318.18 -5.18 26.84
7 302 317.14 -15.14 229.36
8 315 314.12 0.88 0.78
9 312 314.29 -2.29 5.26
10 326 313.83 12.17 148.01
Total = 967.94
MSE = 967.94/9 = 107.55 The forecast for month 11 is �̂�11 = αy10 + (1- α) �̂�10 = 0.2(326) + (1 - 0.2)313.83 = 316.27.
b.
Month Demand Forecast Forecast
Error Squared Forecast
Error

6
1 324
2 311
3 303
4 314 312.67 1.33 1.78
5 323 309.33 13.67 186.78
6 313 313.33 -0.33 0.11
7 302 316.67 -14.67 215.11
8 315 312.67 2.33 5.44
9 312 310.00 2.00 4.00
10 326 309.67 16.33 266.78
Total 680.00
MSE= 680/7= 97.14 The forecast for month 11 is �̂�11 = (315 + 312 + 326)/3= 317.66
c. Comparing the MSE for three-month moving average (calculated in the previous problem) and the MSE for exponential smoothing, the three-month moving average provides a better forecast as it has a smaller MSE.
7
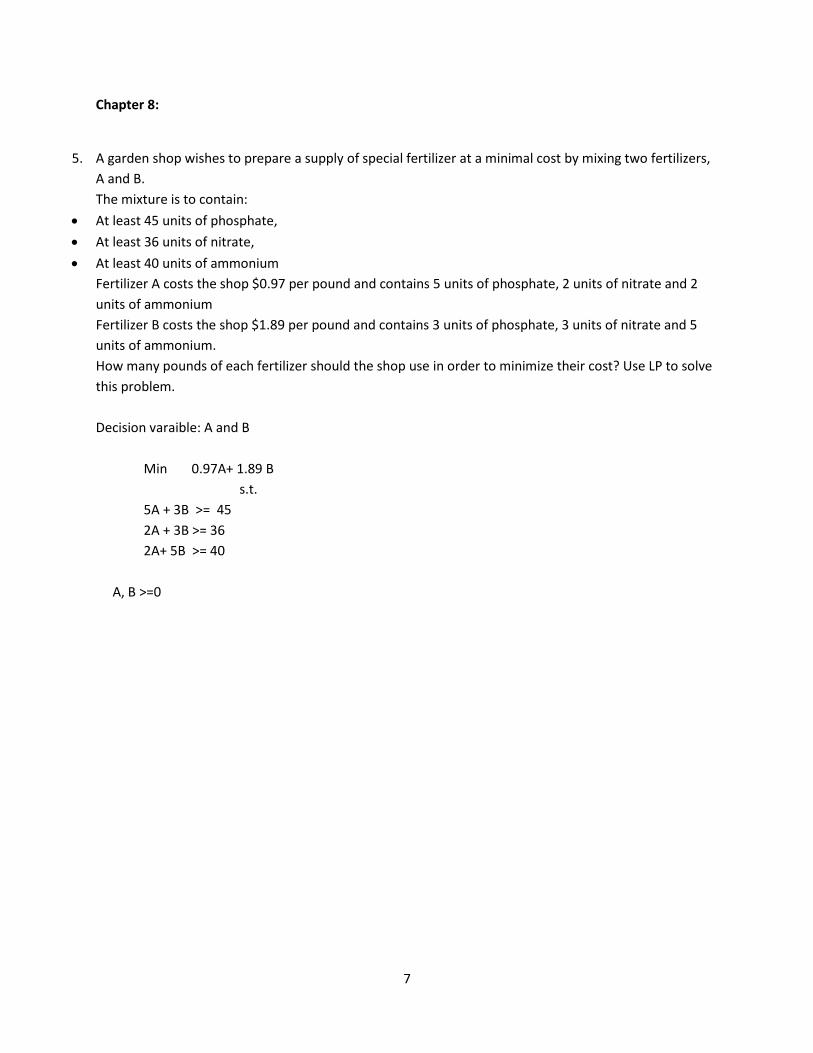
Chapter 8:
5. A garden shop wishes to prepare a supply of special fertilizer at a minimal cost by mixing two fertilizers,
A and B.
The mixture is to contain:
At least 45 units of phosphate,
At least 36 units of nitrate,
At least 40 units of ammonium
Fertilizer A costs the shop $0.97 per pound and contains 5 units of phosphate, 2 units of nitrate and 2
units of ammonium
Fertilizer B costs the shop $1.89 per pound and contains 3 units of phosphate, 3 units of nitrate and 5
units of ammonium.
How many pounds of each fertilizer should the shop use in order to minimize their cost? Use LP to solve
this problem.
Decision varaible: A and B
Min 0.97A+ 1.89 B
s.t.
5A + 3B >= 45
2A + 3B >= 36
2A+ 5B >= 40
A, B >=0

8
Extreme points:
1. (0, 15) cost = 0.97(0)+ 1.89(15)= 28.15
2. (3,10) cost = 0.97(3)+ 1.89(10)= 21.8
3. (15, 2) cost = 0.97(15)+ 1.89(2)= 18.33 : OPTIMAL SOLUTION
4. (20,0) cost = 0.97(20)+ 1.89(0)= 19.4

9
6. Hire-a-Car System rents three types of cars at two different locations. The profit made per day
for each car type and company at the two locations is listed below:
Car Type
Company Type 1 Type 2 Type 3
A $25 $40 $10
B $30 $35 $45
The management forecasts the demand per day by car type. The demand forecast for a particular day is
125 rentals for Type 1 cars, 55 rentals for Type 2 cars, and 40 rentals for Type 3 cars. The company has
100 cars in location A and 120 cars in location B. Formulate a linear programming model to maximize
profit to determine how many reservations to accept for each type of car.
Answer:
Let A1 = number of reservations made for Type 1 car of Company A
A2 = number of reservations made for Type 2 car of Company A
A3 = number of reservations made for Type 3 car of Company A
B1 = number of reservations made for Type 1 car of Company B
B2 = number of reservations made for Type 2 car of Company B
B3 = number of reservations made for Type 3 car of Company B
Max 25A1 + 40A2 + 10A3 + 30B1 + 35B2 + 45B3
s.t.
A1 + A2 + A3 ≤ 100
B1 + B2 + B3 ≤ 120
A1 + B1 ≤ 125
A2 + B2 ≤ 55
A3 + B3 ≤ 40
A1, A2, …, B3 ≥ 0

10
7 .A manager of a quality testing team wanted to test different lots of products using three resources,
R1, R2, and R3. Each lot can be tested for quality using any one of the three procedures, P1, P2, or P3.
The product once tested will be sent for packaging. The profit contribution per lot for each of these
procedures varies and they are $4, $5, and $8, respectively. Also, resource R1 requires 2 hours, 3 hours,
and 4 hours to test a lot using the procedure P1, P2, and P3, respectively. Resource R2 requires 3 hours,
2 hours, and 3 hours using the procedure P1, P2, and P3, respectively. Lastly, resource R3 requires 2
hours, 3 hours, and 4 hours using the procedure P1, P2, and P3, respectively. The available times for
these three resources are 80 hours, 90 hours, and 65 hours, respectively. Formulate and solve a linear
program and solve for the optimal solution for the above scenario by maximizing the profit.
a. What will be the change in total profit, if machine M3 is given an extra hour of production time? Answer: Let x11: number of lots tested by R1 using procedure P1
x12: number of lots tested by R1 using procedure P2
.
.
.
x33: number of lots tested by R3 using procedure P3
Max 4(x11 + x21 + x31) + 5(x12 + x22 + x32) + 8(x13 + x23 + x33)
s.t.
2x11 + 3x12 + 4x13 ≤ 80
3x21 + 2x22 + 3x23 ≤ 90
2x31 + 3x32 + 4x33 ≤ 65
x11, x12, x13, …, x33 ≥ 0

11
8. Northwest California Ventures Ltd. has decided to provide capital in five market areas
for the start-ups. The investment consultant for the venture capital company has
projected an annual rate of return based on the market risk, the product, and the size of
the market.
Market Area
Annual Rate of Return on Capital (%)
Electronics 12
Software 18
Logistics 15
Education 12
Retail 17
The maximum capital provided will be $5 million.
The consultant has imposed conditions on allotment of capital based on the risk involved in the market.
• The capital provided to retail should be at most 40 percent of the total capital.
• The capital for education should be 26 percent of the total of other four markets (Electronics, Software,
Logistics, and Retail)
• Logistics should be at least 15 percent of the total capital.
• The capital allocated for Software plus Logistics should be no more than the capital allotted for
Electronics.
• The capital allocated for Logistics plus Education should not be greater than that allocated to Retail.
Calculate the expected annual rate of return based on the allocation of capital to each market area to
maximize the return on capital provided. Also, show the allocation of capital for each market area.
Let x1 = investment on Electronics
x2 = investment on Software
x3 = investment on Logistics
x4 = investment on Education
x5 = investment on Retail
Max 0.12x1 + 0.18x2 + 0.15x3 + 0.12x4 + 0.17x5
s.t.
x5 ≤ 0.4(5000000)
x4 = 0.26 (x1 + x2 + x3 + x5)
x3 ≥ 0.15(5000000)
x2 + x3 ≤ x1
x3 + x4 ≤ x5
x1+ x2 + x3 + x4+ x5 = 5000000
x1, x2, x3, x4, and x5 ≥ 0

12
9. A soft drink manufacturing company has 3 factories set up one in each of the
three cities - Orland, Tampa, and Port St. Lucie and it supplies the produced soft
drink bottles to 3 warehouses located in the city of Miami. The associated per-unit
transportation cost between the factories and the warehouses is provided in the
table below:
Transportation Costs of Factories ($)
Factories/Warehouses W1 W2 W3
Orlando 7 4 5
Tampa 7 6 4
Port St. Lucie 5 5 6
The factory at Orlando has a capacity of 14,000 units.
The factory at Tampa has a capacity of 25,000 units.
The factory at Port St. Lucie has a capacity of 23,000 units.
The requirements of the warehouses are:
Warehouse
Requirement
(Bottles)
W1 18,000
W2 19,000
W3 22,000
Develop a linear programming model to minimize the cost for the problem.
Answer:
Let x11: number of bottles shipped from Orlando to W1
x12: number of bottles shipped from Orlando to W2
.
.
.
x33: number of bottles shipped from Port St. Lucie to W3
Min 7x11 + 4x12 + 5x13 + 7x21 + 6x22 + 4x23 + 5x31 + 5x32 + 6x33
s.t.
x11 + x12 + x13 ≤ 14000
x21 + x22 + x23 ≤ 25000
x31 + x32 + x33 ≤ 23000
x11 + x21 + x31 = 18000

13
x12 + x22 + x32 = 19000
x13 + x23 + x33 = 22000
x11, x12, x13, …, x33 ≥ 0

14
10. Robin Tires, Inc. makes two types of tires, for SUV’s and Hatchbacks. The firm has 500 hours of
production time, 250 hours of packaging, and 150 hours available for shipping. The production
time required per tire type is given in the following table:
Production Hours Type Production Packaging Shipping Profit/Tire
SUV tires 2 1.5 1 $22
Hatchbacks
tires 1.5 1 0.5 $12
Assuming that the company is interested in maximizing the total profit contribution, answer the
following questions based on given the linear programming model and sensitivity reports below:
a. Optimal Profit:
b. # of tires of SUV:
c. # of tires of Hatchbacks:
d. If 10 more hours is available for packaging, what is the change in profit?
e. What is the change in profit if two more hours is available for shipping?
f. If one more hour is available for production, what is the change in profit?
S = number of SUV tires manufactured
H = number of Hatchbacks tires manufactured
Max 22S + 12H
s.t.
2S + 1.5H ≤ 500 – Production
1.5S + H ≤ 250 – Packaging
S + 0.5H ≤ 150 – Shipping
The Sensitivity Report:

15
Answer:
a. 22(100)+ 12(100)= 2200+1200= 3,400
b. 100
c. 100
d. The constraint is: 1.5S + H ≤ 250. Its shadow price is 4. If 10 additional hour is available for
packaging, that is if the constraint is changed from 1.5S + H ≤ 250 to 1.5S + H ≤ 260, the optimal
objective function value will increase by 10* $4= 40; that is, the new optimal solution will have
objective function value or the profit equal to $3400 + $40 = $3440.
e. The constraint is: S + 0.5H ≤ 150. Its shadow price is 16. If 2 additional hours is available for
shipping, that is if the constraint is changed from S + 0.5H ≤ 150 to S + 0.5H ≤ 152, the optimal
objective function value will increase by (2* $16) = 32; that is, the new optimal solution will
have objective function value equal to $3400 + $32 = $3432.
f. The constraint is: 2S + 1.5H ≤ 500. Its shadow price is 0. If an additional hour is available for
production, that is if the constraint is changed from 2S + 1.5H ≤ 500 to 2S + 1.5H ≤ 501, the
optimal objective function value will not change.

16
11. Use the payoff table given below for a maximization problem to answer questions 3.1 & 3.2.
Payoff Table
Decision
Alternative
State of nature
1
State of nature
2
D1 5 7
D2 –4 1
D3 1 –3
D4 10 2
D5 6 4
3. 1 which is the recommended decision alternative using the optimistic approach?
a. D1
b. D4
c. D2
d. D5
Answer: B
Feedback: For a maximization problem, the optimistic approach advocates choosing the decision
alternative with the maximum payoff, which is given by the decision alternative D4.
a. Which is the recommended decision alternative using the conservative approach?
a. D1
b. D5
c. D2
d. D3
Answer: A
Feedback: The conservative approach evaluates each decision alternative in terms of the worst
payoff that can occur. The decision alternative recommended is the one that provides the best of
the worst possible payoffs. For this maximization problem, the conservative approach
recommends decision alternative D1 that maximizes the minimum payoff.

17
12. The following payoff table shows the profit for a decision problem with three states of nature and
three decision alternatives:
Decision
Alternative
State of Nature
s1 s2 s3
d1 71 32 41
d2 23 46 50
d3 81 29 32
a. Suppose P(s1) = 0.1, P(S2) = 0.3, and P(S3) = 0.6. What is the best decision using the expected
value approach?
Answer:
a. EV(d1) = 0.1(71) + 0.3(32) + 0.6(41) = 41.3
EV(d2) = 0.1(23) + 0.3(46) + 0.6(50) = 46.1
EV(d3) = 0.1(81) + 0.3(29) + 0.6(32) = 36
Therefore, the best decision alternative is d2.

18
13. Greentrop Pharmaceutical Products are the world leader in the area of sleep aids. Its major
product is “Dozealot”. The Research-and-Development Division has defined two alternatives to
improve the quality of the product, which are simple reformulations of the product to minimize
the side effects and to improve the product efficacy. To conduct an analysis, management has
decided to consider the possible demands for the drug under each alternative. The following
payoff table shows the projected profit in millions of dollars.
Decision
Alternatives
Demand
Low Medium High
d1 $500 $350 $525
d2 $875 $300 $765
a. Construct a decision tree for this problem.
b. If the decision maker knows nothing about the probabilities of three states of nature, what is the
recommended decision using the optimistic, conservative, and minimax regret approaches?
Answer:
a.
b.
Decision
Alternatives
Maximum
Profit
Minimum
Profit
d1 $525 $350
d2 $875 $300
Optimistic approach: select D2 which has the largest maximum profit.

19
Conservative approach: select D1 which has the largest minimum profit.
Regret or opportunity loss table:
Decision
Alternatives
Demand
Low Medium High
Maximum
Regret
d1 $375 0 $240 $375
d2 0 $50 0 $50
Minimax Regret: The decision alternative is D2 with the minimum of the maximum regret
values $50.