Embed Size (px)
Citation preview
INSTRUCTIONS
• Use black ink. You may use an HB pencil for graphs and diagrams.
• Complete the boxes above with your name, centre number and candidate number.
• Answer all the questions.
• Write your answer to each question in the space provided. If additional space is
required, use the lined page(s) at the end of this booklet. The question number(s) must
be clearly shown.
• Do not write in the barcodes.
INFORMATION
• The total mark for this paper is 100.
• The marks for each question are shown in brackets [ ].
• Quality of extended responses will be assessed in questions marked with an
asterisk (*).
• This document consists of 32 pages.
Turn over© OCR 2016 Practice paper
DC (SC/FC) 142873/2
Last name
First name
Candidate
number
Centre
number
Oxford Cambridge and RSA
A Level Physics AH556/02 Exploring physics
Practice paper – Set 2Time allowed: 2 hours 15 minutes
You must have:
• the Data, Formulae and Relationship Booklet
You may use:
• a scientific or graphical calculator
• a ruler (cm/mm)
*2016*
OCR is an exempt Charity

2
H556/02© OCR 2016 Practice paper
SECTION A
You should spend a maximum of 30 minutes on this section.
Write your answer to each question in the box provided.
Answer all the questions.
1 An electron, a proton, a neutron and an alpha-particle are travelling in a vacuum at the same
speed.
Which of these particles has the shortest de Broglie wavelength?
A electron
B proton
C neutron
D alpha-particle
Your answer
[1]
2 In which region of the electromagnetic spectrum is radiation of frequency 300 MHz?
A radio wave
B microwave
C visible
D X-ray
Your answer
[1]
3 A small heater is connected to a power supply. The power supply is switched on for 100 s. The
current in the heater is 3.0 A and it dissipates 1200 J of thermal energy.
What is the potential difference across the heater?
A 0.25 V
B 4.0 V
C 12 V
D 300 V
Your answer
[1]

3
H556/02 Turn over© OCR 2016 Practice paper
4 A resistance wire is connected to a cell.
The length L of the wire is changed by pulling at the ends of the wire. The volume of the wire
remains the same.
What is the correct relationship between the resistance R of the wire and its length L?
A R = constant
B R ∝ L
C R ∝ L2
D R ∝ L−1
Your answer
[1]
5 A variable resistor is connected across the terminals of a power supply of constant e.m.f. and
internal resistance r.
V
A
power supply
+ – r
The resistance of the variable resistor is changed from zero to its maximum value.
Which of the following statements is/are correct?
1 The current in the circuit decreases.
2 The p.d. across the internal resistance decreases.
3 A graph plotted of terminal p.d. against current has a negative gradient.
A Only 1
B Only 1 and 2
C Only 1 and 3
D 1, 2 and 3
Your answer
[1]

4
H556/02© OCR 2016 Practice paper
6 Two radio wave transmitters T1 and T2 emit radio waves of wavelength 20 m. The separation
between the transmitters is 500 m. The waves are in phase at the transmitters and have the same
amplitude.
A car travels at a constant speed of 10 m s−1 in a straight line in a direction parallel to the line
joining T1 and T2. The perpendicular distance of the car from the line joining the transmitters is
4.0 km.
T1
T2
500 m
4.0 km
direction of
travel of car
What is the time between two successive maximum signals detected at the car?
A 6.3 × 10⁻⁴ s
B 2.0 s
C 16 s
D 400 s
Your answer
[1]
5
H556/02 Turn over© OCR 2016 Practice paper
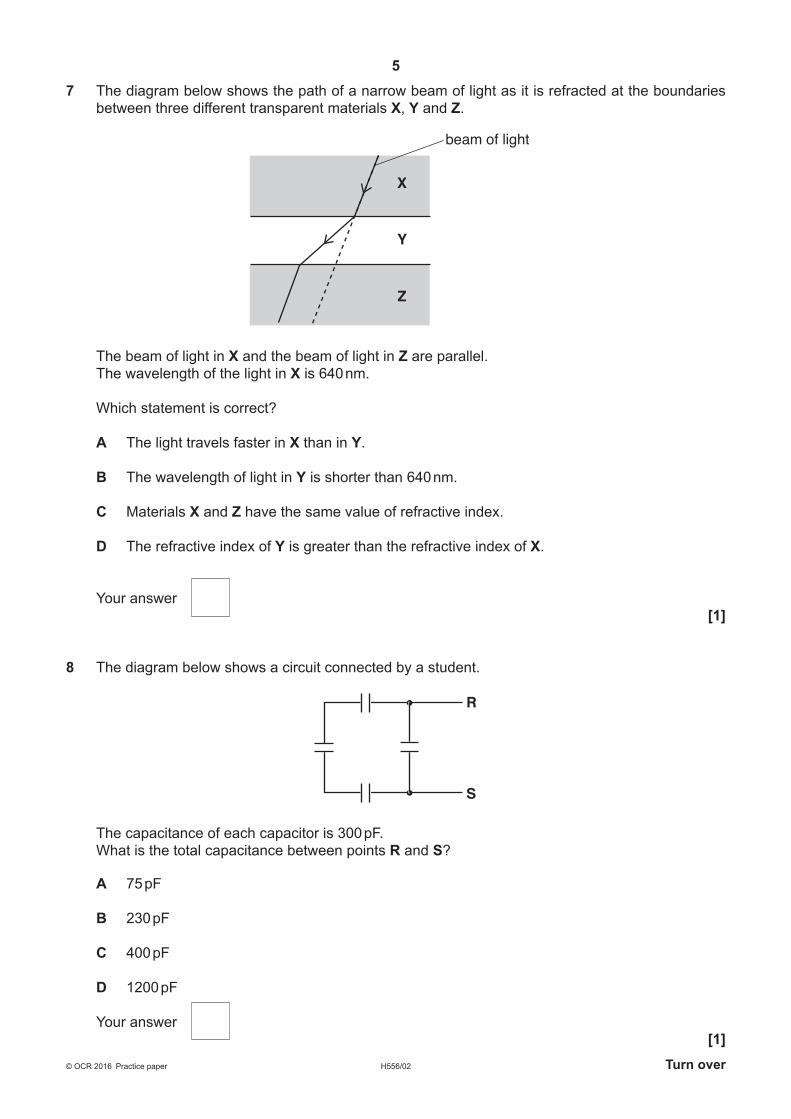
7 The diagram below shows the path of a narrow beam of light as it is refracted at the boundaries
between three different transparent materials X, Y and Z.
Y
X
Z
beam of light
The beam of light in X and the beam of light in Z are parallel.
The wavelength of the light in X is 640 nm.
Which statement is correct?
A The light travels faster in X than in Y.
B The wavelength of light in Y is shorter than 640 nm.
C Materials X and Z have the same value of refractive index.
D The refractive index of Y is greater than the refractive index of X.
Your answer
[1]
8 The diagram below shows a circuit connected by a student.
R
S
The capacitance of each capacitor is 300 pF.
What is the total capacitance between points R and S?
A 75 pF
B 230 pF
C 400 pF
D 1200 pF
Your answer
[1]

6
H556/02© OCR 2016 Practice paper
9 A current-carrying solenoid has N turns and radius r. The magnetic flux density within the core of
the solenoid is B.
What is the magnetic flux linkage for this solenoid?
A NB
B πr 2B
C 2πrBN
D πr 2BN
Your answer
[1]
10 The diagram below shows a current-carrying wire coming out from the plane of the paper. The
current in the wire produces a magnetic field in an anticlockwise direction around the wire.
B
D
A C
direction of
Earth’smagnetic
field
direction of magnetic
field due to current
current-carrying
wire
The direction of the Earth’s magnetic field is also shown.
The Earth’s magnetic field interacts with the magnetic field of the current-carrying wire.
At which point A, B, C or D is the resultant magnetic field strength a minimum?
Your answer
[1]
7
H556/02 Turn over© OCR 2016 Practice paper
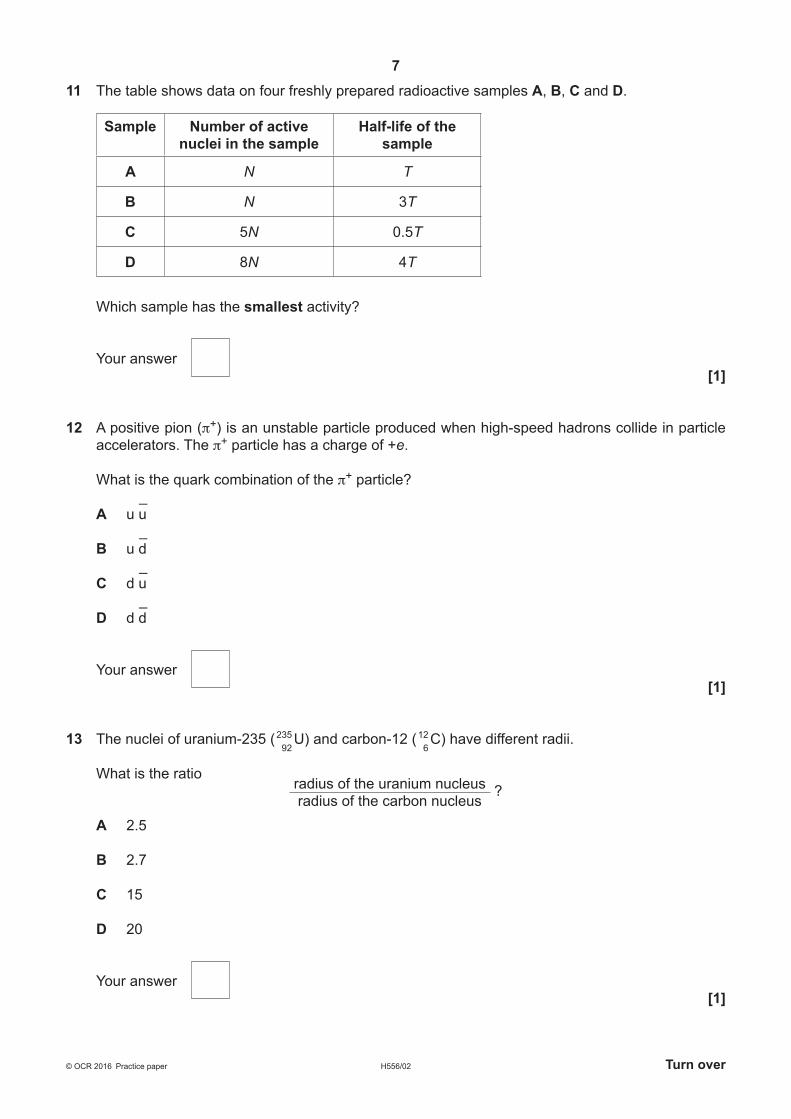
11 The table shows data on four freshly prepared radioactive samples A, B, C and D.
Sample Number of active
nuclei in the sample
Half-life of the
sample
A N T
B N 3T
C 5N 0.5T
D 8N 4T
Which sample has the smallest activity?
Your answer
[1]
12 A positive pion (π+) is an unstable particle produced when high-speed hadrons collide in particle
accelerators. The π+ particle has a charge of +e.
What is the quark combination of the π+ particle?
_
A u u
_
B u d
_
C d u
_
D d d
Your answer
[1]
13 The nuclei of uranium-235 (235
92 U) and carbon-12 (12
6 C) have different radii.
What is the ratioradius of the uranium nucleus
radius of the carbon nucleus ?
A 2.5
B 2.7
C 15
D 20
Your answer
[1]

8
H556/02© OCR 2016 Practice paper
14 Ultrasound is reflected at a boundary between two materials.
Which property of the materials governs the intensity of the ultrasound reflected at the boundary?
A density
B decay constant
C acoustic impedance
D attenuation coefficient
Your answer
[1]
15 An electron at point P experiences an electric force of magnitude 1.8 μN due to the positive
nucleus.
positive
nucleus
+P
Q
What is the magnitude of the force experienced by the same electron when it is at point Q?
A 0.28 μN
B 0.55 μN
C 1.0 μN
D 1.8 μN
Your answer
[1]

9
H556/02 Turn over© OCR 2016 Practice paper
BLANK PAGE
Question 16 begins on page 10
10
H556/02© OCR 2016 Practice paper
SECTION B
Answer all the questions.
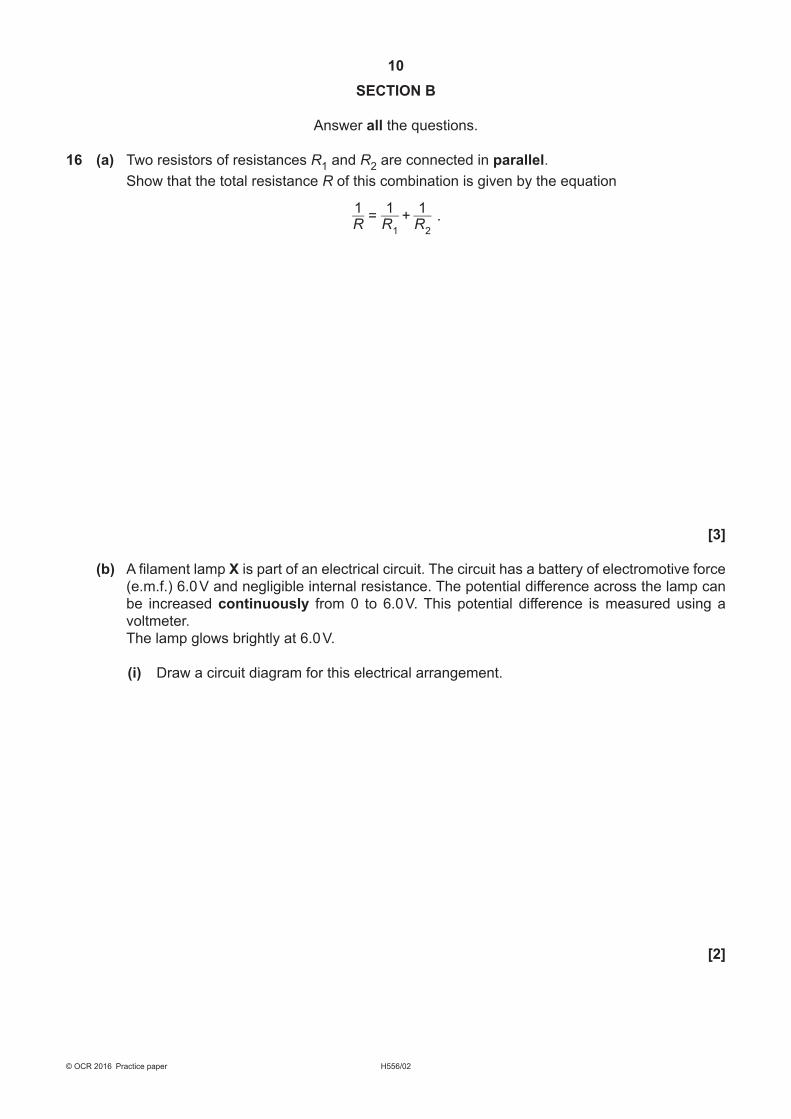
16 (a) Two resistors of resistances R1 and R2 are connected in parallel.
Show that the total resistance R of this combination is given by the equation
1 1 1R R R
1 2
= + .
[3]
(b) A filament lamp X is part of an electrical circuit. The circuit has a battery of electromotive force
(e.m.f.) 6.0 V and negligible internal resistance. The potential difference across the lamp can
be increased continuously from 0 to 6.0 V. This potential difference is measured using a
voltmeter.
The lamp glows brightly at 6.0 V.
(i) Draw a circuit diagram for this electrical arrangement.
[2]

11
H556/02 Turn over© OCR 2016 Practice paper
(ii) Describe and explain the variation of the resistance of this lamp as the potential difference
across it is changed from 0 to 6.0 V.
...........................................................................................................................................
...........................................................................................................................................
...........................................................................................................................................
...........................................................................................................................................
...........................................................................................................................................
...........................................................................................................................................
...................................................................................................................................... [4]
(iii) The filament lamp X is now connected in a different circuit as shown in Fig. 16.
power
supply
X Y+
–
Fig. 16
The power dissipated in X is three times more than the power dissipated in the filament
lamp Y. The filament wire of lamp X has a diameter half that of lamp Y.
The filament wires of X and Y are made of the same material and are at the same
temperature.
Calculate the ratio
mean drift velocity of charge carriers in lamp X
mean drift velocity of charge carriers in lamp Y .
ratio = ......................................................... [3]

12
H556/02© OCR 2016 Practice paper
17 Fig. 17 shows a potential divider circuit consisting of a fixed resistor of resistance R and a negative
temperature coefficient (NTC) thermistor.
R V
6.0 V
Fig. 17
The battery has electromotive force (e.m.f.) of 6.0 V and negligible internal resistance.
The thermistor is at room temperature. The resistance of the thermistor is 0.25 R.
(a) Calculate the potential difference V across the resistor.
V = ...................................................... V [2]
(b) A voltmeter whose resistance is 5 R is connected across the fixed resistor.
The voltmeter reading is less than your answer in (a).
Explain why the voltmeter reading is less and suggest an alternative measuring device.
...................................................................................................................................................
...................................................................................................................................................
...................................................................................................................................................
.............................................................................................................................................. [2]

13
H556/02 Turn over© OCR 2016 Practice paper
(c) The circuit shown in Fig. 17 is now placed in a cold fridge. The temperature of the thermistor
slowly decreases to a constant value.
Describe and explain, in terms of current in the circuit, the variation of the potential difference
V across the fixed resistor with time.
...................................................................................................................................................
...................................................................................................................................................
...................................................................................................................................................
...................................................................................................................................................
...................................................................................................................................................
...................................................................................................................................................
...................................................................................................................................................
...................................................................................................................................................
...................................................................................................................................................
.............................................................................................................................................. [4]

14
H556/02© OCR 2016 Practice paper
BLANK PAGE
PLEASE DO NOT WRITE ON THIS PAGE

15
H556/02 Turn over© OCR 2016 Practice paper
18 (a) In Fig. 18.1 the solid line represents the displacement s against distance x graph for a
progressive transverse wave on a stretched string at time t = 0. The dotted line shows the
graph for the same wave at a later time t = 2.5 ms.
–6.0
–4.0
–2.0
0
2.0
4.0s / cm
6.0
10 20 30 40 50 60 x / cm
Fig. 18.1
Determine the frequency f of this wave.
f = .................................................... Hz [3]

16
H556/02© OCR 2016 Practice paper
*(b) Fig. 18.2 shows an arrangement used to investigate stationary sound waves in a tube closed
at one end.
tubeloudspeaker
to signal
generatormicrophone
closed end
of tube
to oscilloscope
small hole for
microphone wires
Fig. 18.2
A loudspeaker is placed at the open end of the tube. The loudspeaker emits sound of constant
frequency.
A small microphone is placed inside the tube. The microphone is connected to an oscilloscope.
The microphone is slowly moved from the open end of the tube towards its closed end. The
signal detected by the microphone shows regions of maximum and minimum intensity of
sound. The distance between adjacent positions of maximum signal is 0.26 m.
Fig. 18.3 shows the signal displayed on the oscilloscope when the output signal from the
microphone is maximum. The time-base on the oscilloscope is set at 0.50 ms div−1.
0.50 ms
Fig. 18.3

17
H556/02 Turn over© OCR 2016 Practice paper
Explain the presence of the regions of maximum and minimum intensities of sound within the
tube and determine the speed of sound.
...................................................................................................................................................
...................................................................................................................................................
...................................................................................................................................................
...................................................................................................................................................
...................................................................................................................................................
...................................................................................................................................................
...................................................................................................................................................
...................................................................................................................................................
...................................................................................................................................................
...................................................................................................................................................
...................................................................................................................................................
...................................................................................................................................................
...................................................................................................................................................
...................................................................................................................................................
...................................................................................................................................................
...................................................................................................................................................
...................................................................................................................................................
...................................................................................................................................................
...................................................................................................................................................
...................................................................................................................................................
...................................................................................................................................................
...................................................................................................................................................
...................................................................................................................................................
...................................................................................................................................................
...................................................................................................................................................
...................................................................................................................................................
.............................................................................................................................................. [6]
18
H556/02© OCR 2016 Practice paper
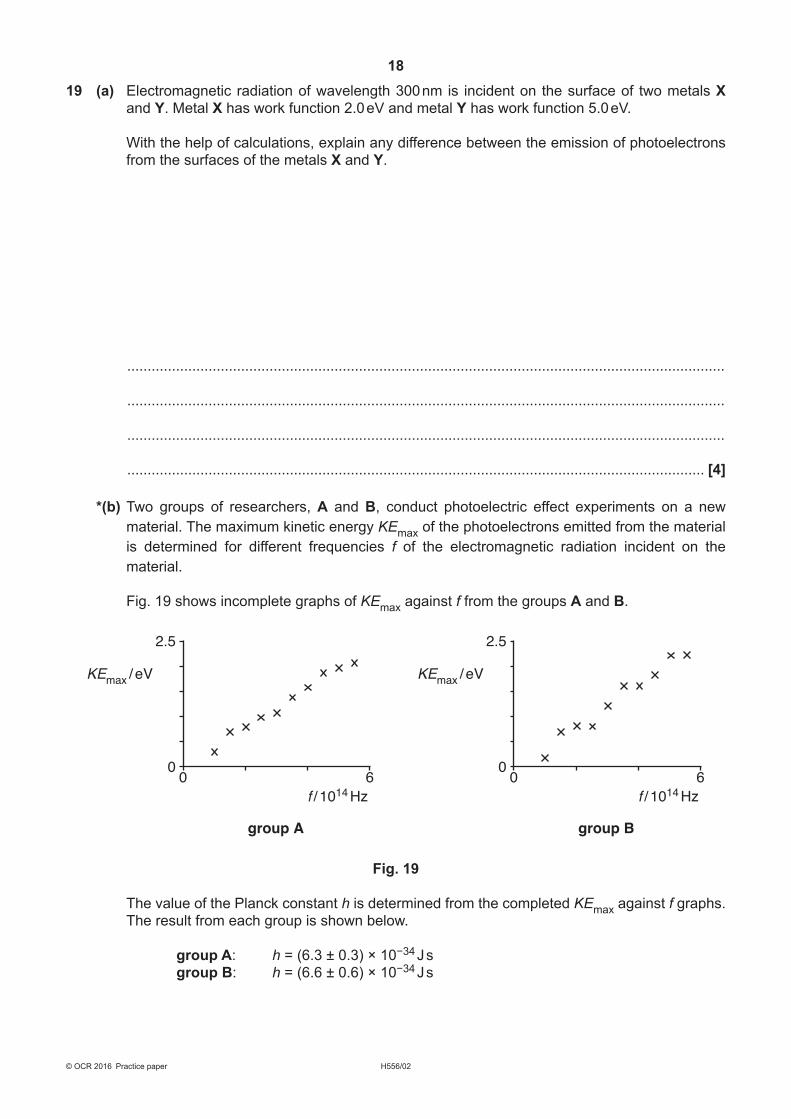
19 (a) Electromagnetic radiation of wavelength 300 nm is incident on the surface of two metals X
and Y. Metal X has work function 2.0 eV and metal Y has work function 5.0 eV.
With the help of calculations, explain any difference between the emission of photoelectrons
from the surfaces of the metals X and Y.
...................................................................................................................................................
...................................................................................................................................................
...................................................................................................................................................
.............................................................................................................................................. [4]
*(b) Two groups of researchers, A and B, conduct photoelectric effect experiments on a new
material. The maximum kinetic energy KEmax of the photoelectrons emitted from the material
is determined for different frequencies f of the electromagnetic radiation incident on the
material.
Fig. 19 shows incomplete graphs of KEmax against f from the groups A and B.
0
group A
0
2.5
6
f / 1014 Hz
KEmax
/ eV
0
group B
0
2.5
6
f / 1014 Hz
KEmax
/ eV
Fig. 19
The value of the Planck constant h is determined from the completed KEmax against f graphs.
The result from each group is shown below.
group A: h = (6.3 ± 0.3) × 10−34 J s
group B: h = (6.6 ± 0.6) × 10−34 J s

19
H556/02 Turn over© OCR 2016 Practice paper
Explain how a graph of KEmax against f can be used to determine h. Discuss the accuracy
and precision of the results from each group.
...................................................................................................................................................
...................................................................................................................................................
...................................................................................................................................................
...................................................................................................................................................
...................................................................................................................................................
...................................................................................................................................................
...................................................................................................................................................
...................................................................................................................................................
...................................................................................................................................................
...................................................................................................................................................
...................................................................................................................................................
...................................................................................................................................................
...................................................................................................................................................
...................................................................................................................................................
...................................................................................................................................................
...................................................................................................................................................
...................................................................................................................................................
...................................................................................................................................................
...................................................................................................................................................
...................................................................................................................................................
...................................................................................................................................................
...................................................................................................................................................
...................................................................................................................................................
...................................................................................................................................................
...................................................................................................................................................
...................................................................................................................................................
.............................................................................................................................................. [6]

20
H556/02© OCR 2016 Practice paper
BLANK PAGE
PLEASE DO NOT WRITE ON THIS PAGE

21
H556/02 Turn over© OCR 2016 Practice paper
20 (a) Fig. 20.1 shows a capacitor connected to a power supply.
+
–power supply
parallel metal
plates
Fig. 20.1
The capacitor consists of two parallel metal plates separated by air.
The switch is closed to charge the capacitor.
The switch is then opened and the separation between the charged plates is doubled.
State and explain what happens to the energy stored by the capacitor.
...................................................................................................................................................
...................................................................................................................................................
...................................................................................................................................................
...................................................................................................................................................
.............................................................................................................................................. [3]
(b) A student is carrying out an experiment in the laboratory to determine the capacitance C of a
capacitor. Fig. 20.2 shows the circuit used by the student.
VR
YX
S
C
Fig. 20.2
The switch S is first connected to X to charge the capacitor. The switch is then moved to Y
at time t = 0. The time T taken for the potential difference V across the capacitor to halve is
determined for different values of resistance R.
22
H556/02© OCR 2016 Practice paper
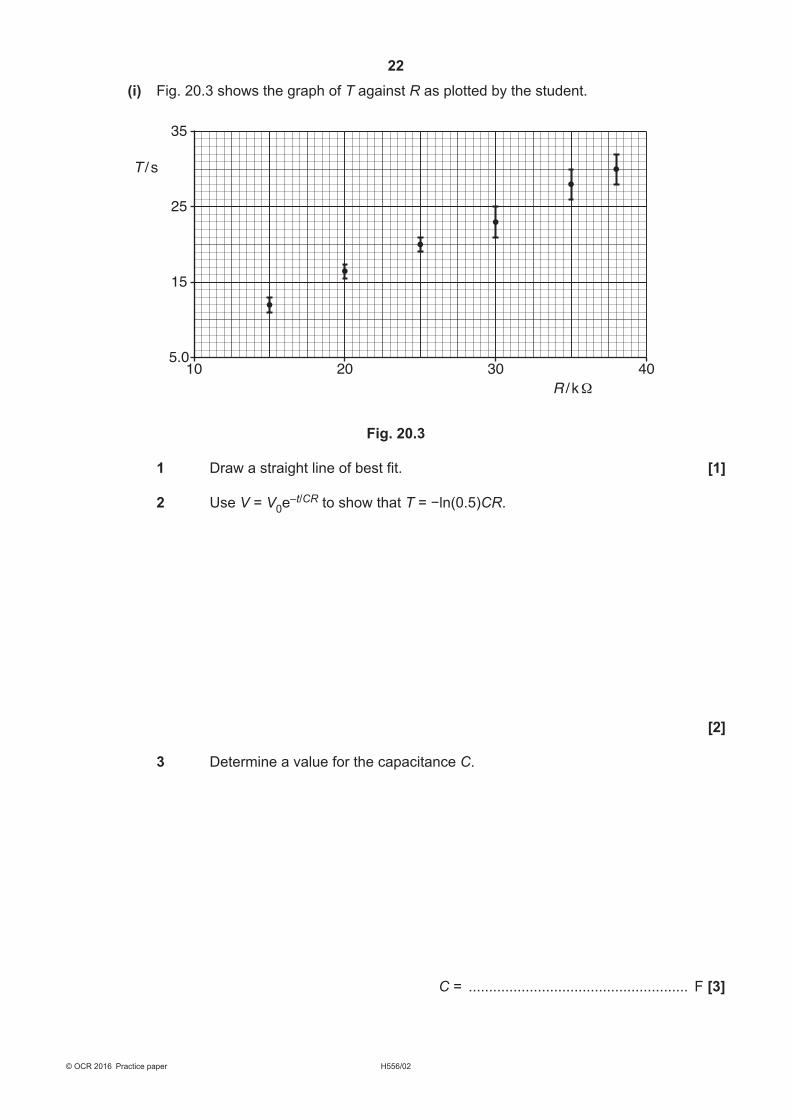
(i) Fig. 20.3 shows the graph of T against R as plotted by the student.
105.0
15
25
T / s
35
20 30
R / kΩ40
Fig. 20.3
1 Draw a straight line of best fit. [1]
2 Use V = V0e–t/CR to show that T = −ln(0.5)CR.
[2]
3 Determine a value for the capacitance C.
C = ...................................................... F [3]

23
H556/02 Turn over© OCR 2016 Practice paper
(ii) Describe, without doing any calculations, how you can use Fig. 20.3 to determine the
percentage uncertainty in C.
...........................................................................................................................................
...........................................................................................................................................
...........................................................................................................................................
...................................................................................................................................... [2]
Question 21 begins on page 24

24
H556/02© OCR 2016 Practice paper
21 (a) Fig. 21.1 shows two oppositely charged ions to the left of a point X.
+ – X
Fig. 21.1
The separation between the centres of the ions is 3.0 × 10⁻¹⁰ m. Each ion has charge of
magnitude 1.6 × 10⁻¹⁹ C.
(i) Explain why the direction of the resultant electric field strength at point X is to the left.
...........................................................................................................................................
...........................................................................................................................................
...........................................................................................................................................
...................................................................................................................................... [2]
(ii) Calculate the minimum energy in eV required to completely separate the ions.
energy = .................................................... eV [3]
25
H556/02 Turn over© OCR 2016 Practice paper
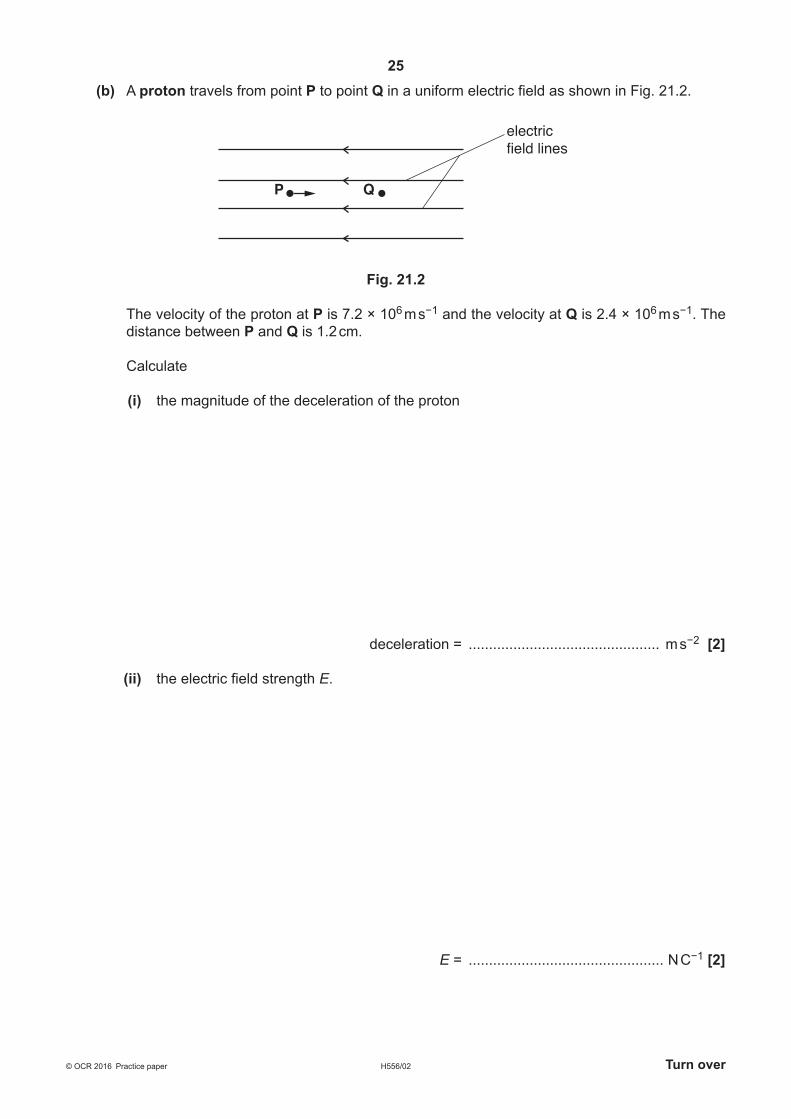
(b) A proton travels from point P to point Q in a uniform electric field as shown in Fig. 21.2.
P Q
electric
field lines
Fig. 21.2
The velocity of the proton at P is 7.2 × 10⁶ m s−1 and the velocity at Q is 2.4 × 10⁶ m s−1. The
distance between P and Q is 1.2 cm.
Calculate
(i) the magnitude of the deceleration of the proton
deceleration = ............................................... m s−2 [2]
(ii) the electric field strength E.
E = ................................................ N C−1 [2]

26
H556/02© OCR 2016 Practice paper
22 A nucleus of hydrogen-3 ( H) is unstable and it emits a beta-minus particle (electron).
3
1
(a) The emitted beta-minus particle enters a region of uniform magnetic field.
Fig. 22.1 shows the path of the particle before it enters the magnetic field.
region of uniform
magnetic field
Fig. 22.1
The direction of the magnetic field is into the plane of the paper.
Describe and explain the path of the particle in the magnetic field.
...................................................................................................................................................
...................................................................................................................................................
...................................................................................................................................................
.............................................................................................................................................. [2]
(b) The nucleons inside the 3
1 H nucleus experience gravitational force and one other type of force.
Name this other type of force and describe its nature.
...................................................................................................................................................
...................................................................................................................................................
...................................................................................................................................................
...................................................................................................................................................
.............................................................................................................................................. [3]
(c) Write a decay equation for beta-minus in terms of a quark model.
[2]

27
H556/02 Turn over© OCR 2016 Practice paper
(d) The fusion of two 3
1 H nuclei produces a stable nucleus of 4
2 He and some fast-moving neutrons.
(i) Explain why the fusion of the 3
1 H nuclei must produce two neutrons.
...........................................................................................................................................
...........................................................................................................................................
...........................................................................................................................................
...................................................................................................................................... [2]
(ii) The total energy released in this fusion reaction is 11 MeV. The binding energy per
nucleon of the 4
2 He nucleus is 7.1 MeV.
Calculate in J the binding energy per nucleon of the 3
1 H nucleus.
binding energy per nucleon = ....................................................... J [3]

28
H556/02© OCR 2016 Practice paper
23 (a) The medical tracer technetium-99m is used in gamma scans. Technetium-99m has a half-life
of 6.0 hours and it emits gamma rays.
A fresh sample of a radiopharmaceutical containing technetium-99m is prepared in the
radiography department of a hospital. The initial activity of the radiopharmaceutical is
820 MBq. The radiopharmaceutical is injected into the patient some time later when its activity
has dropped to 630 MBq.
Calculate the time in hours between the radiopharmaceutical being produced and it being
injected into the patient.
time = ..................................................... h [3]
(b) A gamma camera is connected to a computer and a display. Sophisticated software is used
to produce a quality scan (image) of the patient.
(i) Briefly describe the function of the collimator, scintillator and photomultiplier tubes in a
gamma camera.
...........................................................................................................................................
...........................................................................................................................................
...........................................................................................................................................
...........................................................................................................................................
...........................................................................................................................................
...........................................................................................................................................
...........................................................................................................................................
...........................................................................................................................................
...................................................................................................................................... [3]

29
H556/02 Turn over© OCR 2016 Practice paper
(ii) Fig. 23 shows two types of lead collimator tubes T and S available for a gamma camera.
T
S
Fig. 23
Tube T is thin and long. Tube S is broad and short.
Discuss which type of tube would be more suitable in a gamma camera.
...........................................................................................................................................
...........................................................................................................................................
...........................................................................................................................................
...........................................................................................................................................
...................................................................................................................................... [2]

30
H556/02© OCR 2016 Practice paper
24 A patient with a blood clot in his muscle is having an ultrasound A-scan.
Fig. 24.1 shows an ultrasound transducer placed on the patient’s skin.
gel
transducer
skin
clot
muscle
to
oscilloscope
Fig. 24.1 (not to scale)
The ultrasound transducer produces pulses of ultrasound. An oscilloscope is connected to the
transducer. Fig. 24.2 shows part of the oscilloscope display.
P
QR
time
Fig. 24.2
(a) In Fig. 24.2, P is one of the signal pulses produced by the transducer.
Explain the origin of the pulses Q and R.
...................................................................................................................................................
...................................................................................................................................................
.............................................................................................................................................. [2]

31
H556/02© OCR 2016 Practice paper
(b) The front of the blood clot is 1.5 cm from the skin.
The density of the patient’s muscle is 1070 kg m−3.
The time difference between pulses P and Q in Fig. 24.2 is 19 μs.
Determine the acoustic impedance Z of patient’s muscle. State an appropriate unit for your
answer.
Z = ........................... unit: .................... [4]
END OF QUESTION PAPER

32
H556/02© OCR 2016 Practice paper
ADDITIONAL ANSWER SPACE
If additional space is required, you should use the following lined page(s). The question number(s)
must be clearly shown in the margin(s).
..................................................................................................................................................................
..................................................................................................................................................................
..................................................................................................................................................................
..................................................................................................................................................................
..................................................................................................................................................................
..................................................................................................................................................................
..................................................................................................................................................................
..................................................................................................................................................................
..................................................................................................................................................................
..................................................................................................................................................................
..................................................................................................................................................................
..................................................................................................................................................................
..................................................................................................................................................................
..................................................................................................................................................................
..................................................................................................................................................................
..................................................................................................................................................................
..................................................................................................................................................................
..................................................................................................................................................................
..................................................................................................................................................................
..................................................................................................................................................................
Oxford Cambridge and RSA
Copyright Information
OCR is committed to seeking permission to reproduce all third-party content that it uses in its assessment materials. OCR has attempted to identify and contact all copyright holders
whose work is used in this paper. To avoid the issue of disclosure of answer-related information to candidates, all copyright acknowledgements are reproduced in the OCR Copyright
Acknowledgements Booklet. This is produced for each series of examinations and is freely available to download from our public website (www.ocr.org.uk) after the live examination series.
If OCR has unwittingly failed to correctly acknowledge or clear any third-party content in this assessment material, OCR will be happy to correct its mistake at the earliest possible
opportunity.
For queries or further information please contact the Copyright Team, First Floor, 9 Hills Road, Cambridge CB2 1GE.
OCR is part of the Cambridge Assessment Group; Cambridge Assessment is the brand name of University of Cambridge Local Examinations Syndicate (UCLES), which is itself a
department of the University of Cambridge.