Embed Size (px)
Citation preview
Langmuir 1992,8, 2013-2020 2013
Practical Use of Concentration-Dependent Contact Angles as a Measure of Solid-Liquid Adsorption. 2. Experimental
Aspects Erwin A. Vogler
Becton Dickinson Research Center, 21 Davis Drive, P.O. Box 12016, Research Triangle Park, North Carolina 27709
Received January 13, 1992. In Final Form: May 26, 1992
Experimental aspects of using either contact angle goniometry or Wilhelmy balance tensiometry in the measurement of surfactant adsorption through concentration-dependent contact angles is discussed. A test system consisting of nonwettable, silane-treated glass slides and the nonionic detergent Tween-80 (polyoxyethylene sorbitan monooleate) was used to illustrate differences in adsorption results obtained by these two distinct methods. Wetting data were interpreted by application of Gibbs' adsorption isotherm which quantifies adsorption through a surface excess parameter, [rCsl) - I'(sv)l, that simultaneously measures surfactant adsorption at both solid-liquid (sl) and solid-vapor (sv) interfaces. It was shown that Wilhelmy balance tensiometry consistently gave lower values for [I'(sl) - I'(sv)l, which was attributed to unavoidable solute deposition at the sv interface caused by liquid-front vibrations and solvent (water) evaporation at the moving solid-liquid-vapor (slv) three-phase line. By contrast, the slv line was stationary in the go- niometry method and [I'(.l) - I'(sv)l = I'(sl), so that surface excess could be unambiguously interpreted in terms of sl adsorption at these hydrophobic surfaces. Adsorption results were interpreted in terms of the molecular configuration of Tween in the adsorbed state at liquid and solid interfaces. Experimental methods were extended to human serum albumin to explore the potential utility of concentration-de- pendent contact angle measurements in the study of protein adsorption to solid surfaces.
Introduction Contact angles have unique potential in the measure-
ment of adsorption. These wetting measurements, which fall within the broader category of tensiometry, are sensitive only to the upper 0.5 nm or so of a surface112 and are, therefore, among the most surface-sensitive techniques available. Tensiometry measures the fundamental ener- getics a t an interface that drive adsorption and adhesion. Thus, tensiometric techniques monitor interfacial phe- nomena of significance in diverse technological areas of commercial importance such as adhesives, biomedical devices, composite materials, electronics, and friction/ lubrication. In the biomedical area, which is of particular interest to me, protein adsorption and cell/tissue adhesion are of overwhelming importance. Thus, it is particularly relevant for research in this field that tensiometric measurements can be made with proteinaceous saline solutions because this is the medium encountered in end- use applications. A significant challenge, however, is to measure contact angles in such a way that the most meaningful information is obtained, and then correctly interpret results in terms of both the fundamental physical chemistry and the biological response to material surfaces.
Theoretical and computational aspects of interpreting concentration-dependent contact angles in terms of the adsorption of surface-active molecules (surfactants) to solid surfaces from aqueous solution were discussed in the first of this two-part series. A thermodynamic analysis revealed that the surface excess parameter [I'(sl) - I'(sv)l, which simultaneously measures adsorption to solid-liquid (sl) and solid-vapor (sv) interfaces, could be interpreted in terms of sl adsorption for nonwettable surfaces under experimental conditions that avoided surfactant deposi- tion at sv interfaces so that r(sv) - 0. These conditions provide direct access to the interaction between the solid surface chemistry, with the aqueous phase containing important surfactants such as proteins.
(1) Bain, C. D.; Whitesides, G. M. J. Am. Chem. SOC. 1988,110,5898. (2) Whitesidea, G. M.; Laibinis, P. E. Langmuir 1990, 6, 87.
0743-7463/92/2408-2013~03.00/0
This paper adresses experimental conditions under which concentration-dependent contact angles can be interpreted directly in terms of sl adsorption for hydro- phobic, nonwettable surfaces. The impact of surfactant adsorption at sv interfaces on contact angle measurements is examined by comparing results of two popular wetting techniques, Wilhelmy balance tensiometry and contact- angle goniometry, which offered different levels of control over surfactant deposition at sv interfaces by vibration and evaporative mechanisms. The Wilhelmy balance technique provided little or no control over surfactant deposition or adsorption to the sv interface whereas go- niometry could be practiced in such a way that mechan- ical deposition mechanisms could be minimized or elim- inated. An experimental system consisting of smooth glass slides with a hydrophobic, octadecylsilane layer was employed, and the nonionic detergent Tween-80 (poly- oxyethylene sorbitan monooleate) served as an example surfactant. Purified human serum albumin (HSA) served as a test protein which allowed exploration of the potential utility of concentration-dependent contact angles in protein adsorption studies.
Theory Contact Angle and Adhesion Tension Curves. The
contact angle goniometer and Wilhelmy balance are probably the most popular tensiometric tools currently in use. Many good reviews are available that discuss the theory and practice of these technique^.^-^ The funda- mental energetic that these methods measure is adhesion tension, 7 y(lv) cos 6, where y(lv) is liquid-vapor (lv) interfacial tension and 8 is the contact angle. Surfaces of common origin almost always exhibit the phenomenon of contact angle hysteresis due to surface chemical hetero-
(3) Johnson, R. E.; Dettre, R. H. In Surface and Colloid Science; Mat-
(4) Padday, J. F. In Surface and Colloid Science; Matijevic, E. , Ed.;
(5 ) Neumann, A. W.; Good, R. J. Surf. Colloid Sci. 1979, 11, 31.
ijevic, E;, Ed.; Wiley-Interscience: New York, 1969; Vol. 2, p 85.
Wiley-Interscience: New York, 1969; Vol. 1, p 102.
0 1992 American Chemical Society
2014 Langmuir, Vol. 8, No. 8, 1992
geneity or roughness-more likely both to some degree. The two angles used to characterize surfaces are the 80- called advancing and receding angles that correspond to advancing and receding adhesion tensions. Adhesion tension is directly measured in the balance case whereas 8 values must be combined with separate y(lV) measure- menta in the calculation of asynthetic T in the goniometer case. In the pursuit of quantifying adsorption by tensi- ometry, advancing and receding 8 or T is measured as a function of surfactant concentration. A plot of contact angles or interfacial tensions against concentration on a logarithmic scale is an effective way of presenting ad- sorption data. These graphical constructs are termed contact angle or interfacial tension curves herein. The- oretical and computational aspect8 of using these curves for the purpose of quantifying surfactant adsorption were discussed in the fiist paper of this two-part series. Salient features which deserve brief recapitulation here are that contact angle and tension curves can be characterized by eo, y0(lv), or TO parameters measured at infinite surfactant dilution and the related parameters denoted V, y'(lv), or T' measured at the maximal surfactant effect. Thus, B o ,
and TO are inherent material properties measured with pure solvent that can be used to compare wettability of different materials whereas V, y'(lV), and 7' measure surfactant effectiveness. Angle and tension curves can be further characterized by two other parameters: one designated K that measures the surfactant concentration at half-maximal change in 0, y(lv), or T and the other denoted by N which is related to the slope of contact angle or tension curves. These parameters can be tabulated for quick comparison or used in computational experiments. Sur- factant adsorption can be estimated from these curves through the surface excess difference [l'(sl) - which was briefly described in the Introduction.
T h r e e Tensiometr ic Methods of Measur ing Adsorption. There are at least three ways a goniometer and Wilhelmy balance can be used to measure concen- tration-dependent 8 and T. To aid in the comparison of these three independent methods, consider the hypothet- ical contact angle and Wilhelmy balance experiments outlined in Figure 1. Substrata for each case are identical smooth, nondeformable plates coated with a uniform surface chemistry of interest, such as a hydrophobic layer for example. Liquid phases are likewise identical and contain a dissolved surfactant that may or may not adsorb to solid interfaces, as dictated by model assumptions listed under "surfactant adsorption" in Figure 1. The surfac- tant is assumed to be nonvolatile and sufficiently dilute so as not to significantly affect vapor-phase partial pressure or composition. Solid interfaces with adsorbed surfac- tant will be differentiated from the case in which no adsorption occurs by the s' notation. Thus, y(s'v) and ~ ( ~ ' 1 ) are sv or sl interfacial tensions, respectively, for plates with adsorbed surfactant. It is further assumed that adsorption proceeds to steady state so that it is clear that 8' indicates identical adsorption to solid surfaces between cases. This notation should not be confused with ~ ' ( 1 ~ ) or f defined previously.
Method I (Figure 1A) is the classical contact angle measurement in which a dry plate is equilibrated with the vapor phase surrounding a small droplet of liquid. Ad- vancing and receding 8 can be measured by goniometry in a number of but only the tilting-stage method will be considered in this work. In this tensiometric approach, the entire humidified chamber illustrated in Figure 1A is tilted from the horizontal which allows measurement of the advancing angle (leading droplet edge)
I [TI". TI'] 1 [TI1 .T1]
ADHESION TENSION MEASUREMENT METHOD 1 ( A )
0 bl, I) . yp) 1 0
k(. I) - Y(,)I of 0 0
Slap 1: Eguilibfate - Step 2: Meuun in vapor ldbcrion lmgim
I n \ METHOD 111 \ b l
I" I
or receding angle (trailing droplet edge) on the same droplet. Ideally, hysteresis (e& - 8,) is measured at the point of "incipient rolling" to assure that maximum advancing and minimum receding angles are obtained. This is impractical in the routine measurement of con- centration-dependent contact angles because contact angle droplets are experimentally observed only in asessile state or in motion, and angle readings on moving droplets is very difficult using goniometry. Instead, contact angles are measured on sessile droplets as described in the Materials and Methods. Wetting tension for case I (advancing or receding) is TI = [T(~,.V, - ~ ( ~ 1 ) l = y(lV) cos 8 and must be calculated from separate measurements of y(lv) and 8 (advancing or receding, respectively). Adsorp- tion to the sl interface will alter the solid-liquid interaction 80 that ' ~ ( ~ 1 ) -.* Y(nq) and [YW - ~ ( d # [Y(nv) - ~ ( 9 1 . Adsorption will not change y(sv) if there is no mechanism of surfactant migration or deposition to the sv interface.
Methods 11 and I11 are Wilhelmy balance experiments in which advancing angles are deduced from immersion forces and receding angles from withdrawal forces.SsTheae are dynamic measurements of adhesion tension in which the solid surface is in motion relative to the wetting liquid. The corresponding dynamic angles would be equivalent to tilting-stage goniometer angles measured on moving
(6) Martin, D. A.; Vogler, E. A. Longmuir 1991, 7,422.
Concentration-Dependent Contact Angles
droplets but not necessarily to the sessile-drop values. Potential differences will be discussed further in the Results and Discussion. Methods I1 and I11 are otherwise identical except that in method I11 the slide is first completely immersed in the liquid phase for some length of time. The effect of the immersion pretreatment is important only in the event of adsorption because the adsorbate will coat the entire slide, including that portion to be exposed to vapor in subsequent measurement steps. For this case with surfactant adsorption, = [y(s!v) - y ( 4 . Method I1 with adsorption is a special case because it changes modes after the first immersion. In the event that the dipping speed is sufficiently slow so that ad- sorption reaches steady state and there is no mechanism of surfactant deposition or adsorption at the sv interface, then T*I = [y(sv) - y(stl)l. In the first receding cycle or any subsequent immersions, however, TII = Ey(srv~ - ~ ( ~ r 1 ) l because adsorbed surfactant is exposed at the sv interface, as described for method 111.
It is very difficult in practice to prevent surfactant deposition at the sv interface using the Wilhelmy balance because of plate movements and vibration-induced ripples in the liquid surface. The net effect is that the three- phase line (slv) rises and falls on a microscopic scale, depositing surfactant at the sv interface by evaporation. A consequence of some or all of these factors is that wetting forces along the perimeter of the specimen can be highly erratic as surfactant adsorbs and desorbs, depending on the kinetics of these processes. Method I1 force-immersion curves can be particularly time-dependent in nature and quite difficult to interpret.
Results for these three hypothetical methods of mea- suring wetting tension are listed in the comparison table of Figure 1. In general, identical results will be obtained only (i) when sessile-drop angles measured by goniometry are identical to those obtained by the dynamic balance measurements and (ii) in the special case in which no adsorption occurs. When there is adsorption, each method can lead to different results independent of (i) above, as determined by the presence of surfactant at the sv interface. Clearly, it is important in comparing results of different methods of measuring interfacial properties of surfaces to recognize and take into account potential differences in the information obtained. The Results and Discussion describes how factors i and ii affect results obtained by applying methods 1-111 in the study of adsorption to a real system consisting of glass cover slips with a hydrophobic silane layer using both Tween-80 and human serum albumin (HSA) in saline solution as test surfactant systems.
Materials and Methods Substrata. Wettable glass cover slips (Clay Adams Gold Seal,
24 X 30 X 0.1 mm) used in Wilhelmy balance measurements of y(lv) were prepared by sequential rinses in distilled water, 2-pro- panol, and Freon to remove putative surface contaminants followed by 15-min exposure to an oxygen plasma (100 W of 13.56-MHz rf power, -50 mTorr of 02). Hydrophobic surfaces were prepared from cleaned cover slips by reaction with 2% oc- tadecyltrichlorosilane (OTS, Petrach) in CHCls for about 2 h at -60 "C in a sealed container. Plates were prepared batchwise, yielding identically-treated specimens with little batch-to-batch variability (saline contact angles varied about 5' within and between batches), exhibit 10-20' hysteresis on an advancing contact angle of about 10G-llOo.
Solutions. Tween-80 (polyoxyethylene sorbitan monooleate, nominal MW = 1309.68, d = 1.064, used as received from Ald- rich) and HSA (globulin-free lyophilized crystals, nominal MW = 69 OOO, used as received from Sigma Chemical) solutions were prepared in physiologic saline (0.9%, Abbott). No attempt was
Langmuir, Vol. 8, No. 8, 1992 2015
made to purify or check the purity of these test surfactants. In particular, HSA was not examined for the possible presence of surface-active contaminants such as poly(dimethylsi1oxane) possibly arising from manufacturer's preparation procedures. However, I note that HSA interfacial properties were very similar to those of fetal bovine serum and freshly-prepared porcine plasma solutions which are overwhelmingly albumin in compo- sition and free from purification artifacts.
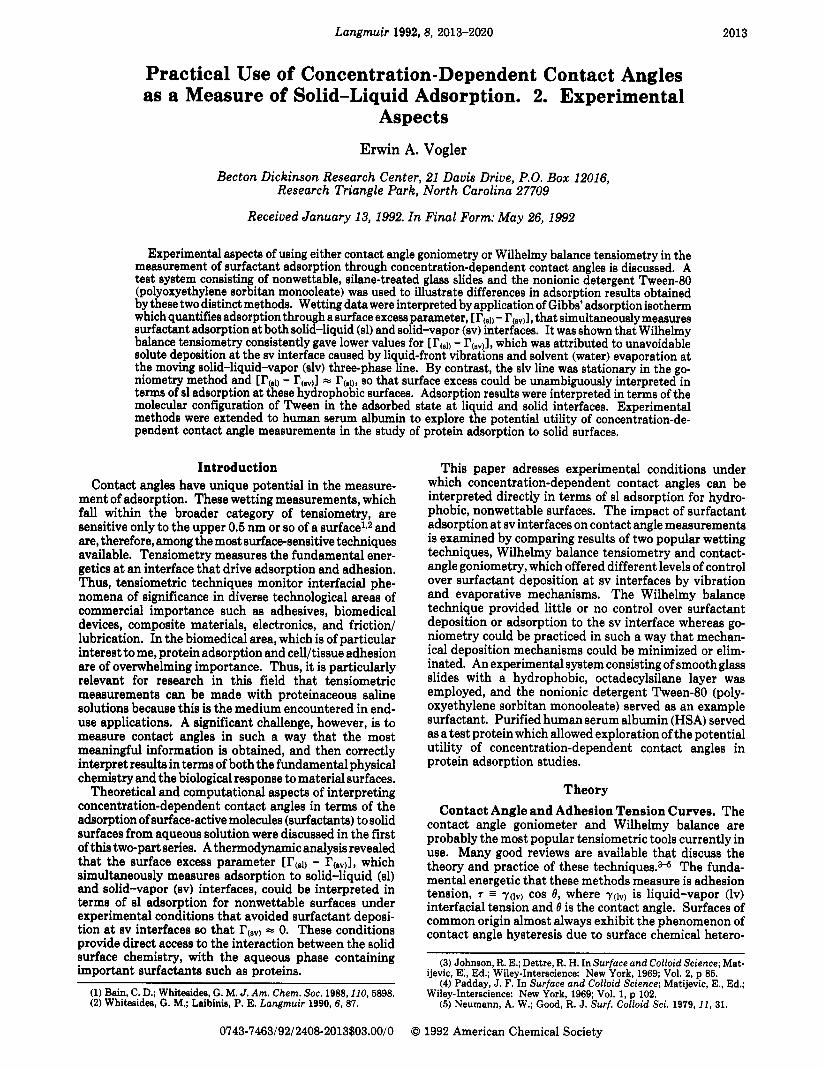
Wetting Measurements. Wilhelmy balance measurements of y(lV) were carried out as described in ref 6. Tween and HSA solutions were observed (by contact angle goniometry) to completely wet oxidized glass cover slips used as plates in the Wilhelmy experiment, verifying the assumption that 8 = 0 and measured 7 = y(lv) cos t9 = y(lv). Advancing and receding contact angle measurements were made with a goniometer fitted with a tilting stage (Rame' Hart). A humidified environmental chamber was employed to minimize evaporation and a vibration-isolation table (Newport) used to dampen apparatus vibrations. Contact angle measurements were made after a 15-30-min equilibration of a 10-pL droplet containing the surfactant concentration of interest on test surfaces. Equilibration was carried out with test surfaces held in the horizontal mode, and readings were made when angles were observed to be stable with time. The stage was then slowly tilted using a motor drive for advancing/receding angle readings. All contact angles were read by a single experimentalist. Multiple readings of the same angle suggest that precision in separate contact angle observations was about 2.5" with agreement between three different experimentalists within 5'. Plots of observed contact angle against tilt angle showed that advancing angles increased and receding angles decreased to plateau values within the precision of contact angle readings at stage-tilt angles between 25' and 40'. This plateau value was relatively stable up to and including the tilt angle that caused the droplet to roll. Reliable contact angle readings on moving droplets were not generally possible with this particular experimental apparatus, although estimates for a slowly-rolling droplet were occasionally made. Figure 2 is a typical contact angle plot for a saline and a Tween solution with y = 39.7 dyn/cm (2.6% w/w in saline) obtained for a silanated surface exhibiting a saline advancing angle of about 104'. Figure 2 illustrates the plateau contact angle effect. Contact angle plots verified that maximum advancing and minimum receding contact angle measurements were obtained at a tilt-stage angle between 30' and 35". Data fitting, calculation of surface excess, and error analysis were performed as described in the first paper of this two-part series.
Results and Discussion As an illustration of the effect of surfactant adsorption
on the measurement of concentration-dependent 0 and 7,
methods. 1-111 (Figure 1) were applied to the silanated glass surface in construction of contact angle and tension curves for Tween-80 and HSA. Discussion of the results wi l l focus first on adsorption to lv interfaces which can be interpreted unambiguously. Adsorption to solid surfaces is much less straightforward to understand, however, and will be interpreted in terms of an adsorption paradigm that was introduced in the first paper of this series. General comparisons between results obtained applying methods 1-111 to Tween and HSA solutions will be made, followed by a detailed discussion of the results for each surfactant separately.
Adsorption to Liquid Interfaces. Figure 3 is a y(lv) curve that compares surfactant properties of Tween and HSA. It is apparent that HSA exhibits surfactant properties that are very similar to the ordinary detergent. Smooth curves through the data of Figure 3 yield char- acteristic parameters yo (lV), y ' (~~) , and iV(lv) collected in Table I (see Theory and companion paper of this two- part series in this issue for a detailed discussion of data analysis methods). The yo (lV) parameter measures liquid interfacial tension at infinite surfactant dilution and is, therefore, equal to the interfacial tension of saline used
2016 Langmuir, Vol. 8, No. 8, 1992
110 1
-
Vogler
Table I. Surfactant Properties of Tween-80 and Human Serum Albumin at the Liquid-Vapor Interface
100
90 P)
3 80 0
P
30 7
0 10 20 30 40 50 Tilt Angle (degrees)
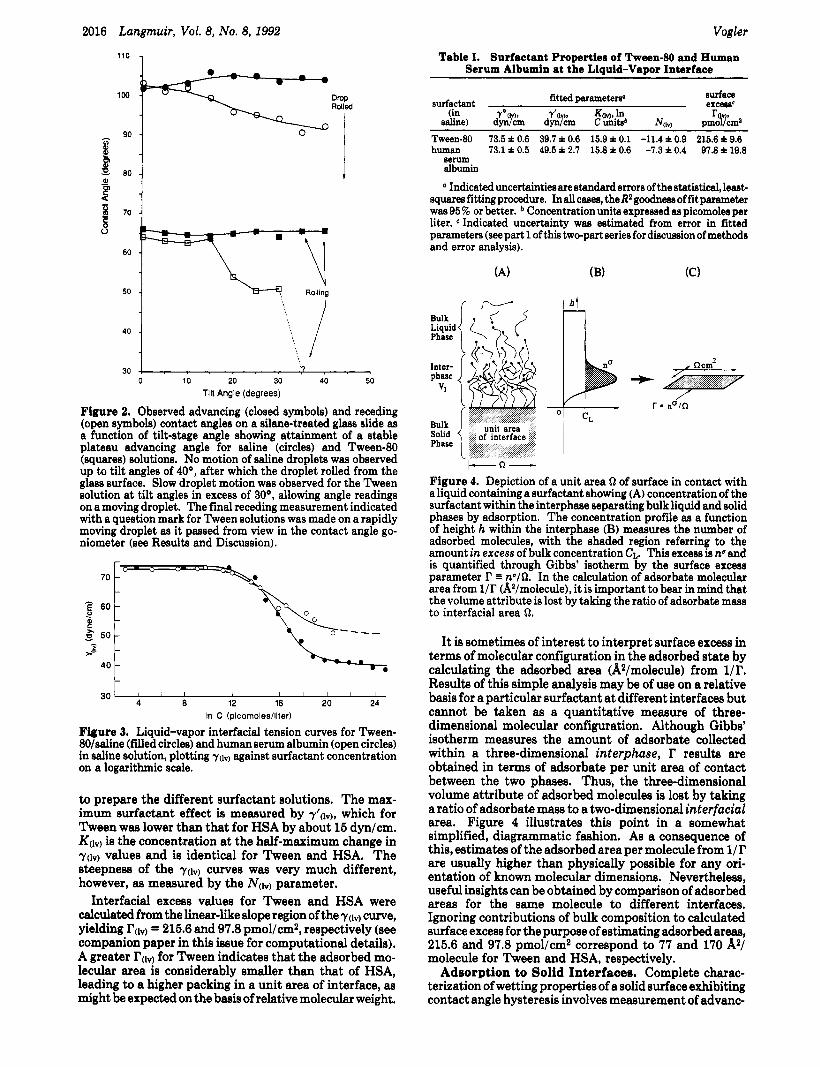
Figure 2. Observed advancing (closed symbols) and receding (open symbols) contact angles on a silane-treated glass slide as a function of tilt-stage angle showing attainment of a stable plateau advancing angle for saline (circles) and Tween-80 (squares) solutions. No motion of saline droplets was observed up to tilt angles of 40°, after which the droplet rolled from the glass surface. Slow droplet motion was observed for the Tween solution at tilt angles in excess of 30°, allowing angle readings on a moving droplet. The final receding measurement indicated with a question mark for Tween solutions was made on a rapidly moving droplet as it passed from view in the contact angle go- niometer (see Results and Discussion).
to prepare the different surfactant solutions. The max- imum surfactant effect is measured by y'(lV), which for Tween was lower than that for HSA by about 15 dyn/cm. K(lV) is the concentration at the half-maximum change in ~ ( 1 ~ ) values and is identical for Tween and HSA. The steepness of the y(lv) curves was very much different, however, as measured by the N(lV) parameter.
Interfacial excess values for Tween and HSA were calculated from the linear-like slope region of the ~ ( 1 ~ ) curve, yielding r(lv) = 215.6 and 97.8 pmol/cm2, respectively (see companion paper in this issue for computational details), A greater r(lv) for Tween indicates that the adsorbed mo- lecular area is coneiderably smaller than that of HSA, leading to a higher packing in a unit area of interface, as might be expected on the basis of relative molecular weight.
Tween-80 73.5 f 0.6 39.7 f 0.6 15.9 f 0.1 -11.4 i 0.9 215.6 f 9 . 6 human 73.1 f 0 . 5 49.5f 2.7 15.8f0.6 -7.3 iO .4 97.8f 19.8
serum albumin
Indicated uncertainties are standard errors of the statistical, least- squares fittingprocedure. Inallcasea, theR*goodnewoffitparameter was 96% or better. b Concentration units expressed as picomoles per liter. Indicated uncertainty was estimated from error in fitted " m e t e r s (see Dart 1 of this two-part series for discussion of methods
Bulk Liquid Phase
Inter- phase
"1
Bulk Solid Phase
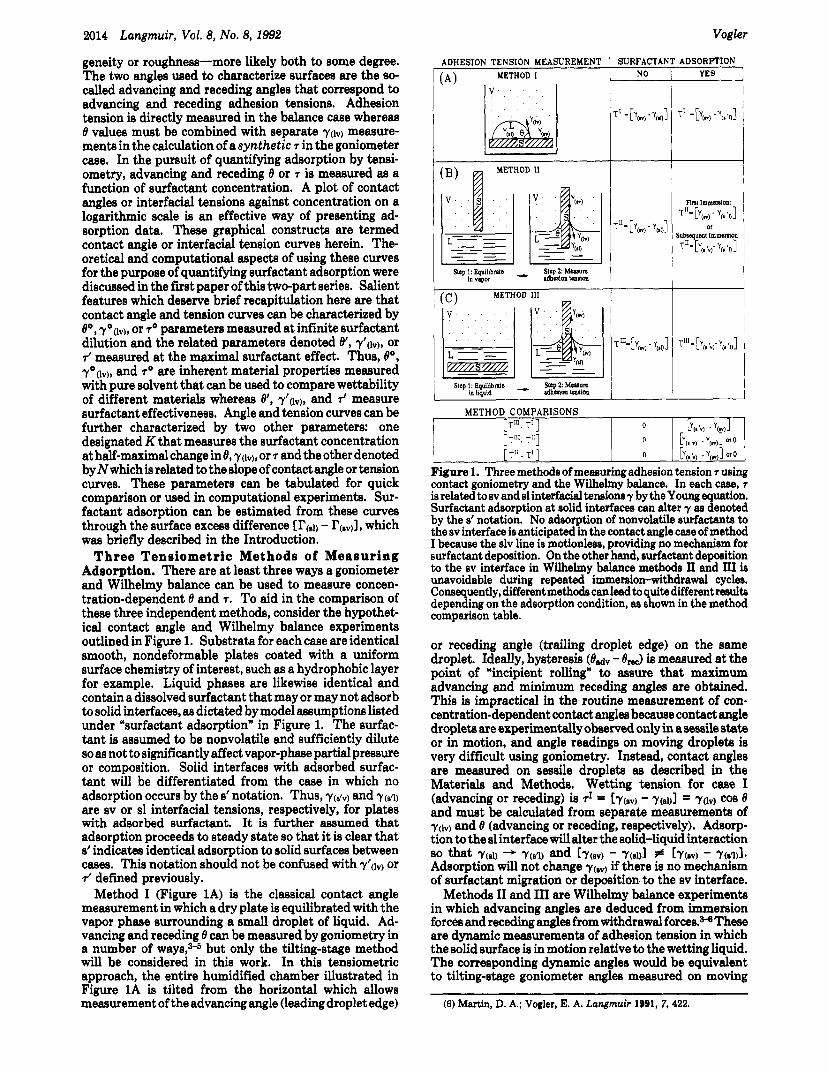
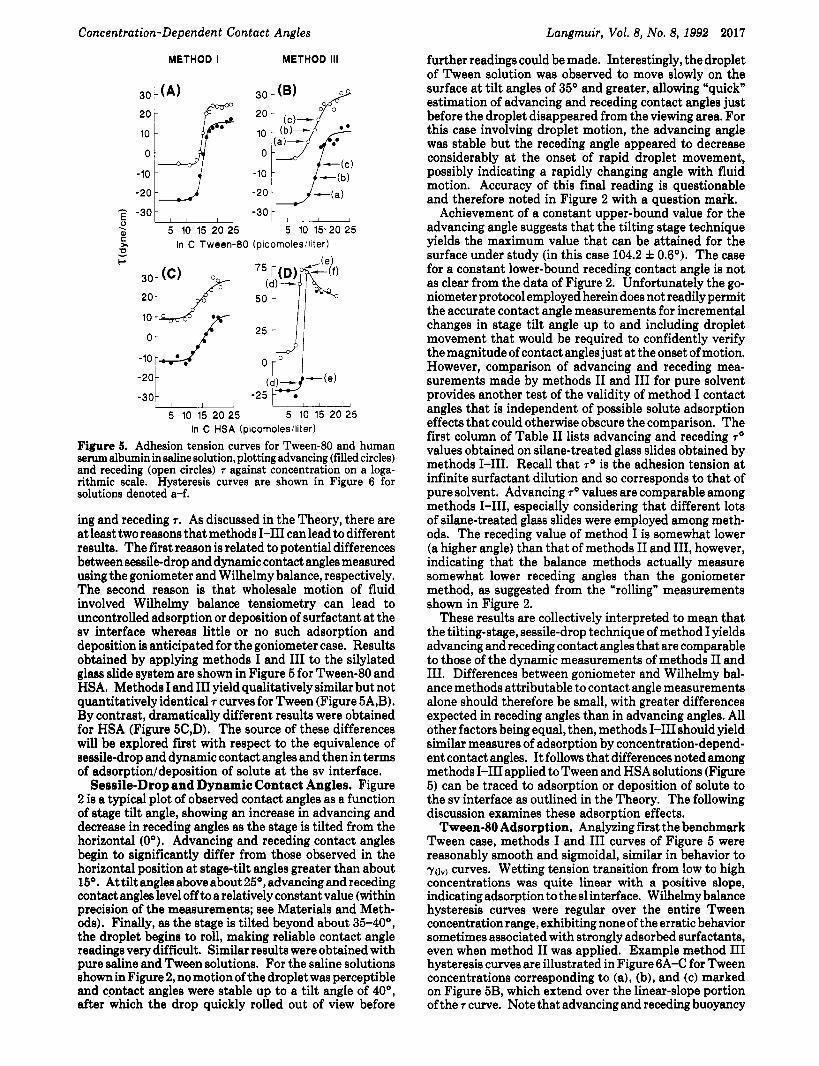
Figure 4. Depiction of a unit area s2 of surface in contact with a liquid containing a surfactant showing (A) concentration of the surfactant within the interphase separating bulk liquid and solid phases by adsorption. The concentration profile as a function of height h within the interphase (B) measures the number of adsorbed molecules, with the shaded region referring to the amount in excess of bulk concentration CL. This excess is nu and is quantified through Gibbs' isotherm by the surface excess parameter r = n'/Q. In the calculation of adsorbate molecular area from l/r (A2/molecule), it is important to bear in mind that the volume attribute is lost by taking the ratio of adsorbate mass to interfacial area Q.
It is sometimes of interest to interpret surface excess in terms of molecular configuration in the adsorbed state by calculating the adsorbed area (A2/molecule) from l/r. Resulta of this simple analysis may be of use on a relative basis for a particular surfactant a t different interfaces but cannot be taken as a quantitative measure of three- dimensional molecular configuration. Although Gibbs' isotherm measures the amount of adsorbate collected within a three-dimensional interphase, r results are obtained in terms of adsorbate per unit area of contact between the two phases. Thus, the three-dimensional volume attribute of adsorbed molecules is lost by taking a ratio of adsorbate mass to a two-dimensional interfacial area. Figure 4 illustrates this point in a somewhat simplified, diagrammatic fashion. As a consequence of this, estimates of the adsorbed area per molecule from l/r are usually higher than physically possible for any ori- entation of known molecular dimensions. Nevertheless, useful insights can be obtained by comparison of adsorbed areas for the same molecule to different interfaces. Ignoring contributions of bulk composition to calculated surface excess for the purpose of estimating adsorbed areas, 215.6 and 97.8 pmol/cm2 correspond to 77 and 170 A2/ molecule for Tween and HSA, respectively.
Adsorption to Solid Interfaces. Complete charac- terization of wetting properties of a solid surface exhibiting contact angle hysteresis involves measurement of advanc-
Concentration-Dependent Contact Angles Langmuir, Vol. 8, No. 8, 1992 2017
further readings could be made. Interestingly, the droplet of Tween solution was observed to move slowly on the surface a t tilt angles of 35’ and greater, allowing “quick” estimation of advancing and receding contact angles just before the droplet disappeared from the viewing area. For this case involving droplet motion, the advancing angle was stable but the receding angle appeared to decrease considerably at the onset of rapid droplet movement, possibly indicating a rapidly changing angle with fluid motion. Accuracy of this final reading is questionable and therefore noted in Figure 2 with a question maik.
Achievement of a constant upper-bound value for the advancing angle suggests that the tilting stage technique yields the maximum value that can be attained for the surface under study (in this case 104.2 f 0.6’). The case for a constant lower-bound receding contact angle is not as clear from the data of Figure 2. Unfortunately the go- niometer protocol employed herein does not readily permit the accurate contact angle measurements for incremental changes in stage tilt angle up to and including droplet movement that would be required to confidently verify the magnitude of contact angles just at the onset of motion. However, comparison of advancing and receding mea- surements made by methods I1 and I11 for pure solvent provides another test of the validity of method I contact angles that is independent of possible solute adsorption effects that could otherwise obscure the comparison. The first column of Table I1 lists advancing and receding TO values obtained on silane-treated glass slides obtained by methods 1-111. Recall that T’ is the adhesion tension at infinite surfactant dilution and so corresponds to that of pure solvent. Advancing ro values are comparable among methods 1-111, especially considering that different lots of silane-treated glass slides were employed among meth- ods. The receding value of method I is somewhat lower (a higher angle) than that of methods I1 and 111, however, indicating that the balance methods actually measure somewhat lower receding angles than the goniometer method, as suggested from the “rolling” measurements shown in Figure 2.
These results are collectively interpreted to mean that the tilting-stage, sessile-drop technique of method I yields advancing and receding contact angles that are comparable to those of the dynamic measurements of methods I1 and 111. Differences between goniometer and Wilhelmy bal- ance methods attributable to contact angle measurements alone should therefore be small, with greater differences expected in receding angles than in advancing angles. All other factors being equal, then, methods 1-111 should yield similar measures of adsorption by concentration-depend- ent contact angles. It follows that differences noted among methods 1-111 applied to Tween and HSA solutions (Figure 5) can be traced to adsorption or deposition of solute to the sv interface as outlined in the Theory. The following discussion examines these adsorption effects. Tween-80 Adsorption. Analyzing first the benchmark
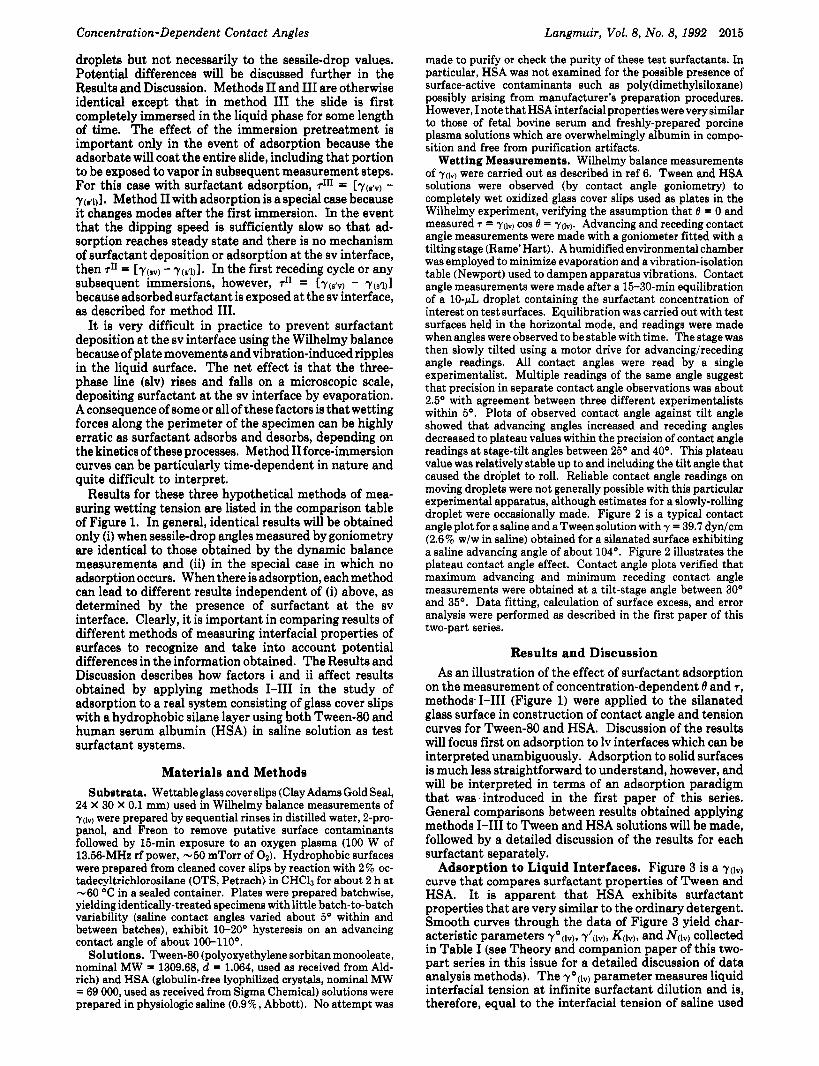
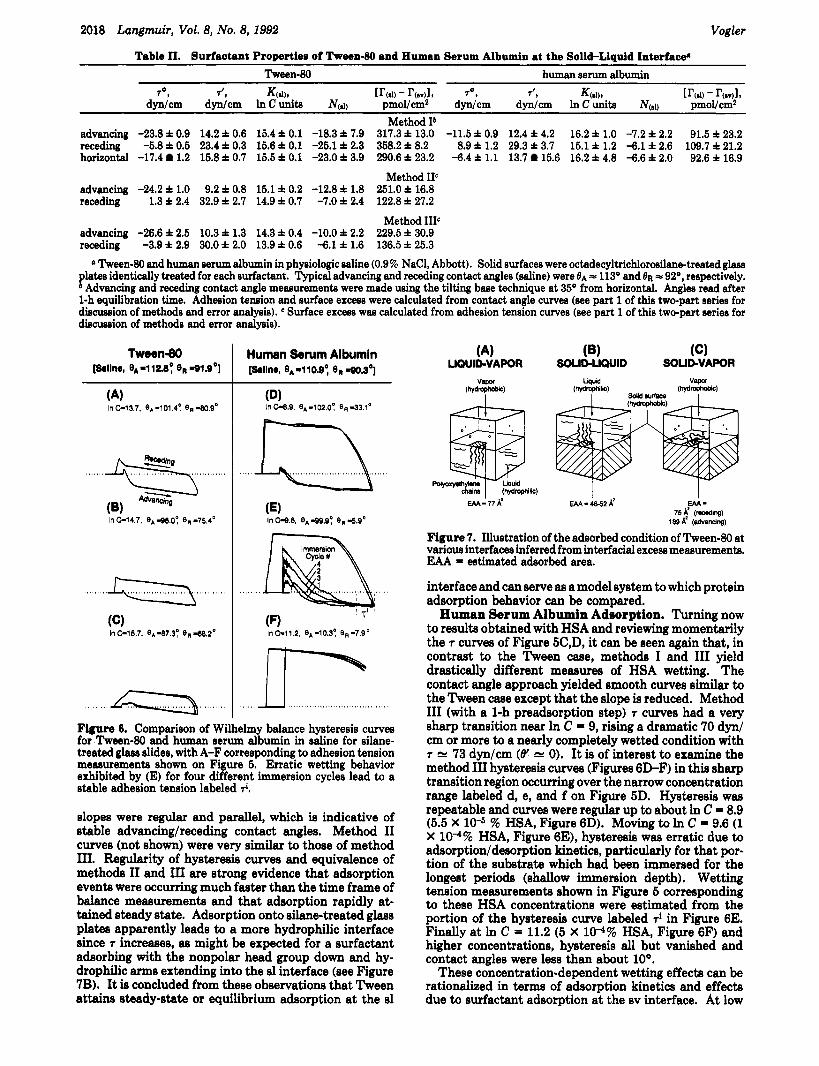
Tween case, methods I and I11 curves of Figure 5 were reasonably smooth and sigmoidal, similar in behavior to y(lv) curves. Wetting tension transition from low to high concentrations was quite linear with a positive slope, indicating adsorption to the sl interface. Wilhelmy balance hysteresis curves were regular over the entire Tween concentration range, exhibiting none of the erratic behavior sometimes associated with strongly adsorbed surfactants, even when method I1 was applied. Example method I11 hysteresis curves are illustrated in Figure 6A-C for Tween concentrations corresponding to (a), (b), and (c) marked on Figure 5B, which extend over the linear-slope portion of the r curve. Note that advancing and receding buoyancy
METHOD I METHOD 111
- -301 , 1 , , - 3 O i I l l ,
a, 5 10 15 20 25 5 10 15-20 25 5 . C =. In C Tween-80 (picomolesiliter)
-10
(:)&+e) -30 -25 1
I l l
5 10 15 20 25 5 10 15 20 25 -20: l 1 1 j
In C HSA (picomolesiliter) Figure 5. Adhesion tension curves for Tween-80 and human serum albumin in saline solution, plotting advancing (filled circles) and receding (open circles) 7 against concentration on a loga- rithmic scale. Hysteresis curves are shown in Figure 6 for solutions denoted a-f.
ing and receding r. As discussed in the Theory, there are a t least two reasons that methods 1-111 can lead to different results. The first reason is related to potential differences between sessile-drop and dynamic contact angles measured using the goniometer and Wilhelmy balance, respectively. The second reason is that wholesale motion of fluid involved Wilhelmy balance tensiometry can lead to uncontrolled adsorption or deposition of surfactant at the sv interface whereas little or no such adsorption and deposition is anticipated for the goniometer case. Results obtained by applying methods I and I11 to the silylated glass slide system are shown in Figure 5 for Tween-80 and HSA. Methods I and I11 yield qualitatively similar but not quantitatively identical r curves for Tween (Figure 5A,B). By contrast, dramatically different results were obtained for HSA (Figure 5C,D). The source of these differences will be explored first with respect to the equivalence of sessile-drop and dynamic contact angles and then in terms of adsorption/deposition of solute at the sv interface.
Sessile-Drop and Dynamic Contact Angles. Figure 2 is a typical plot of observed contact angles as a function of stage tilt angle, showing an increase in advancing and decrease in receding angles as the stage is tilted from the horizontal (0’). Advancing and receding contact angles begin to significantly differ from those observed in the horizontal position at stage-tilt angles greater than about 15’. At tilt angles above about 2 5 O , advancing and receding contact angles level off to a relatively constant value (within precision of the measurements; see Materials and Meth- ods). Finally, as the stage is tilted beyond about 35-40’, the droplet begins to roll, making reliable contact angle readings very difficult. Similar results were obtained with pure saline and Tween solutions. For the saline solutions shown in Figure 2, no motion of the droplet was perceptible and contact angles were stable up to a tilt angle of 40°, after which the drop quickly rolled out of view before
2018 Langmuir, Vol. 8, No. 8, 1992 Vogler
Table 11. Surfactant Properties of Tween-80 and Human Serum Albumin at the Solid-Liquid Interface Tween-80 human serum albumin
To 8 r', K(d)t red, - r(svv)~, Tot r', K(dh m a l , - r(avv)~, dvn/cm d d c m lncunits Nta) Dmol/cm2 dWcm dvn/cm lncunits Nr.11 Dmol/cm2
Method I* advancing -23.8 f 0.9 14.2 f 0.6 15.4 f 0.1 -18.3 f 7.9 317.3 * 13.0 -11.5 * 0.9 12.4 f 4.2 16.2 f 1.0 -7.2 f 2.2 91.5 & 23.2 receding -5.8 f 0.5 23.4 f 0.3 15.6 f 0.1 -25.1 f 2.3 358.2 f 8.2 8.9 f 1.2 29.3 f 3.7 15.1 f 1.2 -6.1 f 2.6 109.7 f 21.2 horizontal -17.4 1.2 15.8 f 0.7 15.5 f 0.1 -23.0 f 3.9 290.6 f 23.2 -6.4 f 1.1 13.7 15.6 16.2 f 4.8 -6.6 f 2.0 92.6 f 16.9
Method IIC advancing -24.2f1.0 9.2f0.8 15.110.2 -12.8f1.8 251.0f16.8 receding 1.3 f 2.4 32.9 f 2.7 14.9 f 0.7 -7.0 f 2.4 122.8 f 27.2
advancing -26.6 f 2.5 10.3 f 1.3 14.3 f 0.4 -10.0 f 2.2 229.5 f 30.9 receding -3.9 f 2.9 30.0 f 2.0 13.9 f 0.6 -6.1 f 1.6 136.5 f 25.3
a Tween-80 and human serum albumin in physiologic saline (0.9% NaC1, Abbott). Solid surfaces were octadecyltrichloroeilane-treated g h plates identically treated for each surfactant. Typical advancing and receding contact angles (saline) were 8A = 113O and = 92O, respectively. * Advancing and receding contact angle measurements were made using the tilting base technique at 35O from horizontal. Angles read after 1-h equilibration time. Adhesion tension and surface excm were calculated from contact angle curves (see part 1 of this two-part series for discuesion of methods and error analysis). Surface exceaa was calculated from adhesion tension curves (see part 1 of this two-part series for diecussion of methods and error analysis).
Method IIIc
Tween80 [&line, e, =I 12.8: eR lei.oO]
....................................... e ->g
(8) . . In c-14.7. eA +.o: eR -75.4'
I
Human Serum Albumin [&iIne, e,-iio.oq eR 180.34
..... .....
u .............
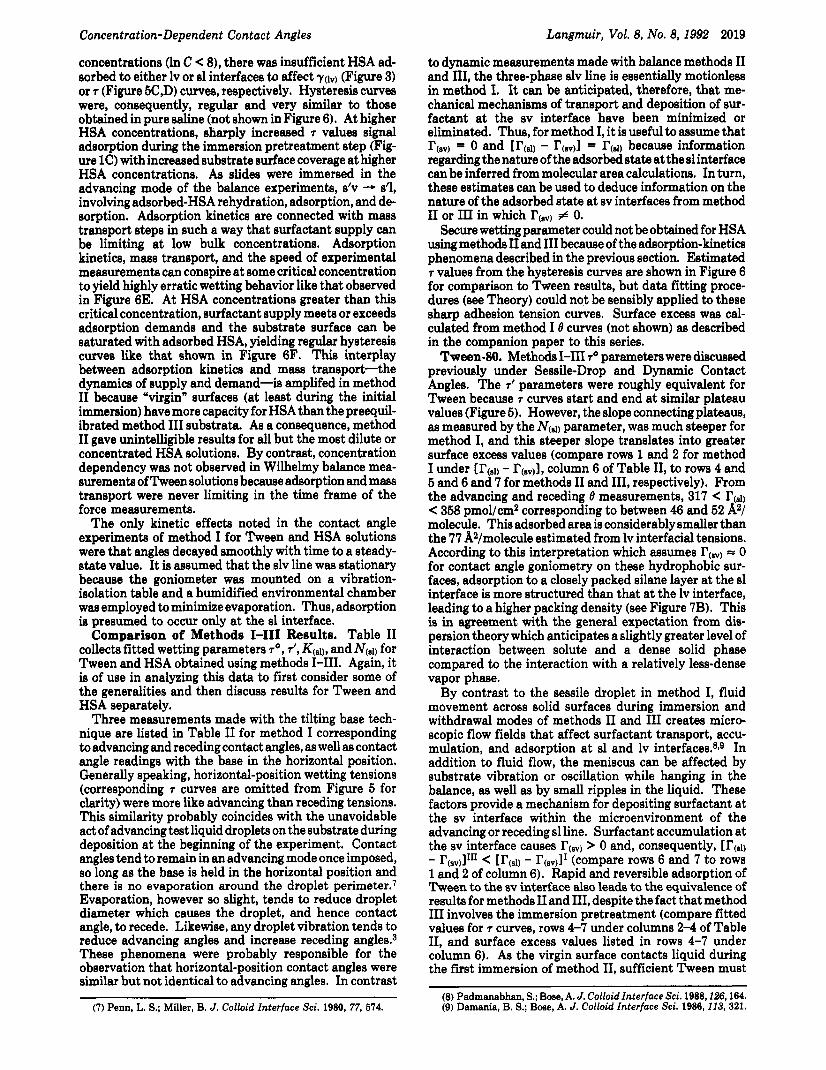
Figure 6. Comparison of Wilhelmy balance hysteresis curves for Tween-80 and human serum albumin in saline for silane- treated glass slides, with A-F corresponding to adhesion tension measurements shown on Figure 5. Erratic wetting behavior exhibited by (E) for four different immersion cycles lead to a stable adhesion tension labeled
elopes were regular and parallel, which is indicative of stable advancing/receding contact angles. Method I1 curves (not shown) were very similar to those of method 111. Regularity of hysteresis curves and equivalence of methods I1 and I11 are strong evidence that adsorption events were occurring much faster than the time frame of balance measurements and that adsorption rapidly at- tained steady state. Adsorption onto silane-treated glass plates apparently leads to a more hydrophilic interface since T increases, as might be expected for a surfactant adsorbing with the nonpolar head group down and hy- drophilic arms extending into the sl interface (see Figure 7B). It is concluded from these observations that Tween attains steady-state or equilibrium adsorption at the sl
I 75A' (medlng)
1 6 3 t (advancing)
EAA- I
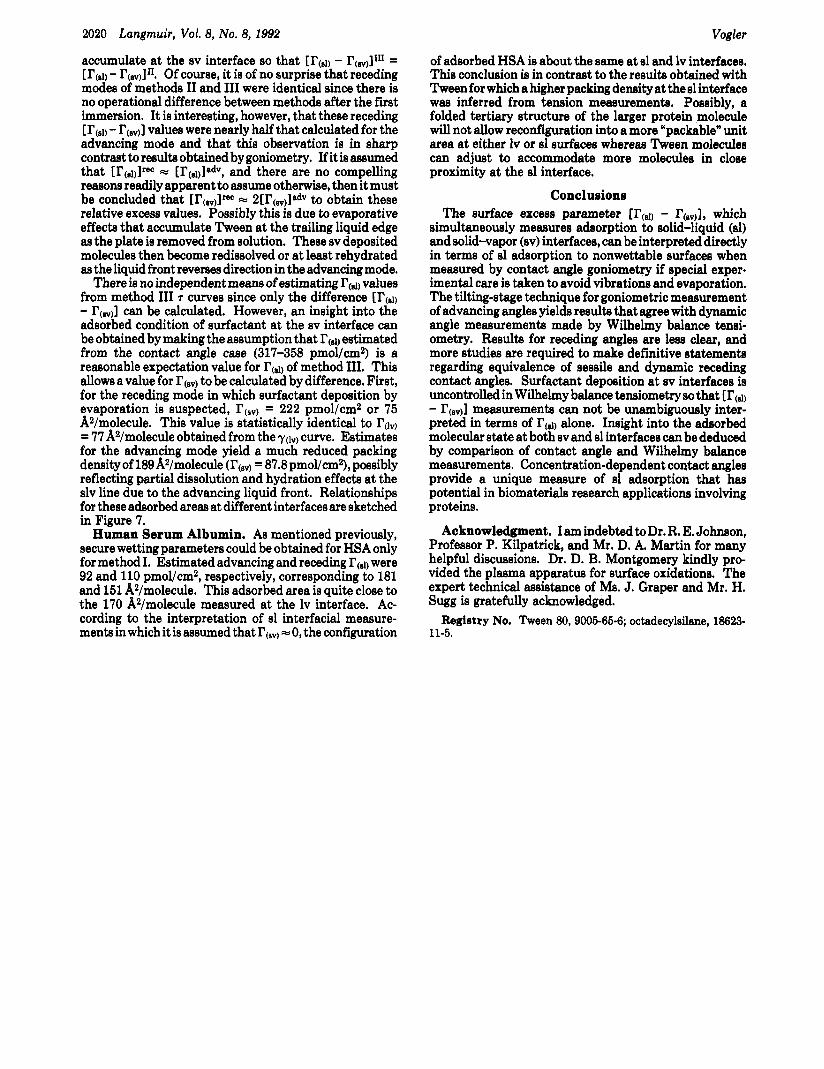
. . I (hydmlb) u U - 7 7 A p E A A - W ~ A '
Figure 7. Illustration of the adsorbed condition of Tween-80 at various interfaces inferred from interfacial excess measurements. EAA = estimated adsorbed area.
interface and can serve as a model system to which protein adsorption behavior can be compared. Human Serum Albumin Adsorption. Turning now
to results obtained with HSA and reviewing momentarily the T curves of Figure 5C,D, it can be seen again that, in contrast to the Tween case, methods I and I11 yield drastically different measures of HSA wetting. The contact angle approach yielded smooth curves similar to the Tween case except that the slope is reduced. Method I11 (with a 1-h preadsorption step) T curves had a very sharp transition near In C = 9, rising a dramatic 70 dyn/ cm or more to a nearly completely wetted condition with T cs 73 dyn/cm (6' 0). It is of interest to examine the method I11 hysteresis curves (Figures 6D-F) in this sharp transition region occurring over the narrow concentration range labeled d, e, and f on Figure 5D. Hysteresis was repeatable and curves were regular up to about In C = 8.9 (5.5 X 10" 7% HSA, Figure 6D). Moving to In C = 9.6 (1 X lo4% HSA, Figure 6E), hysteresis was erratic due to adsorption/desorption kinetics, particularly for that por- tion of the substrate which had been immersed for the longest periods (shallow immersion depth). Wetting tension measurements shown in Figure 5 corresponding to these HSA concentrations were estimated from the portion of the hysteresis curve labeled ri in Figure 6E. Finally at In C = 11.2 (5 X 10% HSA, Figure 6F) and higher concentrations, hysteresis all but vanished and contact angles were less than about 10'.
These concentration-dependent wetting effects can be rationalized in terms of adsorption kinetics and effects due to surfactant adsorption at the sv interface. At low
Concentration-Dependent Contact Angles
concentrations (In C C 8), there was insufficient HSA ad- sorbed to either lv or sl interfaces to affect ?(I,.) (Figure 3) or T (Figure 5C,D) curves, respectively. Hysteresis curves were, consequently, regular and very similar to those obtained in pure saline (not shown in Figure 6). At higher HSA concentrations, sharply increased 7 values signal adsorption during the immersion pretreatment step (Fig- ure 1C) with increased substrate surface coverage at higher HSA concentrations. As slides were immersed in the advancing mode of the balance experiments, s'v - 8'1, involving adsorbed-HSA rehydration, adsorption, and de- sorption. Adsorption kinetics are connected with mass transport steps in such a way that surfactant supply can be limiting at low bulk concentrations. Adsorption kinetics, mass transport, and the speed of experimental measurements can conspire at some critical concentration to yield highly erratic wetting behavior like that observed in Figure 6E. At HSA concentrations greater than this critical concentration, surfactant supply meets or exceeds adsorption demands and the substrate surface can be saturated with adsorbed HSA, yielding regular hysteresis curves like that shown in Figure 6F. This interplay between adsorption kinetics and mass transport-the dynamics of supply and demand-is amplifed in method I1 because "virgin" surfaces (at least during the initial immersion) have more capacity for HSA than the preequil- ibrated method I11 substrata. As a consequence, method I1 gave unintelligible results for all but the most dilute or concentrated HSA solutions. By contrast, concentration dependency was not observed in Wilhelmy balance mea- surements of Tween solutions because adsorption and maas transport were never limiting in the time frame of the force measurements.
The only kinetic effects noted in the contact angle experiments of method I for Tween and HSA solutions were that angles decayed smoothly with time to a steady- state value. It is assumed that the slv line was stationary because the goniometer was mounted on a vibration- isolation table and a humidified environmental chamber was employed to minimize evaporation. Thus, adsorption is presumed to occur only at the sl interface.
Comparison of Methods 1-111 Results. Table I1 collects fitted wetting parameters T O , T', &,I), and N(s~) for Tween and HSA obtained using methods 1-111. Again, it is of use in analyzing this data to first consider some of the generalities and then discuss results for Tween and HSA separately.
Three measurements made with the tilting base tech- nique are listed in Table I1 for method I corresponding to advancing and receding contact angles, as well as contact angle readings with the base in the horizontal position. Generally speaking, horizontal-position wetting tensions (corresponding T curves are omitted from Figure 5 for clarity) were more like advancing than receding tensions. This similarity probably coincides with the unavoidable act of advancing test liquid droplets on the substrate during deposition at the beginning of the experiment. Contact angles tend to remain in an advancing mode once imposed, so long as the base is held in the horizontal position and there is no evaporation around the droplet perimeter.' Evaporation, however so slight, tends to reduce droplet diameter which causes the droplet, and hence contact angle, to recede. Likewise, any droplet vibration tends to reduce advancing angles and increase receding angle^.^ These phenomena were probably responsible for the observation that horizontal-position contact angles were similar but not identical to advancing angles. In contrast
Langmuir, Vol. 8, No. 8, 1992 2019
to dynamic measurements made with balance methods I1 and 111, the three-phase slv line is essentially motionless in method I. It can be anticipated, therefore, that me- chanical mechanisms of transport and deposition of sur- factant at the sv interface have been minimized or eliminated. Thus, for method I, it is useful to assume that I'(av) = 0 and [I'(al) - I'(sv)l = qSl) because information regarding the nature of the adsorbed state at the sl interface can be inferred from molecular area calculations. In turn, these estimates can be used to deduce information on the nature of the adsorbed state at sv interfaces from method I1 or I11 in which I'(sv) # 0.
Secure wetting parameter could not be obtained for HSA using methods I1 and I11 because of the adsorption-kinetics phenomena described in the previous section. Estimated T values from the hysteresis curves are shown in Figure 6 for comparison to Tween results, but data fitting proce- dures (see Theory) could not be sensibly applied to these sharp adhesion tension curves. Surface excess was cal- culated from method I 0 curves (not shown) as described in the companion paper to this series. Tween-80. Methods 1-111 TO parameters were discussed
previously under Sessile-Drop and Dynamic Contact Angles. The f parameters were roughly equivalent for Tween because T curves start and end at similar plateau values (Figure 5). However, the slope connectingplateaus, as measured by the N(sl, parameter, was much steeper for method I, and this steeper slope translates into greater surface excess values (compare rows 1 and 2 for method I under [I'cS1) - column 6 of Table 11, to rows 4 and 5 and 6 and 7 for methods I1 and 111, respectively). From the advancing and receding 0 measurements, 317 C I"(al) C 358 pmol/cm2 corresponding to between 46 and 52 A2/ molecule. This adsorbed area is considerably smaller than the 77 A2/molecule estimated from lv interfacial tensions. According to this interpretation which assumes l'(sv) = 0 for contact angle goniometry on these hydrophobic sur- faces, adsorption to a closely packed silane layer at the sl interface is more structured than that at the lv interface, leading to a higher packing density (see Figure 7B). This is in agreement with the general expectation from dis- persion theory which anticipates a slightly greater level of interaction between solute and a dense solid phase compared to the interaction with a relatively less-dense vapor phase.
By contrast to the sessile droplet in method I, fluid movement across solid surfaces during immersion and withdrawal modes of methods I1 and I11 creates micro- scopic flow fields that affect surfactant transport, accu- mulation, and adsorption at sl and lv interfaces.8~~ In addition to fluid flow, the meniscus can be affected by substrate vibration or oscillation while hanging in the balance, as well as by small ripples in the liquid. These factors provide a mechanism for depositing surfactant at the sv interface within the microenvironment of the advancing or receding sl line. Surfactant accumulation at the sv interface causes I'(sv) > 0 and, consequently, [I'(sl) - I'(sv)llll < [I'(al) - I'(,,.)I1 (compare rows 6 and 7 to rows 1 and 2 of column 6). Rapid and reversible adsorption of Tween to the sv interface also leads to the equivalence of results for methods I1 and 111, despite the fact that method I11 involves the immersion pretreatment (compare fitted values for T curves, rows 4-7 under columns 2-4 of Table 11, and surface excess values listed in rows 4-7 under column 6). As the virgin surface contacts liquid during the first immersion of method 11, sufficient Tween must
~ ~~
(7) Penn, L. S.; Miller, B. J. Colloid Interface Sci. 1980, 77, 574. (8) Padmanabhan, S.; Boee, A. J. Colloid Interface Sci. 1988,126,164. (9) Damania, B. S.; Bose, A. J. Colloid Interfuce Sci. 1986,113, 321.
2020 Langmuir, Vol. 8, No. 8, 1992
accumulate at the sv interface so that [I'(sl) - I'(8v)1111 = [I'(sl) - I'(sv)3rr. Of course, it is of no surprise that receding modes of methods I1 and I11 were identical since there is no operational difference between methods after the first immersion. It is interesting, however, that these receding [I'csl) - I'(av)l values were nearly half that calculated for the advancing mode and that this observation is in sharp contrast to results obtained by goniometry. If it is assumed that [I'(sl)lreC = [I'(sl)ladv, and there are no compelling reasons readily apparent to assume otherwise, then it must be concluded that [I'(sv)lm = 2[I'(Bv)l*dv to obtain these relative excess values. Possibly this is due to evaporative effects that accumulate Tween at the trailing liquid edge as the plate is removed from solution. These sv deposited molecules then become redissolved or at least rehydrated as the liquid front reverses direction in the advancing mode.
There is no independent means of estimating I'(d) values from method I11 7 curves since only the difference [I'(a - can be calculated. However, an insight into the adsorbed condition of surfactant at the sv interface can be obtained by making the assumption that I'(sl) estimated from the contact angle case (317-358 pmol/cm2) is a reasonable expectation value for I'(sl) of method 111. This allows a value for I'(sv) to be calculated by difference. First, for the receding mode in which surfactant deposition by evaporation is suspected, I'(sv) = 222 pmol/cm2 or 75 A2/molecule. This value is statistically identical to I'(lV) = 77 AVmolecule obtained from the y(lv) curve. Estimates for the advancing mode yield a much reduced packing density of 189A2/molecule (I'(sv) = 87.8 pmol/cm2), possibly reflecting partial dissolution and hydration effects at the slv line due to the advancing liquid front. Relationships for these adsorbed areas at different interfaces are sketched in Figure 7.
Human Serum Albumin. As mentioned previously, secure wetting parameters could be obtained for HSA only for method I. Estimated advancingandreceding I'(@l) were 92 and 110 pmol/cm2, respectively, corresponding to 181 and 151 A2/molecule. This adsorbed area is quite close to the 170 A2/molecule measured at the lv interface. Ac- cording to the interpretation of sl interfacial measure- menta in which it is assumed that I'(sv) = 0, the configuration
Vogler
of adsorbed HSA is about the same at sl and lv interfaces. This conclusion is in contrast to the results obtained with Tween for which a higher packing density at the el interface was inferred from tension measurements. Possibly, a folded tertiary structure of the larger protein molecule will not allow reconfiguration into a more "packable" unit area at either lv or sl surfaces whereas Tween molecules can adjust to accommodate more molecules in close proximity at the sl interface.
Conclusions The surface excess parameter [I'(Bl, - I'(8v)l, which
simultaneously measures adsorption to solid-liquid (sl) and solid-vapor (sv) interfaces, can be interpreted directly in terms of sl adsorption to nonwettable surfaces when measured by contact angle goniometry if special exper- imental care is taken to avoid vibrations and evaporation. The tilting-stage technique for goniometric measurement of advancing angles yields results that agree with dynamic angle measurements made by Wilhelmy balance tensi- ometry. Results for receding angles are less clear, and more studies are required to make definitive statements regarding equivalence of sessile and dynamic receding contact angles. Surfactant deposition at sv interfaces is uncontrolled in Wilhelmy balance tensiometry so that [I'w) - measurements can not be unambiguously inter- preted in terms of I'(d) alone. Insight into the adsorbed molecular state at both sv and sl interfaces can be deduced by comparison of contact angle and Wilhelmy balance measurements. Concentration-dependent contact angles provide a unique measure of el adsorption that has potential in biomaterials research applications involving proteins.
Acknowledgment, I am indebted to Dr. R. E. Johnson, Professor P. Kilpatrick, and Mr. D. A. Martin for many helpful discussions. Dr. D. B. Montgomery kindly pro- vided the plasma apparatus for surface oxidations. The expert technical assistance of Ms. J. Graper and Mr. H. Sugg is gratefully acknowledged.
Registry No. Tween 80, 9006-66-6; octadecyleilane, 18623- 11-5.