Embed Size (px)
Citation preview
Practical Procedures For Practical Procedures For Evaluating Crop Insurance Policies Evaluating Crop Insurance Policies
That Trigger On County YieldThat Trigger On County Yield
Ben Chaffin, Graduate Research AssistantBen Chaffin, Graduate Research AssistantJ. Roy Black, ProfessorJ. Roy Black, Professor
Department of Agricultural EconomicsDepartment of Agricultural EconomicsXiaobin Cao, Graduate Research Assistant, Xiaobin Cao, Graduate Research Assistant,
Agricultural Economics/StatisticsAgricultural Economics/StatisticsMichigan State UniversityMichigan State University
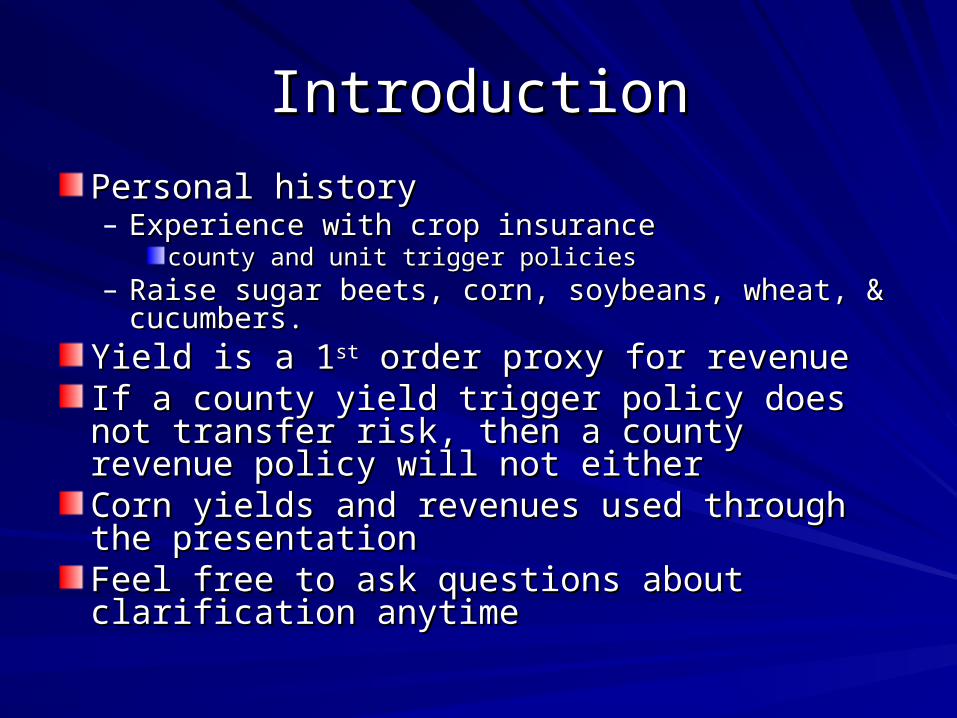
IntroductionIntroduction
Personal historyPersonal history– Experience with crop insuranceExperience with crop insurance
county and unit trigger policiescounty and unit trigger policies– Raise sugar beets, corn, soybeans, wheat, & Raise sugar beets, corn, soybeans, wheat, &
cucumbers.cucumbers.
Yield is a 1Yield is a 1stst order proxy for revenue order proxy for revenueIf a county yield trigger policy does not transfer If a county yield trigger policy does not transfer risk, then a county revenue policy will not eitherrisk, then a county revenue policy will not eitherCorn yields and revenues used through the Corn yields and revenues used through the presentationpresentationFeel free to ask questions about clarification Feel free to ask questions about clarification anytimeanytime
Research ObjectivesResearch Objectives
To increase knowledge of county trigger To increase knowledge of county trigger crop insurance policiescrop insurance policies
To provide better tools to support farmers To provide better tools to support farmers in insurance purchase decisionin insurance purchase decision
Target AudienceTarget Audience
FarmersFarmers
Lenders Lenders
Insurance agentsInsurance agents
Extension staffExtension staff
Trade association representativesTrade association representatives
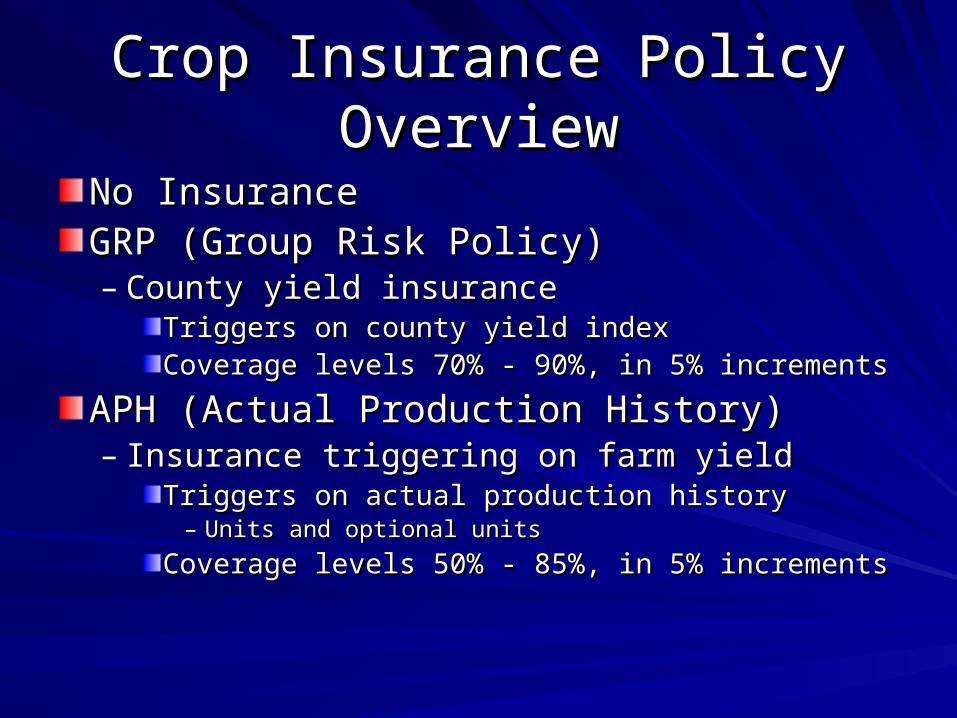
Crop Insurance Policy OverviewCrop Insurance Policy Overview
No InsuranceNo InsuranceGRP (Group Risk Policy)GRP (Group Risk Policy)– County yield insuranceCounty yield insurance
Triggers on county yield indexTriggers on county yield indexCoverage levels 70% - 90%, in 5% incrementsCoverage levels 70% - 90%, in 5% increments
APH (Actual Production History)APH (Actual Production History)– Insurance triggering on farm yieldInsurance triggering on farm yield
Triggers on actual production history Triggers on actual production history – Units and optional unitsUnits and optional units
Coverage levels 50% - 85%, in 5% incrementsCoverage levels 50% - 85%, in 5% increments
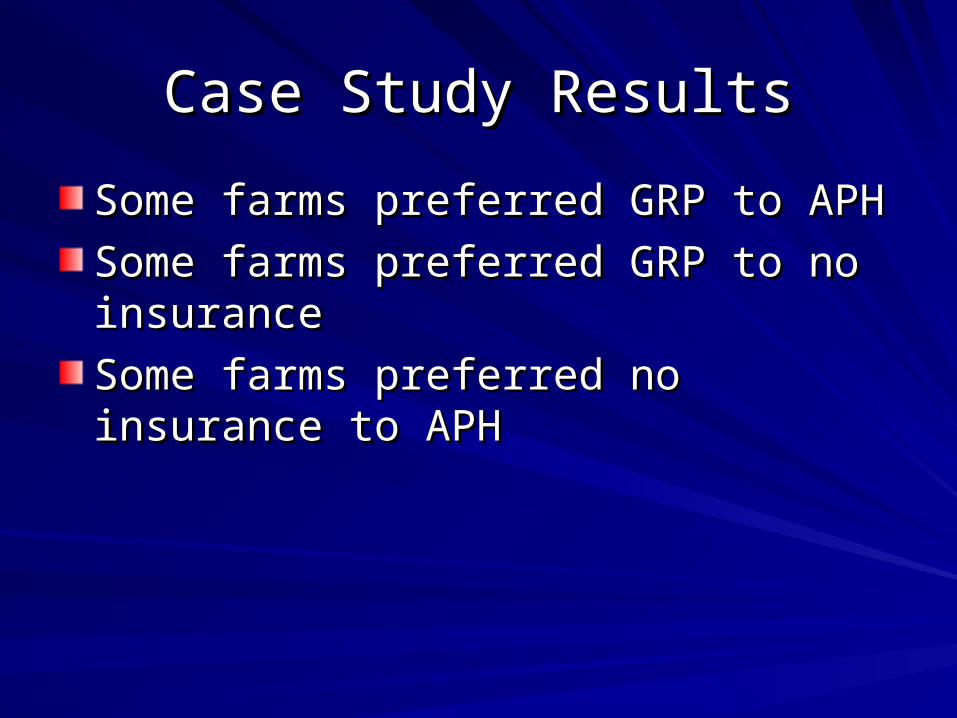
Case Study ResultsCase Study Results
Some farms preferred GRP to APHSome farms preferred GRP to APH
Some farms preferred GRP to no Some farms preferred GRP to no insuranceinsurance
Some farms preferred no insurance to Some farms preferred no insurance to APHAPH
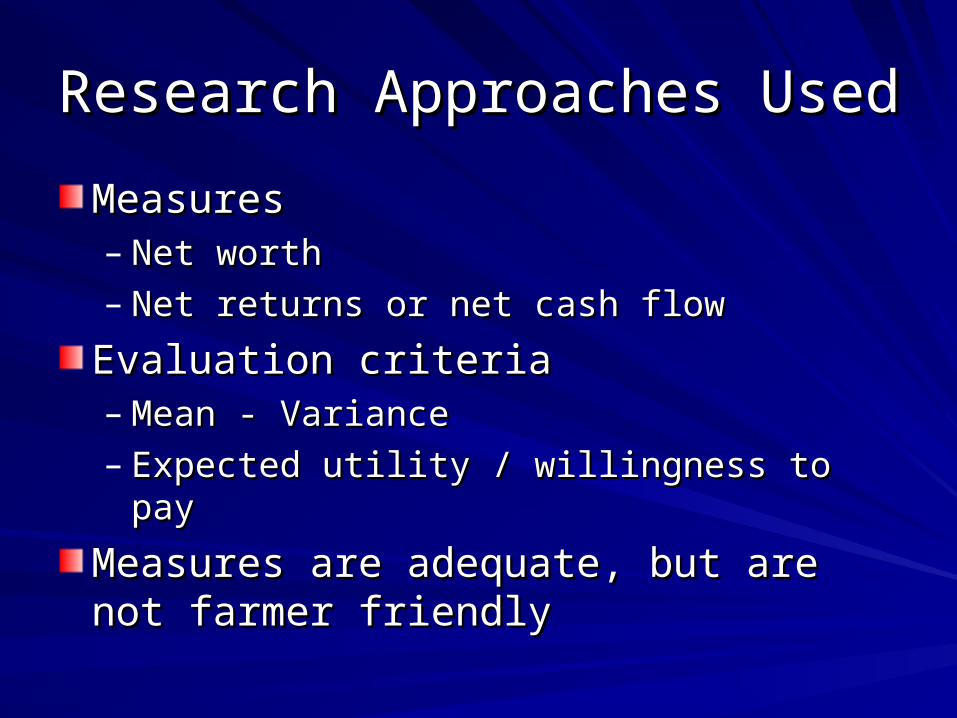
Research Approaches UsedResearch Approaches Used
MeasuresMeasures– Net worthNet worth– Net returns or net cash flowNet returns or net cash flow
Evaluation criteriaEvaluation criteria– Mean - Variance Mean - Variance – Expected utility / willingness to payExpected utility / willingness to pay
Measures are adequate, but are not Measures are adequate, but are not farmer friendlyfarmer friendly
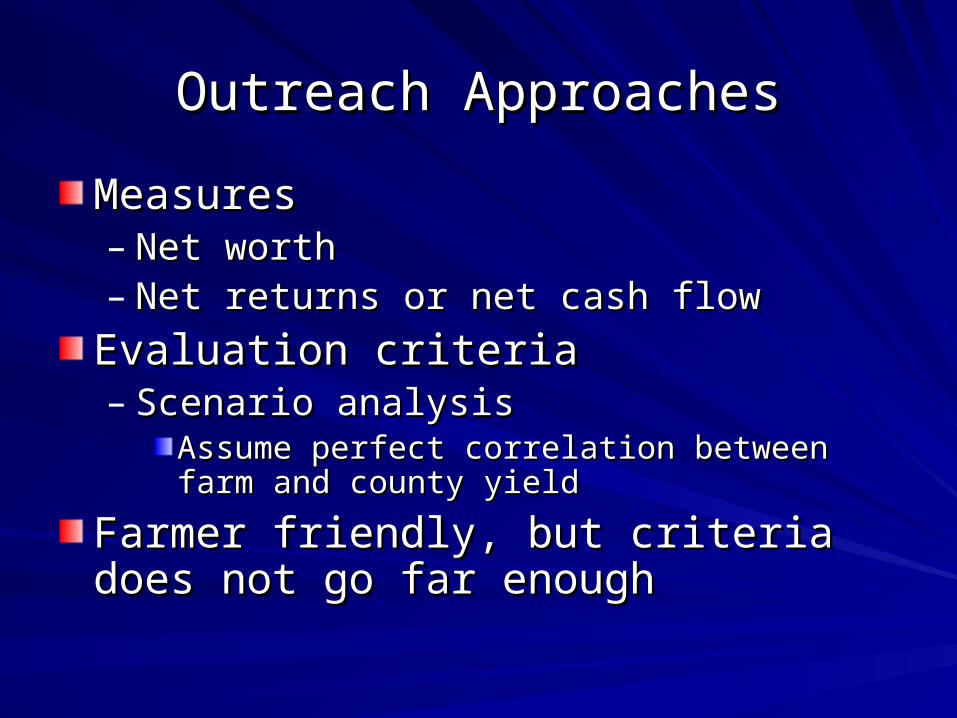
Outreach ApproachesOutreach Approaches
MeasuresMeasures– Net worthNet worth– Net returns or net cash flow Net returns or net cash flow
Evaluation criteriaEvaluation criteria– Scenario analysisScenario analysis
Assume perfect correlation between farm and Assume perfect correlation between farm and county yieldcounty yield
Farmer friendly, but criteria does not go far Farmer friendly, but criteria does not go far enoughenough
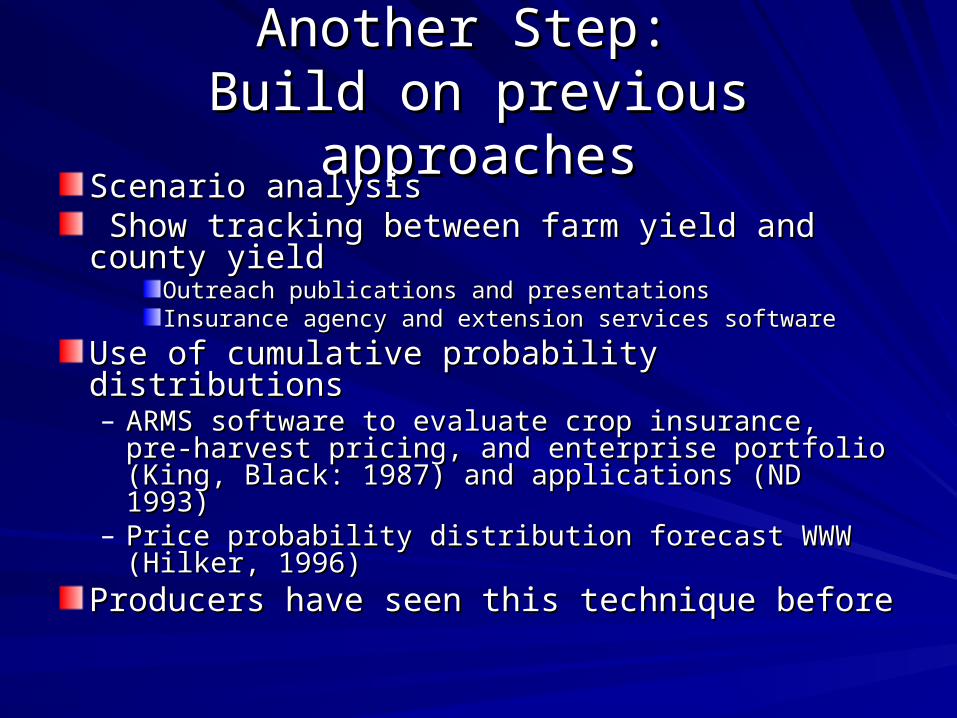
Another Step: Another Step: Build on previous approachesBuild on previous approaches
Scenario analysisScenario analysis Show tracking between farm yield and county Show tracking between farm yield and county yield yield
Outreach publications and presentationsOutreach publications and presentationsInsurance agency and extension services softwareInsurance agency and extension services software
Use of cumulative probability distributionsUse of cumulative probability distributions– ARMS software to evaluate crop insurance, pre-ARMS software to evaluate crop insurance, pre-
harvest pricing, and enterprise portfolio (King, Black: harvest pricing, and enterprise portfolio (King, Black: 1987) and applications (ND 1993)1987) and applications (ND 1993)
– Price probability distribution forecast WWW (Hilker, Price probability distribution forecast WWW (Hilker, 1996)1996)
Producers have seen this technique beforeProducers have seen this technique before
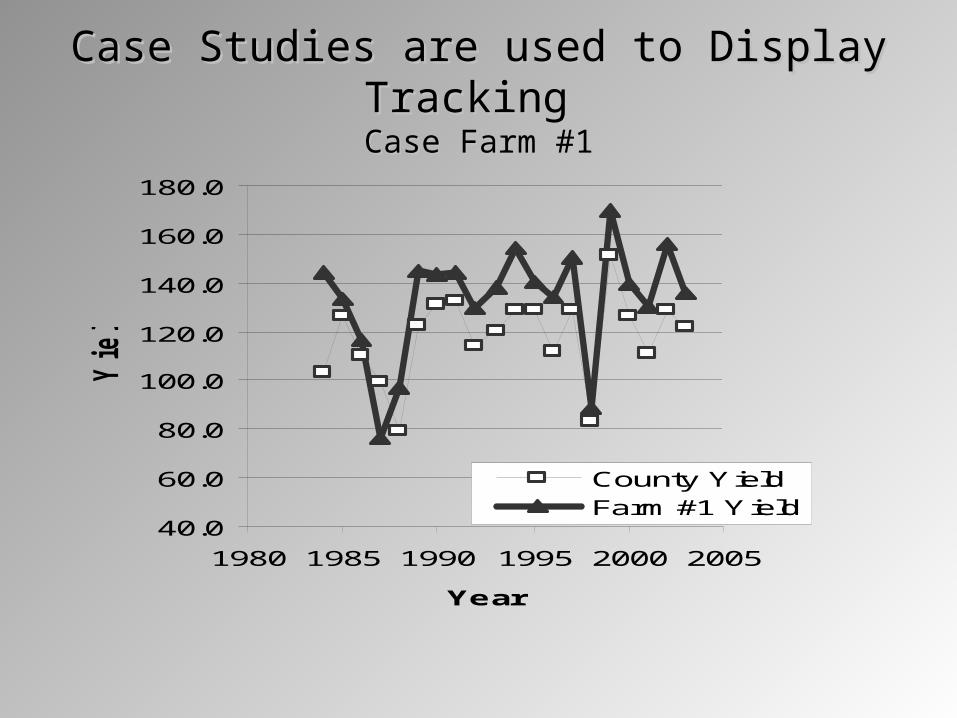
Case Studies are used to Display Tracking Case Studies are used to Display Tracking Case Farm #1Case Farm #1
40.0
60.0
80.0
100.0
120.0
140.0
160.0
180.0
1980 1985 1990 1995 2000 2005
Year
Yield
County YieldFarm #1 Yield
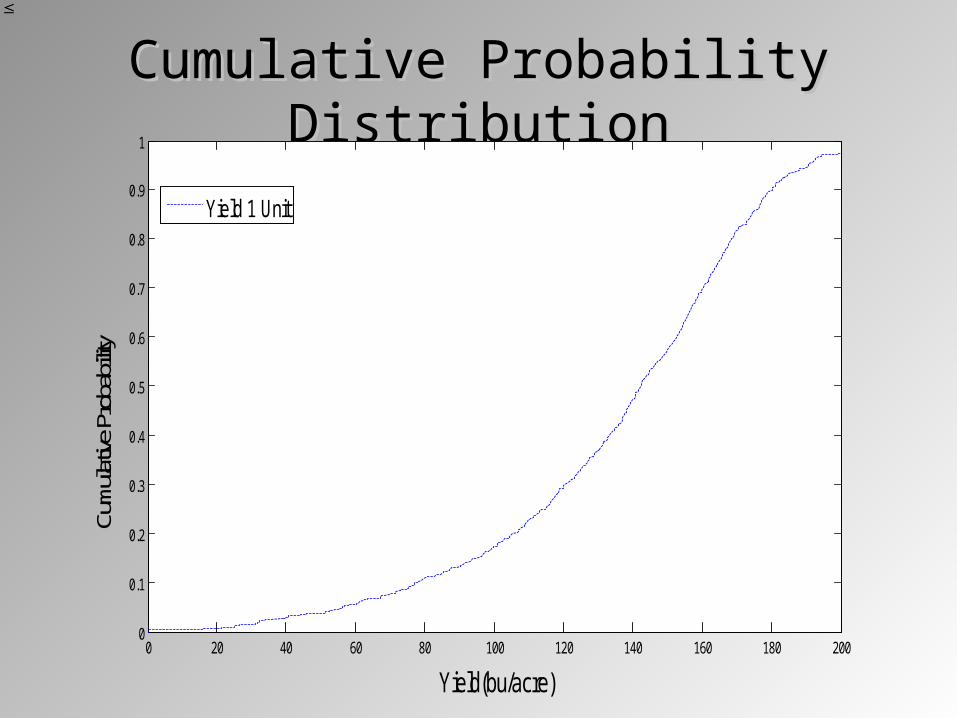
Cumulative Probability DistributionCumulative Probability Distribution
0 20 40 60 80 100 120 140 160 180 2000
0.1
0.2
0.3
0.4
0.5
0.6
0.7
0.8
0.9
1
Yield(bu/acre)
Cum
ulativ
e Pr
obab
ility
Yield 1 Unit
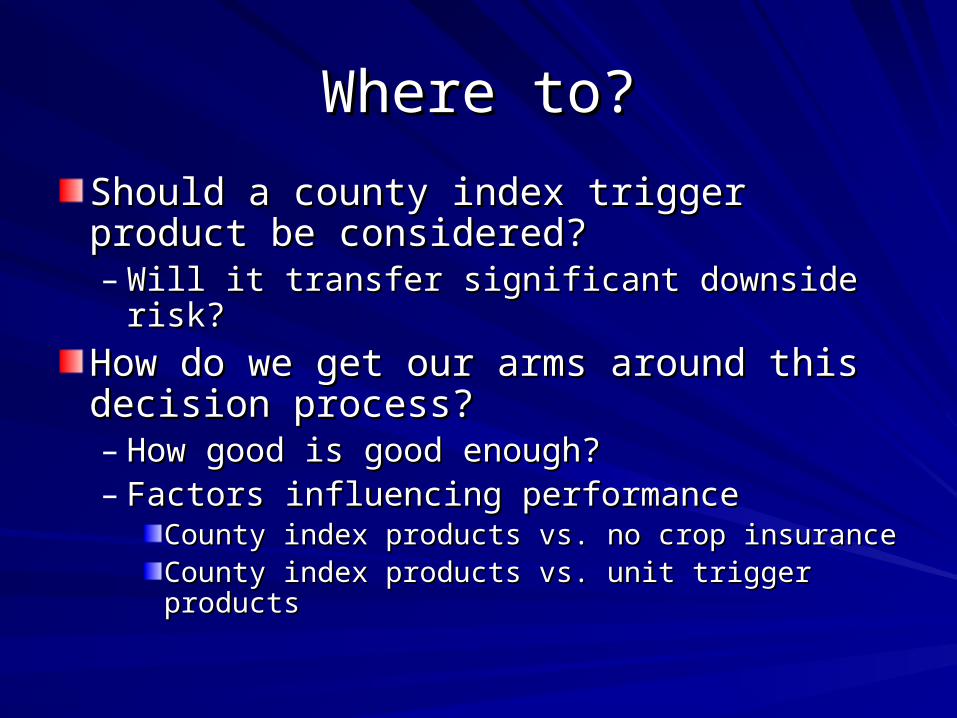
Where to?Where to?
Should a county index trigger product be Should a county index trigger product be considered?considered?– Will it transfer significant downside risk?Will it transfer significant downside risk?
How do we get our arms around this How do we get our arms around this decision process?decision process?– How good is good enough?How good is good enough?– Factors influencing performance Factors influencing performance
County index products vs. no crop insuranceCounty index products vs. no crop insuranceCounty index products vs. unit trigger productsCounty index products vs. unit trigger products
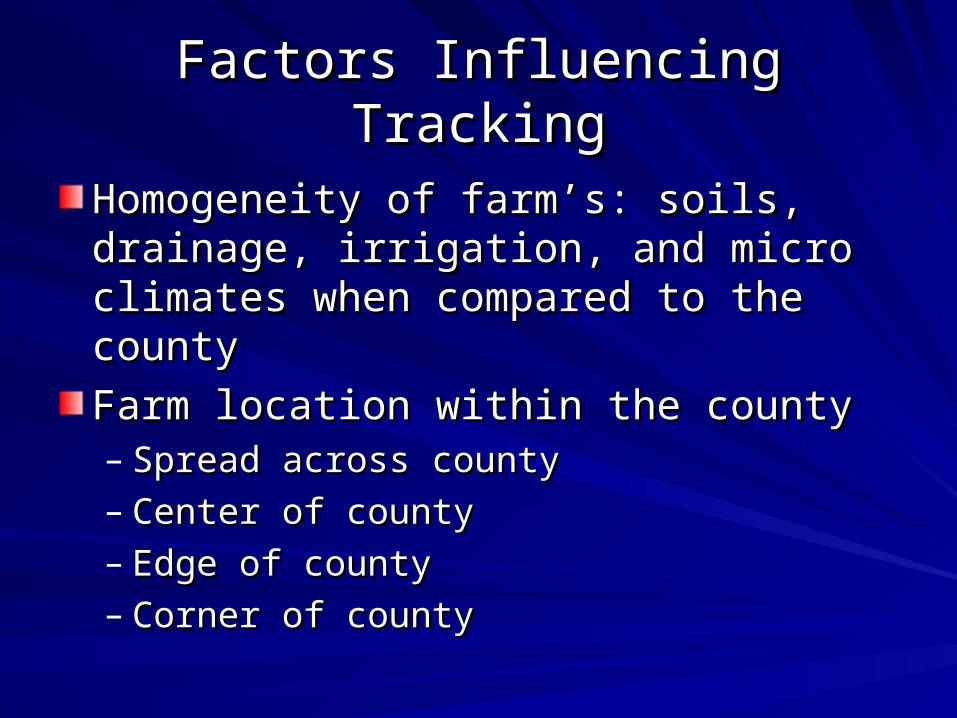
Factors Influencing TrackingFactors Influencing Tracking
Homogeneity of farm’s: soils, drainage, Homogeneity of farm’s: soils, drainage, irrigation, and micro climates when irrigation, and micro climates when compared to the countycompared to the county
Farm location within the countyFarm location within the county– Spread across countySpread across county– Center of countyCenter of county– Edge of countyEdge of county– Corner of countyCorner of county
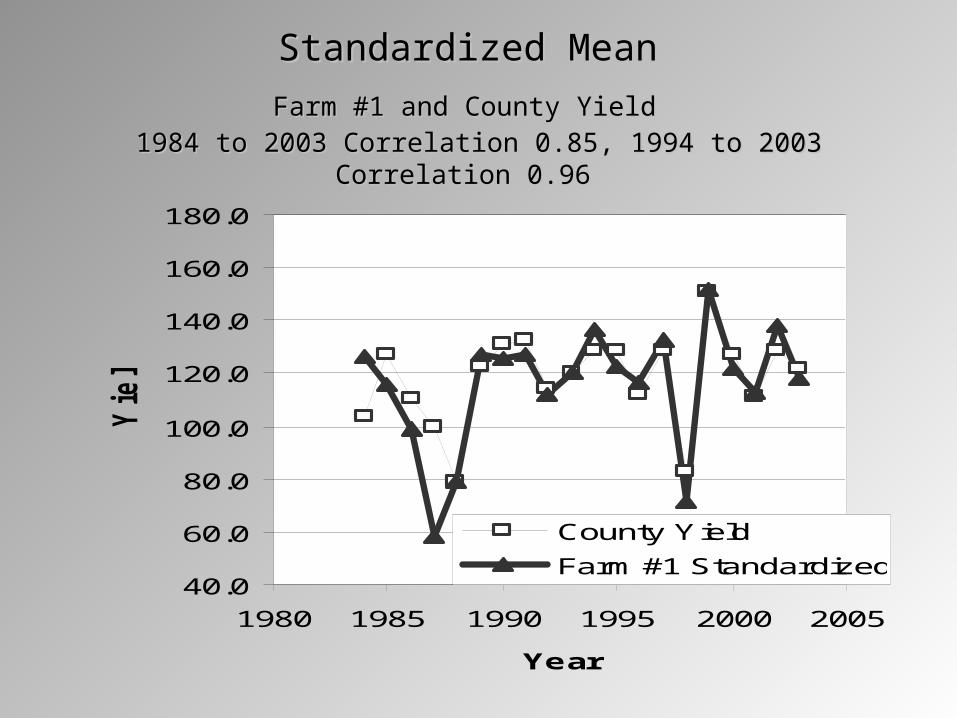
Standardized Mean Standardized Mean
Farm #1 and County YieldFarm #1 and County Yield 1984 to 2003 1984 to 2003 Correlation 0.Correlation 0.85, 1994 to 2003 Correlation 0.96 85, 1994 to 2003 Correlation 0.96
40.0
60.0
80.0
100.0
120.0
140.0
160.0
180.0
1980 1985 1990 1995 2000 2005
Year
Yield
County Yield
Farm #1 Standardized
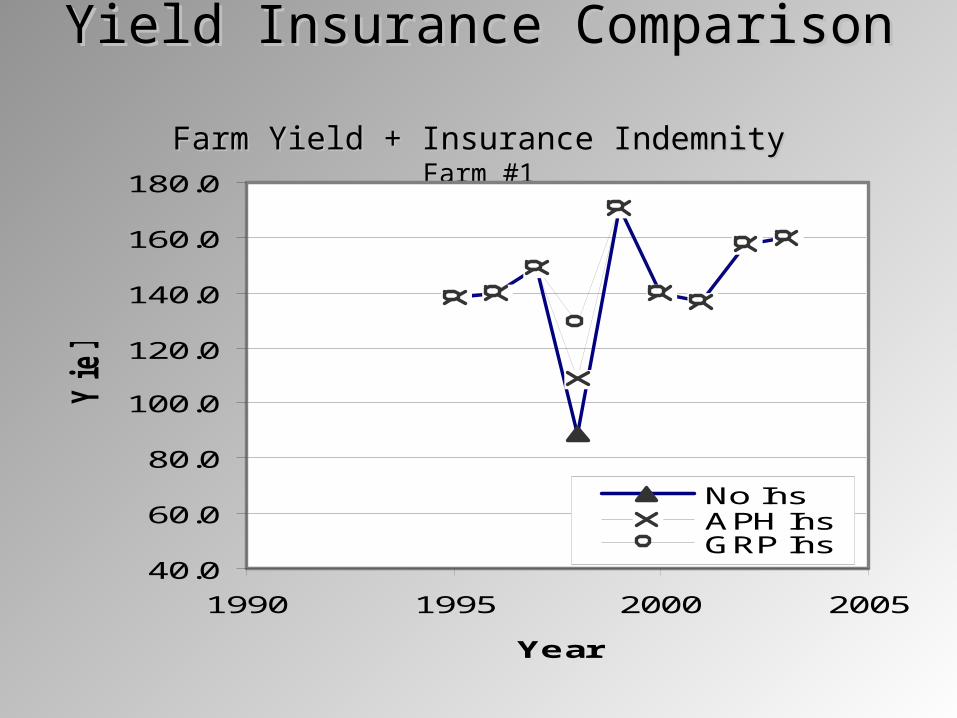
Yield Insurance Comparison Yield Insurance Comparison Farm Yield + Insurance IndemnityFarm Yield + Insurance Indemnity
Farm #1Farm #1
40.0
60.0
80.0
100.0
120.0
140.0
160.0
180.0
1990 1995 2000 2005
Year
Yield
No InsAPH InsGRP Ins
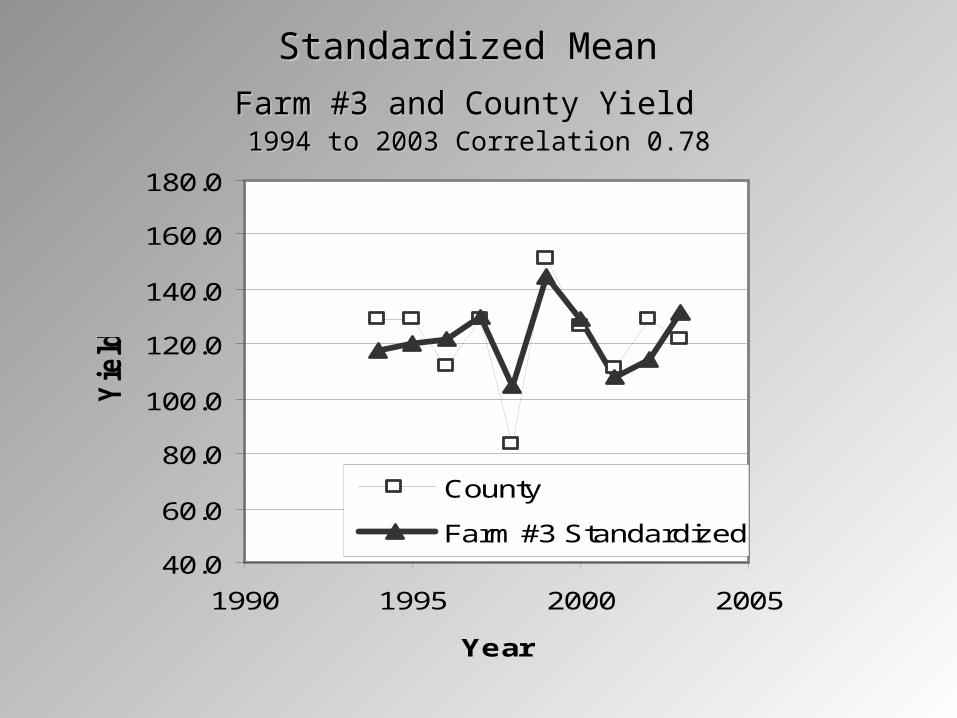
Standardized Mean Standardized Mean
Farm #3 and County YieldFarm #3 and County Yield 1994 to 2003 Correlation 0.781994 to 2003 Correlation 0.78
40.0
60.0
80.0
100.0
120.0
140.0
160.0
180.0
1990 1995 2000 2005
Year
Yield
County
Farm #3 Standardized
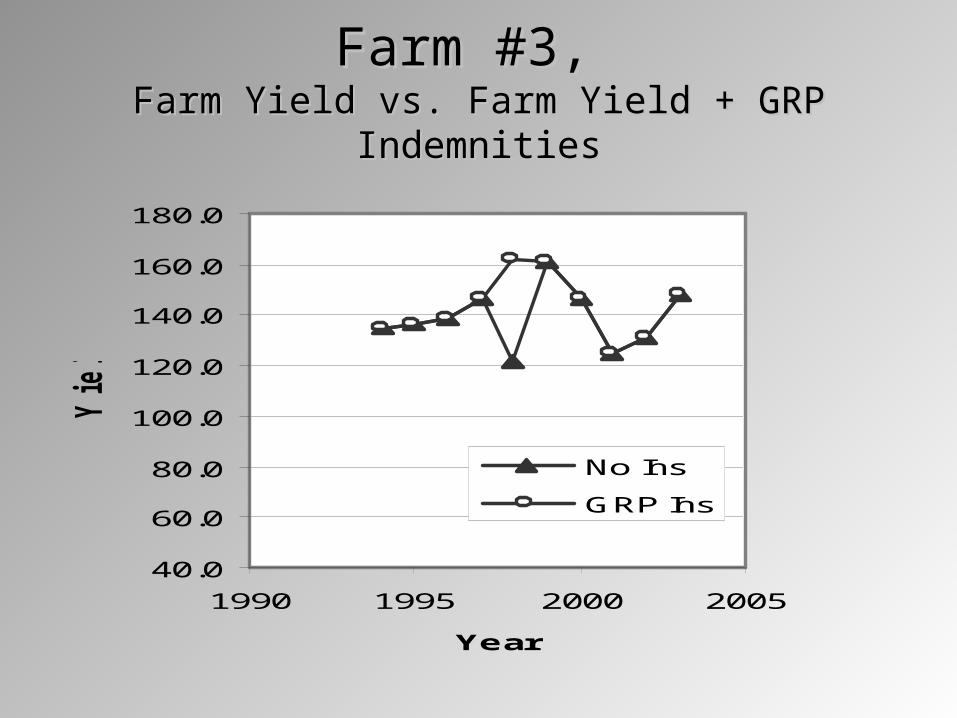
Farm #3, Farm #3, Farm Yield vs. Farm Yield + GRP IndemnitiesFarm Yield vs. Farm Yield + GRP Indemnities
40.0
60.0
80.0
100.0
120.0
140.0
160.0
180.0
1990 1995 2000 2005
Year
Yield
No Ins
GRP Ins

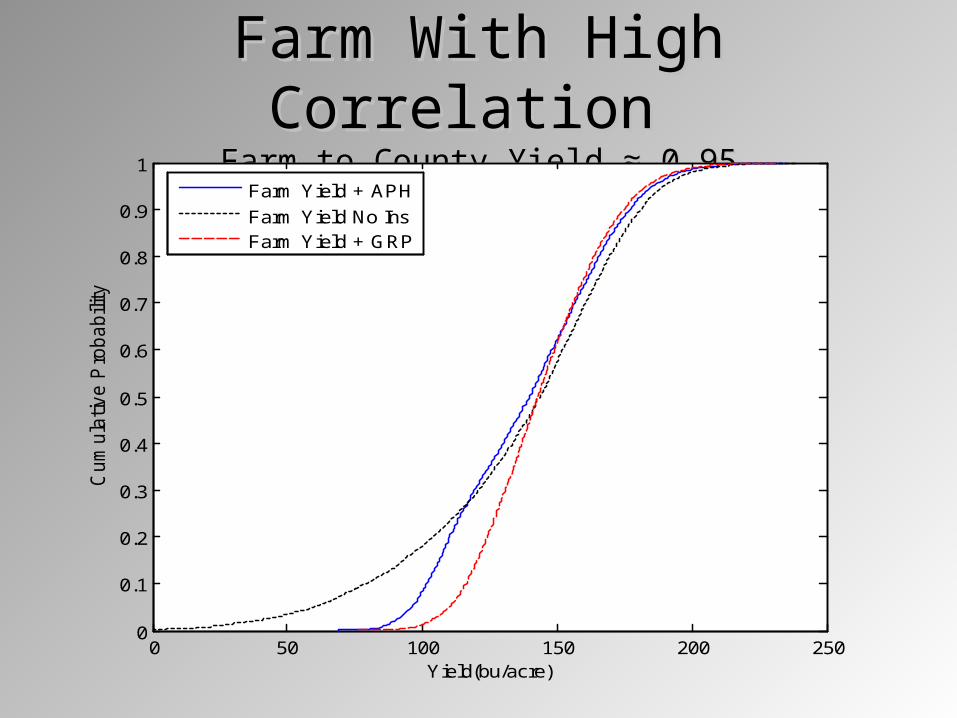
Farm With High Correlation Farm With High Correlation Farm to County Yield Farm to County Yield ≈ ≈ 0.950.95
0 50 100 150 200 2500
0.1
0.2
0.3
0.4
0.5
0.6
0.7
0.8
0.9
1
Yield(bu/acre)
Cum
ula
tive P
robabili
ty
Farm Yield + APH
Farm Yield No InsFarm Yield + GRP

Farm With Low CorrelationFarm With Low Correlation Farm to County Yield Farm to County Yield ≈ ≈ 0.800.80
0 20 40 60 80 100 120 140 160 180 2000
0.1
0.2
0.3
0.4
0.5
0.6
0.7
0.8
0.9
1
Yield(bu/acre)
Cum
ula
tive P
robabili
ty
Farm Yield + APH
Farm Yield No InsFarm Yield + GRP
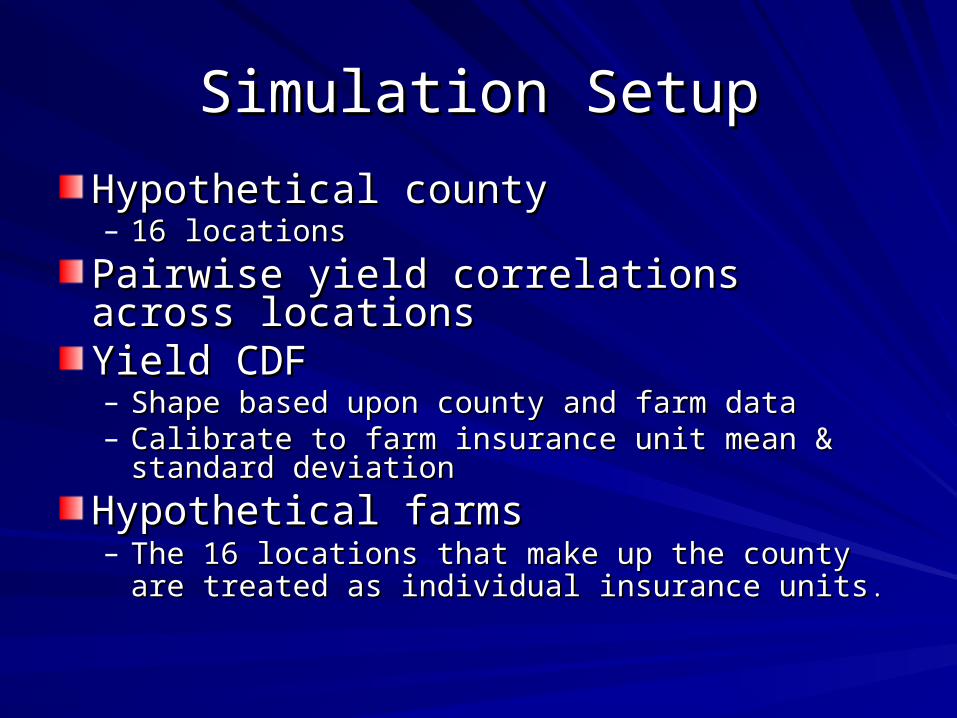
Simulation SetupSimulation Setup
Hypothetical countyHypothetical county– 16 locations16 locations
Pairwise yield correlations across Pairwise yield correlations across locationslocationsYield CDFYield CDF– Shape based upon county and farm dataShape based upon county and farm data– Calibrate to farm insurance unit mean & standard Calibrate to farm insurance unit mean & standard
deviationdeviation
Hypothetical farms Hypothetical farms – The 16 locations that make up the county are treated The 16 locations that make up the county are treated
as individual insurance unitsas individual insurance units..
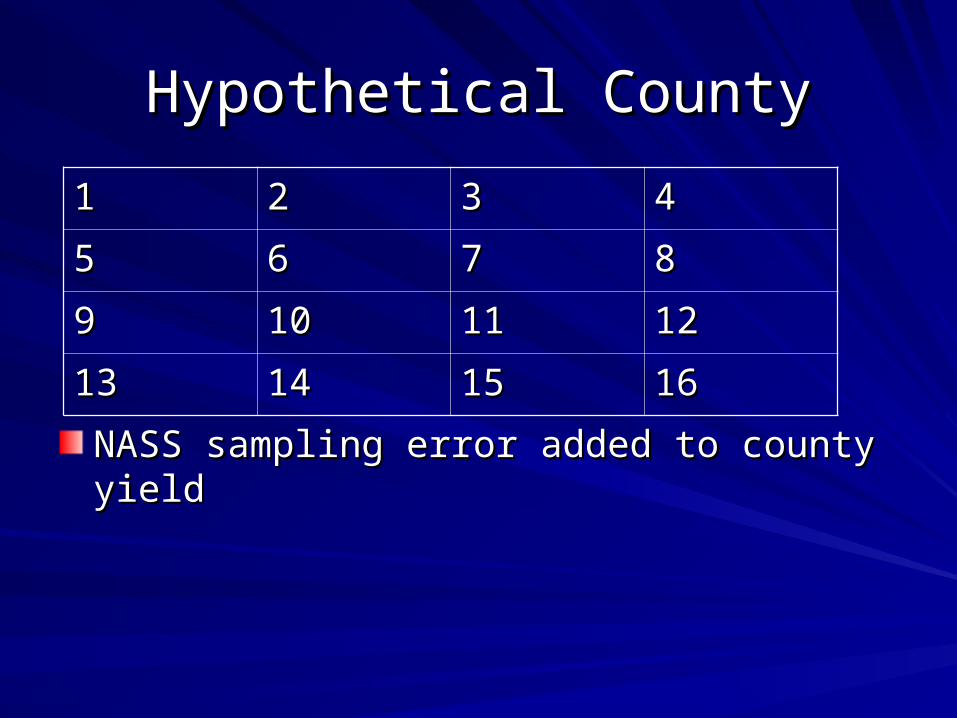
Hypothetical CountyHypothetical County
NASS sampling error added to county yield NASS sampling error added to county yield
11 22 33 44
55 66 77 88
99 1010 1111 1212
1313 1414 1515 1616
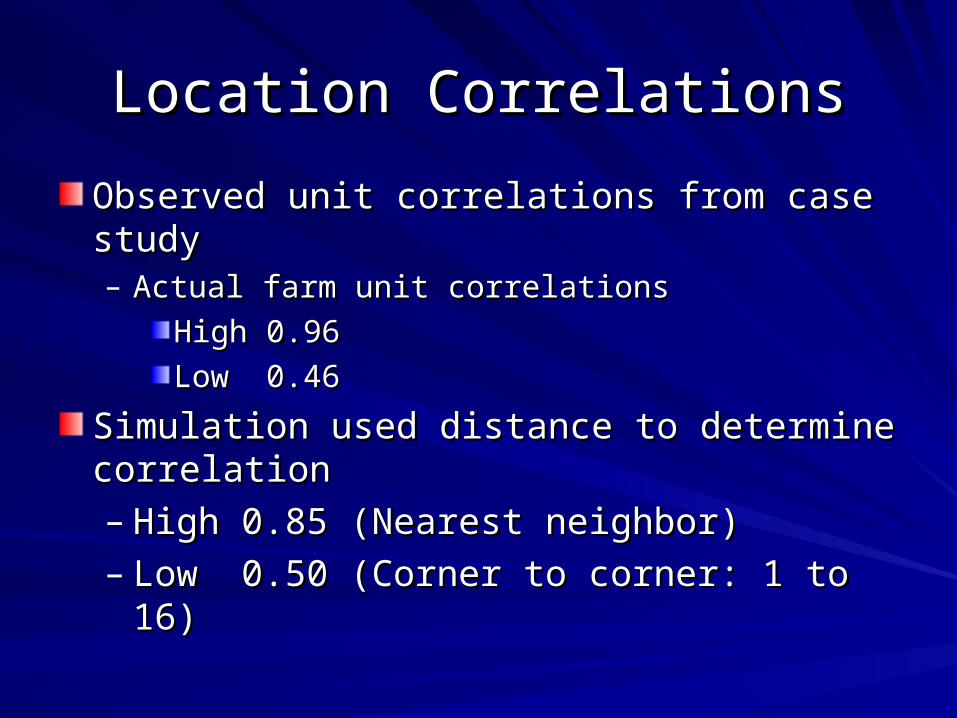
Location CorrelationsLocation Correlations
Observed unit correlations from case studyObserved unit correlations from case study– Actual farm unit correlationsActual farm unit correlations
High 0.96High 0.96
Low 0.46Low 0.46
Simulation used distance to determine Simulation used distance to determine correlationcorrelation– High 0.85 (Nearest neighbor)High 0.85 (Nearest neighbor)– Low 0.50 (Corner to corner: 1 to 16)Low 0.50 (Corner to corner: 1 to 16)
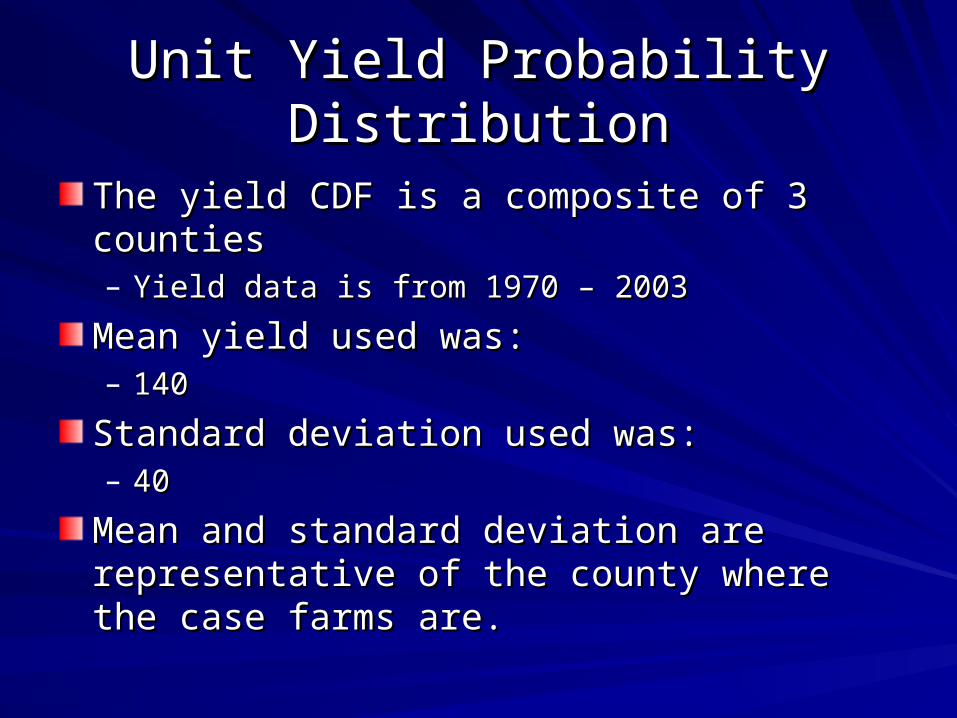
Unit Yield Probability DistributionUnit Yield Probability Distribution
The yield CDF is a composite of 3 countiesThe yield CDF is a composite of 3 counties– Yield data is from 1970 – 2003Yield data is from 1970 – 2003
Mean yield used was: Mean yield used was: – 140140
Standard deviation used was:Standard deviation used was:– 4040
Mean and standard deviation are representative Mean and standard deviation are representative of the county where the case farms are. of the county where the case farms are.
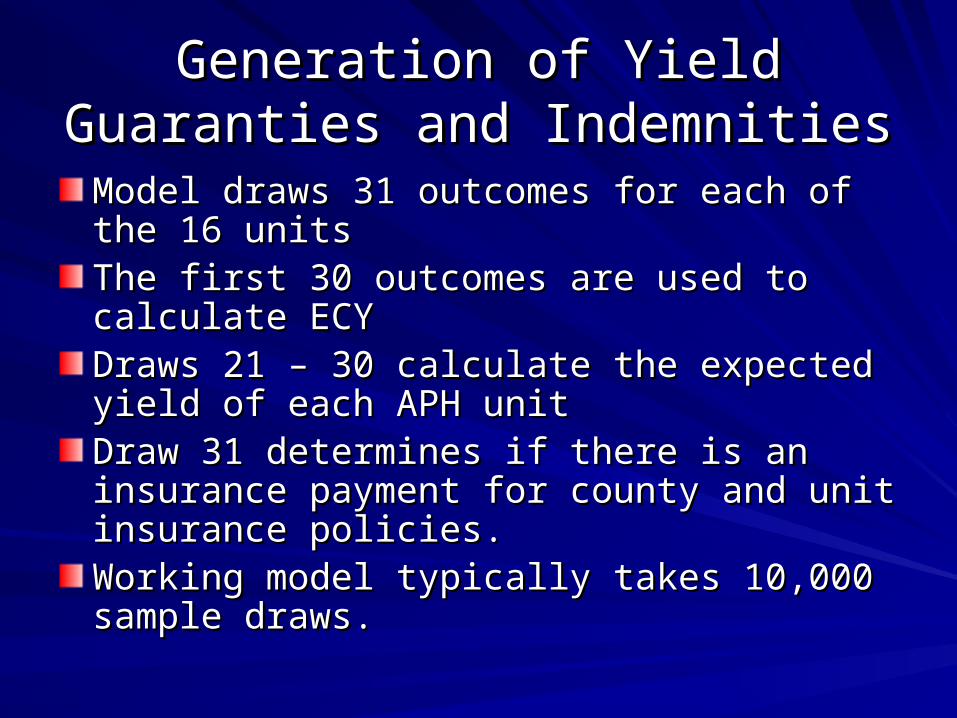
Generation of Yield Guaranties and Generation of Yield Guaranties and Indemnities Indemnities
Model draws 31 outcomes for each of the 16 Model draws 31 outcomes for each of the 16 unitsunitsThe first 30 outcomes are used to calculate ECYThe first 30 outcomes are used to calculate ECYDraws 21 – 30 calculate the expected yield of Draws 21 – 30 calculate the expected yield of each APH uniteach APH unitDraw 31 determines if there is an insurance Draw 31 determines if there is an insurance payment for county and unit insurance policies.payment for county and unit insurance policies.Working model typically takes 10,000 sample Working model typically takes 10,000 sample draws.draws.
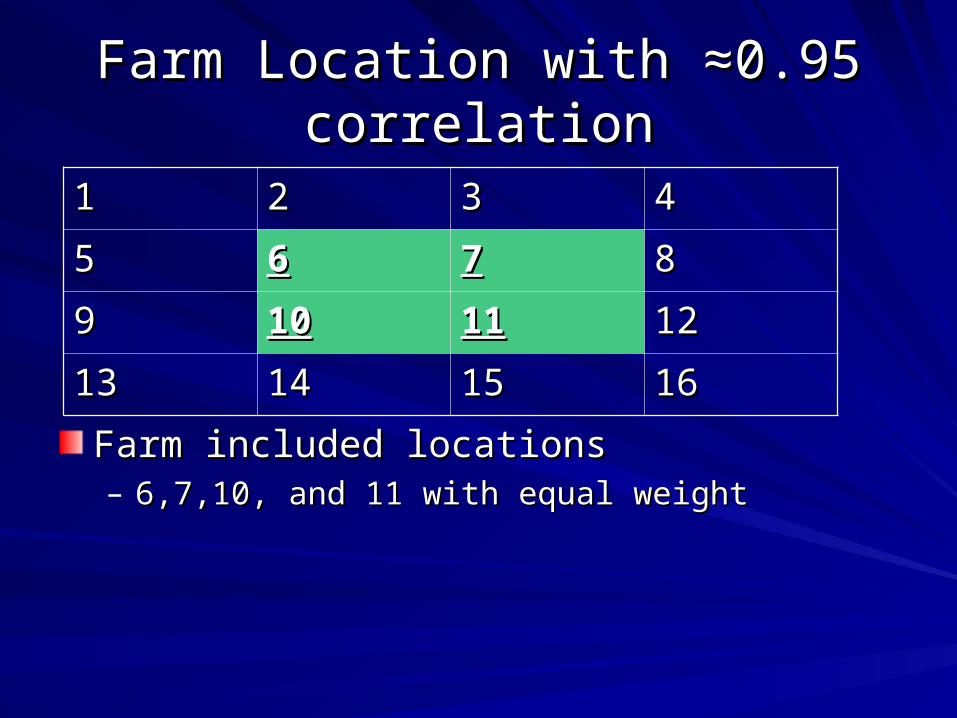
Farm Location with Farm Location with ≈0.95 ≈0.95 correlationcorrelation
Farm included locations Farm included locations – 6,7,10, and 11 with equal weight6,7,10, and 11 with equal weight
11 22 33 44
55 66 77 88
99 1010 1111 1212
1313 1414 1515 1616
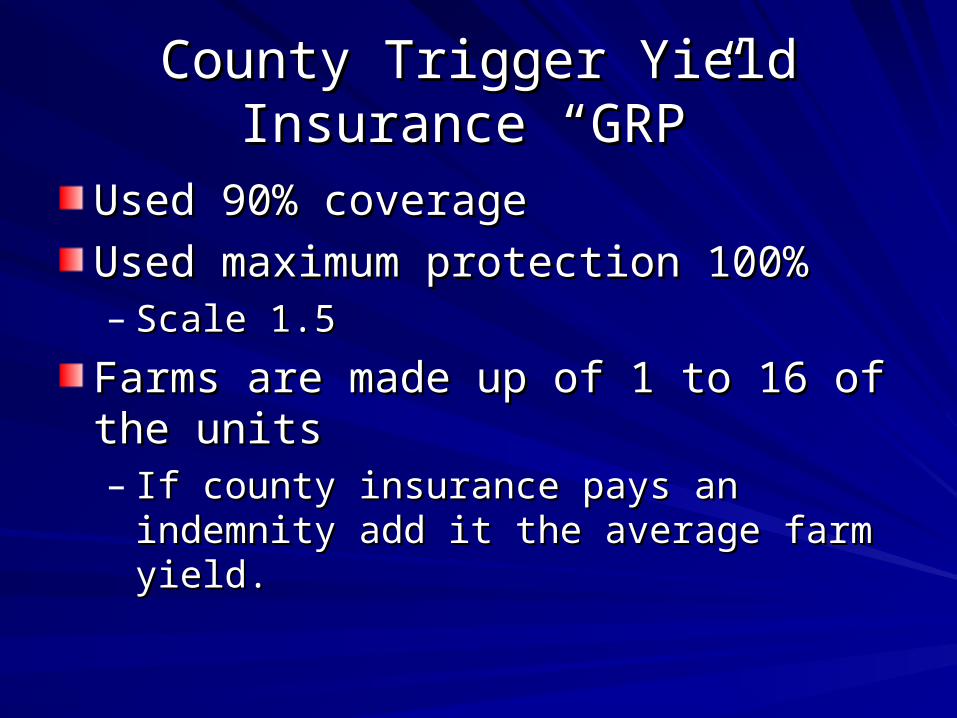
County Trigger Yield Insurance County Trigger Yield Insurance “GRP”“GRP”
Used 90% coverageUsed 90% coverage
Used maximum protection 100%Used maximum protection 100%– Scale 1.5Scale 1.5
Farms are made up of 1 to 16 of the unitsFarms are made up of 1 to 16 of the units– If county insurance pays an indemnity add it If county insurance pays an indemnity add it
the average farm yield. the average farm yield.
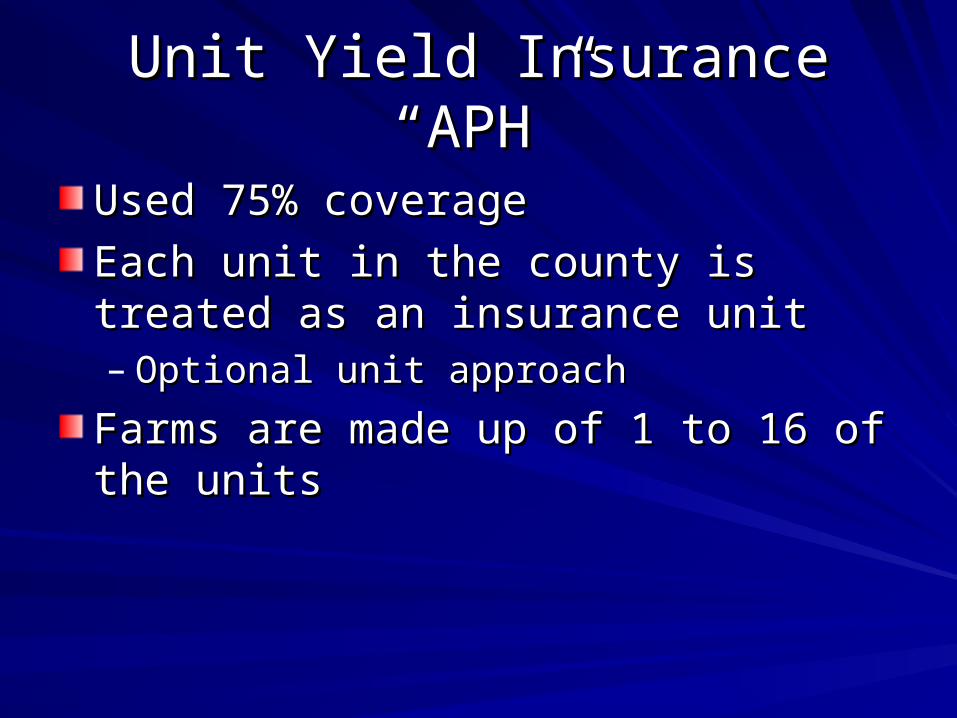
Unit Yield Insurance “APH”Unit Yield Insurance “APH”
Used 75% coverageUsed 75% coverage
Each unit in the county is treated as an Each unit in the county is treated as an insurance unitinsurance unit– Optional unit approachOptional unit approach
Farms are made up of 1 to 16 of the unitsFarms are made up of 1 to 16 of the units
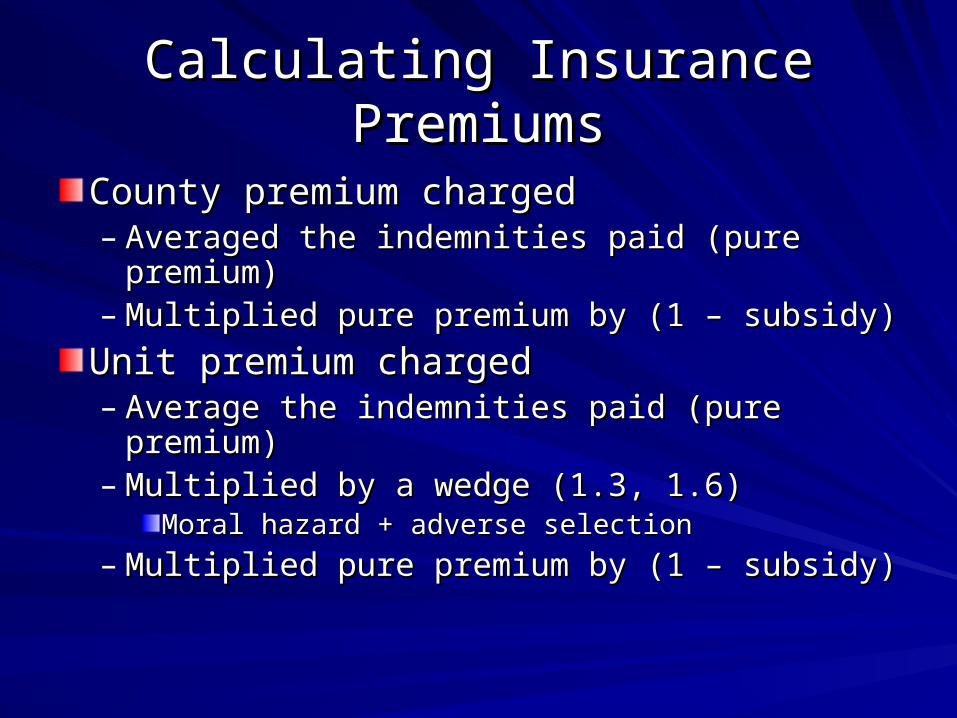
Calculating Insurance PremiumsCalculating Insurance Premiums
County premium chargedCounty premium charged– Averaged the indemnities paid (pure Averaged the indemnities paid (pure
premium)premium)– Multiplied pure premium by (1 – subsidy)Multiplied pure premium by (1 – subsidy)
Unit premium chargedUnit premium charged– Average the indemnities paid (pure premium)Average the indemnities paid (pure premium)– Multiplied by a wedge (1.3, 1.6)Multiplied by a wedge (1.3, 1.6)
Moral hazard + adverse selectionMoral hazard + adverse selection
– Multiplied pure premium by (1 – subsidy)Multiplied pure premium by (1 – subsidy)
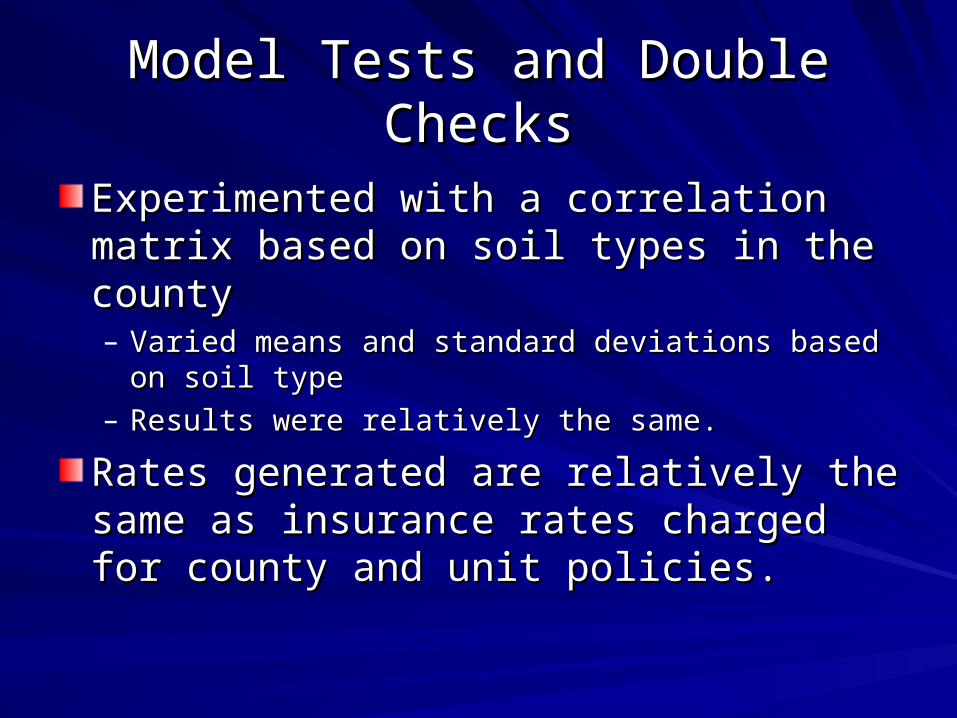
Model Tests and Double ChecksModel Tests and Double Checks
Experimented with a correlation matrix Experimented with a correlation matrix based on soil types in the countybased on soil types in the county– Varied means and standard deviations based on soil Varied means and standard deviations based on soil
typetype– Results were relatively the same. Results were relatively the same.
Rates generated are relatively the same Rates generated are relatively the same as insurance rates charged for county and as insurance rates charged for county and unit policies. unit policies.
Farm With High Correlation Farm With High Correlation Farm to County Yield Farm to County Yield ≈ ≈ 0.950.95
0 50 100 150 200 2500
0.1
0.2
0.3
0.4
0.5
0.6
0.7
0.8
0.9
1
Yield(bu/acre)
Cum
ula
tive P
robabili
ty
Farm Yield + APH
Farm Yield No InsFarm Yield + GRP
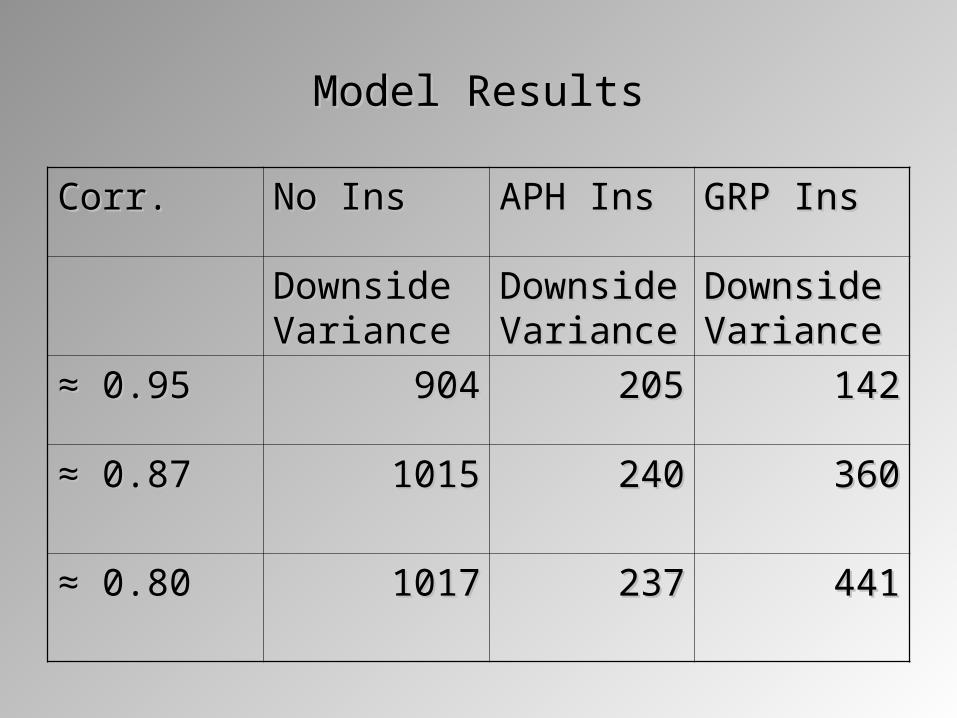
Model ResultsModel Results
Corr.Corr. No InsNo Ins APH Ins APH Ins GRP InsGRP Ins
Downside Downside VarianceVariance
Downside Downside VarianceVariance
Downside Downside VarianceVariance
≈ ≈ 0.950.95 904904 205205 142142
≈ ≈ 0.870.87 10151015 240240 360360
≈ ≈ 0.800.80 10171017 237237 441441
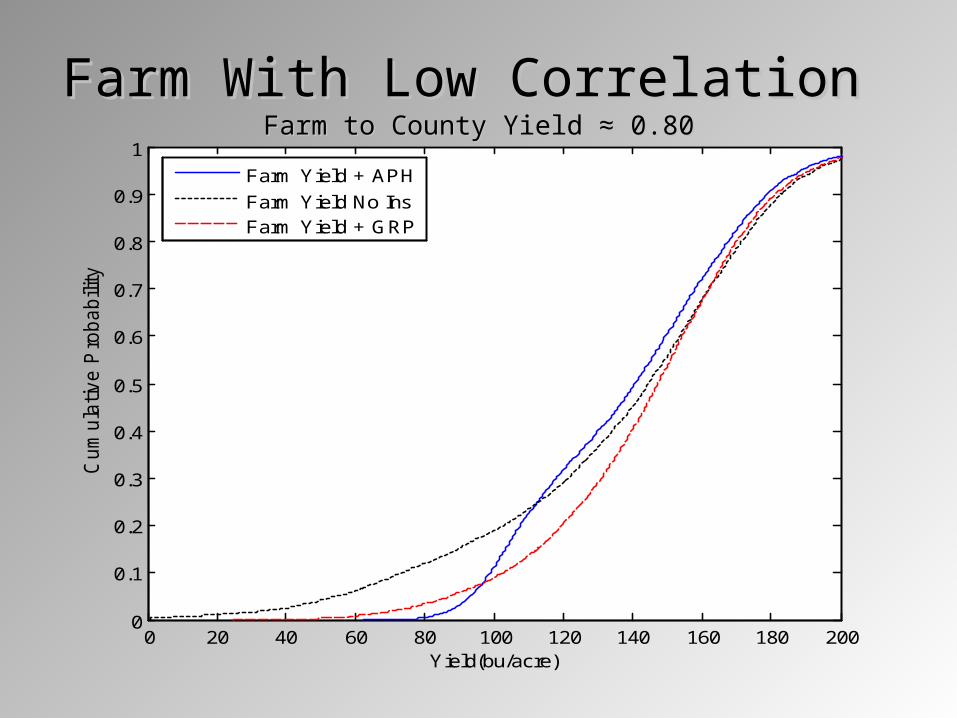
Farm With Low CorrelationFarm With Low Correlation Farm to County Yield Farm to County Yield ≈ ≈ 0.800.80
0 20 40 60 80 100 120 140 160 180 2000
0.1
0.2
0.3
0.4
0.5
0.6
0.7
0.8
0.9
1
Yield(bu/acre)
Cum
ula
tive P
robabili
ty
Farm Yield + APH
Farm Yield No InsFarm Yield + GRP

Model ResultsModel Results
Corr.Corr. No InsNo Ins APH Ins APH Ins GRP InsGRP Ins
Downside Downside VarianceVariance
Downside Downside VarianceVariance
Downside Downside VarianceVariance
≈ ≈ 0.950.95 904904 205205 142142
≈ ≈ 0.870.87 10151015 240240 360360
≈ ≈ 0.800.80 10171017 237237 441441
Increased KnowledgeIncreased Knowledge
Spatial diversity helps GRPSpatial diversity helps GRP
Center of county helps GRPCenter of county helps GRP
As wedge on APH insurance As wedge on APH insurance ↑, the relative ↑, the relative performance of GRP to performance of GRP to APH APH ↑↑
Research and ExtensionResearch and Extension
GRP Evaluation spread sheetGRP Evaluation spread sheet– http://www.aec.msu.edu/agecon/blackj/grp.htmhttp://www.aec.msu.edu/agecon/blackj/grp.htm
GRP Staff PaperGRP Staff Paper– http://http://www.aec.msu.edu/agecon/blackj/grp.htmwww.aec.msu.edu/agecon/blackj/grp.htm
GRP and GRIP MATLAB program GRP and GRIP MATLAB program codecode– http://www.aec.msu.edu/agecon/blackj/grp.htmhttp://www.aec.msu.edu/agecon/blackj/grp.htm
An Improved Model WouldAn Improved Model Would
Use more units in the example countyUse more units in the example county
The model used did not have enough The model used did not have enough detail in the example countydetail in the example county– Used 16 UnitsUsed 16 Units
Actual county has 500+ square milesActual county has 500+ square miles
Perhaps 36 unitsPerhaps 36 units
Continued ResearchContinued Research
M.S. Plan B PaperM.S. Plan B Paper– Insurance Policies that Trigger on Insurance Policies that Trigger on
County IndexesCounty IndexesGRP, GRIP, GRIP HROGRP, GRIP, GRIP HRO
Unit policies will be compared to county Unit policies will be compared to county policies policies
APH, RA and RA HRO APH, RA and RA HRO – http://http://www.aec.msu.edu/agecon/blackj/grp.htmwww.aec.msu.edu/agecon/blackj/grp.htm
AcknowledgementsAcknowledgements
Insurance agents for input and reviewInsurance agents for input and review– Special thanks to Lisa TuggleSpecial thanks to Lisa Tuggle
Farmers for case study information and Farmers for case study information and reviewreview

Practical Procedures For Practical Procedures For Evaluating Crop Insurance Policies Evaluating Crop Insurance Policies
That Trigger On County YieldThat Trigger On County Yield
Ben Chaffin, Graduate Research AssistantBen Chaffin, Graduate Research AssistantJ. Roy Black, ProfessorJ. Roy Black, Professor
Department of Agricultural EconomicsDepartment of Agricultural EconomicsXiaobin Cao, Graduate Research Assistant, Xiaobin Cao, Graduate Research Assistant,
Agricultural Economics/StatisticsAgricultural Economics/StatisticsMichigan State UniversityMichigan State University