Embed Size (px)
Citation preview

DIGITAL SIGNAL PROCESSING LAB (ECE-429-F)
Practical Manual
Lab: DSP
EXPERIMENT No. 1
Aim:- To represent cosine wave using MATLAB.
Deptt.of Electronics &Communication Engg.
(ECE)
RAO PAHALD SINGH GROUP OF
INSTITUTIONS
BALANA(MOHINDER GARH)123029
Prepared By. Checked By.
Mr.SANDEEP KUMAR Mr.KARAMBIR SHEORAN

DIGITAL SIGNAL PROCESSING LAB (ECE-429-F)
PROGRAM NO -1
AIM:-To represent cosine wave using MATLAB. t = -pi:.0001:pi; y =cos(t), plot(t,y); xlabel(‘t’); ylabel(‘cos(t)’); title(‘cos’);
Command Window of Cosine function: -0.8776 -0.8776 -0.8777 -0.8777 Columns 57837 through 57840 -0.8778 -0.8778 -0.8779 -0.8779 Columns 57841 through 57844
-0.8780 -0.8780 -0.8781 -0.8781 Columns 57845 through 57848 -0.8782 -0.8782 -0.8783 -0.8783 Columns 57849 through 57852
-0.8784 -0.8784 -0.8785 -0.8785 Columns 57853 through 57856 -0.8785 -0.8786 -0.8786 -0.8787 Columns 57857 through 57860 -0.8787 -0.8788 -0.8788 -0.8789 Columns 57861 through 57864 -0.8789 -0.8790 -0.8790 -0.879 1 Columns 57865 through 57868

DIGITAL SIGNAL PROCESSING LAB (ECE-429-F)
-0.8791 -0.8792 -0.8792 -0.8793 Columns 57869 through 57872 -0.8793 -0.8794 -0.8794 -0.8795 Columns 57873 through 57876 -0.8795 -0.8795 -0.8796 -0.8796 Columns 57877 through 57880

DIGITAL SIGNAL PROCESSING LAB (ECE-429-F)
OUT PUT OF COS FUNCTION
Practical Manual
Lab: DSP
EXPERIMENT No. 2
Aim:- To represent exponential signal using MATLAB
Deptt. of Electronics &Communication Engg.
(ECE)
RAO PAHALD SINGH GROUP OF
INSTITUTIONS
BALANA(MOHINDER GARH)123029
Prepared By. Checked By.

DIGITAL SIGNAL PROCESSING LAB (ECE-429-F)
Mr.SANDEEP KUMAR Mr.KARAMBIR SHEORAN
PROGRAM NO -2
AIM:-To represent exponential signal using MATLAB x = -pi:O.O1:pi; plot(x,sin(x)), xlabel(‘x’); ylabel(‘sinx’); title(‘exponential’);

DIGITAL SIGNAL PROCESSING LAB (ECE-429-F)
OUT PUT OF EXPONENITAL FUNCTION

DIGITAL SIGNAL PROCESSING LAB (ECE-429-F)
Practical Manual
Lab: DSP
EXPERIMENT No. 3
Deptt. of Electronics &Communication Engg.
(ECE)
RAO PAHALD SINGH GROUP OF
INSTITUTIONS
BALANA(MOHINDER GARH)123029
Prepared By. Checked By.
Mr.SANDEEP KUMAR Mr.KARAMBIR SHEORAN

DIGITAL SIGNAL PROCESSING LAB (ECE-429-F)
PROGRAM NO -3
AIM:- To represent parabolic signal using MATLAB. N=50; n-50:1: N-1; x=n.ˆ2; plot(n,x); xlabel(‘n’); ylabel(‘x(n)’); title(‘parabolic’);
Command Window of Parabolic
0.8776 -0.8776 -0.8777 -0.8777 Columns 57837 through 57840
-0.8778 -0.8778 -0.8779 -0.8779 Columns 57841 through 57844 -0.8780 -0.8780 -0.878 1 -0.878 1 Columns 57845 through 57848 -0.8782 -0.8782 -0.8783 -0.8783 Columns 57849 through 57852 -0.8784 -0.8784 -0.8785 -0.8785 Columns 57853 through 57856 -0.8785 -0.8786 -0.8786 -0.8787 Columns 57857 through 57860 -0.8787 -0.8788 -0.8788 -0.8789 Columns 57861 through 57864 -0.8789 -0.8790 -0.8790 -0.8791 Columns 57865 through 57868

DIGITAL SIGNAL PROCESSING LAB (ECE-429-F)
-0.8791 -0.8792 -0.8792 -0.8793 Columns 57869 through 57872 -0.8793 -0.8794 -0.8794 -0.8795 Columns 57873 through 57876 -0.8795 -0.8795 -0.8796 -0.8796 Columns 57877 through 57880 -0.8797 -0.8797 -0.8798 - . 79

DIGITAL SIGNAL PROCESSING LAB (ECE-429-F)
OUT PUT OF PARABOLIC FUNCTION

DIGITAL SIGNAL PROCESSING LAB (ECE-429-F)
Practical Manual
Lab: DSP
EXPERIMENT No. 4
Deptt. of Electronics &Communication Engg.
(ECE)
RAO PAHALD SINGH GROUP OF
INSTITUTIONS
BALANA(MOHINDER GARH)123029
Prepared By. Checked By.
Mr.SANDEEP KUMAR Mr.KARAMBIR SHEORAN

DIGITAL SIGNAL PROCESSING LAB (ECE-429-F)
PROGRAM NO -4 AIM:- To represent sine wave using MATLAB. x = -pi: O.O1: pi; y =sin(x), plot(x, y); xlabel (‘x’); ylabel (‘sinx’); title (‘sine’);
Command Window of Sine: -0.9586 -0.9586 -0.9586 -0.9587 Columns 59949 through 59952
-0.9587 -0.9587 -0.9588 -0.9588 Columns 59953 through 59956 -0.9588 -0.9588 -0.9589 -0.9589 Columns 59957 through 59960
-0.9589 -0.9590 -0.9590 -0.9590 Columns 59961 through 59964
-0.9590 -0.9591 -0.9591 -0.9591 Columns 59965 through 59968 -0.9592 -0.9592 -0.9592 -0.9592 Columns 59969 through 59972 -0.9593 -0.9593 -0.9593 -0.9594 Columns 59973 through 59976 -0.9594 -0.9594 -0.9594 -0.9595 Columns 59977 through 59980 -0.9595 -0.9595 -0.9596 -0.959 Columns 59981 through 59984

DIGITAL SIGNAL PROCESSING LAB (ECE-429-F)
-0.9596 -0.9596 -0.9597 -0.9597 Columns 59985 through 59988 -0.9597 -0.9598 -0.9598 - . 598 Columns 59989 through 5

DIGITAL SIGNAL PROCESSING LAB (ECE-429-F)
Practical Manual
Lab: DSP
EXPERIMENT No.5
Deptt. of Electronics &Communication Engg.
(ECE)
RAO PAHALD SINGH GROUP OF
INSTITUTIONS
BALANA(MOHINDER GARH)123029
Prepared By. Checked By.
Mr.SANDEEP KUMAR Mr.KARAMBIR SHEORAN

DIGITAL SIGNAL PROCESSING LAB (ECE-429-F)
PROGRAM NO -5
AIM: - To represent ramp signal using MATLAB. x = -pi:O.O1:pi; plot(x, sin(x)), xlabel(‘x’); ylabel(‘sinx’); title(‘ramp’);
Command Window of Ramp: Columns 58677 through 58680 -0.9149 -0.9149 -0.9150 -0.9150 Columns 58681 through 58684 -0.9150 -0.9151 -0.9151 -0.9152
Columns 58685 through 58688 -0.9152 -0.9152 -0.9153 -0.9153 Columns 58689 through 58692 -0.9154 -0.9154 -0.9154 -0.9155 Columns 58693 through 58696 -0.9155 -0.9156 -0.9156 -0.9156 Columns 58697 through 58700 -0.9157 -0.9157 -0.9158 -0.9158 Columns 58701 through 58704 -0.9158 -0.9159 -0.9159 -0.9160 Columns 58705 through 58708 -0.9160 -0.9160 -0.9161 -0.9161

DIGITAL SIGNAL PROCESSING LAB (ECE-429-F)
Columns 58709 through 58712 -0.9162 -0.9162 -0.9162 -0.9163 Columns 58713 through 58716 -0.9163 -0.9164 -0.9164 -0.9164 Columns 58717 through 58720 -0.916 -0.9165 -0.9166 -0.9166

DIGITAL SIGNAL PROCESSING LAB (ECE-429-F)
OUT PUT OF RAMP FUNCTION
DIGITAL SIGNAL PROCESSING LAB (ECE-429-F)
Practical Manual
Lab: DSP
EXPERIMENT No. 6
Deptt. of Electronics &Communication Engg.
(ECE)
RAO PAHALD SINGH GROUP OF
INSTITUTIONS
BALANA(MOHINDER GARH)123029
Prepared By. Checked By.
Mr.SANDEEP KUMAR Mr.KARAMBIR SHEORAN

DIGITAL SIGNAL PROCESSING LAB (ECE-429-F)
PROGRAM NO -6
AIM:-
To design analog low pass filter. clear all; clc; rp = input(‘pass ripple freq’); rs = input(‘stop ripple freq’); fp = Input(‘pass band freq’); fs = input(‘stop band freq’); f = input(‘sample freq’); w1= 2*fp/f; w2=2*fs/f; [n,wn]= buttord(w1 ,w2,rp,rs); [z,p,k]=butter(n,wn); [b,a]=zp2tf(z,p,k); [b,a]= butter(n,wn); w=0:0.1:pi; [h,p]= freqz(b,a,w); g= 20* log 10(abs(h)); A=angle(h); subplot (2,2,1); plot(p/pi,g); ylabel(‘amp’); xlabel(‘ferq’); title(‘amp,freq’); subplot (2,2,2); plot(p/pi,A); xlabel(‘normal. freq’); ylabel(‘phase’); title(‘normal. freq,phase’);
Command Window of Analog Low pass:
rp = 0.5000 stop ripple freq40 rs= 40 pass band freq2000

DIGITAL SIGNAL PROCESSING LAB (ECE-429-F)
fp= 2000 stop band freq3 000 fs= 3000 sample freq10000 f= 10000 w1 = 0.4000 w2 = 0.6000 n=9 wn =0.43 92 z=-1 —1 —1 —1 —1 —1 —1 —1
—1

DIGITAL SIGNAL PROCESSING LAB (ECE-429-F)
OUT PUT OF LOW PASS FILTER

DIGITAL SIGNAL PROCESSING LAB (ECE-429-F)
Practical Manual
Lab: DSP
EXPERIMENT No. 7
Deptt. of Electronics &Communication Engg.
(ECE)
RAO PAHALD SINGH GROUP OF
INSTITUTIONS
BALANA(MOHINDER GARH)123029
Prepared By. Checked By.
Mr.SANDEEP KUMAR Mr.KARAMBIR SHEORAN
DIGITAL SIGNAL PROCESSING LAB (ECE-429-F)
PROGRAM NO -7 AIM:-
To design analog high pass filter. clear all; clc; rp = input(‘pass ripple freq’); rs = input(‘stop ripple freq’); fp = input(‘pass band freq’); fs = input(‘stop band freq’); f= input(‘sample freq’); w1= 2*fp/f; w2= 2*fs/f; [n,wn]= buttord(w1 ,w2,rp,rs); [b,a]= butter(n,wn ‘high’); w=0:0.1 :pi; [h,p]= freqz(b,a,w); g= 20*log10(abs(h)); A=angle(h); subplot (2,2,1); plot(p/pi,g); ylabel(‘amp’); xlabel(‘ferq’); title(‘amp,freq’); subplot (2,2,2); plot(p/pi,A); xlabel(‘normal. freq’); ylabel(‘phase’); title(‘normal. Freq,phase’);

DIGITAL SIGNAL PROCESSING LAB (ECE-429-F)

DIGITAL SIGNAL PROCESSING LAB (ECE-429-F)
OUTPUT OF HIGH PASS FILTER
Practical Manual
Lab: DSP
EXPERIMENT No. 8
Deptt. of Electronics &Communication Engg.
(ECE)
RAO PAHALD SINGH GROUP OF
INSTITUTIONS
BALANA(MOHINDER GARH)123029
Prepared By. Checked By.
Mr.SANDEEP KUMAR Mr.KARAMBIR SHEORAN
DIGITAL SIGNAL PROCESSING LAB (ECE-429-F)
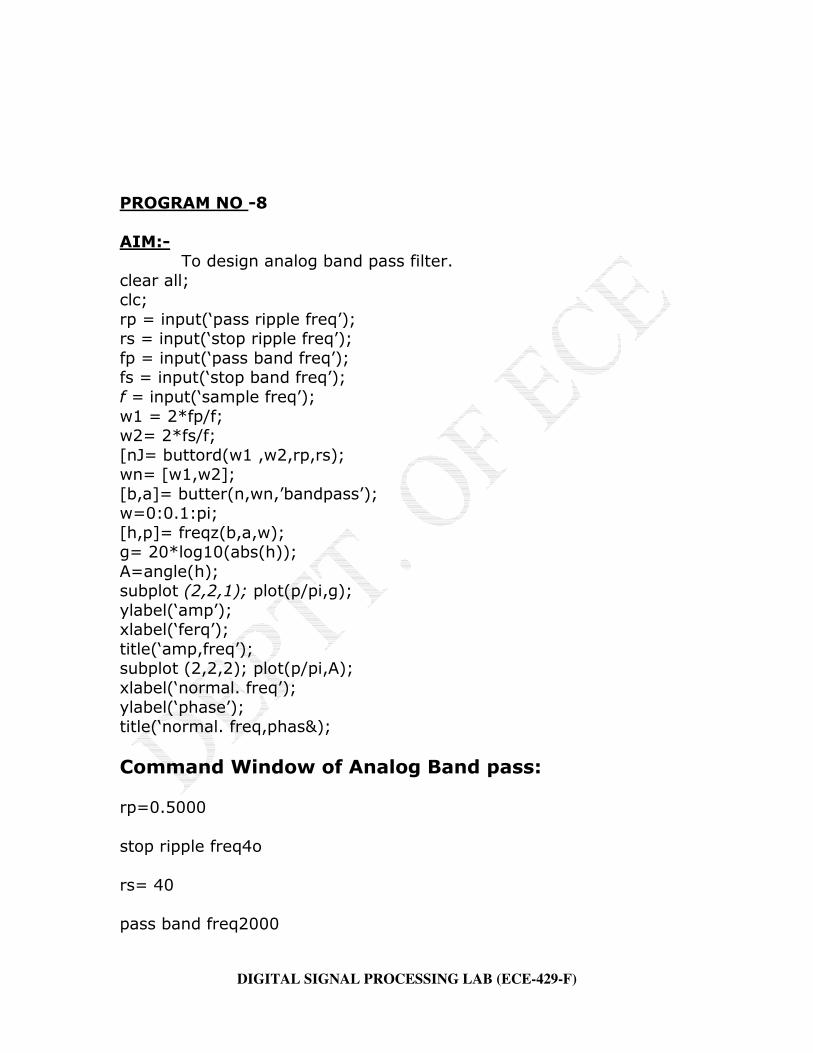
PROGRAM NO -8
AIM:- To design analog band pass filter. clear all; clc; rp = input(‘pass ripple freq’); rs = input(‘stop ripple freq’); fp = input(‘pass band freq’); fs = input(‘stop band freq’); f = input(‘sample freq’); w1 = 2*fp/f; w2= 2*fs/f; [nJ= buttord(w1 ,w2,rp,rs); wn= [w1,w2]; [b,a]= butter(n,wn,’bandpass’); w=0:0.1:pi; [h,p]= freqz(b,a,w); g= 20*log10(abs(h)); A=angle(h); subplot (2,2,1); plot(p/pi,g); ylabel(‘amp’); xlabel(‘ferq’); title(‘amp,freq’); subplot (2,2,2); plot(p/pi,A); xlabel(‘normal. freq’); ylabel(‘phase’); title(‘normal. freq,phas&);
Command Window of Analog Band pass: rp=0.5000 stop ripple freq4o rs= 40 pass band freq2000

DIGITAL SIGNAL PROCESSING LAB (ECE-429-F)
fp= 2000 stop band freq3 000 fs= 3000 sample freql0000 w1 =0.4000 w2= 0.6000 n= 9 wn = 0.4000 0.6000 b= 1.0e-003 * Columns 1 through 4 0.0064 0 -0.0572 0 Columns 5 through 8 0.2287 0 -0.5336 0

DIGITAL SIGNAL PROCESSING LAB (ECE-429-F)

DIGITAL SIGNAL PROCESSING LAB (ECE-429-F)
Practical Manual
Lab: DSP
EXPERIMENT No. 9
Deptt. of Electronics &Communication Engg.
(ECE)
RAO PAHALD SINGH GROUP OF
INSTITUTIONS
BALANA(MOHINDER GARH)123029
Prepared By. Checked By.
Mr.SANDEEP KUMAR Mr.KARAMBIR SHEORAN

DIGITAL SIGNAL PROCESSING LAB (ECE-429-F)
PROGRAM NO -9
AIM:- To design analog band stop filter. clear all; clc; rp = input(‘pass ripple freq’); rs = input(‘stop ripple freq’); fp = input(‘pass band freq’); fs = input(‘stop band freq’); f= input(‘sample freq’); w1= 2*fp/f; w2= 2*fs/f [n]= buttord(w1,w2,rp,rs); wn=[w1,w2]; [b,a] = butter(n,wn,’stop’); w=0:0.1:pi; [h,p]= freqz(b,a,w); g= 20*log10(abs(h)); A=angle(h); subplot (2,2,1); plot(p/pi,g); ylabel(‘amp’); xlabel(‘ferq’); title(‘amp,freq’); subplot (2,2,2); plot(p/pi,A); xlabel(‘normal. freq’); ylabel(‘phase’); title(‘normal. freq,phase’);
Command Window of Analog Band stop:
rp= 0.5000 stop ripple freq40 rs= 40 pass band freq2000

DIGITAL SIGNAL PROCESSING LAB (ECE-429-F)
fp =2000 stop band freq3 000 fs=3000 sample freq 10000 f= 10000 w1 =0.4000 w2 = 0.6000 n=9 wn = 0.4000 0.6000 b= Columns 1 through 4 0.1574 -0.0000 1.4163 -0.0000 Columns 5 through 8 5.6653 -0.0000 13.2190 -0.0000
DIGITAL SIGNAL PROCESSING LAB (ECE-429-F)
Practical Manual
Lab: DSP
EXPERIMENT No.10
Deptt. of Electronics &Communication Engg.
(ECE)
RAO PAHALD SINGH GROUP OF
INSTITUTIONS
BALANA(MOHINDER GARH)123029
Prepared By. Checked By.
Mr.SANDEEP KUMAR Mr.KARAMBIR SHEORAN

DIGITAL SIGNAL PROCESSING LAB (ECE-429-F)
PROGRAM NO -10
AIM: -
To design digital butterworth (low pass) filter using MATLAB.
clear all; clc; rp = input(‘pass ripple freq’); rs = input(‘stop ripple freq’); fp = input(‘pass band freq’); fs = input(‘stop band freq’); f = input(‘sample freq’); w1=2*fp/f; w2=2*fs/f; [n,wn]= buttord(w1,w2,rp,rs); [b,a] = butter(n,wn); w=0:.1:pi; [h,p] = freqz(b,a,w); g=20*log10(abs(h)); A=angle(h); subplot (2,2,1); plot(p/pi,g); ylabel(‘amp’); xlabel(‘ferq’); title(‘amp,freq’); subplot (2,2,2); plot(p/pi,A); xlabel(‘normal. freq’); ylabel(‘phase’); title(‘normal.freq,phase’);

DIGITAL SIGNAL PROCESSING LAB (ECE-429-F)
Command window of Butter Lowpass Filter:
pass ripple freq.5
rp=0.5000
stop ripple freq40
rs =40
pass band freq2000
fp = 2000
stop band freq3000
fs =3000
sample freq 10000
f= 10000
w1 =0.4000
w2 =0.6000
n=9

DIGITAL SIGNAL PROCESSING LAB (ECE-429-F)
wn = 0.43 92
b = Columns 1 through 4 0.0021 0.0186 0.0745 0.1739
Columns 5 through 8 0.2609 0.2609 0.1739 0.0745
Columns 9 through 10 ,Z 0.0186 0.0021
a= Columns 1 thi4

DIGITAL SIGNAL PROCESSING LAB (ECE-429-F)
Practical Manual
Lab: DSP
EXPERIMENT No.11
Deptt. of Electronics &Communication Engg.
(ECE)
RAO PAHALD SINGH GROUP OF
INSTITUTIONS
BALANA(MOHINDER GARH)123029
Prepared By. Checked By.

DIGITAL SIGNAL PROCESSING LAB (ECE-429-F)
Mr.SANDEEP KUMAR Mr.KARAMBIR SHEORAN
PROGRAM NO-11
AIM:-
To design digital butterworth (high pass) filter using MATLAB. clear all; clc; rp = input(‘pass ripple freq’); rs = input(‘stop ripple freq’); fp = input(‘pass band freq’); fs = input(‘stop band freq’); f = input(‘sample freq’); w1= 2*fp/f; w2= 2*fs/f; [n,wn]= buttord(w1,w2,rp,rs); [b,a] = butter(n,wn,’high’); w=0:.1:pi; [h,p]= freqz(b,a,w); g=20*log10(abs(h)); A=angle(h); subplot (2,2,1); plot(p/pi,g); ylabel(‘amp’); xlabel(‘ferq’); title(‘amp,freq’); subplot (2,2,2); plot(p/pi,A); xlabel(‘normal. freq’); ylabel(‘phase’); title(‘normal.freq,phase’);
Command Window of Butter Highpass filter:

DIGITAL SIGNAL PROCESSING LAB (ECE-429-F)
rp = 0.5000
stop ripple freq4O
rs = 40
pass band freq2000
fp= 2000
stop band freq3000
fs= 3000
sample freql0000
f = 1000
w1 = 0.4000
w2=0.6000
n = 9
wn= 0.4392
b = Columns 1 through 4 0.0117 -0.1051 0.4204 -0.9809

DIGITAL SIGNAL PROCESSING LAB (ECE-429-F)
Columns 5 through 8 1.4714 -1.4714 0.9809 -0.4204
Columns 9 through 10 0.1051 -0.0117

DIGITAL SIGNAL PROCESSING LAB (ECE-429-F)
Practical Manual
Lab: DSP
EXPERIMENT No.12

DIGITAL SIGNAL PROCESSING LAB (ECE-429-F)
Deptt. of Electronics &Communication Engg.
(ECE)
RAO PAHALD SINGH GROUP OF
INSTITUTIONS
BALANA(MOHINDER GARH)123029
Prepared By. Checked By.
Mr.SANDEEP KUMAR Mr.KARAMBIR SHEORAN
PROGRAM NO —12
AIM:-
To design digital butterwonh (band pass) filter using MATLAB.
clear all;

DIGITAL SIGNAL PROCESSING LAB (ECE-429-F)
clc; rp = input(‘pass ripple freq’); rs = input(‘stop ripple freq’); fp = input(‘pass band freq’); fs = input(‘stop band freq); f input(‘sample freq’); w1= 2*fp/f; w2= 2*fs/f; [n]= buttord(w1 ,w2,rp,rs); wn = [w1,w2]; [b,a]= butter(n,wn, ‘bandpass’); w=0:.1:pi; [h,pJ= freqz(b,a,w); g= 20*log10(abs(h)); A=angle(h); subplot (2,2,1); plot(p/pi,g); ylabel(‘amp’); xlabel(‘ferq’); title(‘amp,freq’); subplot (2,2,2); plot(p/pi,A); xlabel(‘normal. freq’); ylabel(’phase’); title(’normal.freq,phase’);
Command Window of Butter Band pass filter:
pass ripple freq.5
rp=0.5000

DIGITAL SIGNAL PROCESSING LAB (ECE-429-F)
stop ripple freq40
rs =40
pass band freq2000
fp=2000
stop band freq3000
fs= 3000
sample freql0000
f= 10000
w1= 0.4000
w2 = 0.6000
n= 9
wn =0.4000 0.6000
b=1.0e-003 *
Columns 1 through 4 0.0064 0 -0.0572 0

DIGITAL SIGNAL PROCESSING LAB (ECE-429-F)
Columns 5 through 8 0.2287 0 -0.5336 0
Columns 9 through 12 0.8003 0 -0.8003 0
OUTPUT OF DIGITAL BANDPASS FILTER
Practical Manual
Lab: DSP
EXPERIMENT No.13

DIGITAL SIGNAL PROCESSING LAB (ECE-429-F)
Deptt. of Electronics &Communication Engg.
(ECE)
RAO PAHALD SINGH GROUP OF
INSTITUTIONS
BALANA(MOHINDER GARH)123029
Prepared By. Checked By.
Mr.SANDEEP KUMAR Mr.KARAMBIR SHEORAN
PROGRAM NO -13
AIM: -

DIGITAL SIGNAL PROCESSING LAB (ECE-429-F)
To design digital butterworth (band stop) filter using MATLAB.
clear all; clc; rp = input(‘pass ripple freq’); rs = input(‘stop ripple freq’); fp = input(‘pass band freq’); fs = input(‘stop band freq’); f = input(‘sample freq’); w1 2*fp/f; w2= 2*fs/f; [n] = buttord(w1,w2,rp,rs); wn = [w1,w2j; [b,a] butter(n,wn,’stop’); w=0:.1:pi; [h,pJ = freqz(b,a,w); g= 20*log10(abs(h)); A = angle(h); subplot (2,2,1); plot(p/pi,g); ylabel(‘amp’); xlabel(‘Terq’); title(‘amp,freq’); subplot (2,2,2); plot(p/pi,A); xlabel(‘normal. freq’); ylabel(‘phase’); title(‘normal. freq,phase’);
Command Window of Butter Stop band filter:

DIGITAL SIGNAL PROCESSING LAB (ECE-429-F)
pass ripple freq.5
rp=0.5000
stop ripple freq40
rs =40
pass band freq200
fp= 200
stop band freq3 000
fs= 3000
sample freq1000
f= 10000
w1 =0.0400
w2 =0.6000
n=2
wn = 0.0400 0.6000

DIGITAL SIGNAL PROCESSING LAB (ECE-429-F)
b=
Columns 1 through 4 0.2398 -0.8062 1.1573 -0.8062
Column 5 0.2398
OUTPUT OF DIGITAL BAND STOP
Practical Manual

DIGITAL SIGNAL PROCESSING LAB (ECE-429-F)
Lab: DSP
EXPERIMENT No.14
Deptt. of Electronics &Communication Engg.
(ECE)
RAO PAHALD SINGH GROUP OF
INSTITUTIONS
BALANA(MOHINDER GARH)123029
Prepared By. Checked By.
Mr.SANDEEP KUMAR Mr.KARAMBIR SHEORAN
PROGRAM NO -14

DIGITAL SIGNAL PROCESSING LAB (ECE-429-F)
Aim:
To represent the unit step function using MATLAB. clear all; N=10; n=0:1:N-1 x =ones( 1 ,N) plot(n,x) xlabel(‘n’); ylabel(‘x(n)’); title(‘unit step’);
Practical Manual

DIGITAL SIGNAL PROCESSING LAB (ECE-429-F)
Lab: DSP
EXPERIMENT No.15
Deptt. of Electronics &Communication Engg.
(ECE)
RAO PAHALD SINGH GROUP OF
INSTITUTIONS
BALANA(MOHINDER GARH)123029
Prepared By. Checked By.
Mr.SANDEEP KUMAR Mr.KARAMBIR SHEORAN

DIGITAL SIGNAL PROCESSING LAB (ECE-429-F)
PROGRAM NO —15
AIM:
To find convolution of two functions using MATLAB. 12345 x=
1 2 3 4 5 y=
2 3 4 5 6
C=
2 7 16 30 50 58 49 30
C=
1 2 3 4 5 0 0 0 0 0 1 2 3 4 5 0 0 0 0 0 1 2 3 4 5 0 0 0 0 0 1 2 3 4 5 0 0 0 0 0 1 2 3 4 5
Command Window of Convolution
x= 1 2 3 4 5
y= 2 3 4 5 6
c= 2 7 16 30 50 58 58 49 30

DIGITAL SIGNAL PROCESSING LAB (ECE-429-F)
c= 1 2 3 4 5 0 0 0 0 0 1 2 3 4 5 0 0 0 0 0 1 2 3 4 5 0 0 0 0 0 1 2 3 4 5 0 0 0 0 0 1 2 3 4 5