Embed Size (px)
DESCRIPTION
Dustin Smith, Community Manager, Tableau Software, presents at the 2012 Big Analytics Roadshow. Organizations now have the ability to store and process massive amounts of data like never before. And there are huge expectations for turning data into a fundamental driver for business transformation and competitive advantage. Visual analytics is helping everyday employees gain insight into data in order to solve unexpected problems and challenges, it is changing the way people interact with data and the way business intelligence is defined in organizations. In this presentation, we will share real-world examples of how everyday people can and are using visual analytics to solve some of businesses most challenging issues.
Citation preview
Practical Applications of
Visual Analytics
Dustin Smith
Tableau Software
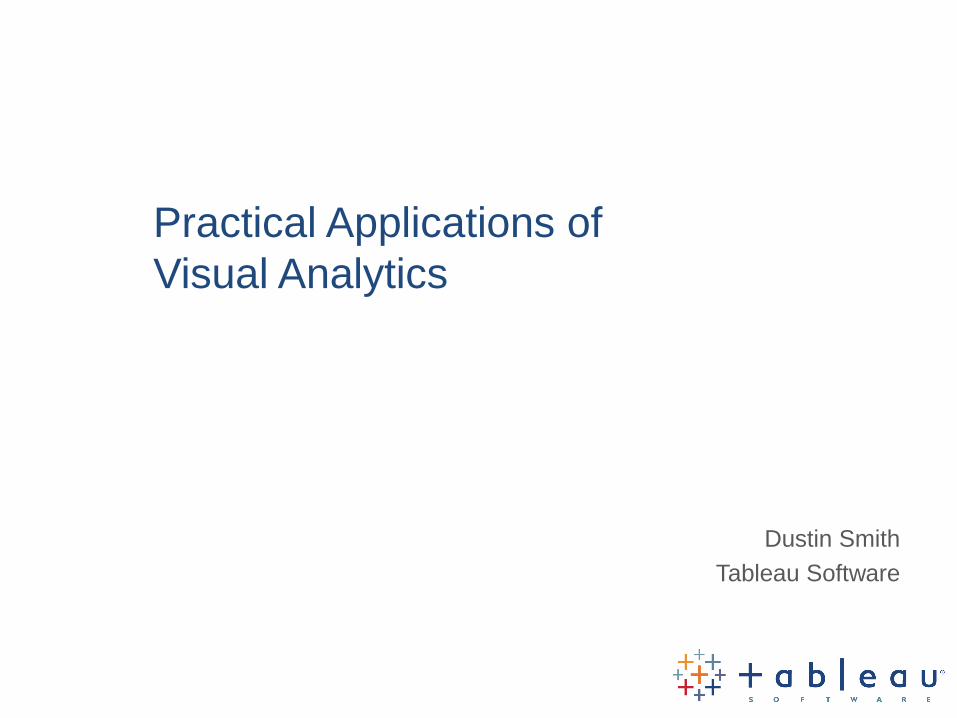
We have been using tabular
representations of data for 4,000 years
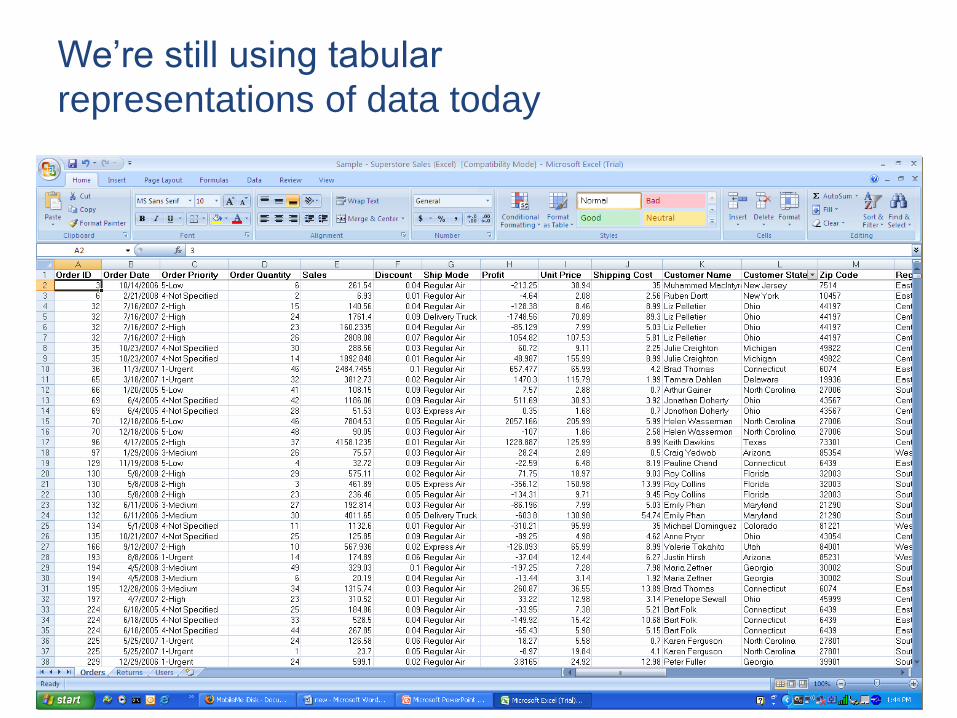
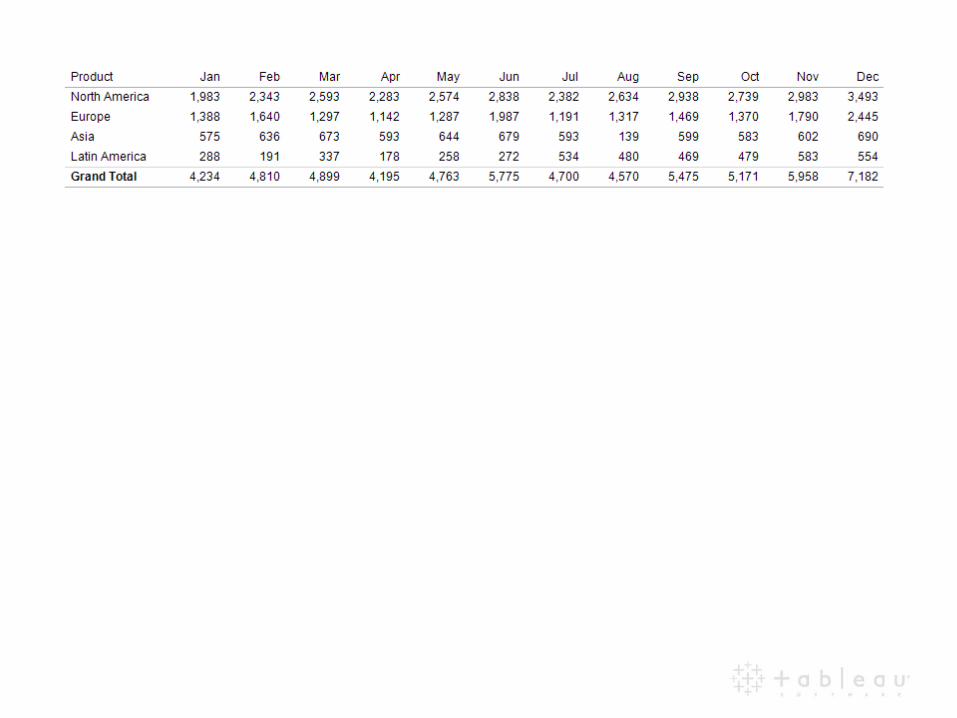
We’re still using tabular
representations of data today
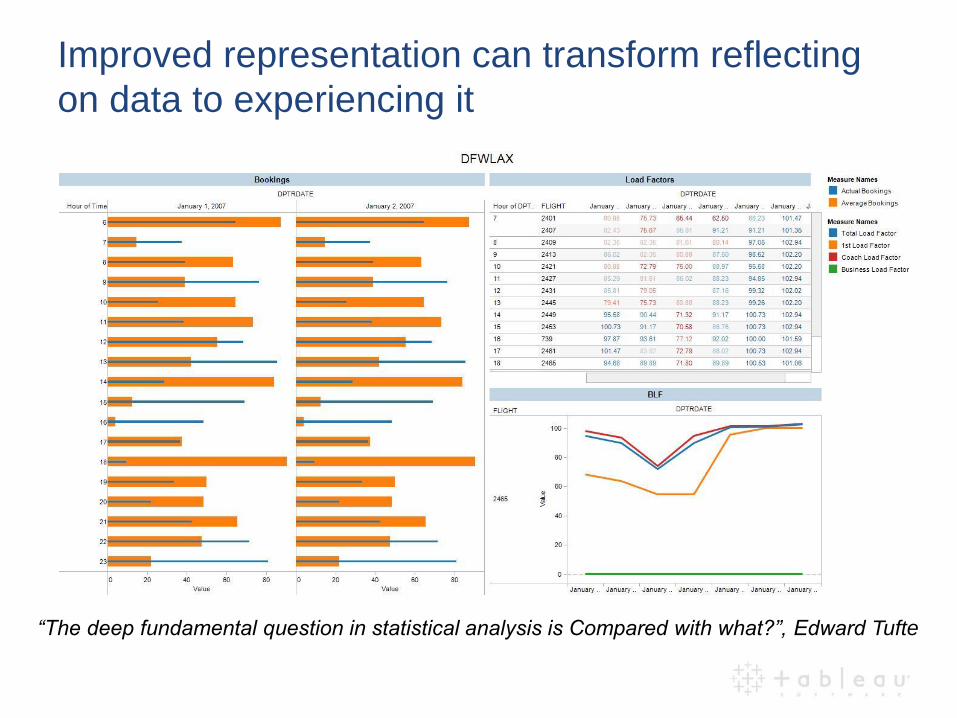
“The deep fundamental question in statistical analysis is Compared with what?”, Edward Tufte
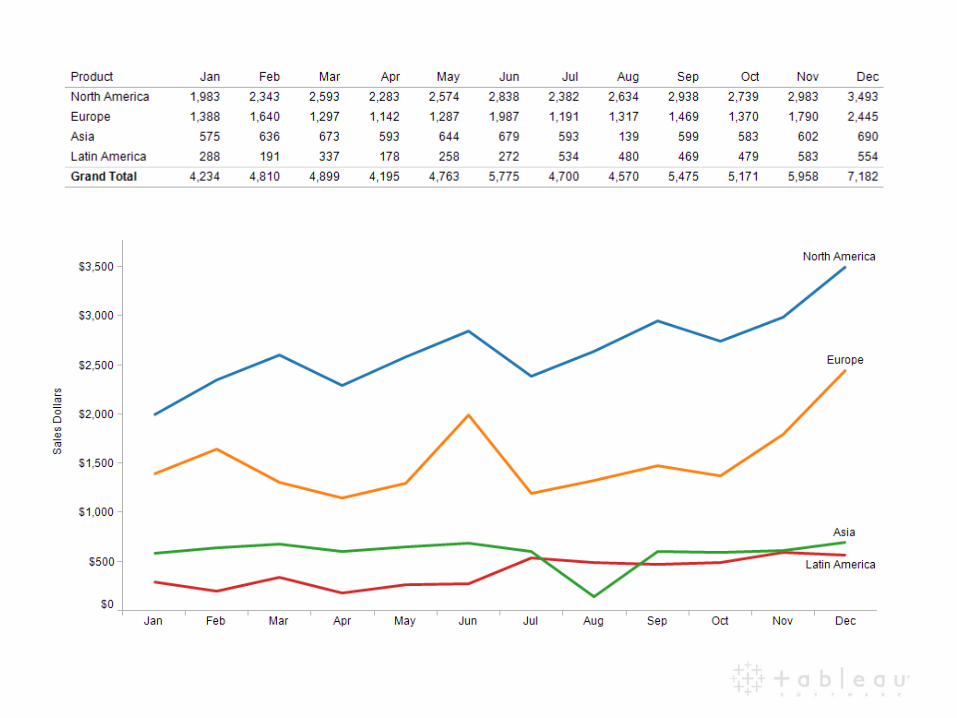
Improved representation can transform reflecting
on data to experiencing it
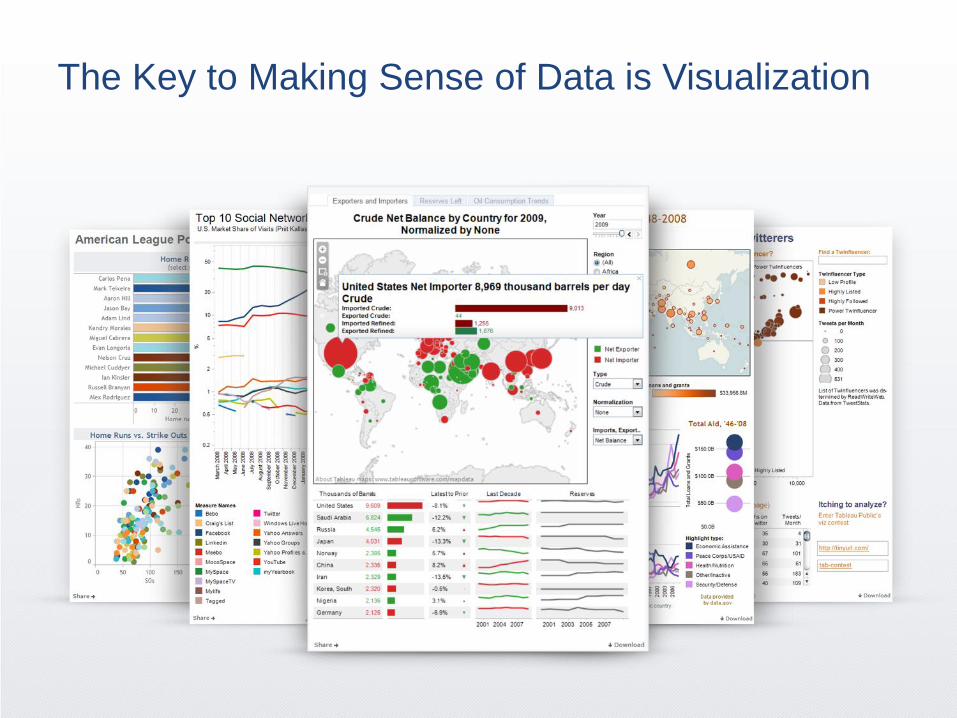
The Key to Making Sense of Data is Visualization
Exploit the power of the
human visual system
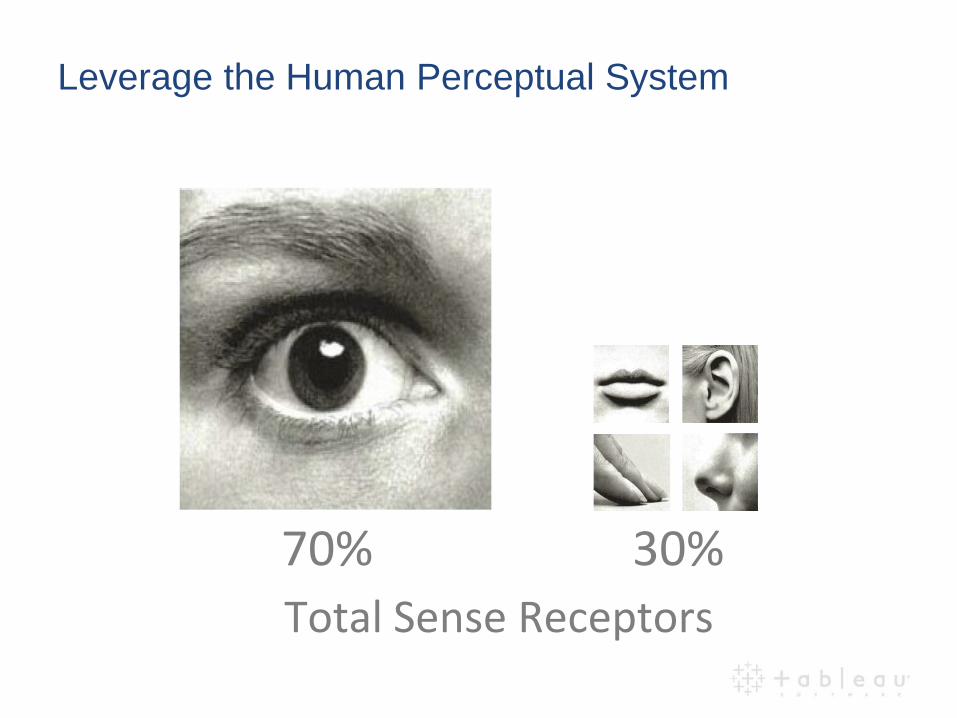
70% 30%
Total Sense Receptors
Leverage the Human Perceptual System

Iterate, explore, and
experiment
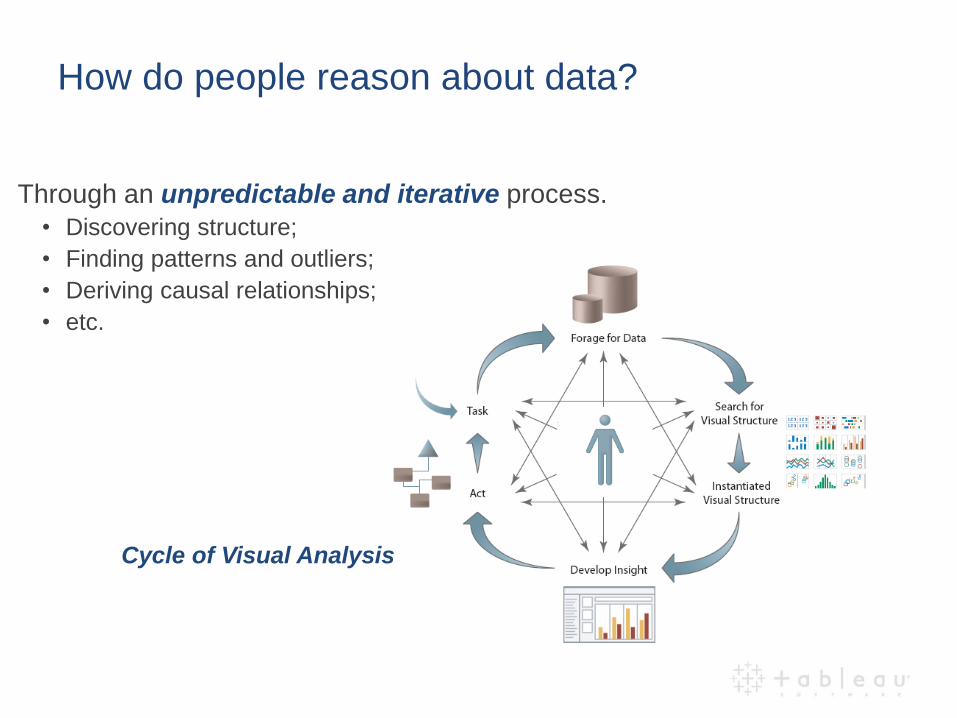
Through an unpredictable and iterative process.
• Discovering structure;
• Finding patterns and outliers;
• Deriving causal relationships;
• etc.
How do people reason about data?
Cycle of Visual Analysis
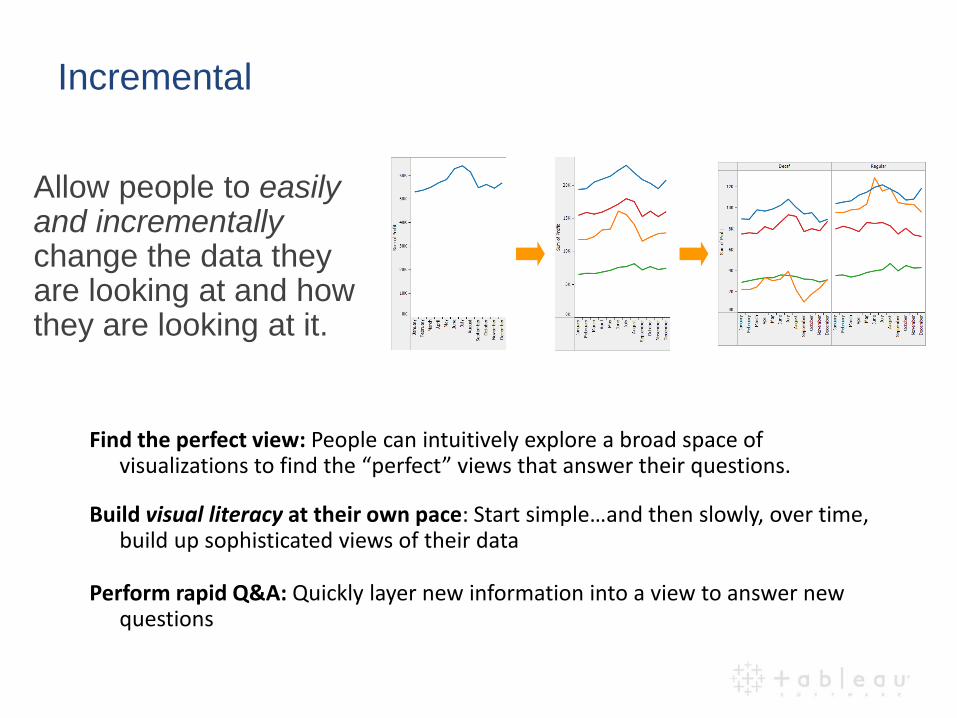
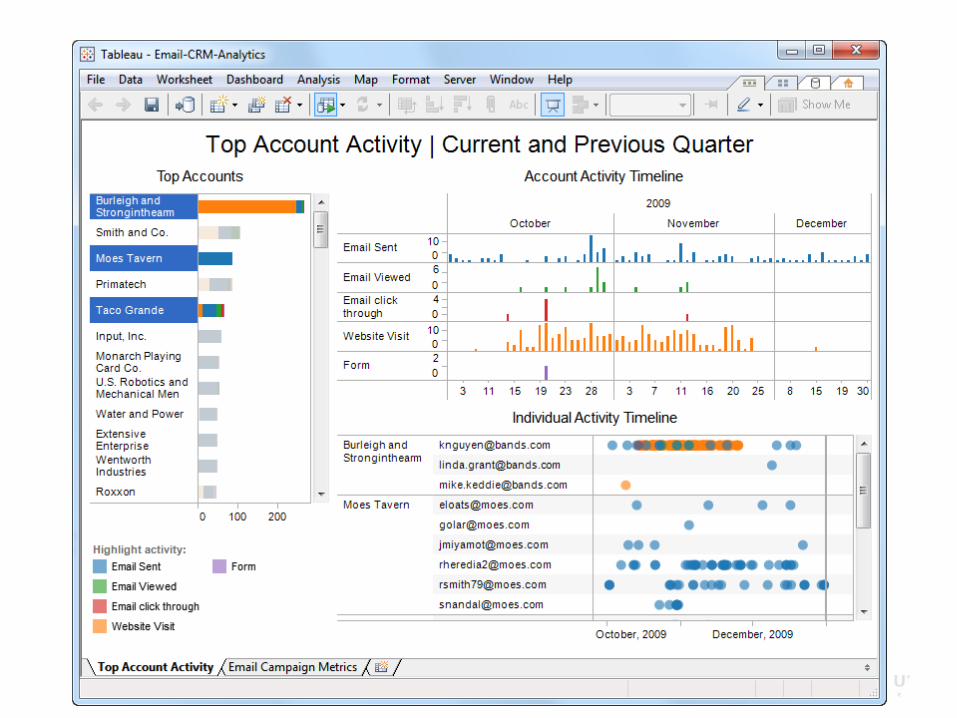
Find the perfect view: People can intuitively explore a broad space of visualizations to find the “perfect” views that answer their questions.
Build visual literacy at their own pace: Start simple…and then slowly, over time, build up sophisticated views of their data
Perform rapid Q&A: Quickly layer new information into a view to answer new questions
Allow people to easily and incrementally change the data they are looking at and how they are looking at it.
Incremental
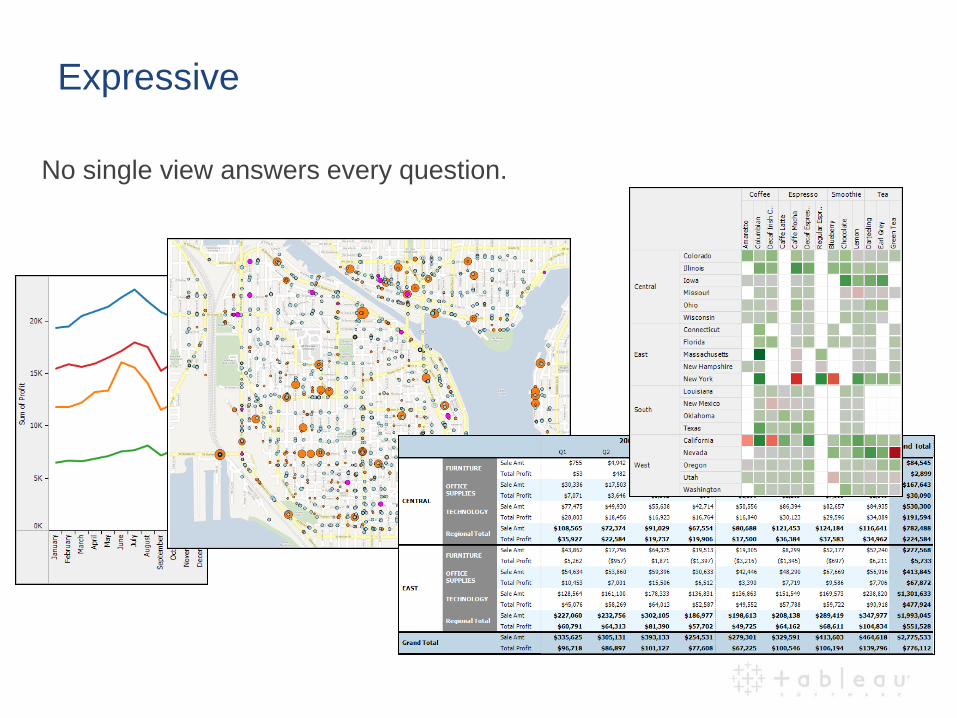
No single view answers every question.
Expressive
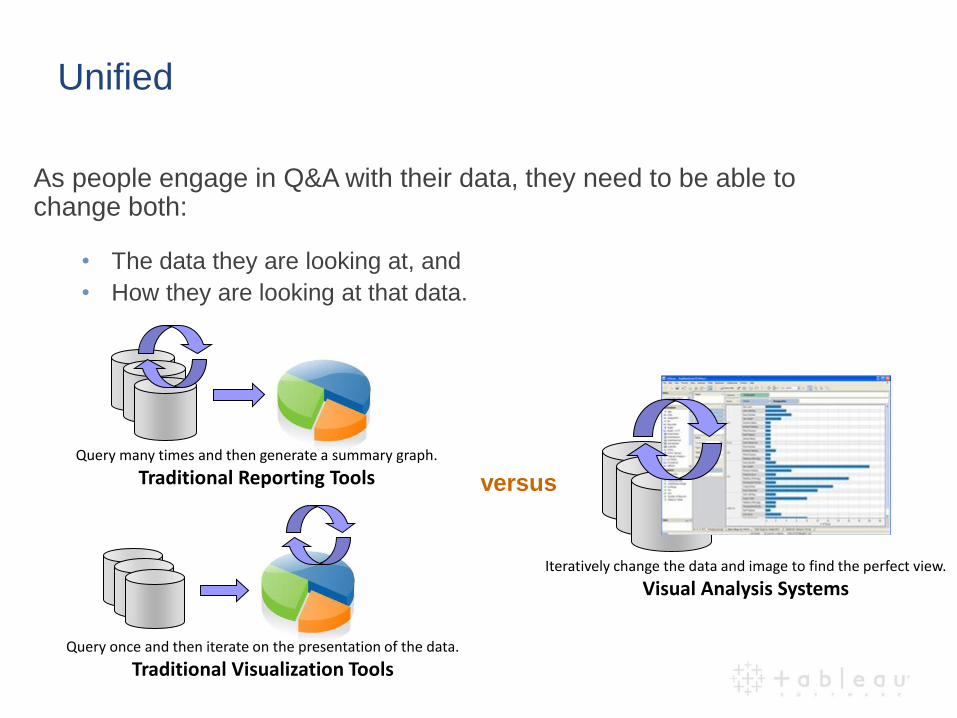
As people engage in Q&A with their data, they need to be able to change both:
• The data they are looking at, and
• How they are looking at that data.
versus
Query many times and then generate a summary graph.
Traditional Reporting Tools
Iteratively change the data and image to find the perfect view.
Visual Analysis Systems
Query once and then iterate on the presentation of the data.
Traditional Visualization Tools
Unified
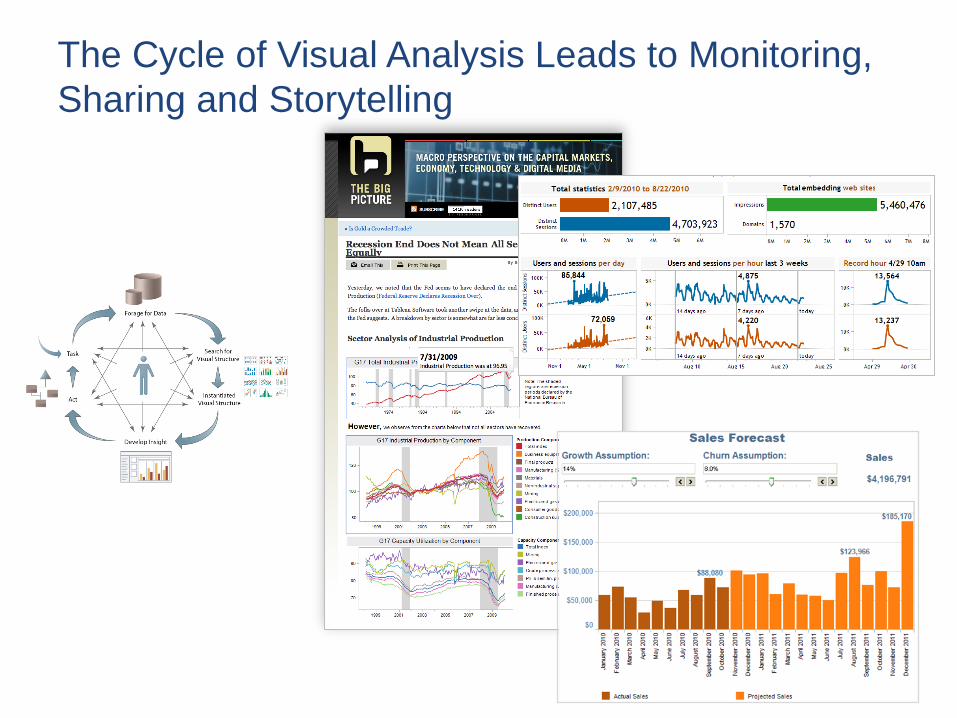
The Cycle of Visual Analysis Leads to Monitoring,
Sharing and Storytelling
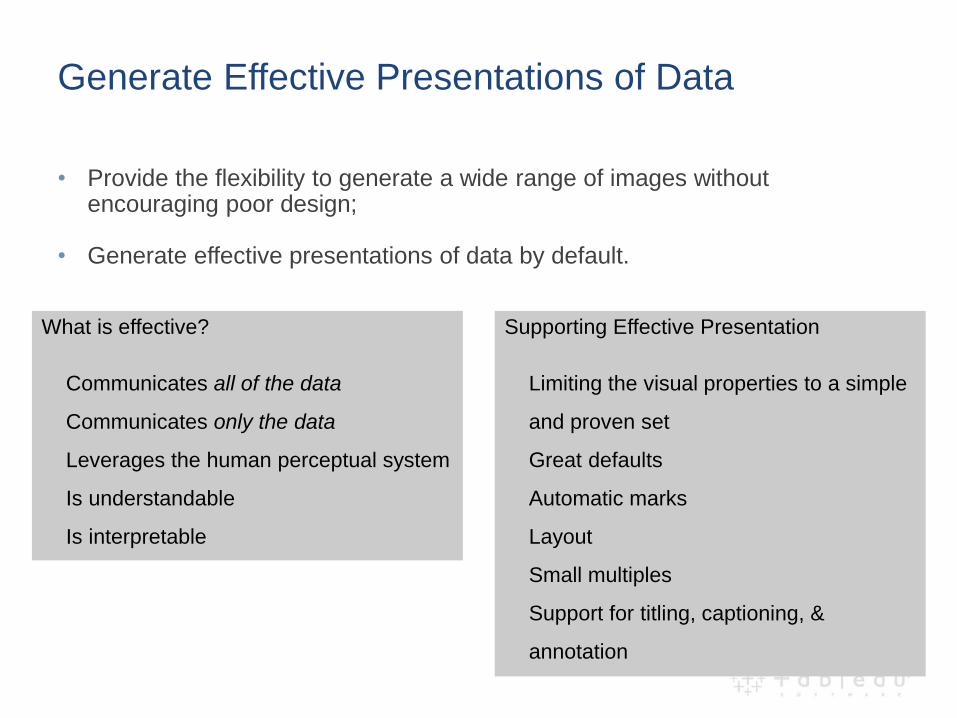
• Provide the flexibility to generate a wide range of images without encouraging poor design;
• Generate effective presentations of data by default.
What is effective?
Communicates all of the data
Communicates only the data
Leverages the human perceptual system
Is understandable
Is interpretable
Supporting Effective Presentation
Limiting the visual properties to a simple
and proven set
Great defaults
Automatic marks
Layout
Small multiples
Support for titling, captioning, &
annotation
Generate Effective Presentations of Data
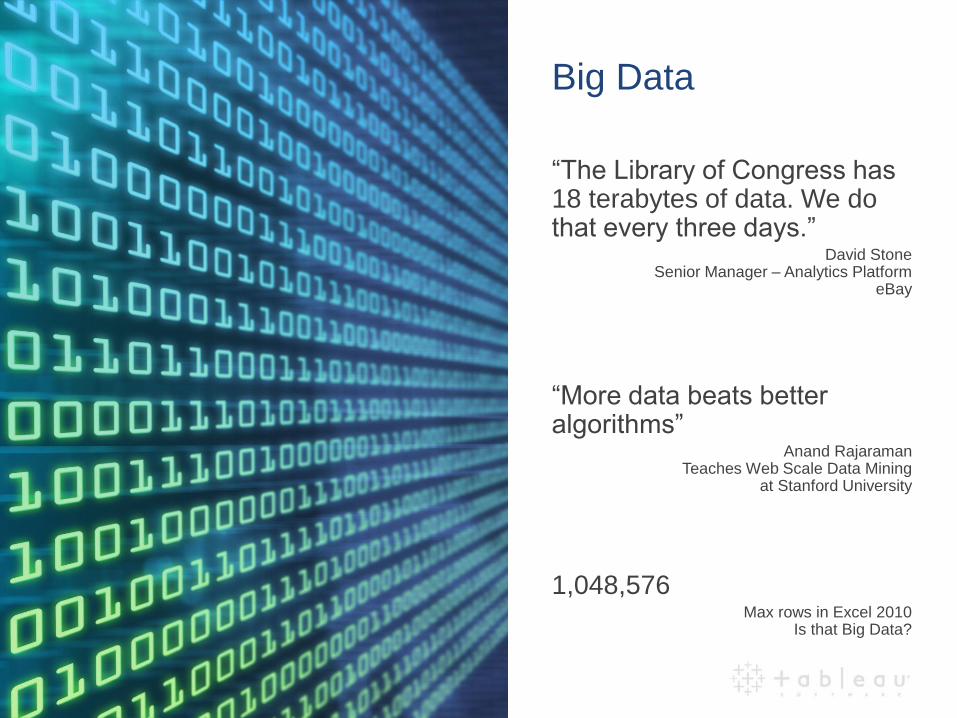
“The Library of Congress has 18 terabytes of data. We do that every three days.”
David Stone Senior Manager – Analytics Platform
eBay
“More data beats better algorithms”
Anand Rajaraman Teaches Web Scale Data Mining
at Stanford University
1,048,576 Max rows in Excel 2010
Is that Big Data?
Big Data
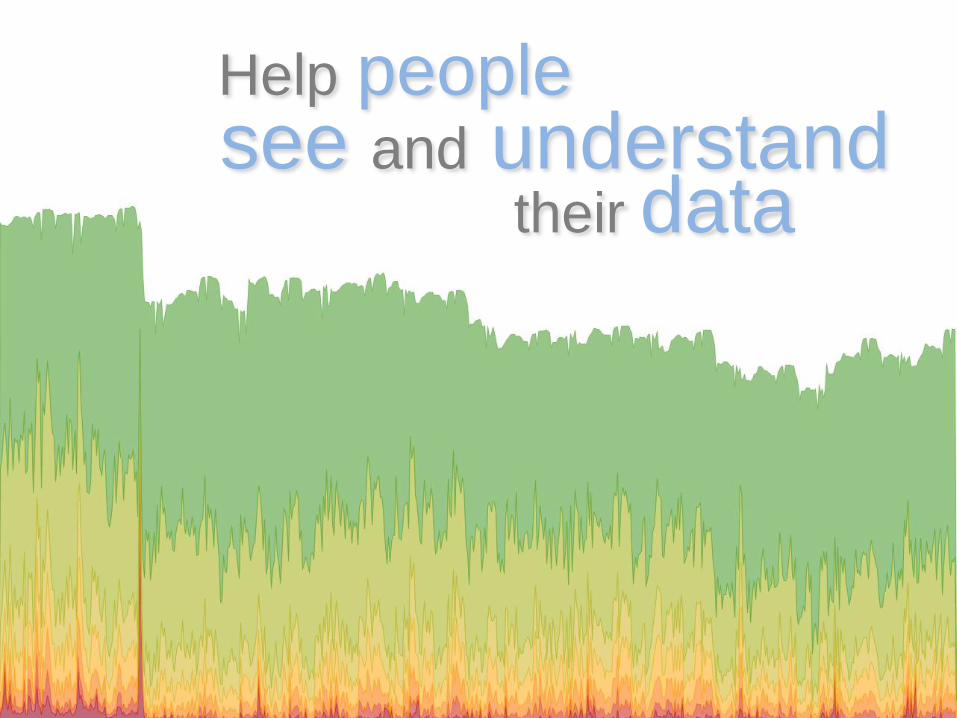
Help people
their data see and understand
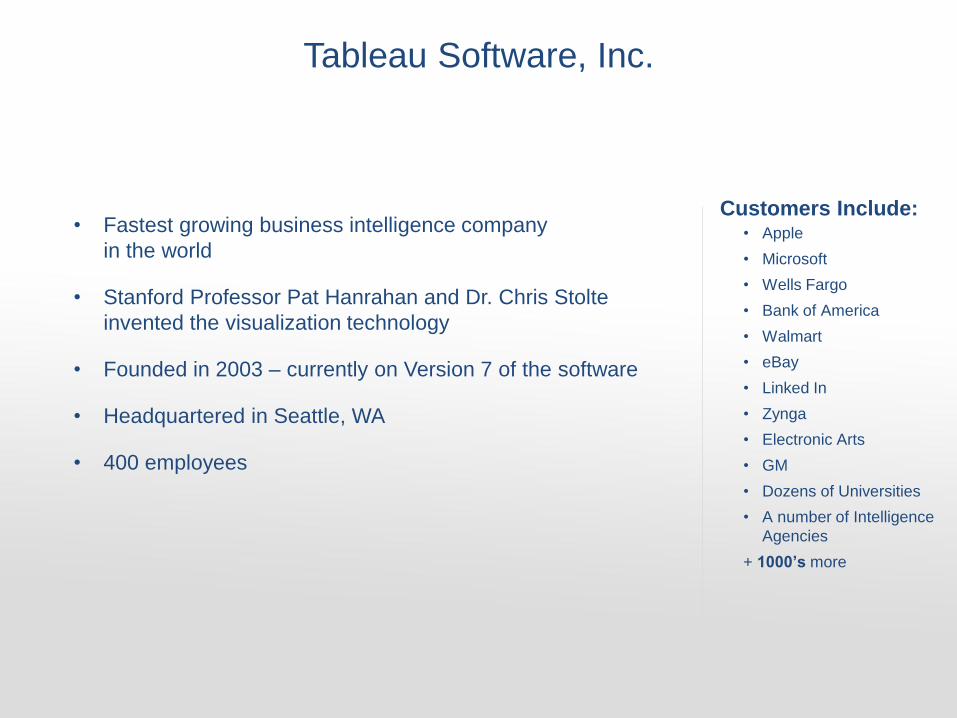
• Fastest growing business intelligence company
in the world
• Stanford Professor Pat Hanrahan and Dr. Chris Stolte
invented the visualization technology
• Founded in 2003 – currently on Version 7 of the software
• Headquartered in Seattle, WA
• 400 employees
Customers Include: • Apple
• Microsoft
• Wells Fargo
• Bank of America
• Walmart
• eBay
• Linked In
• Zynga
• Electronic Arts
• GM
• Dozens of Universities
• A number of Intelligence
Agencies
+ 1000’s more
Tableau Software, Inc.