Embed Size (px)
Citation preview
Propulsion Dynamics Inc.
6475 East Pacific Coast Highway, Suite 500, Long Beach, CA 90803, Office +1 562.495.9027, Fax: +1 562.684.0808
Propulsion Dynamics Europe
Stockholmsgade 43, DK-2100, Copenhagen 0, Denmark, Office +45 5191.6642, Fax: +45 6980.2270
www.propulsiondynamics.com
CASPER® is a registered trademark of Propulsion Dynamics Inc. All rights reserved.
39
38
37
36
35
34
33
32
31
30
29
28
27
26
25
24
23
22
21
20
19
18
17
16
15
14
12M
8
6
4
2
11M
8
6
4
2
10M
8
6
4
2
9M
8
6
4
2
8M
8
6
4
2
7M
8
6
4
2
6M
8
6
4
2
5M
8
6
4
2
4M
Hull Performance
Propeller efficiency
Trim optimization
SEEMP
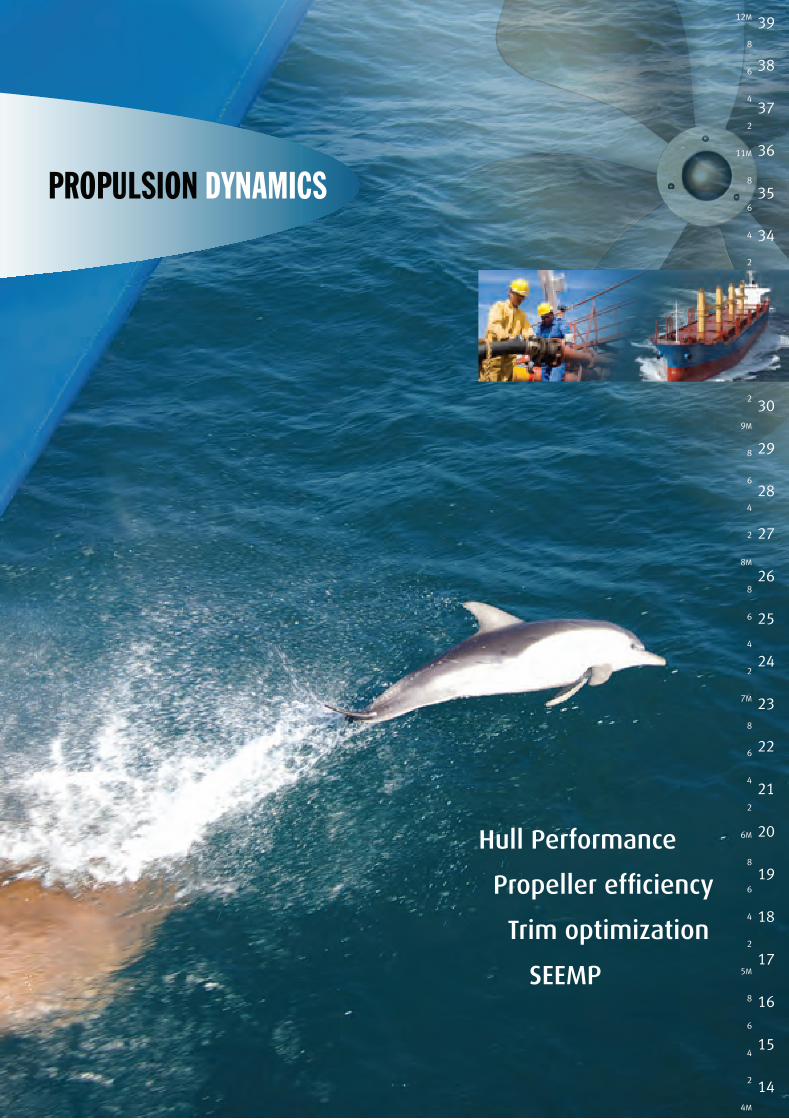
• Easy-to-use WEB based fleet-wide analysis tools
• Comparable efficiency benchmarking and recommendations
• Affordable and flexible pricing
• Experience 5+% improvement in fuel efficiency
• Skilled Naval Architects for in-depth analysis
• More than 2,500 ship-years experience
• Over 5,000 CASPER® Reports generated
• No CFD or extra hardware required
• Practical performance data collection
The CASPER® web-based reports containquantitative and qualitative information, including:
For vessel owners Evaluate total cost of ownership for pre-treatment of hull, final coating selection and optimal intervals for hull and/or propeller cleanings in service. Establish a tangible fleet-wide CO2 main-tenance index for green initiatives.
For chartered-out vesselsActualize highest charter rate possible, based on true performance, as well as projected speed losses over time due to hull and propeller condition and defined weather allowances. Furnish charter customers with documented actual propulsion efficiency and CO2 maintenance index.
For chartered-in vessels Measure hull and propeller performance of chartered-in vessels and document efficiency of vari-ous vessels under different ownership. Determine hull and propeller performance losses (for long term chartered vessels) due to port stays, and losses due to weather versus hull condition.
Hull and propeller performance monitoring by a fully independent company
Propulsion Dynamics Inc.
6475 East Pacific Coast Highway, Suite 500, Long Beach, CA 90803, Office +1 562.495.9027, Fax: +1 562.684.0808
Propulsion Dynamics Europe
Stockholmsgade 43, DK-2100, Copenhagen 0, Denmark, Office +45 5191.6642, Fax: +45 6980.2270
www.propulsiondynamics.com
CASPER® is a registered trademark of Propulsion Dynamics Inc. All rights reserved.
39
38
37
36
35
34
33
32
31
30
29
28
27
26
25
24
23
22
21
20
19
18
17
16
15
14
12M
8
6
4
2
11M
8
6
4
2
10M
8
6
4
2
9M
8
6
4
2
8M
8
6
4
2
7M
8
6
4
2
6M
8
6
4
2
5M
8
6
4
2
4M
Hull Performance
Propeller efficiency
Trim optimization
SEEMP
• Easy-to-use WEB based fleet-wide analysis tools
• Comparable efficiency benchmarking and recommendations
• Affordable and flexible pricing
• Experience 5+% improvement in fuel efficiency
• Skilled Naval Architects for in-depth analysis
• More than 2,500 ship-years experience
• Over 5,000 CASPER® Reports generated
• No CFD or extra hardware required
• Practical performance data collection
The CASPER® web-based reports containquantitative and qualitative information, including:
For vessel owners Evaluate total cost of ownership for pre-treatment of hull, final coating selection and optimal intervals for hull and/or propeller cleanings in service. Establish a tangible fleet-wide CO2 main-tenance index for green initiatives.
For chartered-out vesselsActualize highest charter rate possible, based on true performance, as well as projected speed losses over time due to hull and propeller condition and defined weather allowances. Furnish charter customers with documented actual propulsion efficiency and CO2 maintenance index.
For chartered-in vessels Measure hull and propeller performance of chartered-in vessels and document efficiency of vari-ous vessels under different ownership. Determine hull and propeller performance losses (for long term chartered vessels) due to port stays, and losses due to weather versus hull condition.
Hull and propeller performance monitoring by a fully independent company
PROPRIETARY
Added fuel consumption
Main engine performance
Page 4 of 4
Added fuel consumption at 15 m draft and 14 knots
0
2
4
6
8
10
09/1012/10
03/1106/11
09/1112/11
03/1206/12
09/12
Month since dry-dockingAd
ded
fu
el (
t/24h
)
Observations
Added fuel
Dry-dock
At anchor
Hull clean.
Prop. polish.
Event - damage
0
20
40
60
80
100
120
140
160
03/0809/08
03/0909/09
03/1009/10
03/1109/11
03/1209/12
Month/Year
M/E
Pow
er /
SF
OC
[%
]
Measured SFOC versus Shop-test
Trailing average
Engine load (observed power/MCR)
Evaluation
The latest observation seems to confirm the result from the previous report. M
ore observations are
still needed to confirm the result.
The graphs and information depicted therein contains copyrightable subject matter and is the exclusive property of Propulsion Dynamics Inc.
Reproduction in any form is strictly prohibited unless expressly authorized in writing by Propulsion Dynamics Inc.
PROPRIETARY
Comparison on speed and fuel consumptionCondition 1 Condition 2
1 Defined service condition
2 Draft aft
m
3 Draft fore
m
4 Mean draft
m
5 Trim
m
6 Service, NCR= % MCR%
7 Service speed (assumed)knots
8 Shaft generator powerkW
9 Fuel calorific valuekJ/kg
10 Actual added resistance%
11 FUEL CONSUMPTION
At service speed, incl. weather
allowance and shaft generator
12 Fuel consumption trial trip t/24h
13 Fuel consumption, end of actual period t/24h
14 Excessive fuel consumptiont/24h
15 Excessive fuel consumption%
16 SPEED
At service, NCR, incl weather
allowance and shaft generator
17 Speed trial trip
knots
18 Speed, end of actual periodknots
19 Speed reductionknots
20 Speed reduction
%
Fuel/CO2 index, service speed
Design index, Fuelg/tons
Maintenance index, Fueldisplace
Total Index, Fuelment/
Design index, CO2
nautical
Maintenance index, CO2
mile
Total Index, CO2
POSSIBLE FUEL SAVINGS
at NCR, provided that a
propeller/hull cleaning is carried out.
Fuel savings
t/24h
%
Page 3 of 4
14.2707.161
14.2705.300
14.2706.231
0.0001.861
8585
13.515
39.26
5.30
00
4070040700
1616
33.9634.97
15.609.05
13.98
13.60
15.66
1.56
1.1392.686
15.27
0.380.39
4.1769.2250.5640.766
0.53
2.722.49
1.3172.929
3.6128.460
0.1780.243
38.14
0.32
0.91
3.17
The graph and information depicted therein contains copyrightable subject matter and is the exclusive property of Propulsion Dynamics Inc.
Reproduction in any form is strictly prohibited unless expressly authorized in writing by Propulsion Dynamics Inc.
The graph and information depicted therein contains copyrightable subject matter and is the exclusive property of Propulsion Dynamics Inc.
Reproduction in any form is strictly prohibited unless expressly authorized in writing by Propulsion Dynamics Inc.
Propulsion Dynamics
Built
Report No.:45
MAINTENANCE:
Period:
to
Last dry-docking:
Report issuing date
Last propeller polishing/coating:
Last hull brushing:
Note:
Last unknown event:
o Fuel Consumption shown below is for propulsion only
o Wastage & auxiliary consumptions excluded
Loading conditions:Laden: Aft:
m Fore: m Disp.:
t
drafts and displacement Ballast: Aft:
Fore: m Disp.:
t
Roughness:
%
Weather:
%
Fuel oil calorific value, kJoule/kg
Page 1 of 4
7.161
5.300
34449
40700
16
5
14.270
14.270
87602
9/26/2012
7/8/2012
3/21/2011
8/20/2012
5/12/2007
8/31/20129/14/2012
12/8/2010
5
10
15
20
25
30
35
40
45
50
910
1112
1314
1516
17
Ship speed, Knots
Fu
el c
on
sum
pti
on
, t/
24
h
Fuel consumption, loaded condition
Fuel consumption, ballasted condition
Max.eng.power without overload, Condition 1
Max.eng.power without overload, Condition 2
Propulsion Dynamics Inc.
Phone 1-(562)495-9027
Report
The graph and information depicted therein contains copyrightable subject matter and is the exclusive property of Propulsion Dynamics Inc.
Reproduction in any form is strictly prohibited unless expressly authorized in writing by Propulsion Dynamics Inc.
25% MCR
40% MCR
65% MCR
85% MCR
100% MCR
Development of hull/propeller added resistance
Since last drydock (maximum up to 62 months)
Development rate for added resistance
Present period
Page 2 of 4
0.0%
0.5%
1.0%
1.5%
2.0%
09/10 12/10 03/11 06/11 09/11 12/11 03/12 06/12 09/12
Month/Year
% p
r m
on
th
Dev. rateDry-dockAt anchorHull clean.Prop. polish.Event - damage
0%
10%
20%
30%
40%
50%
60%
11 12 13 14 15 16 17 18 19 20 21 22 23 24
Month since dry-docking
Ad
ded
res
ista
nce
0%
10%
20%
30%
40%
50%
60%
09/10 12/10 03/11 06/11 09/11 12/11 03/12 06/12 09/12Month/Year
Ad
ded
res
ista
nce
ObservationsAdded resistanceDry-dockAt anchorHull clean.Prop. polish.Event - damage
The graphs and information depicted therein contains copyrightable subject matter and is the exclusive property of Propulsion Dynamics Inc.
Reproduction in any form is strictly prohibited unless expressly authorized in writing by Propulsion Dynamics Inc.
Introduction to CASPER®
Since 2002, Propulsion Dynamics (PDI) has provided shipowners and shipmanagers a web-based performance analysis service. CASPER® is a subscription service based on vessel performance data collected at regular intervals while making way.
This data is compared to sea trials (clean, smooth hull) using state-of-the-art naval architectural analysis. The results are CASPER® Reports that illustrate Actual Obtainable Speed/Con-sumption, Development of Hull and Propeller Resistance, Hull Efficiency, CO2 Indexing, Charter Party Analysis, and other tech-nical areas of propulsion efficiency.
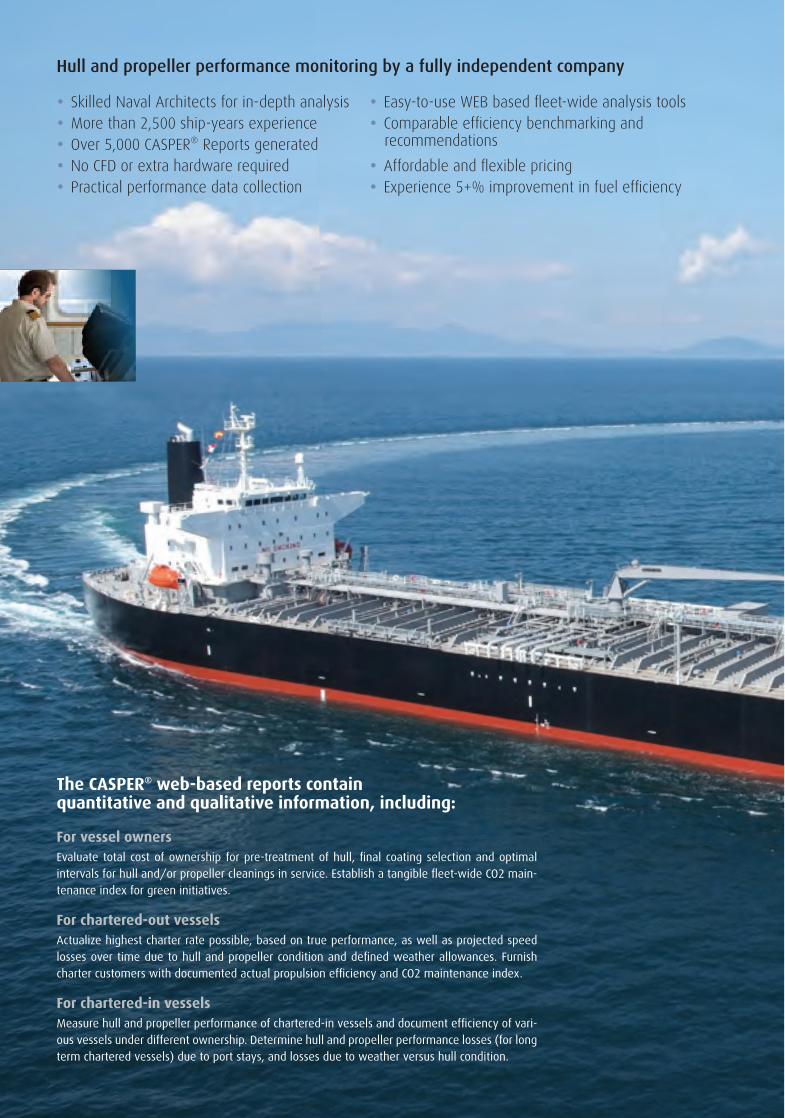
The following graph is an extract from a CASPER® Report, showing true vessel performance in comparison to sea trials, indicating precise speed and fuel losses due to hull and propeller condi-tion.
Actual Obtainable Speed/Consumption Curve
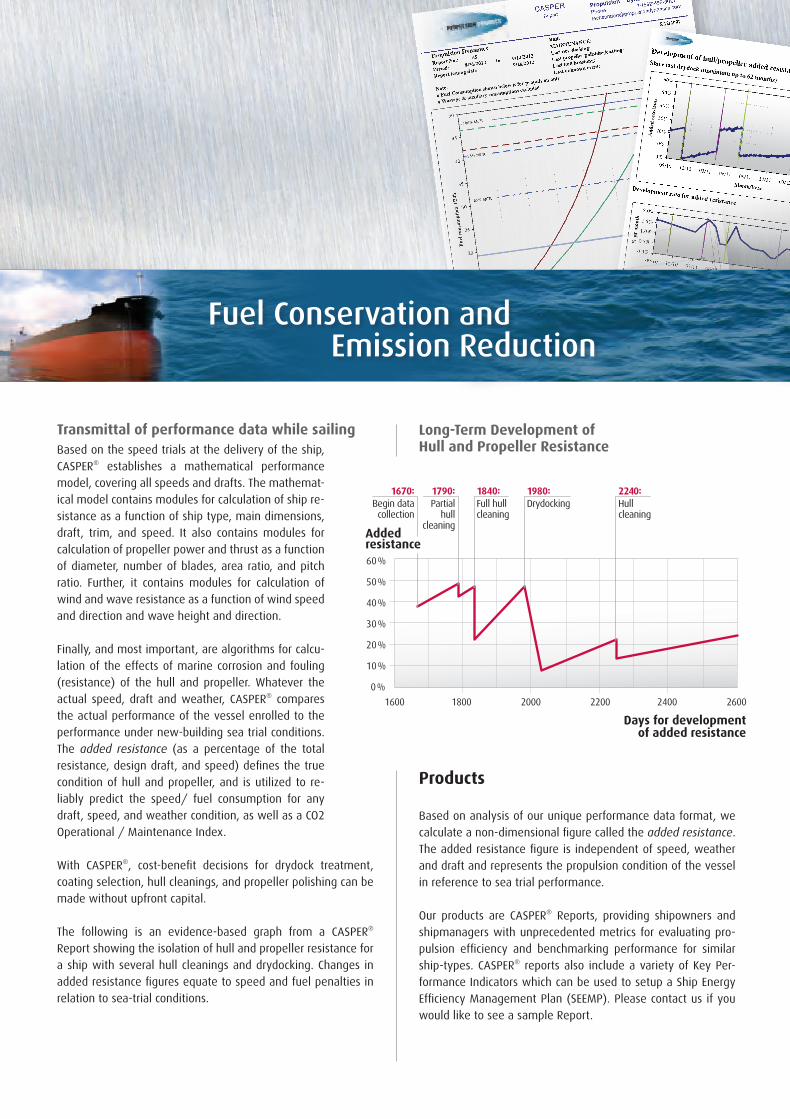
Transmittal of performance data while sailing Based on the speed trials at the delivery of the ship, CASPER® establishes a mathematical performance model, covering all speeds and drafts. The mathemat-ical model contains modules for calculation of ship re-sistance as a function of ship type, main dimensions, draft, trim, and speed. It also contains modules for calculation of propeller power and thrust as a function of diameter, number of blades, area ratio, and pitch ratio. Further, it contains modules for calculation of wind and wave resistance as a function of wind speed and direction and wave height and direction.
Finally, and most important, are algorithms for calcu-lation of the effects of marine corrosion and fouling (resistance) of the hull and propeller. Whatever the actual speed, draft and weather, CASPER® compares the actual performance of the vessel enrolled to the performance under new-building sea trial conditions. The added resistance (as a percentage of the total resistance, design draft, and speed) defines the true condition of hull and propeller, and is utilized to re-liably predict the speed/ fuel consumption for any draft, speed, and weather condition, as well as a CO2 Operational / Maintenance Index.
With CASPER®, cost-benefit decisions for drydock treatment, coating selection, hull cleanings, and propeller polishing can be made without upfront capital.
The following is an evidence-based graph from a CASPER®
Report showing the isolation of hull and propeller resistance for a ship with several hull cleanings and drydocking. Changes in added resistance figures equate to speed and fuel penalties in relation to sea-trial conditions.
The CASPER® Service can be initiated on any ship at any time and does not require additional software or equipment. Instead, performance data is recorded in a highly accurate recording pro-cess at specific intervals and transmitted to our offices. The per-formance data is fully corrected for wind, waves, sea current, draft/trim, fuel oil quality and other key variables that affect speed and fuel oil consumption. CASPER® is compatible with all engine monitoring and data recording systems.
Each vessel in our service receives individual attention from the naval architect on our staff to whom it has been specifically as-signed. Backed by more than 1,000 ship-years of experience, our analysis methods go beyond mere data filtering or trend monitoring, to achieve the most precise analysis and bench-marking of vessel performance in the industry.
How the CASPER® service works
Vessel registration The CASPER® method contains proprietary comput-erized mathematical models for ship resistance and propeller performance, so that the theoretical design power can be calculated for any ship for which length, breadth, draft, displacement, design speed and pro-peller design/RPM are known. The completion of our proprietary Vessel Registration Form provides PDI with these particulars, which are then entered into our computer as a baseline for the vessel(s) under analysis. Sea trial or model test data creates a correc-tion function transforming the general mathematical model into a specific ship performance model.
Long-Term Development ofHull and Propeller Resistance
Products
Based on analysis of our unique performance data format, we calculate a non-dimensional figure called the added resistance. The added resistance figure is independent of speed, weather and draft and represents the propulsion condition of the vessel in reference to sea trial performance.
Our products are CASPER® Reports, providing shipowners and shipmanagers with unprecedented metrics for evaluating pro-pulsion efficiency and benchmarking performance for similar ship-types. CASPER® reports also include a variety of Key Per-formance Indicators which can be used to setup a Ship Energy Efficiency Management Plan (SEEMP). Please contact us if you would like to see a sample Report.
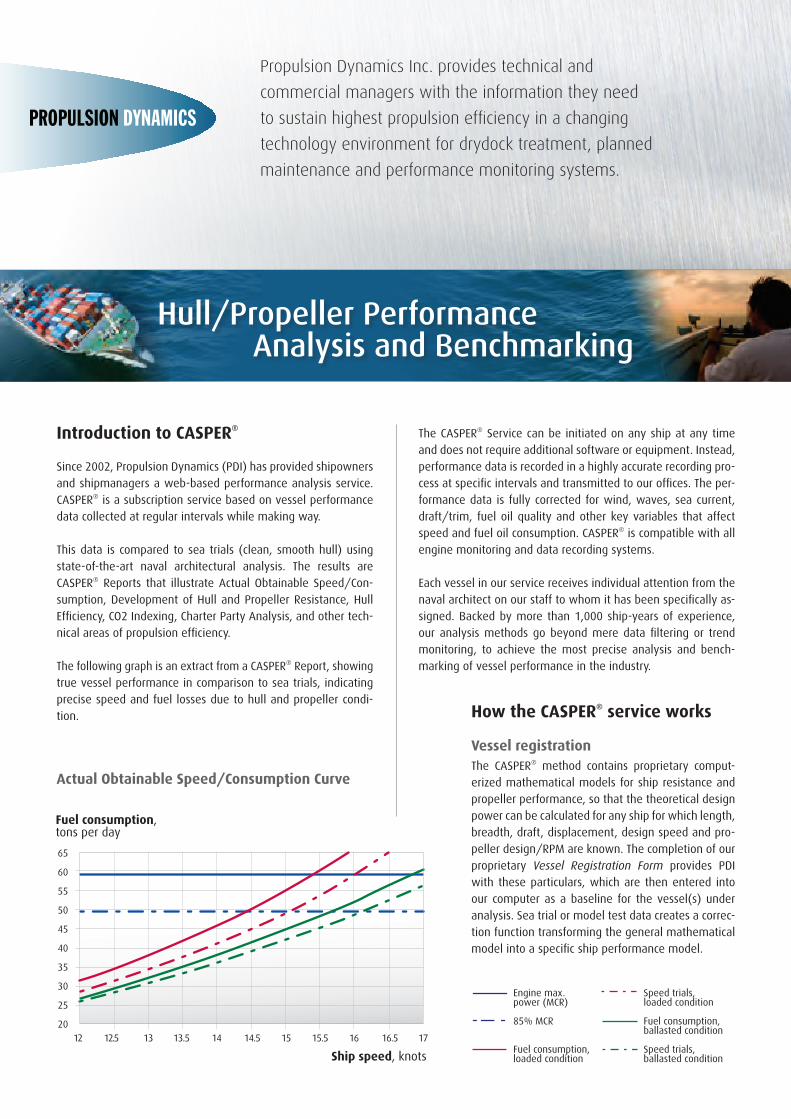
Propulsion Dynamics Inc. provides technical and
commercial managers with the information they need
to sustain highest propulsion efficiency in a changing
technology environment for drydock treatment, planned
maintenance and performance monitoring systems.
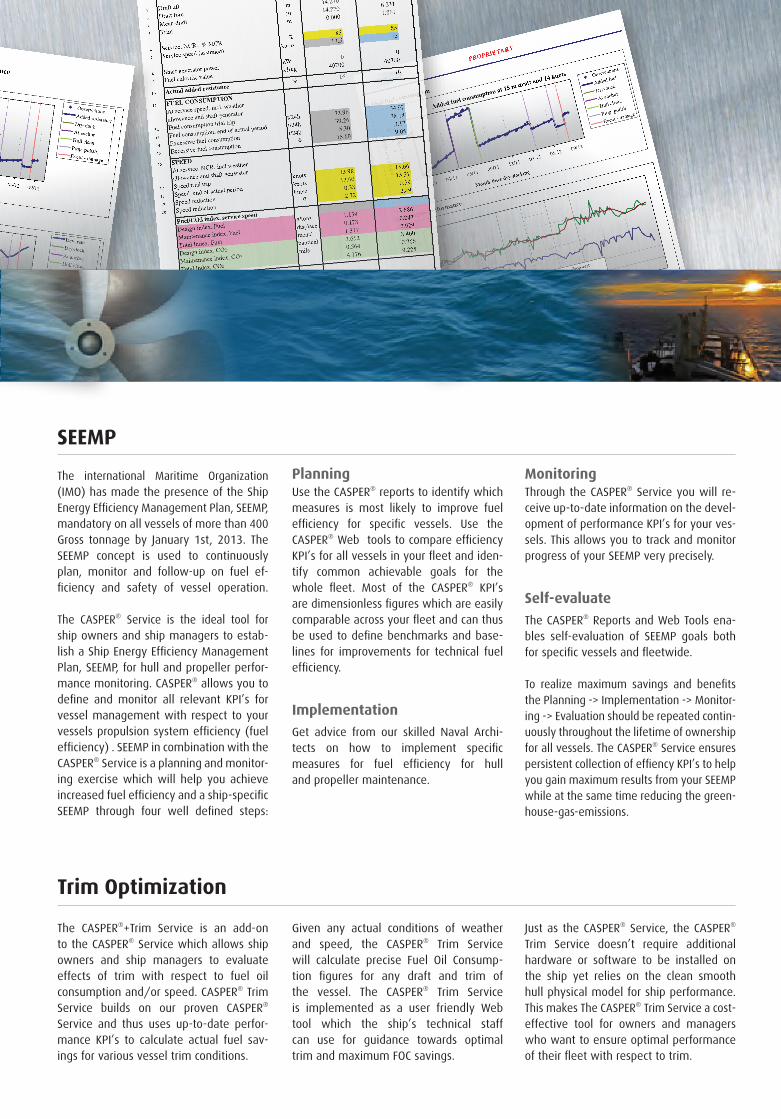
The international Maritime Organization (IMO) has made the presence of the Ship Energy Efficiency Management Plan, SEEMP, mandatory on all vessels of more than 400 Gross tonnage by January 1st, 2013. The SEEMP concept is used to continuously plan, monitor and follow-up on fuel ef-ficiency and safety of vessel operation. The CASPER® Service is the ideal tool for ship owners and ship managers to estab-lish a Ship Energy Efficiency Management Plan, SEEMP, for hull and propeller perfor-mance monitoring. CASPER® allows you to define and monitor all relevant KPI’s for vessel management with respect to your vessels propulsion system efficiency (fuel efficiency) . SEEMP in combination with the CASPER® Service is a planning and monitor-ing exercise which will help you achieve increased fuel efficiency and a ship-specific SEEMP through four well defined steps:
The CASPER®+Trim Service is an add-on to the CASPER® Service which allows ship owners and ship managers to evaluate effects of trim with respect to fuel oil consumption and/or speed. CASPER® Trim Service builds on our proven CASPER® Service and thus uses up-to-date perfor-mance KPI’s to calculate actual fuel sav-ings for various vessel trim conditions.
PlanningUse the CASPER® reports to identify which measures is most likely to improve fuel efficiency for specific vessels. Use the CASPER® Web tools to compare efficiency KPI’s for all vessels in your fleet and iden-tify common achievable goals for the whole fleet. Most of the CASPER® KPI’s are dimensionless figures which are easily comparable across your fleet and can thus be used to define benchmarks and base-lines for improvements for technical fuel efficiency.
Implementation
Get advice from our skilled Naval Archi- tects on how to implement specific measures for fuel efficiency for hull and propeller maintenance.
Given any actual conditions of weather and speed, the CASPER® Trim Service will calculate precise Fuel Oil Consump-tion figures for any draft and trim of the vessel. The CASPER® Trim Service is implemented as a user friendly Web tool which the ship’s technical staff can use for guidance towards optimal trim and maximum FOC savings.
MonitoringThrough the CASPER® Service you will re-ceive up-to-date information on the devel-opment of performance KPI’s for your ves-sels. This allows you to track and monitor progress of your SEEMP very precisely.
Self-evaluate
The CASPER® Reports and Web Tools ena-bles self-evaluation of SEEMP goals both for specific vessels and fleetwide. To realize maximum savings and benefits the Planning -> Implementation -> Monitor-ing -> Evaluation should be repeated contin-uously throughout the lifetime of ownership for all vessels. The CASPER® Service ensures persistent collection of effiency KPI’s to help you gain maximum results from your SEEMP while at the same time reducing the green-house-gas-emissions.
Just as the CASPER® Service, the CASPER® Trim Service doesn’t require additional hardware or software to be installed on the ship yet relies on the clean smooth hull physical model for ship performance. This makes The CASPER® Trim Service a cost-effective tool for owners and managers who want to ensure optimal performance of their fleet with respect to trim.
Trim Optimization
SEEMP
12 12.5 13 13.5 14 14.5 15 15.5 16 16.5 17
65
60
55
50
45
40
35
30
25
20
Engine max.power (MCR)
85% MCR
Fuel consumption, loaded condition
Fuel consumption,tons per day
Ship speed, knots
Speed trials,loaded condition
Fuel consumption, ballasted condition
Speed trials, ballasted condition
1600 1800 2000 2200 2400 2600
1670:Begin datacollection
60%
50%
40%
30%
20%
10%
0%
Addedresistance
Days for developmentof added resistance
1790:Partial
hullcleaning
1840:Full hullcleaning
1980:Drydocking
2240:Hullcleaning
12 12.5 13 13.5 14 14.5 15 15.5 16 16.5 17
65
60
55
50
45
40
35
30
25
20
Engine max.power (MCR)
85% MCR
Fuel consumption, loaded condition
Fuel consumption,tons per day
Ship speed, knots
Speed trials,loaded condition
Fuel consumption, ballasted condition
Speed trials, ballasted condition
Fuel Conservation and Emission Reduction
Hull/Propeller Performance Analysis and Benchmarking
PROPRIETARY
Added fuel consumption
Main engine performance
Page 4 of 4
Added fuel consumption at 15 m draft and 14 knots
0
2
4
6
8
10
09/1012/10
03/1106/11
09/1112/11
03/1206/12
09/12
Month since dry-dockingAd
ded
fu
el (
t/24h
)
Observations
Added fuel
Dry-dock
At anchor
Hull clean.
Prop. polish.
Event - damage
0
20
40
60
80
100
120
140
160
03/0809/08
03/0909/09
03/1009/10
03/1109/11
03/1209/12
Month/Year
M/E
Pow
er /
SF
OC
[%
]
Measured SFOC versus Shop-test
Trailing average
Engine load (observed power/MCR)
Evaluation
The latest observation seems to confirm the result from the previous report. M
ore observations are
still needed to confirm the result.
The graphs and information depicted therein contains copyrightable subject matter and is the exclusive property of Propulsion Dynamics Inc.
Reproduction in any form is strictly prohibited unless expressly authorized in writing by Propulsion Dynamics Inc.
PROPRIETARY
Comparison on speed and fuel consumptionCondition 1 Condition 2
1 Defined service condition
2 Draft aft
m
3 Draft fore
m
4 Mean draft
m
5 Trim
m
6 Service, NCR= % MCR%
7 Service speed (assumed)knots
8 Shaft generator powerkW
9 Fuel calorific valuekJ/kg
10 Actual added resistance%
11 FUEL CONSUMPTION
At service speed, incl. weather
allowance and shaft generator
12 Fuel consumption trial trip t/24h
13 Fuel consumption, end of actual period t/24h
14 Excessive fuel consumptiont/24h
15 Excessive fuel consumption%
16 SPEED
At service, NCR, incl weather
allowance and shaft generator
17 Speed trial trip
knots
18 Speed, end of actual periodknots
19 Speed reductionknots
20 Speed reduction
%
Fuel/CO2 index, service speed
Design index, Fuelg/tons
Maintenance index, Fueldisplace
Total Index, Fuelment/
Design index, CO2
nautical
Maintenance index, CO2
mile
Total Index, CO2
POSSIBLE FUEL SAVINGS
at NCR, provided that a
propeller/hull cleaning is carried out.
Fuel savings
t/24h
%
Page 3 of 4
14.2707.161
14.2705.300
14.2706.231
0.0001.861
8585
13.515
39.26
5.30
00
4070040700
1616
33.9634.97
15.609.05
13.98
13.60
15.66
1.56
1.1392.686
15.27
0.380.39
4.1769.2250.5640.766
0.53
2.722.49
1.3172.929
3.6128.460
0.1780.243
38.14
0.32
0.91
3.17
The graph and information depicted therein contains copyrightable subject matter and is the exclusive property of Propulsion Dynamics Inc.
Reproduction in any form is strictly prohibited unless expressly authorized in writing by Propulsion Dynamics Inc.
The graph and information depicted therein contains copyrightable subject matter and is the exclusive property of Propulsion Dynamics Inc.
Reproduction in any form is strictly prohibited unless expressly authorized in writing by Propulsion Dynamics Inc.
Propulsion Dynamics
Built
Report No.:45
MAINTENANCE:
Period:
to
Last dry-docking:
Report issuing date
Last propeller polishing/coating:
Last hull brushing:
Note:
Last unknown event:
o Fuel Consumption shown below is for propulsion only
o Wastage & auxiliary consumptions excluded
Loading conditions:Laden: Aft:
m Fore: m Disp.:
t
drafts and displacement Ballast: Aft:
Fore: m Disp.:
t
Roughness:
%
Weather:
%
Fuel oil calorific value, kJoule/kg
Page 1 of 4
7.161
5.300
34449
40700
16
5
14.270
14.270
87602
9/26/2012
7/8/2012
3/21/2011
8/20/2012
5/12/2007
8/31/20129/14/2012
12/8/2010
5
10
15
20
25
30
35
40
45
50
910
1112
1314
1516
17
Ship speed, Knots
Fu
el c
on
sum
pti
on
, t/
24
h
Fuel consumption, loaded condition
Fuel consumption, ballasted condition
Max.eng.power without overload, Condition 1
Max.eng.power without overload, Condition 2
Propulsion Dynamics Inc.
Phone 1-(562)495-9027
Report
The graph and information depicted therein contains copyrightable subject matter and is the exclusive property of Propulsion Dynamics Inc.
Reproduction in any form is strictly prohibited unless expressly authorized in writing by Propulsion Dynamics Inc.
25% MCR
40% MCR
65% MCR
85% MCR
100% MCR
Development of hull/propeller added resistance
Since last drydock (maximum up to 62 months)
Development rate for added resistance
Present period
Page 2 of 4
0.0%
0.5%
1.0%
1.5%
2.0%
09/10 12/10 03/11 06/11 09/11 12/11 03/12 06/12 09/12
Month/Year
% p
r m
on
th
Dev. rateDry-dockAt anchorHull clean.Prop. polish.Event - damage
0%
10%
20%
30%
40%
50%
60%
11 12 13 14 15 16 17 18 19 20 21 22 23 24
Month since dry-docking
Ad
ded
res
ista
nce
0%
10%
20%
30%
40%
50%
60%
09/10 12/10 03/11 06/11 09/11 12/11 03/12 06/12 09/12Month/Year
Ad
ded
res
ista
nce
ObservationsAdded resistanceDry-dockAt anchorHull clean.Prop. polish.Event - damage
The graphs and information depicted therein contains copyrightable subject matter and is the exclusive property of Propulsion Dynamics Inc.
Reproduction in any form is strictly prohibited unless expressly authorized in writing by Propulsion Dynamics Inc.
Introduction to CASPER®
Since 2002, Propulsion Dynamics (PDI) has provided shipowners and shipmanagers a web-based performance analysis service. CASPER® is a subscription service based on vessel performance data collected at regular intervals while making way.
This data is compared to sea trials (clean, smooth hull) using state-of-the-art naval architectural analysis. The results are CASPER® Reports that illustrate Actual Obtainable Speed/Con-sumption, Development of Hull and Propeller Resistance, Hull Efficiency, CO2 Indexing, Charter Party Analysis, and other tech-nical areas of propulsion efficiency.
The following graph is an extract from a CASPER® Report, showing true vessel performance in comparison to sea trials, indicating precise speed and fuel losses due to hull and propeller condi-tion.
Actual Obtainable Speed/Consumption Curve
Transmittal of performance data while sailing Based on the speed trials at the delivery of the ship, CASPER® establishes a mathematical performance model, covering all speeds and drafts. The mathemat-ical model contains modules for calculation of ship re-sistance as a function of ship type, main dimensions, draft, trim, and speed. It also contains modules for calculation of propeller power and thrust as a function of diameter, number of blades, area ratio, and pitch ratio. Further, it contains modules for calculation of wind and wave resistance as a function of wind speed and direction and wave height and direction.
Finally, and most important, are algorithms for calcu-lation of the effects of marine corrosion and fouling (resistance) of the hull and propeller. Whatever the actual speed, draft and weather, CASPER® compares the actual performance of the vessel enrolled to the performance under new-building sea trial conditions. The added resistance (as a percentage of the total resistance, design draft, and speed) defines the true condition of hull and propeller, and is utilized to re-liably predict the speed/ fuel consumption for any draft, speed, and weather condition, as well as a CO2 Operational / Maintenance Index.
With CASPER®, cost-benefit decisions for drydock treatment, coating selection, hull cleanings, and propeller polishing can be made without upfront capital.
The following is an evidence-based graph from a CASPER®
Report showing the isolation of hull and propeller resistance for a ship with several hull cleanings and drydocking. Changes in added resistance figures equate to speed and fuel penalties in relation to sea-trial conditions.
The CASPER® Service can be initiated on any ship at any time and does not require additional software or equipment. Instead, performance data is recorded in a highly accurate recording pro-cess at specific intervals and transmitted to our offices. The per-formance data is fully corrected for wind, waves, sea current, draft/trim, fuel oil quality and other key variables that affect speed and fuel oil consumption. CASPER® is compatible with all engine monitoring and data recording systems.
Each vessel in our service receives individual attention from the naval architect on our staff to whom it has been specifically as-signed. Backed by more than 1,000 ship-years of experience, our analysis methods go beyond mere data filtering or trend monitoring, to achieve the most precise analysis and bench-marking of vessel performance in the industry.
How the CASPER® service works
Vessel registration The CASPER® method contains proprietary comput-erized mathematical models for ship resistance and propeller performance, so that the theoretical design power can be calculated for any ship for which length, breadth, draft, displacement, design speed and pro-peller design/RPM are known. The completion of our proprietary Vessel Registration Form provides PDI with these particulars, which are then entered into our computer as a baseline for the vessel(s) under analysis. Sea trial or model test data creates a correc-tion function transforming the general mathematical model into a specific ship performance model.
Long-Term Development ofHull and Propeller Resistance
Products
Based on analysis of our unique performance data format, we calculate a non-dimensional figure called the added resistance. The added resistance figure is independent of speed, weather and draft and represents the propulsion condition of the vessel in reference to sea trial performance.
Our products are CASPER® Reports, providing shipowners and shipmanagers with unprecedented metrics for evaluating pro-pulsion efficiency and benchmarking performance for similar ship-types. CASPER® reports also include a variety of Key Per-formance Indicators which can be used to setup a Ship Energy Efficiency Management Plan (SEEMP). Please contact us if you would like to see a sample Report.
Propulsion Dynamics Inc. provides technical and
commercial managers with the information they need
to sustain highest propulsion efficiency in a changing
technology environment for drydock treatment, planned
maintenance and performance monitoring systems.
The international Maritime Organization (IMO) has made the presence of the Ship Energy Efficiency Management Plan, SEEMP, mandatory on all vessels of more than 400 Gross tonnage by January 1st, 2013. The SEEMP concept is used to continuously plan, monitor and follow-up on fuel ef-ficiency and safety of vessel operation. The CASPER® Service is the ideal tool for ship owners and ship managers to estab-lish a Ship Energy Efficiency Management Plan, SEEMP, for hull and propeller perfor-mance monitoring. CASPER® allows you to define and monitor all relevant KPI’s for vessel management with respect to your vessels propulsion system efficiency (fuel efficiency) . SEEMP in combination with the CASPER® Service is a planning and monitor-ing exercise which will help you achieve increased fuel efficiency and a ship-specific SEEMP through four well defined steps:
The CASPER®+Trim Service is an add-on to the CASPER® Service which allows ship owners and ship managers to evaluate effects of trim with respect to fuel oil consumption and/or speed. CASPER® Trim Service builds on our proven CASPER® Service and thus uses up-to-date perfor-mance KPI’s to calculate actual fuel sav-ings for various vessel trim conditions.
PlanningUse the CASPER® reports to identify which measures is most likely to improve fuel efficiency for specific vessels. Use the CASPER® Web tools to compare efficiency KPI’s for all vessels in your fleet and iden-tify common achievable goals for the whole fleet. Most of the CASPER® KPI’s are dimensionless figures which are easily comparable across your fleet and can thus be used to define benchmarks and base-lines for improvements for technical fuel efficiency.
Implementation
Get advice from our skilled Naval Archi- tects on how to implement specific measures for fuel efficiency for hull and propeller maintenance.
Given any actual conditions of weather and speed, the CASPER® Trim Service will calculate precise Fuel Oil Consump-tion figures for any draft and trim of the vessel. The CASPER® Trim Service is implemented as a user friendly Web tool which the ship’s technical staff can use for guidance towards optimal trim and maximum FOC savings.
MonitoringThrough the CASPER® Service you will re-ceive up-to-date information on the devel-opment of performance KPI’s for your ves-sels. This allows you to track and monitor progress of your SEEMP very precisely.
Self-evaluate
The CASPER® Reports and Web Tools ena-bles self-evaluation of SEEMP goals both for specific vessels and fleetwide. To realize maximum savings and benefits the Planning -> Implementation -> Monitor-ing -> Evaluation should be repeated contin-uously throughout the lifetime of ownership for all vessels. The CASPER® Service ensures persistent collection of effiency KPI’s to help you gain maximum results from your SEEMP while at the same time reducing the green-house-gas-emissions.
Just as the CASPER® Service, the CASPER® Trim Service doesn’t require additional hardware or software to be installed on the ship yet relies on the clean smooth hull physical model for ship performance. This makes The CASPER® Trim Service a cost-effective tool for owners and managers who want to ensure optimal performance of their fleet with respect to trim.
Trim Optimization
SEEMP
12 12.5 13 13.5 14 14.5 15 15.5 16 16.5 17
65
60
55
50
45
40
35
30
25
20
Engine max.power (MCR)
85% MCR
Fuel consumption, loaded condition
Fuel consumption,tons per day
Ship speed, knots
Speed trials,loaded condition
Fuel consumption, ballasted condition
Speed trials, ballasted condition
1600 1800 2000 2200 2400 2600
1670:Begin datacollection
60%
50%
40%
30%
20%
10%
0%
Addedresistance
Days for developmentof added resistance
1790:Partial
hullcleaning
1840:Full hullcleaning
1980:Drydocking
2240:Hullcleaning
12 12.5 13 13.5 14 14.5 15 15.5 16 16.5 17
65
60
55
50
45
40
35
30
25
20
Engine max.power (MCR)
85% MCR
Fuel consumption, loaded condition
Fuel consumption,tons per day
Ship speed, knots
Speed trials,loaded condition
Fuel consumption, ballasted condition
Speed trials, ballasted condition
Fuel Conservation and Emission Reduction
Hull/Propeller Performance Analysis and Benchmarking

Propulsion Dynamics Inc.
6475 East Pacific Coast Highway, Suite 500, Long Beach, CA 90803, Office +1 562.495.9027, Fax: +1 562.684.0808
Propulsion Dynamics Europe
Stockholmsgade 43, DK-2100, Copenhagen 0, Denmark, Office +45 5191.6642, Fax: +45 6980.2270
www.propulsiondynamics.com
CASPER® is a registered trademark of Propulsion Dynamics Inc. All rights reserved.
39
38
37
36
35
34
33
32
31
30
29
28
27
26
25
24
23
22
21
20
19
18
17
16
15
14
12M
8
6
4
2
11M
8
6
4
2
10M
8
6
4
2
9M
8
6
4
2
8M
8
6
4
2
7M
8
6
4
2
6M
8
6
4
2
5M
8
6
4
2
4M
Hull Performance
Propeller efficiency
Trim optimization
SEEMP
• Easy-to-use WEB based fleet-wide analysis tools
• Comparable efficiency benchmarking and recommendations
• Affordable and flexible pricing
• Experience 5+% improvement in fuel efficiency
• Skilled Naval Architects for in-depth analysis
• More than 2,500 ship-years experience
• Over 5,000 CASPER® Reports generated
• No CFD or extra hardware required
• Practical performance data collection
The CASPER® web-based reports containquantitative and qualitative information, including:
For vessel owners Evaluate total cost of ownership for pre-treatment of hull, final coating selection and optimal intervals for hull and/or propeller cleanings in service. Establish a tangible fleet-wide CO2 main-tenance index for green initiatives.
For chartered-out vesselsActualize highest charter rate possible, based on true performance, as well as projected speed losses over time due to hull and propeller condition and defined weather allowances. Furnish charter customers with documented actual propulsion efficiency and CO2 maintenance index.
For chartered-in vessels Measure hull and propeller performance of chartered-in vessels and document efficiency of vari-ous vessels under different ownership. Determine hull and propeller performance losses (for long term chartered vessels) due to port stays, and losses due to weather versus hull condition.
Hull and propeller performance monitoring by a fully independent company