Embed Size (px)
Citation preview

SECTION II
PUERTO RICOBROADBAND
INFRASTRUCTURE2011-2014

1 4
PUERTO RICO BROADBANDINFRASTRUCTURE 2011-2014
II
G I G A B I T I S L A N D P L A N
This section analyzes the most current broadband inventory across Puerto Rico and identifies broadband infrastructure gaps at various connection speeds across the Island. The broadband inventory is based on data collected by Connect Puerto Rico, a nonprofit organization working on behalf of the Office of the Chief Information Officer of the Government of Puerto Rico (OCIO), as part of the State Broadband Initiative (SBI) federal grant program. Since 2010, this federal effort has been implemented in partnership with U.S. states and territories to collect and submit data to the Department of Commerce on a bi-annual basis for incorporation into the National Broadband Map. Funding for this program was made available through the American Recovery and Reinvestment Act. The interactive map and additional broadband data can be found at www.connectpr.org.
Based on this data, this section examines the growth of broadband capacity across the Island from 2011 to 2014, and benchmarks the current state of broadband against the Puerto Rico Broadband Taskforce capacity goals set for 2015. Further, the section examines broadband market trends, focusing in particular on investment and revenue streams within the sector and the remaining gap(s) that Puerto Rico must address in order to become the Gigabit Island.
ISLANDWIDE BROADBAND INFRASTRUCTURE
The National Broadband Plan released in 2010 recommended that all Americans have access to minimum broadband speeds of 4 Mbps download and 1 Mbps upload.18 The speed tier collected under the SBI initiative and NTIA guidelines nearest to that is 3 Mbps download and 768 Kbps upload.
As seen in the following table, 90.8% of households across the Island have access to 3 Mbps download and 768 Kbps upload as of June 2014. However, that leaves approximately 125,000 households in Puerto Rico without access to the 3 Mbps download/768 Kbps upload speed tier.

1 5
PUERTO RICO BROADBANDINFRASTRUCTURE 2011-2014
II
G I G A B I T I S L A N D P L A N
Broadband Availability by Speed Tier Among Fixed Platforms*
Minimum Down / Up Speed % Households Served**
2011 2012 2013 2014
At Least 768 Kbps/200 Kbps 85.2 85.8 89.4 90.9
At Least 1.5 Mbps/200 Kbps 84.4 85.0 89.1 90.8
At Least 3 Mbps/768 Kbps 77.8 85.0 89.1 90.8
At Least 6 Mbps/1.5 Mbps 33.1 56.4 77.3 79.7
At Least 10 Mbps/1.5 Mbps 24.5 49.0 77.1 77.9
At Least 25 Mbps/1.5 Mbps 0 49.0 77.1 77.9
At Least 50 Mbps/1.5 Mbps 0 24.3 24.3 76.9
At Least 100 Mbps/1.5 Mbps 0 0.3 0.3 52.9
At Least 1 Gbps/1.5 Mbps 0 0.0 0.0 0.0
The following table displays estimates regarding the percentage of households across Puerto Rico having broadband available at the 3 Mbps download and 768 Kbps upload speed tier or greater by broadband platform type, followed by a broadband inventory map of advertised speeds of at least 3 Mbps download and 768 Kbps upload.
Broadband Availability by Broadband Platform*
Platform% of Households Served at > 3 Mbps Down /
768 Kbps Up
2011 2012 2013 2014
Cable 61.3 77.9 76.9 77.0
DSL N/A 62.6 65.0 67.1
Fiber** 0.0 0.3 0.3 0.1
Fixed Wireless 25.2 31.7 49.9 58.0
All Platforms Except Mobile 56.9 85.0 89.1 90.9
Mobile Wireless 98.9 99.7 99.8 99.9
All Platforms 99.0 99.8 99.8 99.9
Source: Connect Puerto Rico.* Inventory estimate as of June 30 each year. ** The reported reduction in Fiber to the Home (FTTH) estimate does not reflect a decrease in fiber infrastructure but rather a nuanced interpretation of broadband availability estimates based on federal guidelines set by the U.S. Department of Commerce. According to these rules, broadband service is deemed “available” if service can be activated within 7 to 10 business days following a customer request without an extraordinary commitment of resources. Due to business models chosen by some providers laying FTTH in Puerto Rico, plans for build-out included in earlier versions of the Puerto Rico broadband inventory have been removed until such networks are actually constructed.
Source: Connect Puerto Rico. *Inventory estimate as of June 30 each year. Broadband platforms include cable, DSL, fixed wireless, and fiber. Mobile broadband platform is excluded. ** Total households based on 2010 Census data of 1,373,000.

1 6
PUERTO RICO BROADBANDINFRASTRUCTURE 2011-2014
II
G I G A B I T I S L A N D P L A N
BROADBAND INVENTORY - ADVERTISED SPEED OF AT LEAST 3 MBPS DOWN / 768 KBPS UP – JUNE 2014
The following map displays the broadband inventory of advertised speeds of at least 10 Mbps download and 1.5 Mbps upload. The served areas in pink cover 78% of all households in Puerto Rico.
BROADBAND INVENTORY - ADVERTISED SPEED OF AT LEAST 10 MBPS DOWN / 1.5 MBPS UP – JUNE 2014
Symbology
Primary Road
Water
National LandsCity
Municipality BoundaryTerrestrial, Non-Mobile Broadband Service
Unserved Areas
1 7
PUERTO RICO BROADBANDINFRASTRUCTURE 2011-2014
II
G I G A B I T I S L A N D P L A N
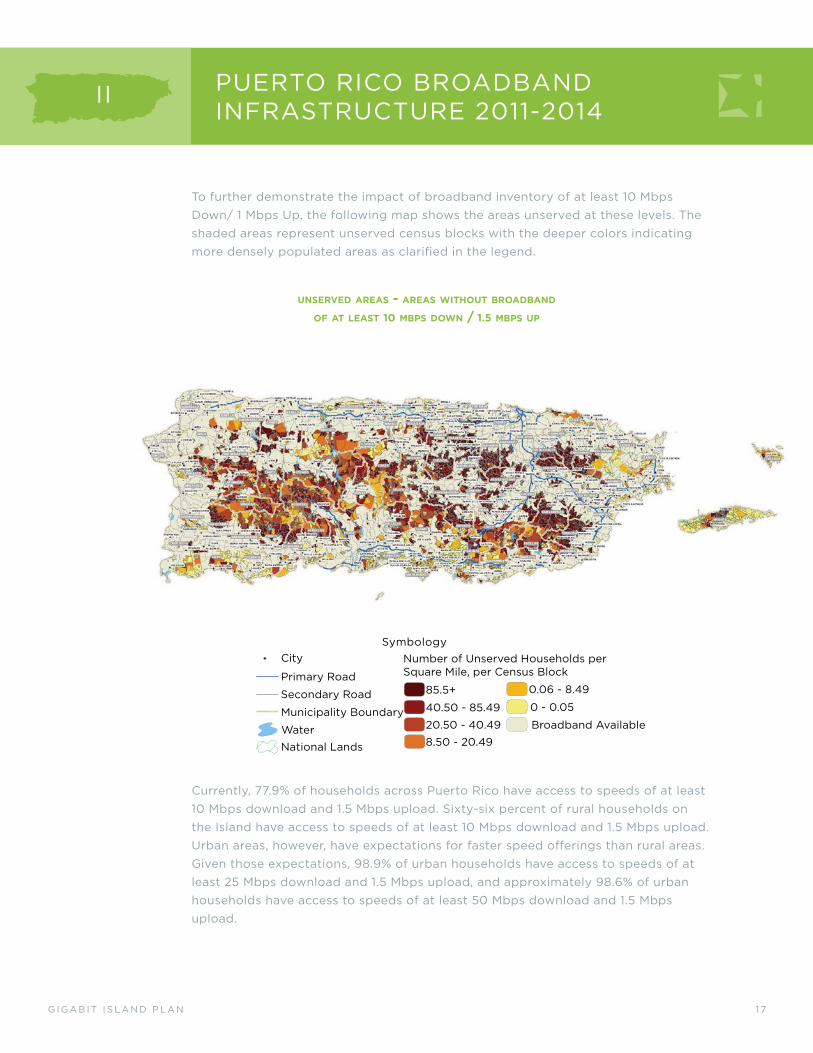
To further demonstrate the impact of broadband inventory of at least 10 Mbps Down/ 1 Mbps Up, the following map shows the areas unserved at these levels. The shaded areas represent unserved census blocks with the deeper colors indicating more densely populated areas as clarified in the legend.
UNSERVED AREAS - AREAS WITHOUT BROADBAND OF AT LEAST 10 MBPS DOWN / 1.5 MBPS UP
Currently, 77.9% of households across Puerto Rico have access to speeds of at least 10 Mbps download and 1.5 Mbps upload. Sixty-six percent of rural households on the Island have access to speeds of at least 10 Mbps download and 1.5 Mbps upload. Urban areas, however, have expectations for faster speed offerings than rural areas. Given those expectations, 98.9% of urban households have access to speeds of at least 25 Mbps download and 1.5 Mbps upload, and approximately 98.6% of urban households have access to speeds of at least 50 Mbps download and 1.5 Mbps upload.
SymbologyNumber of Unserved Households perSquare Mile, per Census Block
85.5+
8.50 - 20.49
40.50 - 85.49
20.50 - 40.49
National Lands
City
Primary Road
Secondary Road
Municipality Boundary
Water
0 - 0.05
0.06 - 8.49
Broadband Available

1 8
PUERTO RICO BROADBANDINFRASTRUCTURE 2011-2014
II
G I G A B I T I S L A N D P L A N
Broadband Availability Across Rural and Urban Households**
Down / Up Speed % of Households Served*
Island-wide Urban Rural
At Least 3 Mbps/768 Kbps 90.77 99.99 85.20
At Least 6 Mbps/1.5 Mbps 79.73 99.65 68.13
At Least 10 Mbps/1.5 Mbps 77.87 98.87 65.96
At Least 25 Mbps/1.5 Mbps 77.87 98.87 65.95
At Least 50 Mbps/1.5 Mbps 76.90 98.60 64.84
At Least 100 Mbps/1.5 Mbps 52.90 81.18 36.29
At Least 1 Gbps/1.5 Mbps 0 0 0
Source: Connect Puerto Rico.*Inventory estimate as of June 30 each year. Broadband platforms include cable, DSL, fixed wireless, and fiber. Mobile broadband platform is excluded.** Rural areas are defined as any area, as confirmed by the latest decennial census of the Bureau of the Census, which is not located within: (i) a city, town, or incorporated area that has a population of greater than 20,000 inhabitants; or (ii) an urbanized area contiguous and adjacent to a city or town that has a population of greater than 50,000 inhabitants. For purposes of the definition of rural area, an urbanized area means a densely populated territory as defined in the latest decennial census of the U.S. Census Bureau.
While important infrastructure gaps remain, particularly across rural areas of the Island, the 2014 broadband landscape demonstrates strong growth in broadband deployment across most urban and suburban areas over the last four years. The following maps demonstrate this investment from 2011-2014. The speed tiers represented in the mapping legend were established by the NTIA and reflect maximum advertised download speeds.

1 9
PUERTO RICO BROADBANDINFRASTRUCTURE 2011-2014
II
G I G A B I T I S L A N D P L A N
BROADBAND INVENTORY BY SPEED TIER 2011-2014
2011
2012
Symbology
Tier 10 (100 Mbps to < 1 Gbps)
Tier 9 (50 Mbps to < 100 Mbps)
Tier 8 (25 Mbps to < 50 Mbps)
Tier 6 (6 Mbps to < 10 Mbps)
Tier 7 (10 Mbps to < 25 Mbps)
City
Primary Road
Secondary Road
Municipality Boundary
Water
National Lands
Tier 5 (3 Mbps to < 6 Mbps)
Tier 4 (1.5 Mbps to < 3 Mbps)Tier 3 (768 Kbps to < 1.5 Mbps)Unserved Areas

2 0
PUERTO RICO BROADBANDINFRASTRUCTURE 2011-2014
II
G I G A B I T I S L A N D P L A N
2013
2014
Symbology
Tier 10 (100 Mbps to < 1 Gbps)
Tier 9 (50 Mbps to < 100 Mbps)
Tier 8 (25 Mbps to < 50 Mbps)
Tier 6 (6 Mbps to < 10 Mbps)
Tier 7 (10 Mbps to < 25 Mbps)
City
Primary Road
Secondary Road
Municipality Boundary
Water
National Lands
Tier 5 (3 Mbps to < 6 Mbps)
Tier 4 (1.5 Mbps to < 3 Mbps)Tier 3 (768 Kbps to < 1.5 Mbps)Unserved Areas

2 1
PUERTO RICO BROADBANDINFRASTRUCTURE 2011-2014
II
G I G A B I T I S L A N D P L A N
As reflected in the map of broadband availability at speeds of 50 Mbps download/ 1.5 Mbps upload, below, this growth is the result of an aggressive capacity upgrade of cable networks, as well as deployment of fiber by other broadband providers. Broadband capacity is expected to grow across Puerto Rico as commercial and public enterprises develop business models to deploy fiber-to-the-home (FTTH). Some of such projects are described in detail below.
BROADBAND INVENTORY BY PLATFORM - ADVERTISED SPEED OF AT LEAST 50 MBPS DOWN / 1.5 MBPS UP – JUNE 2014
Symbology
City
Primary Road
Secondary Road
Municipality Boundary
Water
National Lands
Fiber Broadband Available
Cable Broadband Available
Unserved Areas

2 2
PUERTO RICO BROADBANDINFRASTRUCTURE 2011-2014
II
G I G A B I T I S L A N D P L A N
BROADBAND LANDSCAPE BY MUNICIPALITY
Broadband Availability by Municipality*
% of Households Served
Municipality Household Density**Number of Households
At > 3 Mbps Down / 768 Kbps Up
At > 10 Mbps Down / 1.5 Mbps Up
Adjuntas 102.1 6,851 47.0 34.2
Aguada 332.8 15,156 94.4 92.3
Aguadilla 311.6 23,552 98.4 98.1
Aguas Buenas 333.6 10,040 75.4 31.5
Aibonito 298.9 9,367 63.4 40.6
Anasco 243.6 10,942 83.1 80.1
Arecibo 213.7 36,579 89.2 75.8
Arroyo 201.7 7,191 88.3 85.8
Barceloneta 296.5 9,165 94.6 90.4
Barranquitas 297.3 10,191 63.5 50.6
Bayamon 1726.1 76,834 98.1 89.1
Cabo Rojo 111.7 19,816 91.3 87.4
Caguas 901.9 53,273 99.1 77.2
Camuy 205.8 12,752 75.2 61.1
Canovanas 502.3 16,579 96.1 66.7
Carolina 1113.9 67,192 98.0 91.6
Catano 1434.9 10,108 99.9 65.5
Cayey 340.3 17,681 94.0 66.2
Ceiba 32.8 5,213 89.0 83.7
Ciales 97.2 6,487 59.0 38.5
Cidra 415.2 15,135 96.0 50.6
Coamo 183.0 14,281 72.6 68.8
Comerio 248.8 7,097 69.9 53.5
Corozal 292.3 12,446 73.2 43.3
Culebra 4.4 749 48.7 0.0
Dorado 248.4 13,342 99.3 81.2
Fajardo 132.2 13,922 89.9 89.4
Florida 295.2 4,494 78.8 66.3
Guanica 90.9 7,223 91.2 86.8
Guayama 152.1 16,244 87.0 82.3
Guayanilla 116.8 7,503 76.8 72.2
Guaynabo 1347.1 37,402 97.0 82.9
Gurabo 556.4 15,753 99.5 70.8
Hatillo 261.8 15,386 88.3 74.2
Hormigueros 601.3 6,821 97.0 93.3
Humacao 305.1 21,780 97.7 79.1
Isabela 185.9 17,072 91.5 91.0
Jayuya 125.1 5,569 64.4 55.9

2 3
PUERTO RICO BROADBANDINFRASTRUCTURE 2011-2014
II
G I G A B I T I S L A N D P L A N
Municipality Household Density**Number of Households
At > 3 Mbps Down / 768 Kbps Up
At > 10 Mbps Down / 1.5 Mbps Up
Juana Diaz 161.0 17,252 93.7 85.1
Juncos 540.4 14,382 100.0 75.8
Lajas 95.6 9,670 87.9 85.6
Lares 181.0 11,154 55.8 40.2
Las Marias 76.6 3,561 40.1 34.5
Las Piedras 414.8 14,058 100.0 62.3
Loiza 154.4 10,130 98.8 83.5
Luquillo 156.9 7,302 82.0 80.3
Manati 230.7 16,309 85.3 78.3
Maricao 62.5 2,289 33.6 0.2
Maunabo 116.2 4,446 76.1 63.2
Mayaguez 130.6 35,805 96.3 93.9
Moca 285.1 14,360 88.2 86.2
Morovis 279.0 10,859 79.8 67.5
Naguabo 135.0 9,755 97.9 73.0
Naranjito 366.3 10,163 80.1 34.0
Orocovis 122.5 7,812 83.4 37.1
Patillas 96.6 7,271 72.8 70.8
Penuelas 115.9 7,863 78.9 74.4
Ponce 310.2 60,049 96.8 90.4
Quebradillas 274.9 9,442 92.8 89.0
Rincon 110.2 5,998 87.8 84.2
Rio Grande 210.8 18,869 85.4 78.0
Sabana Grande 261.5 9,372 85.8 82.0
Salinas 99.9 11,400 89.2 73.9
San German 248.4 13,542 79.4 73.3
San Juan 2148.2 165,316 100.0 99.0
San Lorenzo 277.2 14,746 99.8 38.1
San Sebastian 225.3 16,047 59.0 48.9
Santa Isabel 106.9 8,225 90.8 82.1
Toa Alta 889.5 24,515 95.9 57.2
Toa Baja 780.2 32,617 99.9 79.5
Trujillo Alto 1259.7 26,935 98.0 77.8
Utuado 103.3 11,885 64.6 42.8
Vega Alta 371.3 13,925 93.2 75.2
Vega Baja 312.9 21,335 88.9 74.5
Vieques 13.9 3,666 43.2 0.0
Villalba 226.1 8,373 71.5 63.2
Yabucoa 162.3 13,507 77.7 46.1
Yauco 220.0 15,138 73.0 72.1
Source: Connect Puerto Rico inventory estimate as of June 30, 2014.*Includes cable, DSL, fixed wireless and fiber platforms. Excludes mobile platforms**Household density = average households per square mile in Municipality.
Broadband Availability by Municipality*
% of Households Served

24
PUERTO RICO BROADBANDINFRASTRUCTURE 2011-2014
II
G I G A B I T I S L A N D P L A N
BROADBAND AVAILABILITY BY MUNICIPALITY ADVERTISED SPEED OF AT LEAST 10 MBPS DOWN / 1.5 MBPS UP
JUNE 2014
BROADBAND AVAILABILITY BY MUNICIPALITY ADVERTISED SPEED OF AT LEAST 3 MBPS DOWN / 768
KBPS UP JUNE 2014
<40%
40 - 60%
60.01 - 80%
80.01 - 90%
90.01 - 95%
95.01 - 100%

2 5
PUERTO RICO BROADBANDINFRASTRUCTURE 2011-2014
II
G I G A B I T I S L A N D P L A N
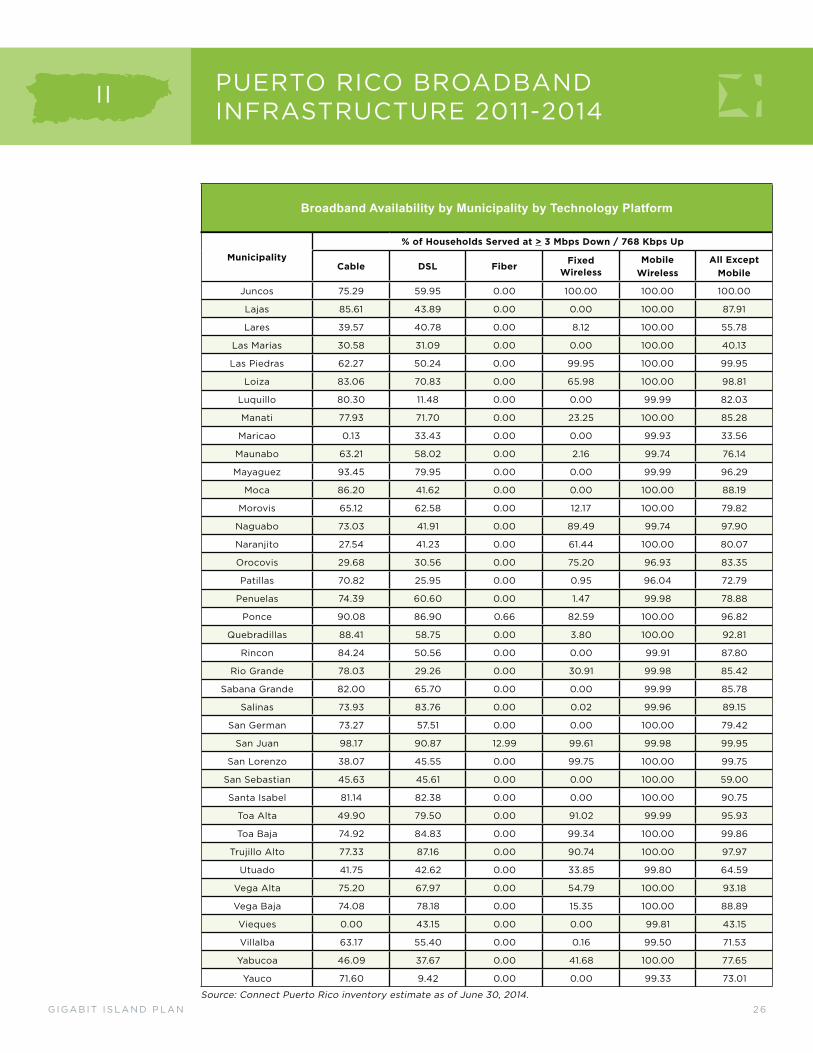
Broadband Availability by Municipality by Technology Platform
Municipality
% of Households Served at > 3 Mbps Down / 768 Kbps Up
Cable DSL Fiber Fixed Wireless
Mobile Wireless
All Except Mobile
Adjuntas 34.13 37.32 0.00 2.95 99.72 46.98
Aguada 92.31 53.92 0.00 0.00 100.00 94.41
Aguadilla 98.07 73.01 0.00 0.00 100.00 98.35
Aguas Buenas 30.94 36.59 0.00 65.98 100.00 75.36
Aibonito 39.04 52.46 0.00 13.37 100.00 63.43
Anasco 79.29 62.26 0.00 0.00 100.00 83.08
Arecibo 72.35 65.35 0.00 65.66 99.99 89.17
Arroyo 85.84 46.18 0.00 0.01 100.00 88.26
Barceloneta 87.66 80.80 0.00 1.29 100.00 94.62
Barranquitas 50.58 23.70 0.00 19.80 100.00 63.52
Bayamon 88.83 87.98 1.97 96.55 100.00 98.05
Cabo Rojo 87.19 66.05 0.00 0.00 99.98 91.25
Caguas 75.43 73.60 0.50 98.66 100.00 99.07
Camuy 60.80 47.63 0.00 43.13 100.00 75.16
Canovanas 66.61 10.19 0.00 80.72 100.00 96.07
Carolina 91.23 74.07 0.00 97.27 100.00 97.97
Catano 65.52 96.76 0.00 99.85 99.99 99.89
Cayey 66.16 62.44 0.00 92.01 100.00 93.98
Ceiba 83.74 30.29 0.00 6.39 99.98 88.98
Ciales 38.24 49.68 0.00 2.49 99.79 59.02
Cidra 50.05 41.60 0.00 88.86 100.00 96.01
Coamo 68.34 63.17 0.00 0.03 99.50 72.55
Comerio 45.04 56.52 0.00 11.16 100.00 69.87
Corozal 42.54 49.65 0.00 38.83 100.00 73.15
Culebra 0.00 48.74 0.00 0.00 99.10 48.74
Dorado 80.13 75.58 0.00 94.59 100.00 99.34
Fajardo 89.34 33.05 2.10 0.04 99.68 89.87
Florida 65.08 74.50 0.00 0.00 100.00 78.80
Guanica 86.77 72.99 0.00 0.00 99.96 91.19
Guayama 82.13 81.74 0.00 0.65 99.84 86.97
Guayanilla 72.22 64.70 0.00 0.00 99.75 76.84
Guaynabo 82.83 75.72 0.00 94.40 100.00 96.96
Gurabo 70.76 59.66 0.00 99.22 100.00 99.47
Hatillo 74.12 54.54 0.00 74.30 100.00 88.29
Hormigueros 93.26 70.63 0.00 0.00 100.00 96.99
Humacao 79.10 59.38 0.00 94.16 99.97 97.71
Isabela 89.31 57.97 0.00 0.00 100.00 91.49
Jayuya 55.87 50.76 0.00 0.00 99.75 64.43
Juana Diaz 85.09 74.70 0.00 80.85 99.98 93.71
2 6
PUERTO RICO BROADBANDINFRASTRUCTURE 2011-2014
II
G I G A B I T I S L A N D P L A N
Municipality
% of Households Served at > 3 Mbps Down / 768 Kbps Up
Cable DSL Fiber Fixed Wireless
Mobile Wireless
All Except Mobile
Juncos 75.29 59.95 0.00 100.00 100.00 100.00
Lajas 85.61 43.89 0.00 0.00 100.00 87.91
Lares 39.57 40.78 0.00 8.12 100.00 55.78
Las Marias 30.58 31.09 0.00 0.00 100.00 40.13
Las Piedras 62.27 50.24 0.00 99.95 100.00 99.95
Loiza 83.06 70.83 0.00 65.98 100.00 98.81
Luquillo 80.30 11.48 0.00 0.00 99.99 82.03
Manati 77.93 71.70 0.00 23.25 100.00 85.28
Maricao 0.13 33.43 0.00 0.00 99.93 33.56
Maunabo 63.21 58.02 0.00 2.16 99.74 76.14
Mayaguez 93.45 79.95 0.00 0.00 99.99 96.29
Moca 86.20 41.62 0.00 0.00 100.00 88.19
Morovis 65.12 62.58 0.00 12.17 100.00 79.82
Naguabo 73.03 41.91 0.00 89.49 99.74 97.90
Naranjito 27.54 41.23 0.00 61.44 100.00 80.07
Orocovis 29.68 30.56 0.00 75.20 96.93 83.35
Patillas 70.82 25.95 0.00 0.95 96.04 72.79
Penuelas 74.39 60.60 0.00 1.47 99.98 78.88
Ponce 90.08 86.90 0.66 82.59 100.00 96.82
Quebradillas 88.41 58.75 0.00 3.80 100.00 92.81
Rincon 84.24 50.56 0.00 0.00 99.91 87.80
Rio Grande 78.03 29.26 0.00 30.91 99.98 85.42
Sabana Grande 82.00 65.70 0.00 0.00 99.99 85.78
Salinas 73.93 83.76 0.00 0.02 99.96 89.15
San German 73.27 57.51 0.00 0.00 100.00 79.42
San Juan 98.17 90.87 12.99 99.61 99.98 99.95
San Lorenzo 38.07 45.55 0.00 99.75 100.00 99.75
San Sebastian 45.63 45.61 0.00 0.00 100.00 59.00
Santa Isabel 81.14 82.38 0.00 0.00 100.00 90.75
Toa Alta 49.90 79.50 0.00 91.02 99.99 95.93
Toa Baja 74.92 84.83 0.00 99.34 100.00 99.86
Trujillo Alto 77.33 87.16 0.00 90.74 100.00 97.97
Utuado 41.75 42.62 0.00 33.85 99.80 64.59
Vega Alta 75.20 67.97 0.00 54.79 100.00 93.18
Vega Baja 74.08 78.18 0.00 15.35 100.00 88.89
Vieques 0.00 43.15 0.00 0.00 99.81 43.15
Villalba 63.17 55.40 0.00 0.16 99.50 71.53
Yabucoa 46.09 37.67 0.00 41.68 100.00 77.65
Yauco 71.60 9.42 0.00 0.00 99.33 73.01
Source: Connect Puerto Rico inventory estimate as of June 30, 2014.
Broadband Availability by Municipality by Technology Platform
27
PUERTO RICO BROADBANDINFRASTRUCTURE 2011-2014
II
G I G A B I T I S L A N D P L A N
2012 BROADBAND STRATEGIC PLAN GOALS
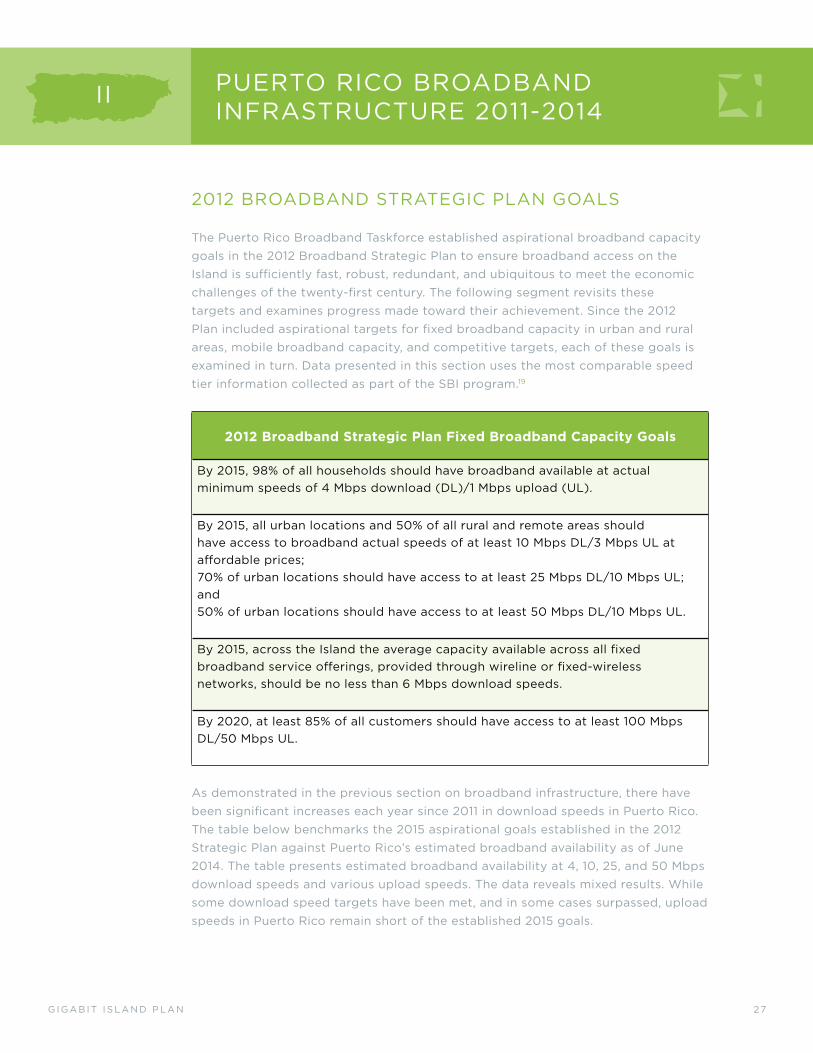
The Puerto Rico Broadband Taskforce established aspirational broadband capacity goals in the 2012 Broadband Strategic Plan to ensure broadband access on the Island is sufficiently fast, robust, redundant, and ubiquitous to meet the economic challenges of the twenty-first century. The following segment revisits these targets and examines progress made toward their achievement. Since the 2012 Plan included aspirational targets for fixed broadband capacity in urban and rural areas, mobile broadband capacity, and competitive targets, each of these goals is examined in turn. Data presented in this section uses the most comparable speed tier information collected as part of the SBI program.19
2012 Broadband Strategic Plan Fixed Broadband Capacity Goals
By 2015, 98% of all households should have broadband available at actual minimum speeds of 4 Mbps download (DL)/1 Mbps upload (UL).
By 2015, all urban locations and 50% of all rural and remote areas should have access to broadband actual speeds of at least 10 Mbps DL/3 Mbps UL at affordable prices; 70% of urban locations should have access to at least 25 Mbps DL/10 Mbps UL; and 50% of urban locations should have access to at least 50 Mbps DL/10 Mbps UL.
By 2015, across the Island the average capacity available across all fixed broadband service offerings, provided through wireline or fixed-wireless networks, should be no less than 6 Mbps download speeds.
By 2020, at least 85% of all customers should have access to at least 100 Mbps DL/50 Mbps UL.
As demonstrated in the previous section on broadband infrastructure, there have been significant increases each year since 2011 in download speeds in Puerto Rico. The table below benchmarks the 2015 aspirational goals established in the 2012 Strategic Plan against Puerto Rico’s estimated broadband availability as of June 2014. The table presents estimated broadband availability at 4, 10, 25, and 50 Mbps download speeds and various upload speeds. The data reveals mixed results. While some download speed targets have been met, and in some cases surpassed, upload speeds in Puerto Rico remain short of the established 2015 goals.
2 8
PUERTO RICO BROADBANDINFRASTRUCTURE 2011-2014
II
G I G A B I T I S L A N D P L A N
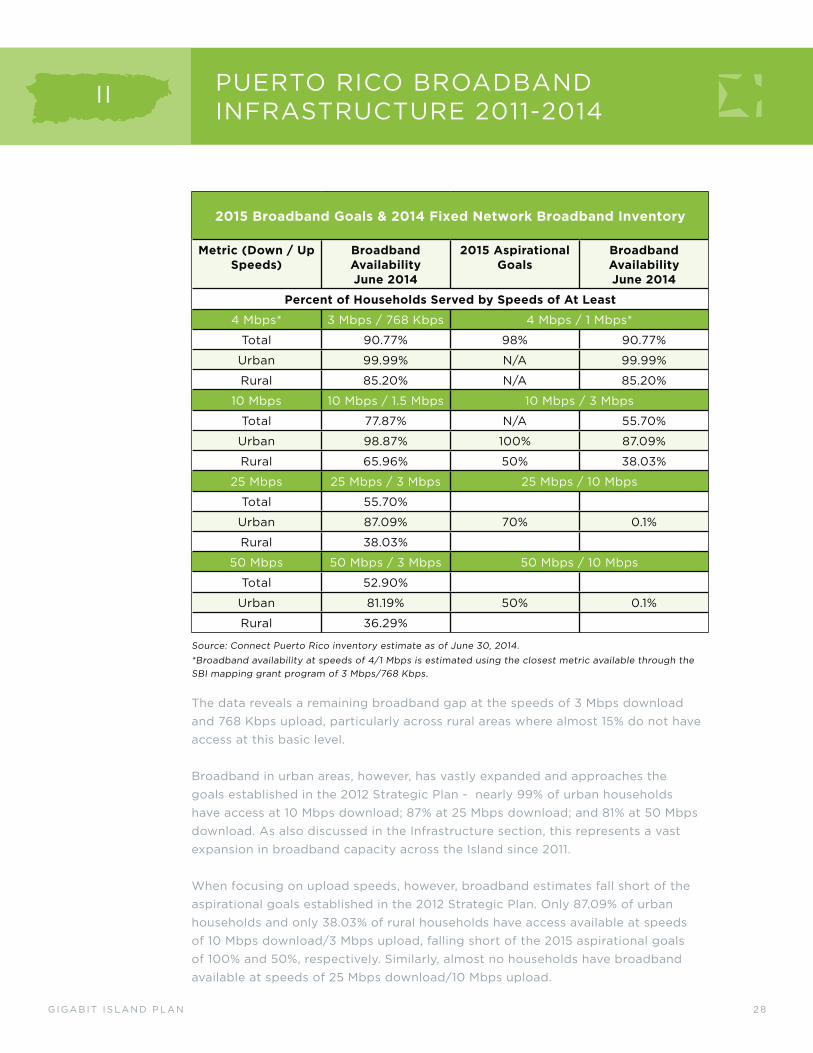
2015 Broadband Goals & 2014 Fixed Network Broadband Inventory
Metric (Down / Up Speeds)
Broadband AvailabilityJune 2014
2015 Aspirational Goals
Broadband AvailabilityJune 2014
Percent of Households Served by Speeds of At Least
4 Mbps* 3 Mbps / 768 Kbps 4 Mbps / 1 Mbps*
Total 90.77% 98% 90.77%
Urban 99.99% N/A 99.99%
Rural 85.20% N/A 85.20%
10 Mbps 10 Mbps / 1.5 Mbps 10 Mbps / 3 Mbps
Total 77.87% N/A 55.70%
Urban 98.87% 100% 87.09%
Rural 65.96% 50% 38.03%
25 Mbps 25 Mbps / 3 Mbps 25 Mbps / 10 Mbps
Total 55.70%
Urban 87.09% 70% 0.1%
Rural 38.03%
50 Mbps 50 Mbps / 3 Mbps 50 Mbps / 10 Mbps
Total 52.90%
Urban 81.19% 50% 0.1%
Rural 36.29%
Source: Connect Puerto Rico inventory estimate as of June 30, 2014.
*Broadband availability at speeds of 4/1 Mbps is estimated using the closest metric available through the SBI mapping grant program of 3 Mbps/768 Kbps.
The data reveals a remaining broadband gap at the speeds of 3 Mbps download and 768 Kbps upload, particularly across rural areas where almost 15% do not have access at this basic level.
Broadband in urban areas, however, has vastly expanded and approaches the goals established in the 2012 Strategic Plan - nearly 99% of urban households have access at 10 Mbps download; 87% at 25 Mbps download; and 81% at 50 Mbps download. As also discussed in the Infrastructure section, this represents a vast expansion in broadband capacity across the Island since 2011.
When focusing on upload speeds, however, broadband estimates fall short of the aspirational goals established in the 2012 Strategic Plan. Only 87.09% of urban households and only 38.03% of rural households have access available at speeds of 10 Mbps download/3 Mbps upload, falling short of the 2015 aspirational goals of 100% and 50%, respectively. Similarly, almost no households have broadband available at speeds of 25 Mbps download/10 Mbps upload.

2 9
PUERTO RICO BROADBANDINFRASTRUCTURE 2011-2014
II
G I G A B I T I S L A N D P L A N
Finally, the 2012 Broadband Strategic Plan projected that, by 2015, the average available download speed across all fixed broadband service offerings on the Island, whether wireline or fixed wireless, should be no less than 6 Mbps. Puerto Rico significantly exceeds this goal using two sources for measurement. Based upon Ookla speed data, a global leader in broadband testing and network diagnostics, the rolling mean speed of consumer download speed tests over 30 days in December 2014 resulted in an average of 14.39 Mbps download. In relationship to results from 194 countries performing the same tests in the same timeframe Puerto Rico ranked 68th. Second, using a midpoint scoring method on the NTIA-established speed tiers, the average capacity available across Puerto Rico would be 72 Mbps download. These results assume no available residential service faster than 100 Mbps download.
2012 Broadband Strategic Plan Mobile Broadband Capacity Goal
By 2015, mobile broadband offerings at next generation speeds will be available across at least 98% of the Island’s geography where the population resides.
While next generation mobile networks, including fourth generation (4G) and Long Term Evolution (LTE), are generally associated with fast service, there are no industry standards for speed thresholds to meet these definitions. As such, we cannot directly contrast this measure against the Connect Puerto Rico mapping data, which collects broadband inventory information by speed tier. That being said, the table that follows demonstrates penetration of fast mobile networks across Puerto Rico. These mobile metrics indicate that Puerto Rico mobile network penetration is comparable to overall U.S. estimates of wireless penetration. According to the National Broadband Map, 97.5% of U.S. households have wireless service at download speeds of 10 Mbps and 16.2% of U.S. households have wireless service available at download speeds of 25 Mbps.20
Mobile Network Broadband Inventory
Speeds Down/UpHouseholds Served
June 2014
At � 3 Mbps/768 Kbps 99.90%
At � 6 Mbps/1.5 Mbps 99.88%
At � 10 Mbps/1.5 Mbps 99.72%
At � 25 Mbps/1.5 Mbps 0%
Source: Connect Puerto Rico inventory estimate as of June 30, 2014.

3 0
PUERTO RICO BROADBANDINFRASTRUCTURE 2011-2014
II
G I G A B I T I S L A N D P L A N
As of June 2014, 98.74% of Puerto Ricans (1,359,134 households) had access to three or more fixed or mobile broadband provider offerings, and 54.15% of Puerto Ricans (745,366 households) had access to three or more fixed broadband providers. Multi-provider fixed broadband offerings are primarily concentrated in the most populous areas of Puerto Rico, as depicted in the map below.
REDUNDANT BROADBAND NETWORKS JUNE 2014
Symbology
3 or More Providers
City
Primary Road
Secondary Road
Municipality Boundary
WaterNational Lands

3 1
II
G I G A B I T I S L A N D P L A N 3 1
CHAPTER ENDNOTESII
G I G A B I T I S L A N D P L A N
18. Federal Communications Commission, National Broadband Plan, http://www.fcc.gov/national-broadband-plan.
19. Data collected by Connect Puerto Rico follows the guidelines set forth by the State Broadband Initiative Notice of Funds Availability (SBI NOFA). For more information on speed tier data collected by Connect Puerto Rico, see the Technical Appendix of the SBI NOFA at http://www.ntia.doc.gov/files/ntia/publications/fr_broadbandmappingnofa_090708.pdf.
20. National Broadband Map, Dec. 31, 2013 estimates, http://www.broadbandmap.gov/summarize/nationwide.