Embed Size (px)
Citation preview
http://www.poya.com.tw/en/

AgendaAgenda
I.I. Introduction Introduction
II.II. Competitive AdvantagesCompetitive Advantages
III.III. Future Development Future Development
IV.IV. Financial PerformanceFinancial Performance
2
IntroductionIntroduction
I.I. CompanyCompany IntroIntro
II.II. MilestonesMilestones
III.III. CoreCore ValueValueIII.III. CoreCore ValueValue
IV.IV. SaleSale AllocationAllocation
V.V. CustomersCustomers
VI.VI. BranchesBranches
3
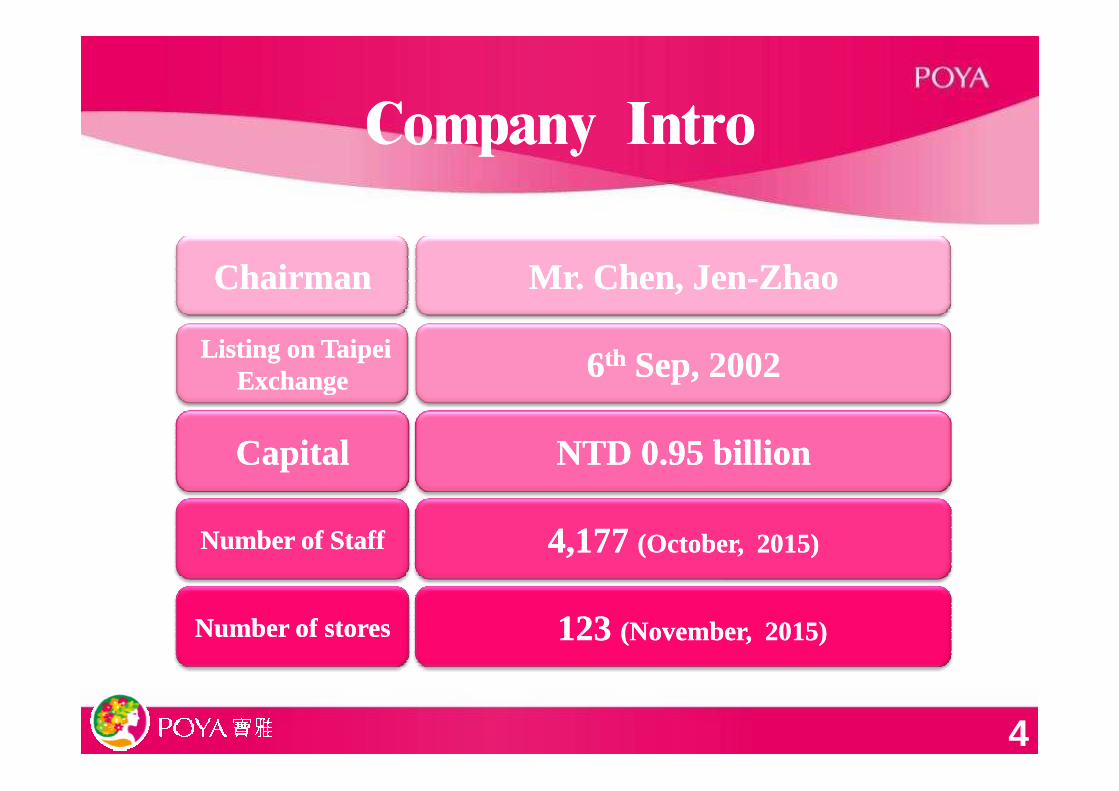
Company IntroCompany Intro
Chairman Chairman
Listing on Taipei Listing on Taipei ExchangeExchange
Mr. Chen, JenMr. Chen, Jen--ZhaoZhao
66thth Sep, 2002Sep, 2002
Capital Capital NTD NTD 0.95 0.95 billionbillion
Number of StaffNumber of Staff 4,177 4,177 (October, 2015)(October, 2015)
Number of storesNumber of stores 123 123 (November, 2015)(November, 2015)
4
MilestonesMilestones
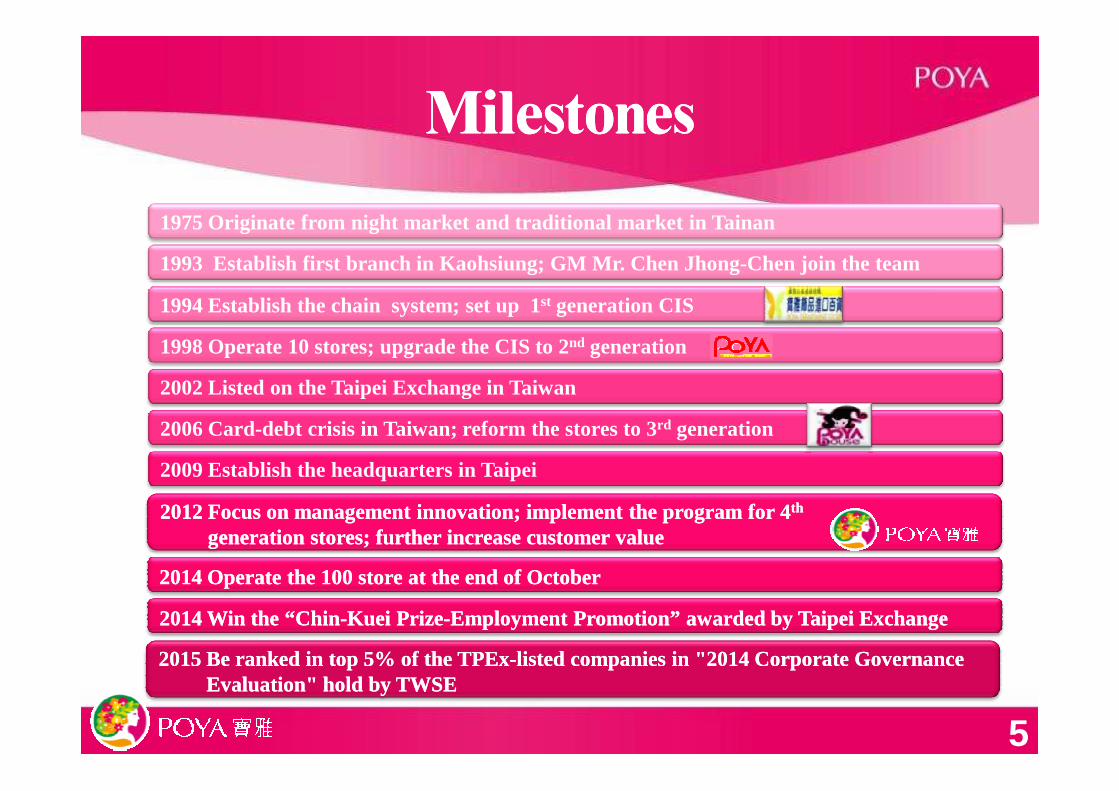
1975 Originate from night market and traditional market in Tainan
1993 Establish first branch in Kaohsiung; GM Mr. Chen Jhong-Chen join the team
1994 Establish the chain system; set up 1st generation CIS
2002 Listed on the Taipei Exchange in Taiwan
1998 Operate 10 stores; upgrade the CIS to 2nd generation
5
20142014 Operate the 100 store at the end of OctoberOperate the 100 store at the end of October
2009 Establish the headquarters in Taipei
2002 Listed on the Taipei Exchange in Taiwan
2006 Card-debt crisis in Taiwan; reform the stores to 3rd generation
20122012 Focus on management innovation; implement the program for 4Focus on management innovation; implement the program for 4thth
generation stores; further increase customer valuegeneration stores; further increase customer value
20142014 Win the “ChinWin the “Chin--KueiKuei PrizePrize--Employment Promotion” awarded by Taipei ExchangeEmployment Promotion” awarded by Taipei Exchange
20152015 Be ranked in top 5% of the Be ranked in top 5% of the TPExTPEx--listed companies in "2014 Corporate Governance listed companies in "2014 Corporate Governance Evaluation" hold by TWSEEvaluation" hold by TWSE
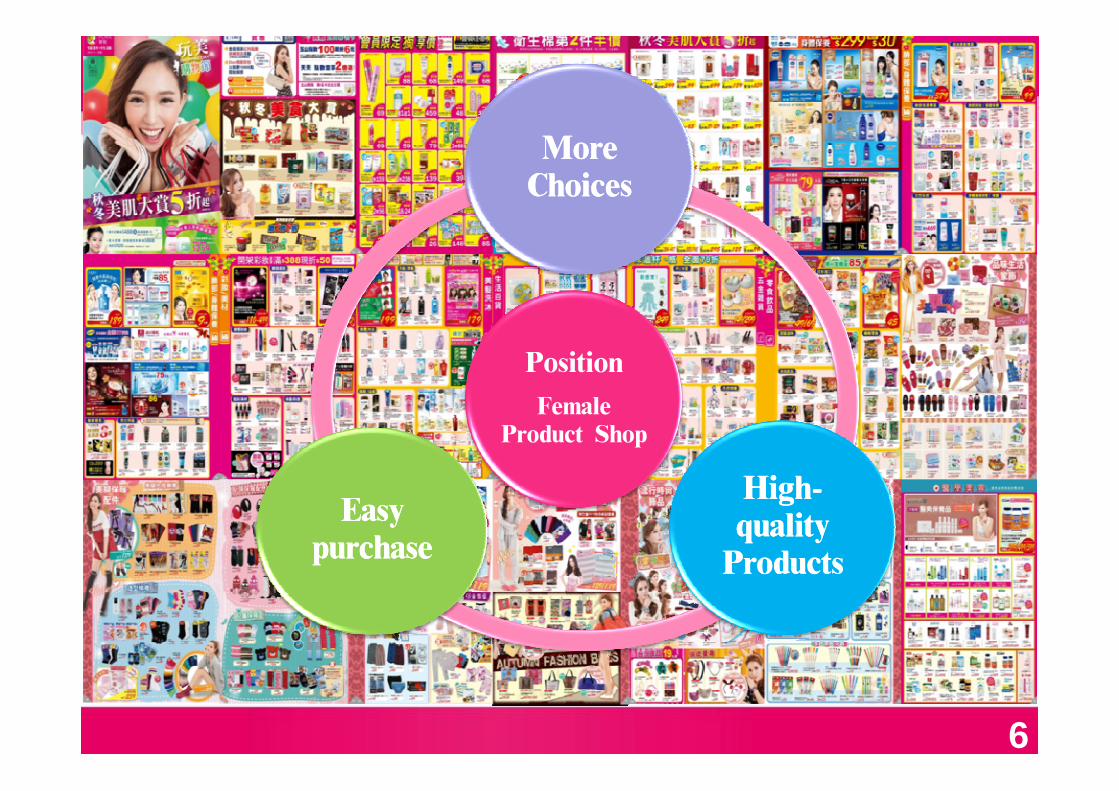
Position
Female
More More ChoicesChoices
Female Product Shop
HighHigh--quality quality ProductsProducts
Easy Easy purchasepurchase
6
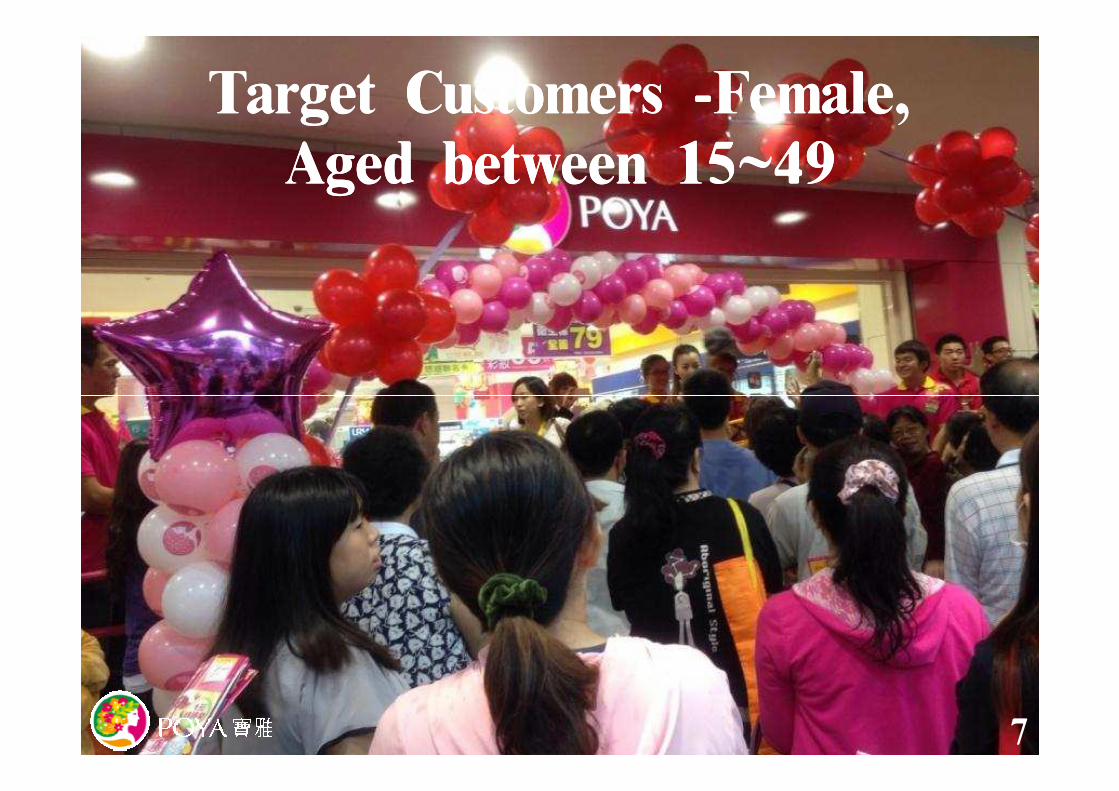
Target Customers Target Customers --Female, Female, Aged between 15~49Aged between 15~49
7
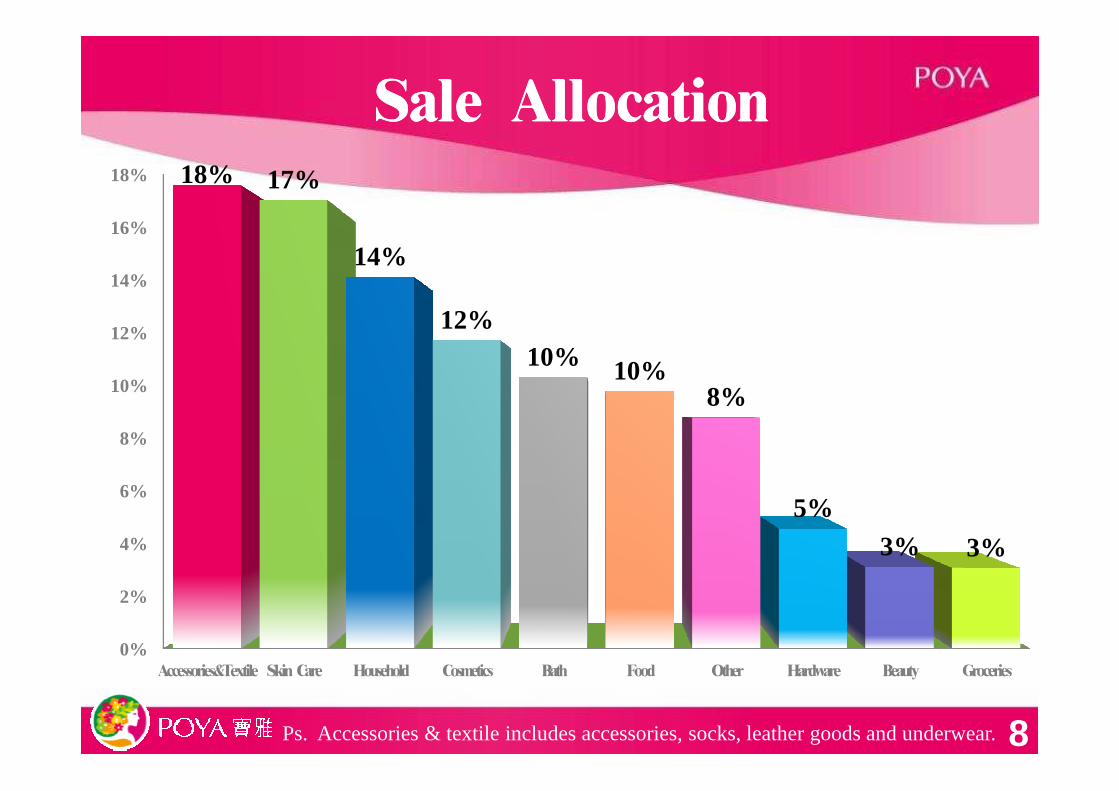
Sale AllocationSale Allocation
10%
12%
14%
16%
18% 18% 17%
14%
12%10% 10%
8%
8Ps. Accessories & textile includes accessories, socks, leather goods and underwear.
0%
2%
4%
6%
8%
10%
Accessories&Textile Skin Care Household Cosmetics Bath Food Other Hardware Beauty Groceries
8%
5%
3% 3%
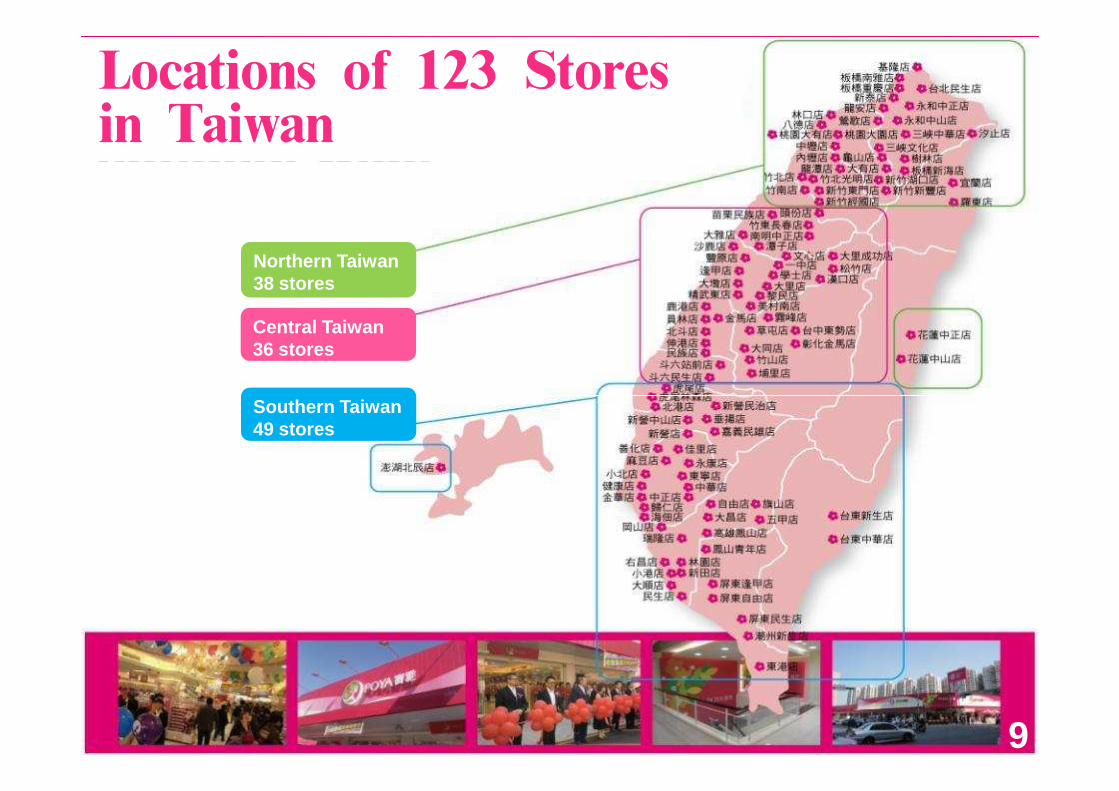
Locations of 123 Stores in Taiwan
Central Taiwan36 stores
Northern Taiwan38 stores
Southern Taiwan49 stores
9
Competitive AdvantagesCompetitive Advantages
I.I. Largest Market ShareLargest Market Share
II.II. Explicit Market DistinctionExplicit Market Distinction
10
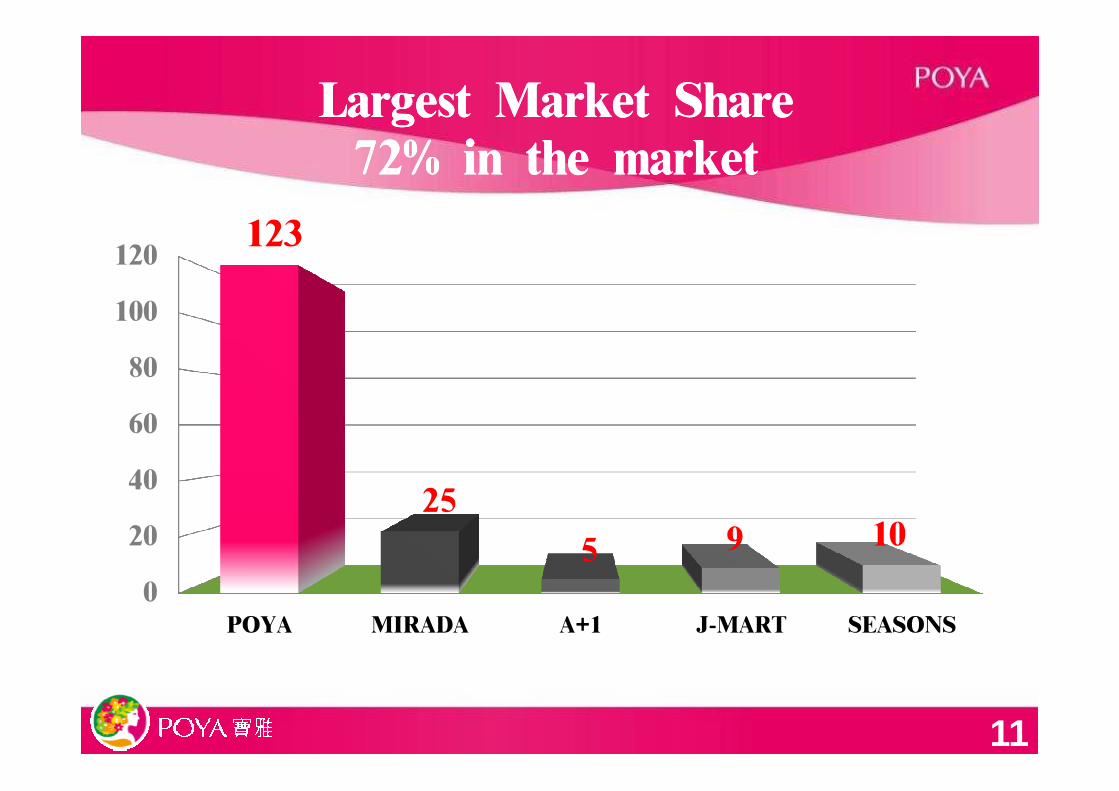
Largest Market Share Largest Market Share 72% 72% in the marketin the market
80
100
120123
0
20
40
60
POYA MIRADA A+1 J-MART SEASONS
25
5 9 10
11
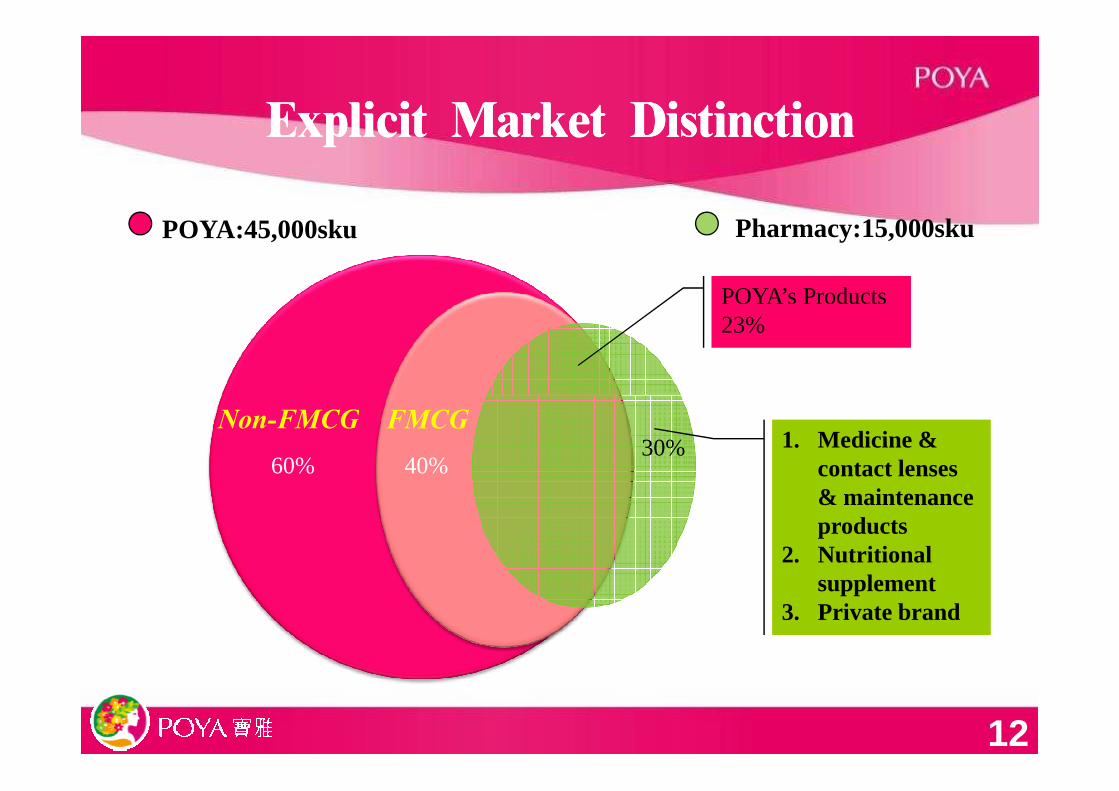
Explicit Market DistinctionExplicit Market Distinction
Pharmacy:15,000skuPOYA:45,000sku
POYA’s Products23%
FMCGNon-FMCG
40%60%1. Medicine &
contact lenses & maintenance products
2. Nutritional supplement
3. Private brand
30%FMCG
12
Non-FMCG
Future DevelopmentFuture Development
I.I. Keep Upgrading the Stores and Products Keep Upgrading the Stores and Products
II.II. Keep Opening New StoresKeep Opening New StoresII.II. Keep Opening New StoresKeep Opening New Stores
III.III. Improve Improve Logistic SystemLogistic System
13
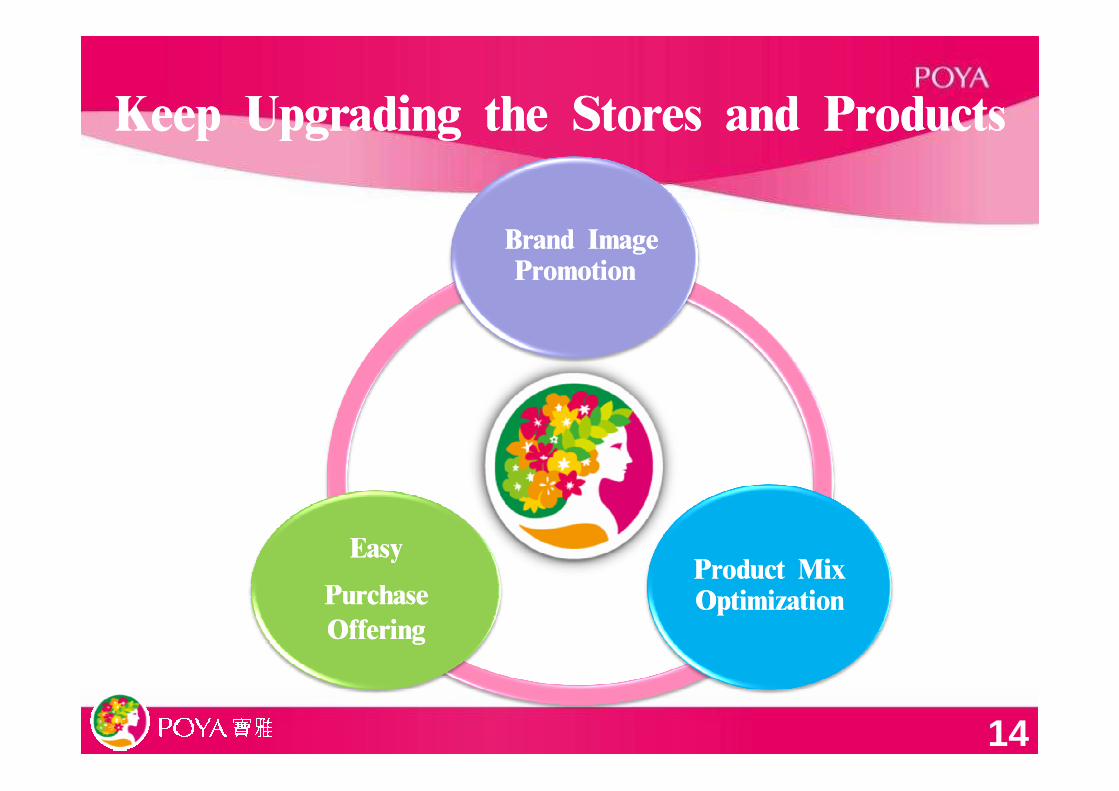
Keep Upgrading the Stores and ProductsKeep Upgrading the Stores and Products
Brand Image Brand Image PromotionPromotion
14
Product Mix Product Mix OptimizationOptimization
EasyEasy
Purchase Purchase OfferingOffering
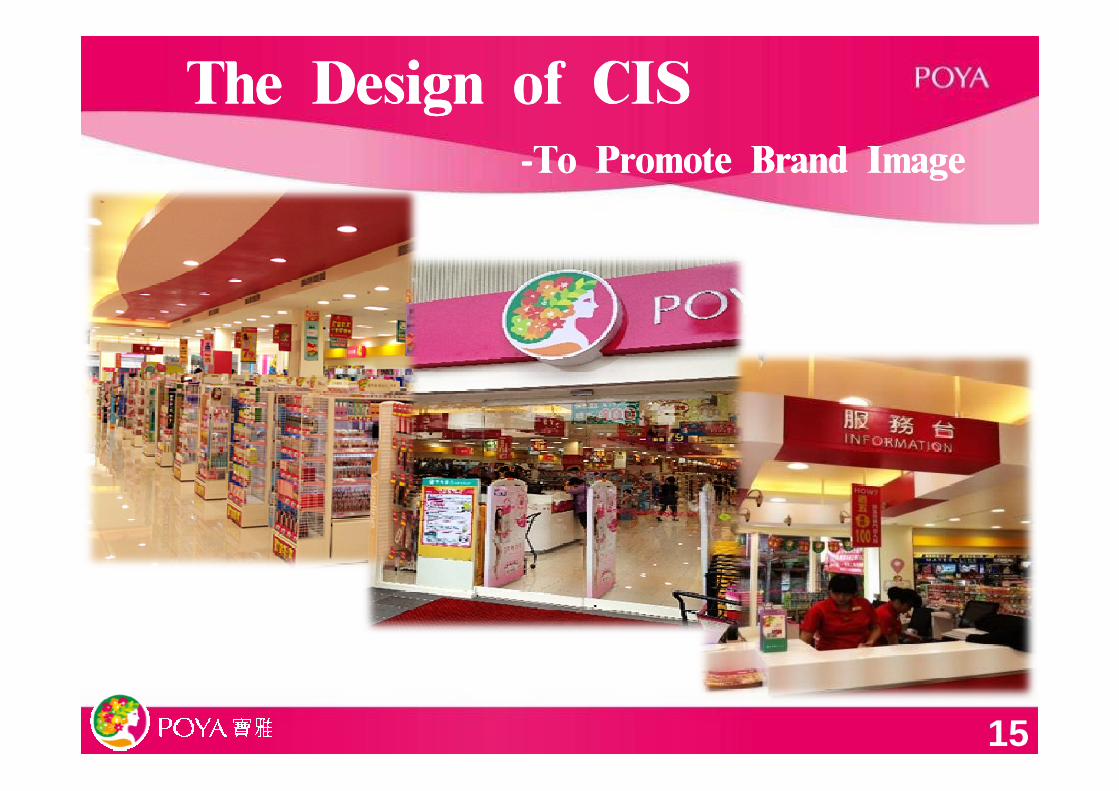
The Design of CISThe Design of CIS--To Promote Brand ImageTo Promote Brand Image
15

Clear Shopping Route Clear Shopping Route ––To Advocate Easy, Quick PurchaseTo Advocate Easy, Quick Purchase
16
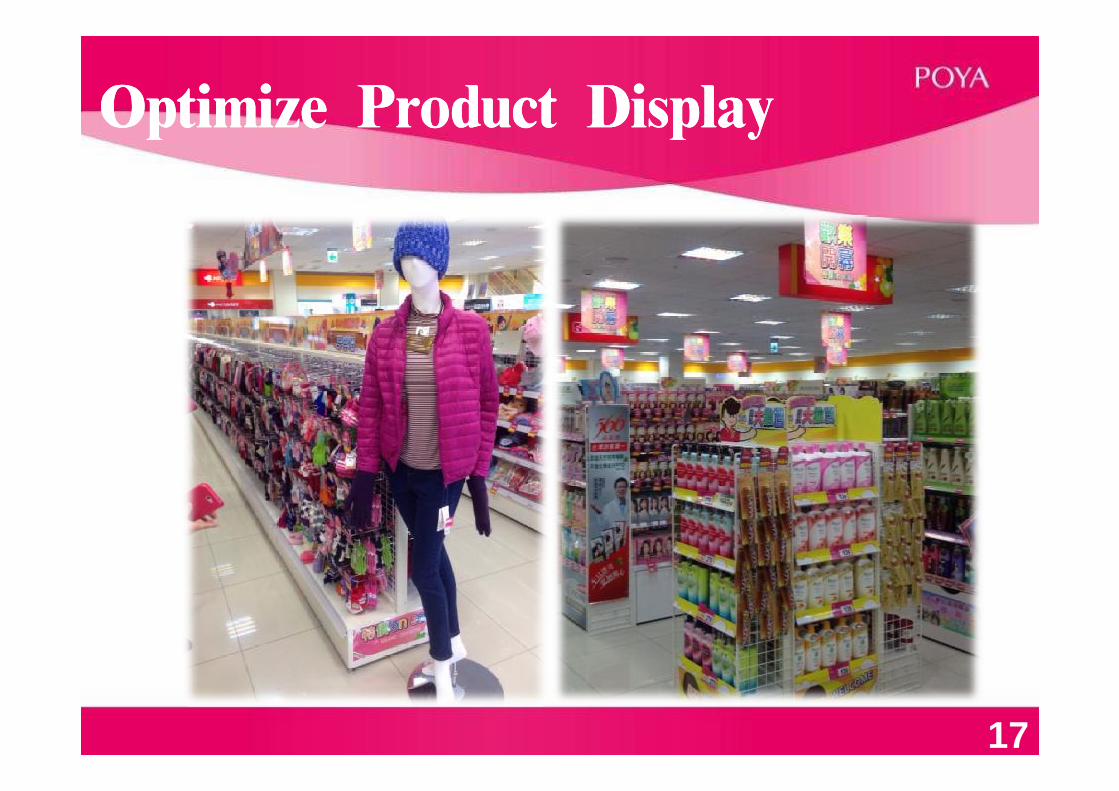
Optimize Product Display Optimize Product Display
17
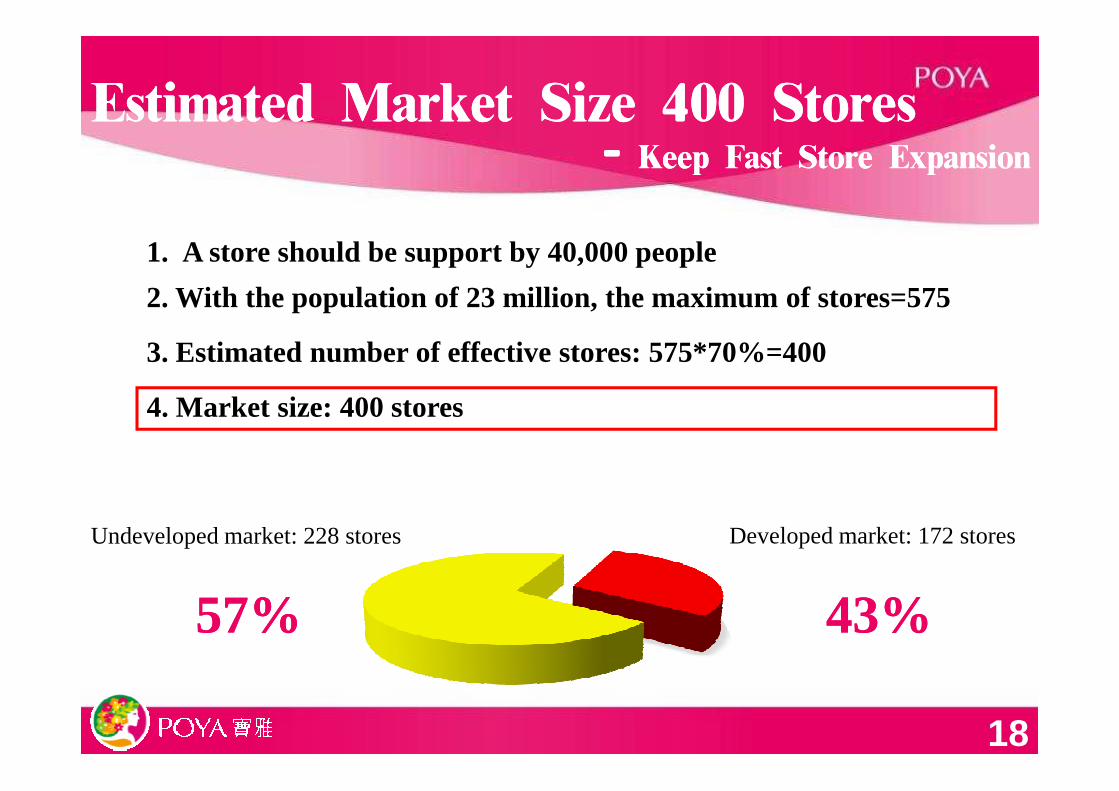
Estimated Market Size Estimated Market Size 400400 StoresStores-- Keep Fast Store Expansion Keep Fast Store Expansion
1. A store should be support by 40,000 people
2. With the population of 23 million, the maximum of stores=575
3. Estimated number of effective stores: 575*70%=400
4. Market size: 400 stores
18
Undeveloped market: 228 stores
57%57%
Developed market: 172 stores
43% 43%
4. Market size: 400 stores
300
400
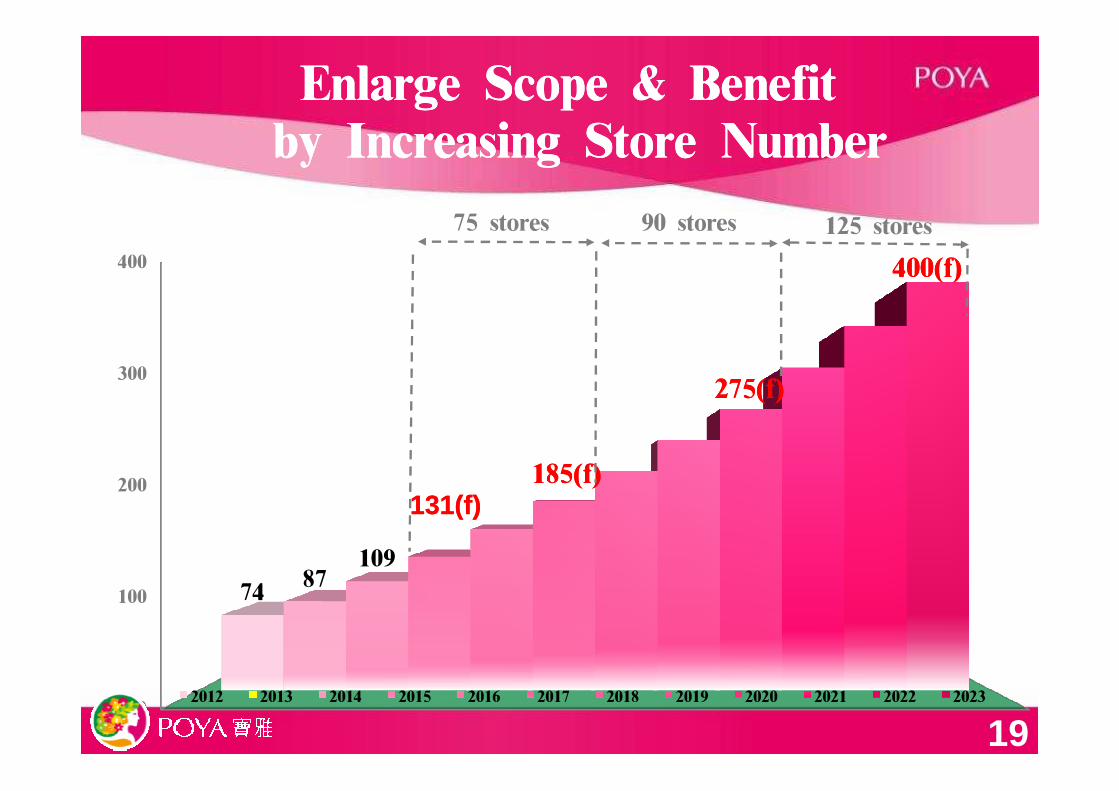
90 stores
275(f)275(f)
125 stores
400(f)400(f)
75 stores
Enlarge Scope & BenefitEnlarge Scope & Benefitby Increasing Store Numberby Increasing Store Number
0
100
200
7487
109
185(f)185(f)
275(f)275(f)
2012 2013 2014 2015 2016 2017 2018 2019 2020 2021 2022 2023
19
131(f)131(f)
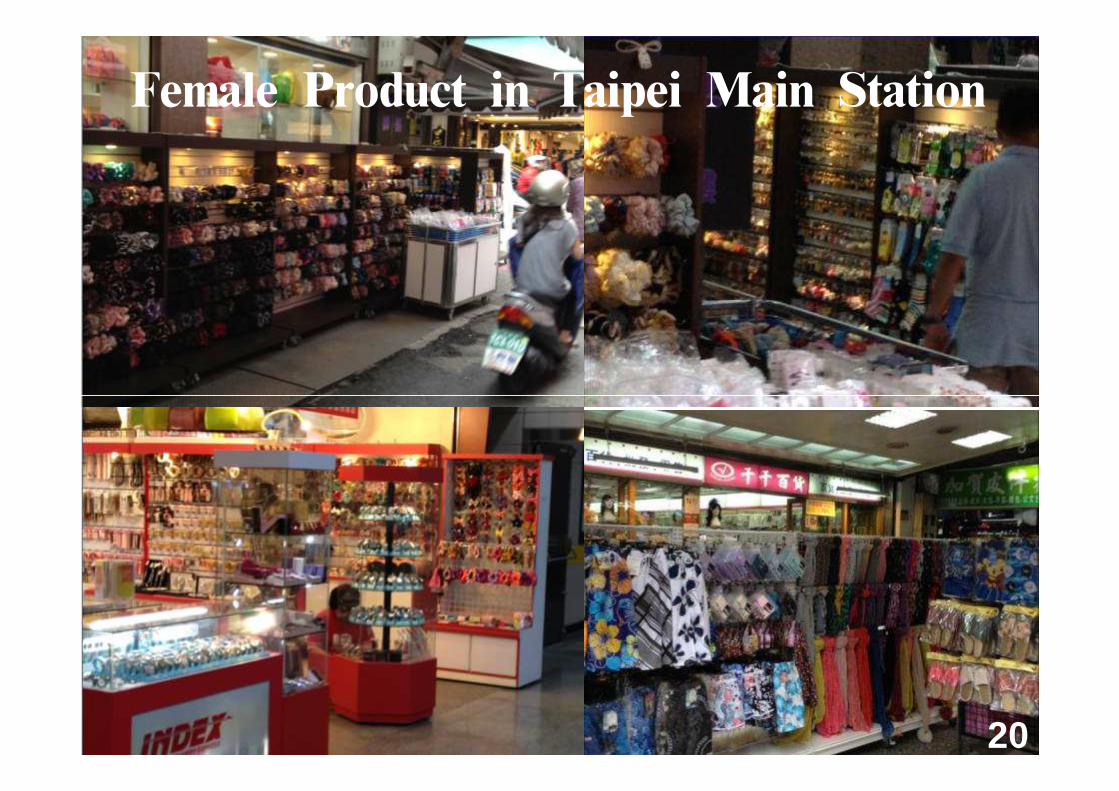
Female Product in Taipei Main Station
20
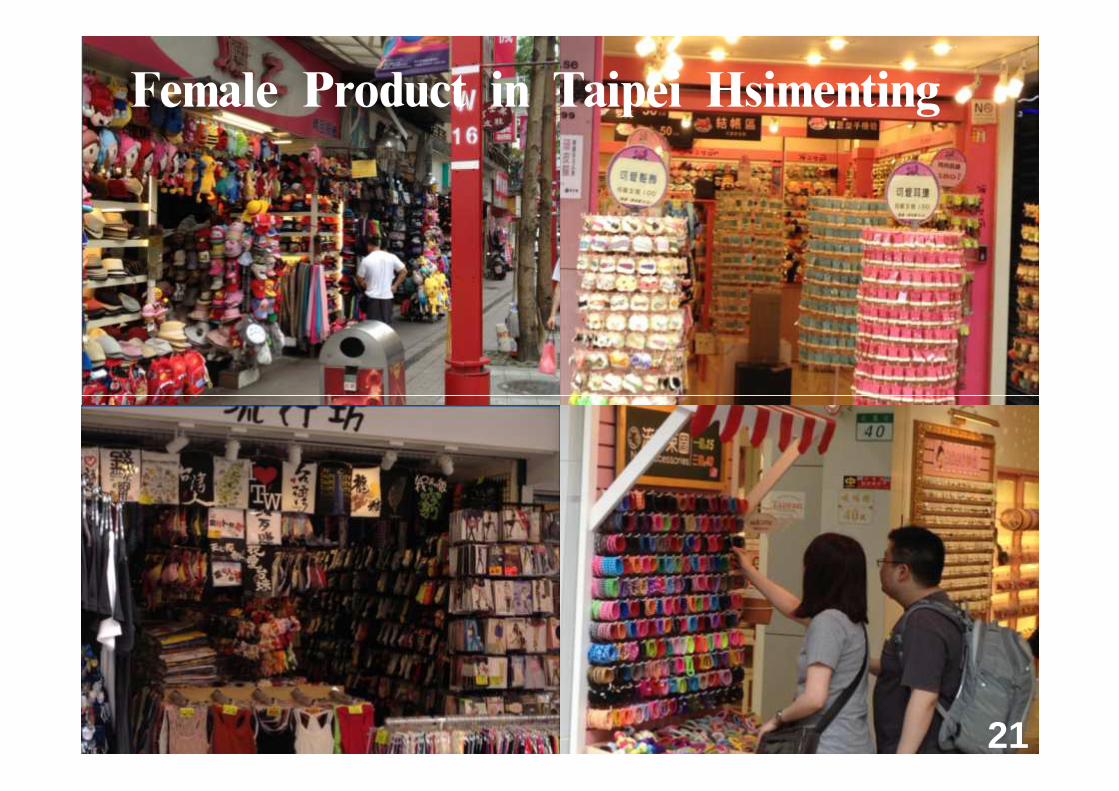
Female Product in Taipei Hsimenting
21
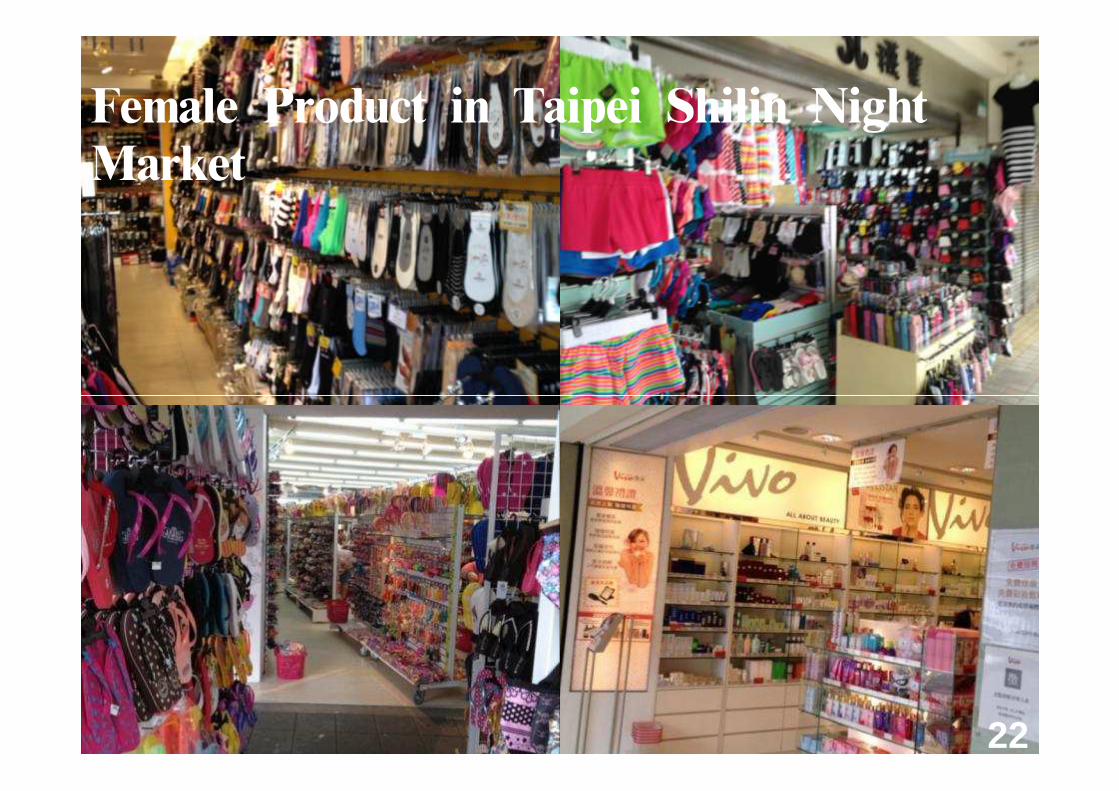
Female Product in Taipei Shilin Night Market
22
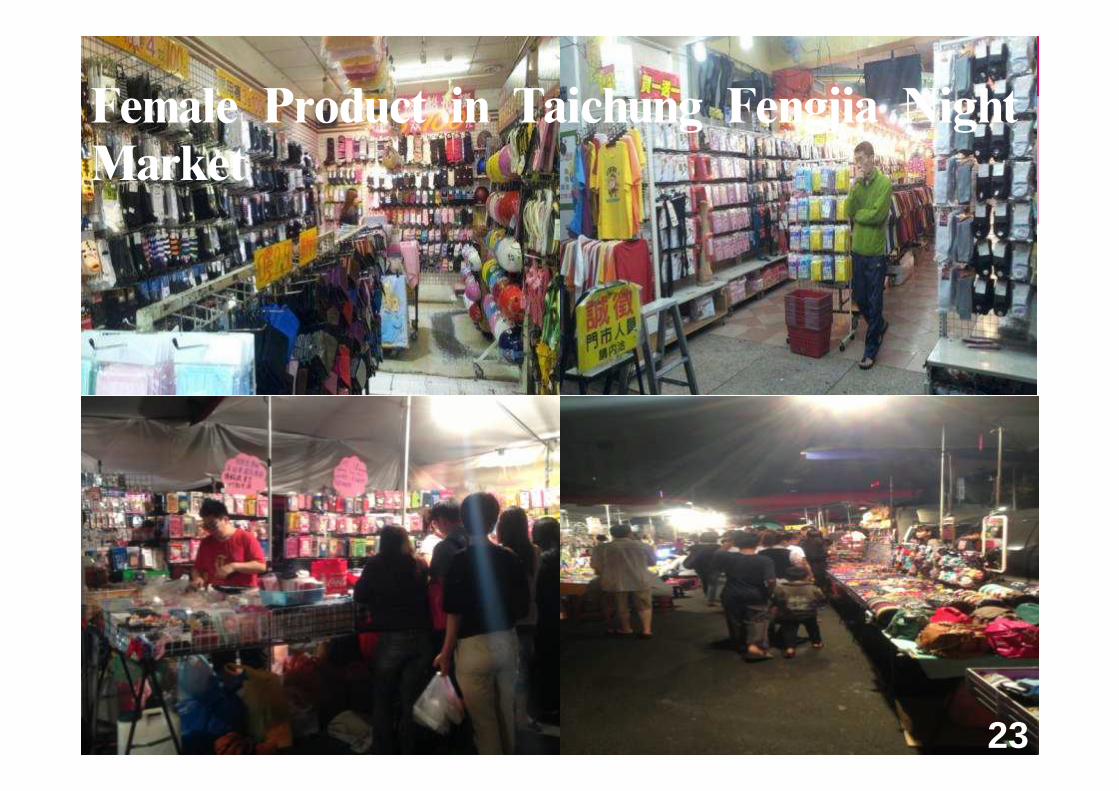
Female Product in Taichung Fengjia Night Market
23
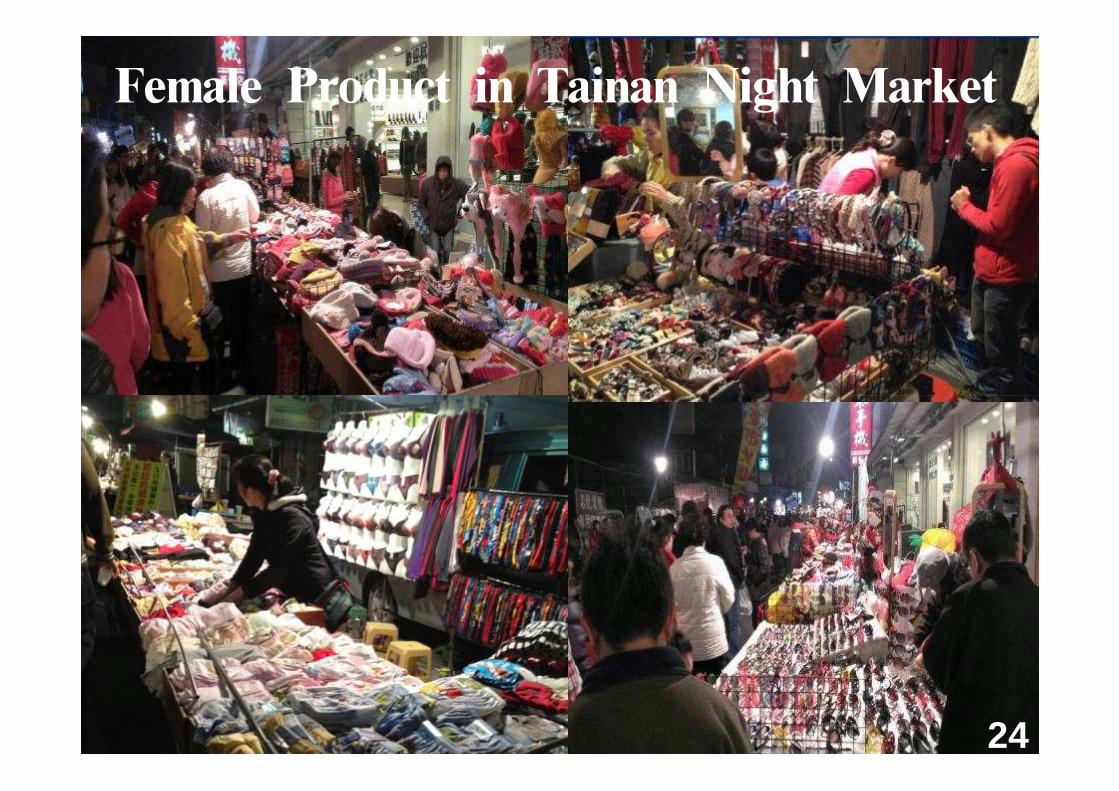
Female Product in Tainan Night Market
24
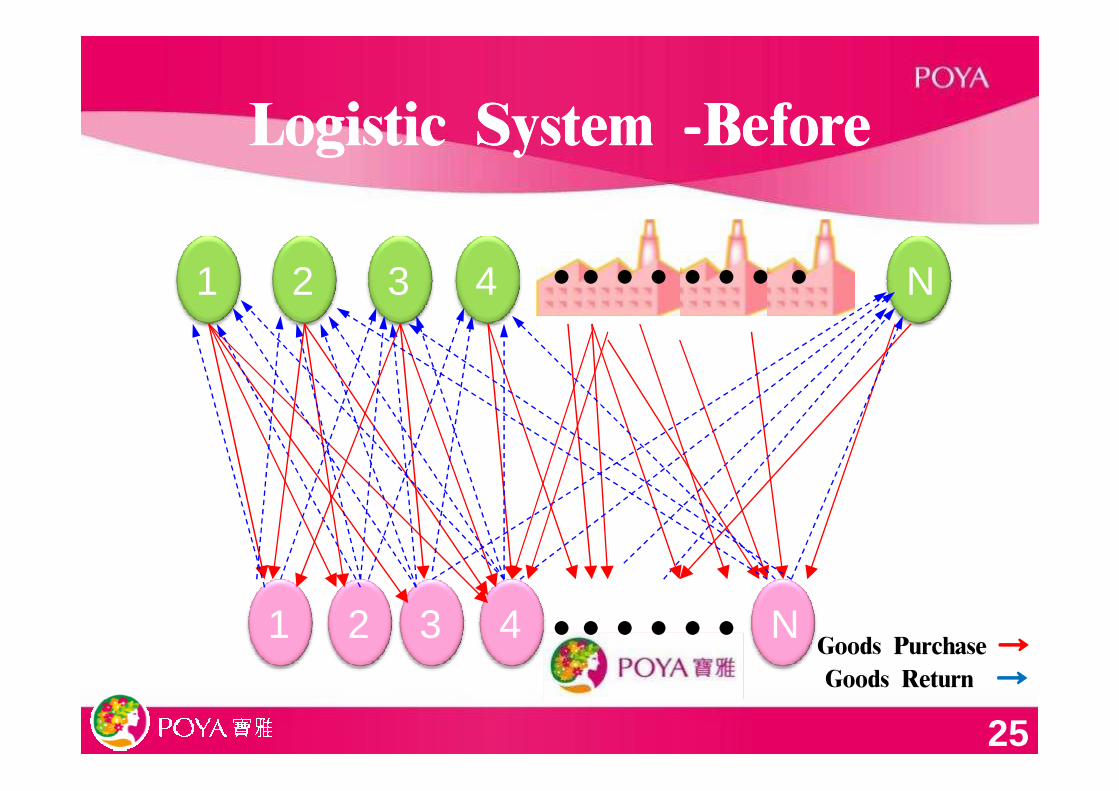
Logistic System Logistic System --BeforeBefore
1 2 N43 ● ● ● ● ● ● ● ●
1 432 N● ● ● ● ● ●
Goods Purchase →Goods Return →
25
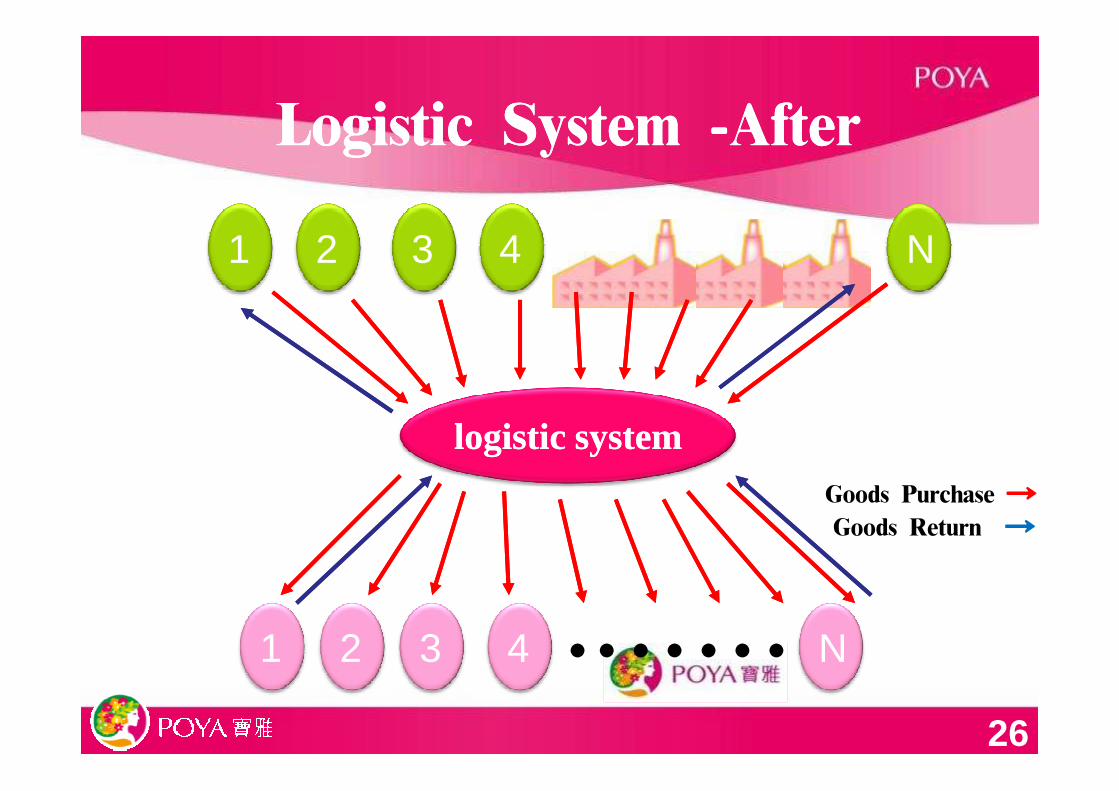
Logistic System Logistic System --AfterAfter
● ● ● ● ● ● ● ●1 2 N43
1 432 N● ● ● ● ● ● ●
logistic systemlogistic system
26
Goods Purchase →Goods Return →
Financial PerformanceFinancial Performance
I.I. Trend of RevenueTrend of Revenue
II.II. Trend of Gross Profit MarginTrend of Gross Profit Margin
III.III. Trend of Operating Profit MarginTrend of Operating Profit MarginIII.III. Trend of Operating Profit MarginTrend of Operating Profit Margin
IV.IV. Trend of Net Income MarginTrend of Net Income Margin
V.V. Dividend PolicyDividend Policy
VI.VI. 2015Q3 Financial Report2015Q3 Financial Report
27
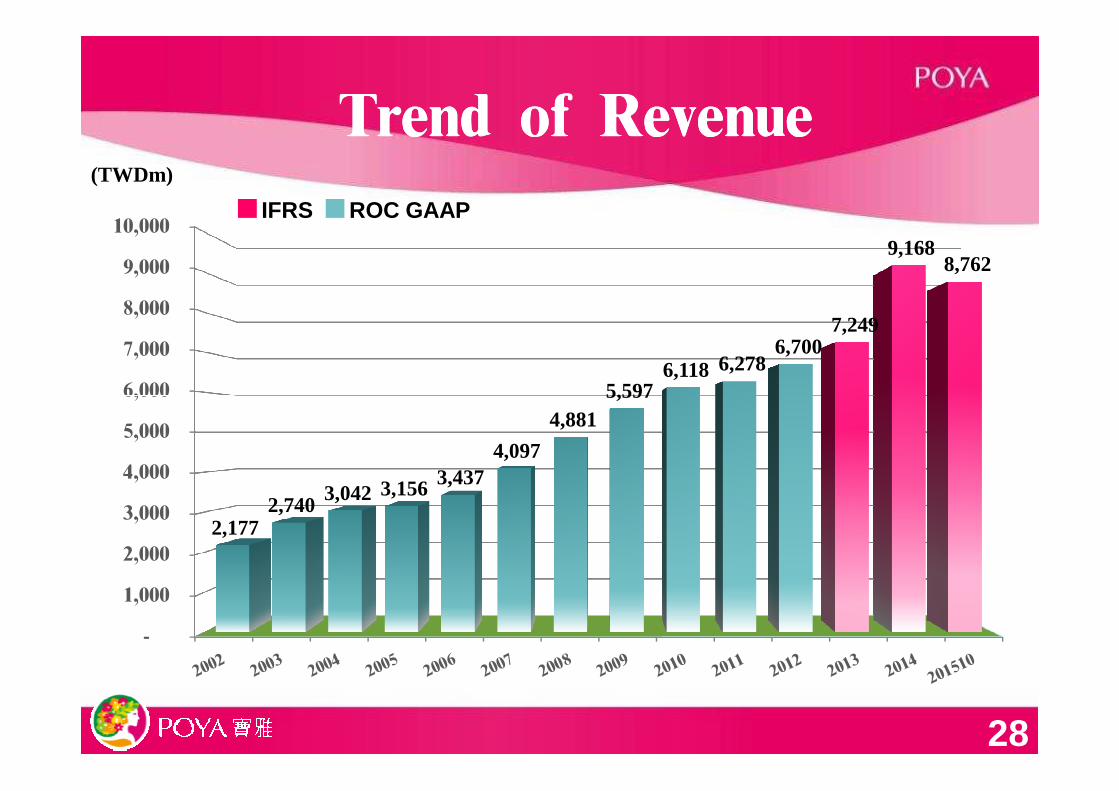
Trend of RevenueTrend of Revenue(TWDm)
IFRS ROC GAAP
6,000
7,000
8,000
9,000
10,000
5,597 6,118 6,278
6,700 7,249
9,168 8,762
28
-
1,000
2,000
3,000
4,000
5,000
6,000
2,177 2,740 3,042 3,156 3,437
4,097
4,881 5,597
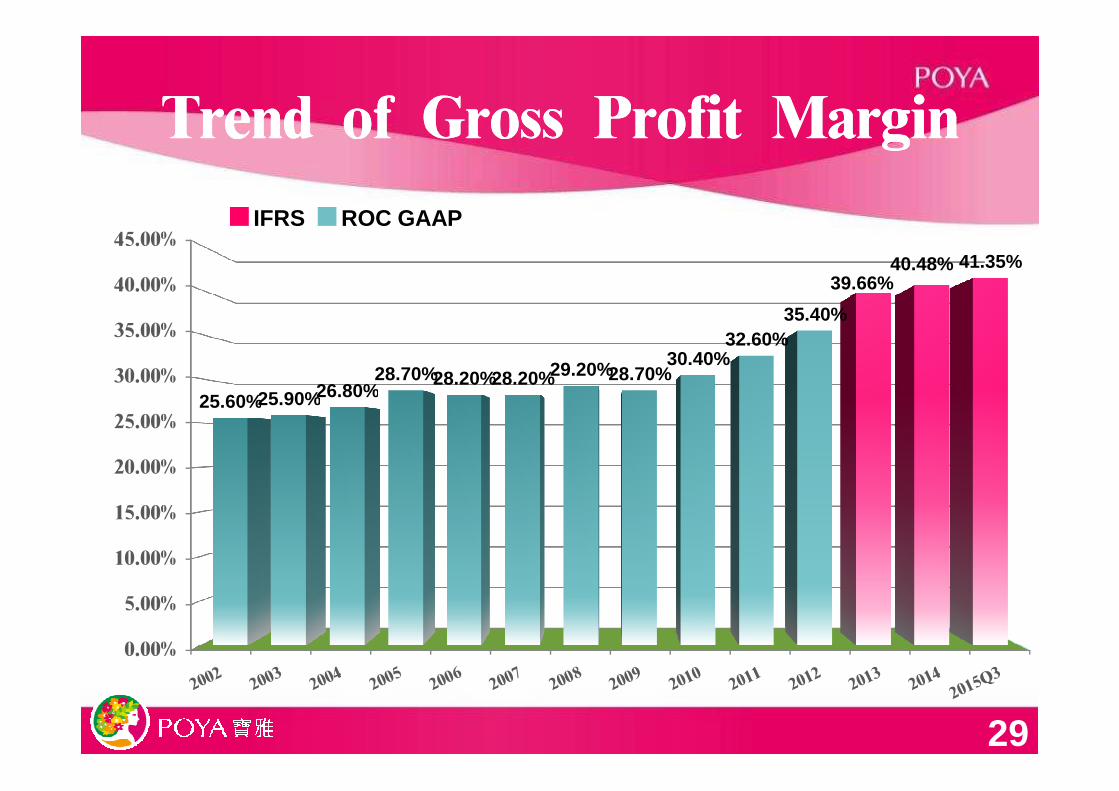
Trend of Gross Profit MarginTrend of Gross Profit Margin
IFRS ROC GAAP
30.00%
35.00%
40.00%
45.00%
25.60%25.90%26.80%28.70%28.20%28.20%29.20%28.70%
30.40%32.60%
35.40%
39.66%40.48% 41.35%
29
0.00%
5.00%
10.00%
15.00%
20.00%
25.00%25.60%25.90%26.80%
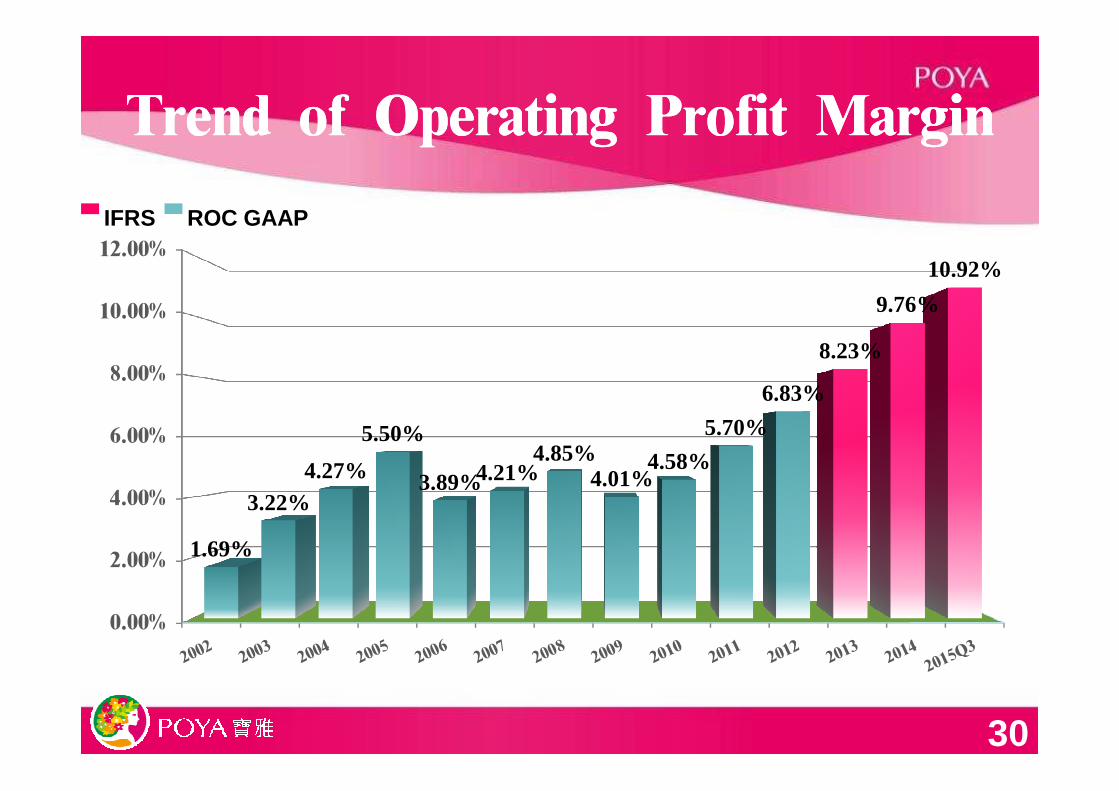
Trend of Operating Profit MarginTrend of Operating Profit Margin
8.00%
10.00%
12.00%
6.83%
8.23%
9.76%
10.92%
IFRS ROC GAAP
30
0.00%
2.00%
4.00%
6.00%
1.69%
3.22%4.27%
5.50%
3.89%4.21%4.85%
4.01%4.58%
5.70%
6.83%
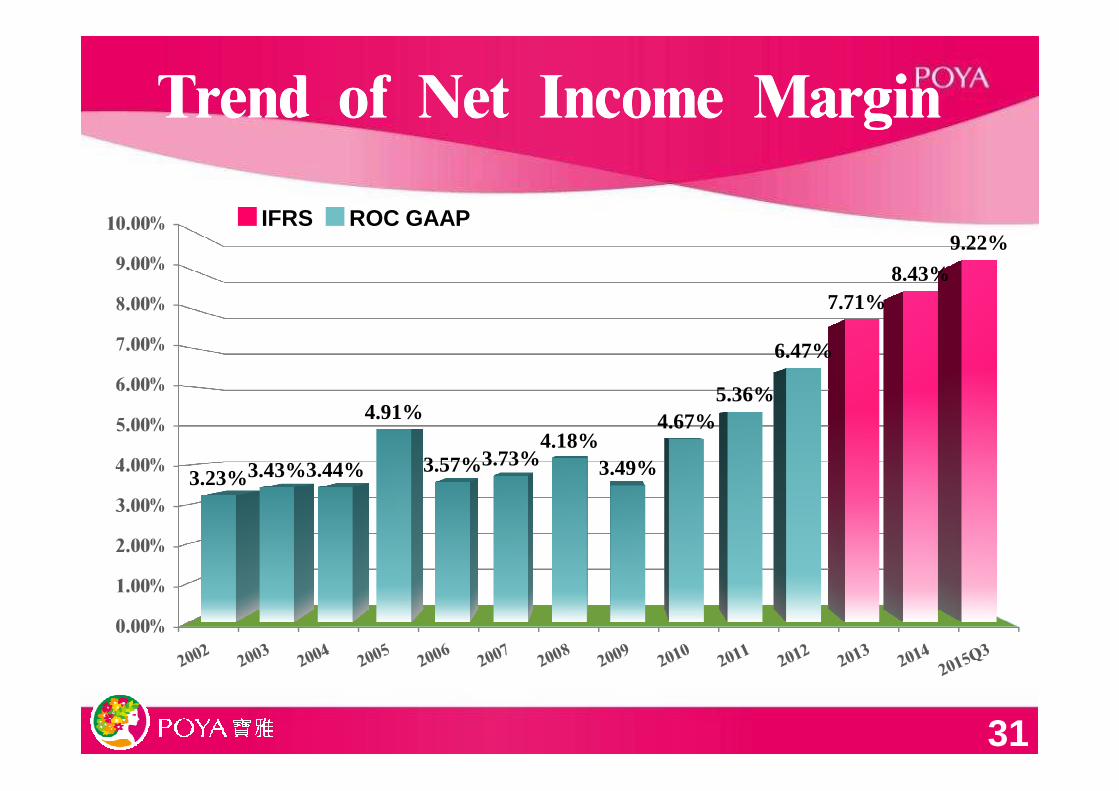
Trend of Net Income MarginTrend of Net Income Margin
IFRS ROC GAAP
6.00%
7.00%
8.00%
9.00%
10.00%
5.36%
6.47%
7.71%8.43%
9.22%
31
0.00%
1.00%
2.00%
3.00%
4.00%
5.00%
3.23%3.43%3.44%
4.91%
3.57%3.73%4.18%
3.49%
4.67%5.36%
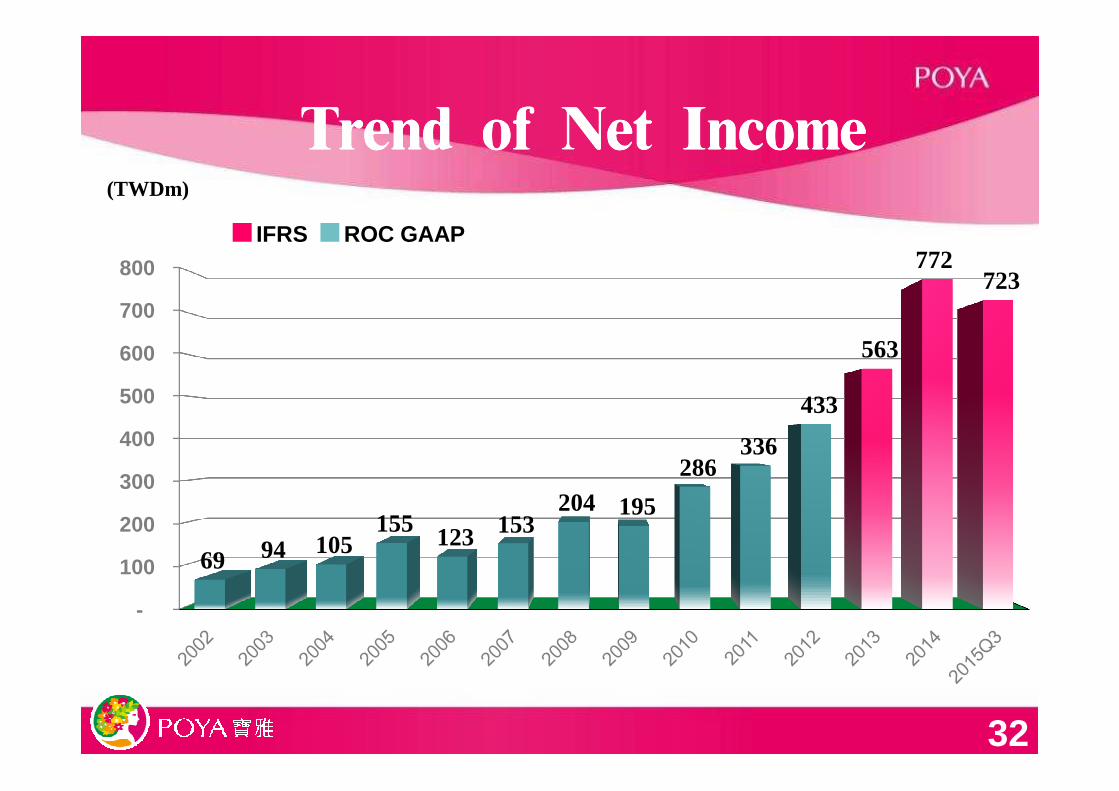
Trend of Net IncomeTrend of Net Income(TWDm)
IFRS ROC GAAP
500
600
700
800
433
563
772 723
32
-
100
200
300
400
500
69 94 105 155 123 153
204 195
286 336
433
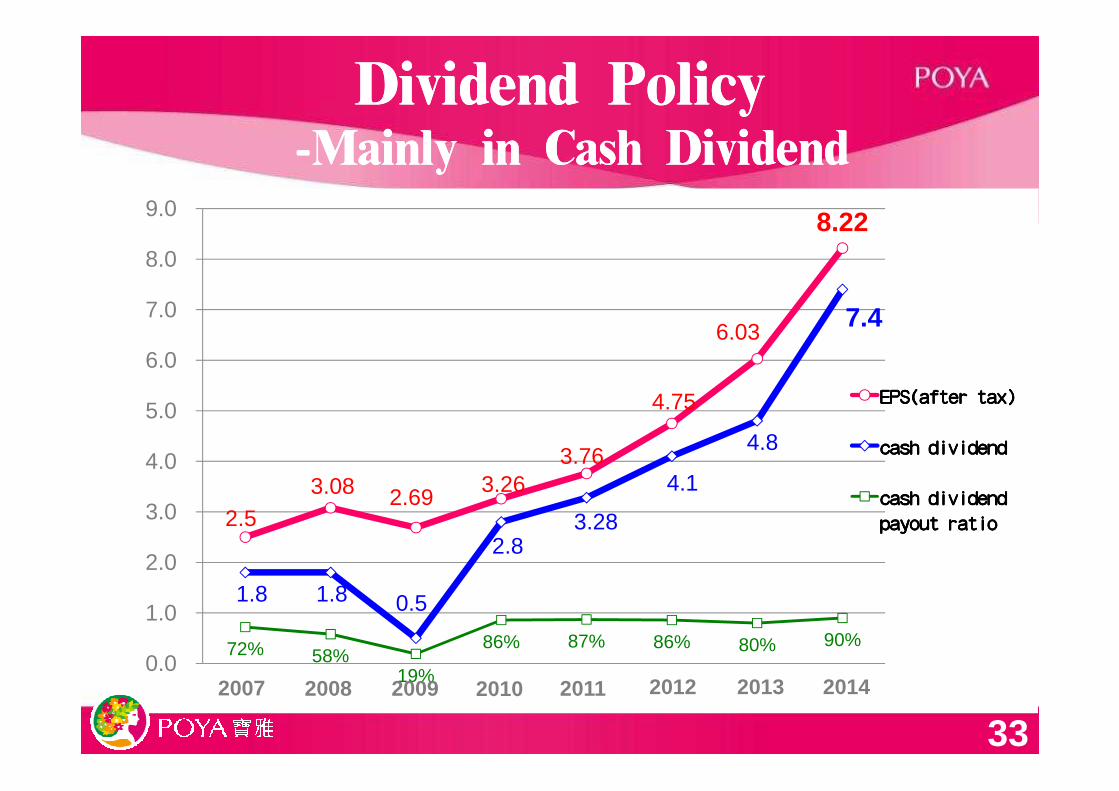
Dividend PolicyDividend Policy--MainlyMainly in Cash Dividend in Cash Dividend
4.75
6.03
8.22
7.4
6.0
7.0
8.0
9.0
EPS(after tax)EPS(after tax)EPS(after tax)EPS(after tax)
33
2.53.08 2.69 3.26
3.76
4.75
1.8 1.8 0.5
2.83.28
4.1
4.8
72% 58%19%
86% 87% 86% 80% 90%0.0
1.0
2.0
3.0
4.0
5.0 EPS(after tax)EPS(after tax)EPS(after tax)EPS(after tax)
cash dividendcash dividendcash dividendcash dividend
cash dividend cash dividend cash dividend cash dividend
payout ratiopayout ratiopayout ratiopayout ratio
201320122009 201020082007 20142011
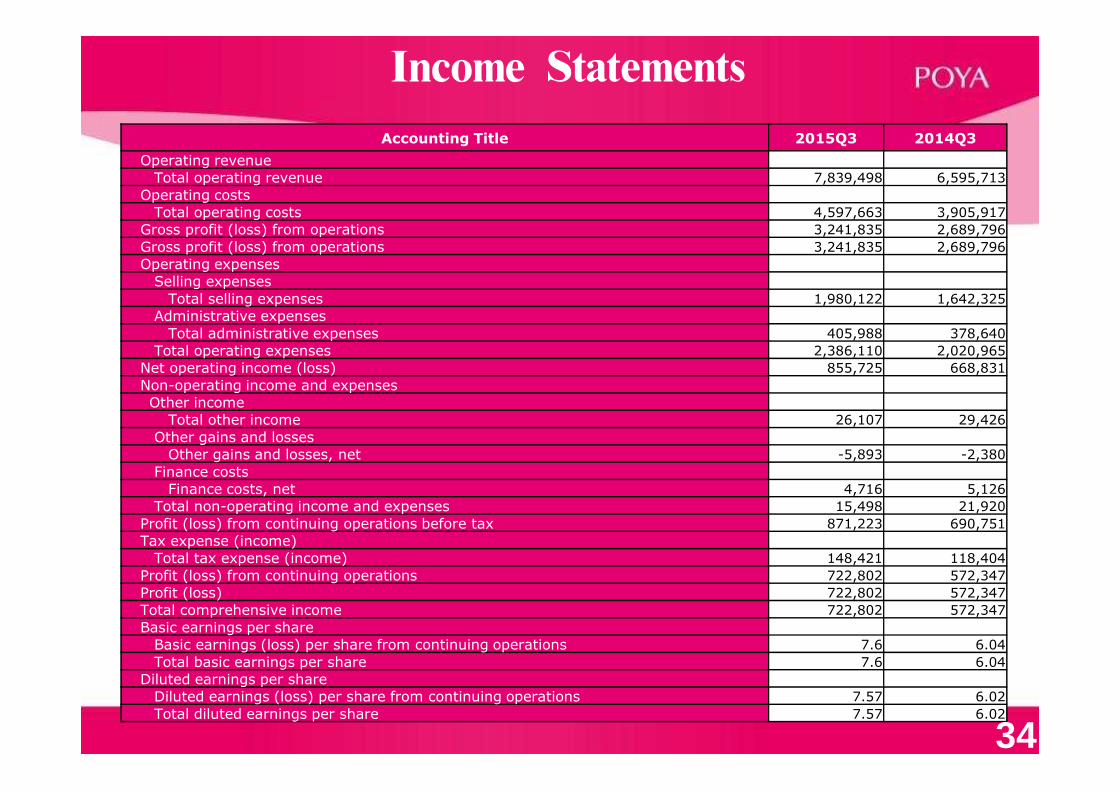
Income Statements
Accounting Title 2015Q3 2014Q3
Operating revenue
Total operating revenue 7,839,498 6,595,713
Operating costs
Total operating costs 4,597,663 3,905,917
Gross profit (loss) from operations 3,241,835 2,689,796
Gross profit (loss) from operations 3,241,835 2,689,796
Operating expenses
Selling expenses
Total selling expenses 1,980,122 1,642,325
Administrative expenses
Total administrative expenses 405,988 378,640
Total operating expenses 2,386,110 2,020,965
Net operating income (loss) 855,725 668,831
Non-operating income and expenses
Other incomeOther income
Total other income 26,107 29,426
Other gains and losses
Other gains and losses, net -5,893 -2,380
Finance costs
Finance costs, net 4,716 5,126
Total non-operating income and expenses 15,498 21,920
Profit (loss) from continuing operations before tax 871,223 690,751
Tax expense (income)
Total tax expense (income) 148,421 118,404
Profit (loss) from continuing operations 722,802 572,347
Profit (loss) 722,802 572,347
Total comprehensive income 722,802 572,347
Basic earnings per share
Basic earnings (loss) per share from continuing operations 7.6 6.04
Total basic earnings per share 7.6 6.04
Diluted earnings per share
Diluted earnings (loss) per share from continuing operations 7.57 6.02
Total diluted earnings per share 7.57 6.02
34
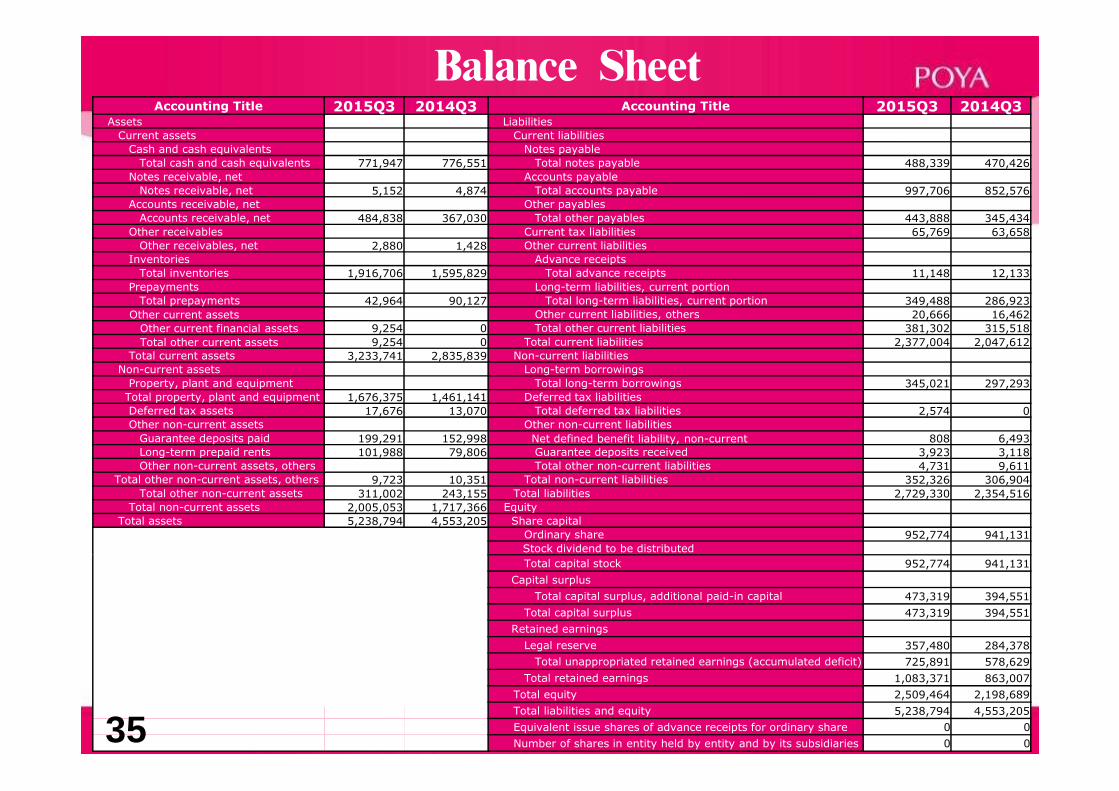
Balance SheetAccounting Title 2015Q3 2014Q3 Accounting Title 2015Q3 2014Q3
Assets Liabilities
Current assets Current liabilities
Cash and cash equivalents Notes payable
Total cash and cash equivalents 771,947 776,551 Total notes payable 488,339 470,426
Notes receivable, net Accounts payable
Notes receivable, net 5,152 4,874 Total accounts payable 997,706 852,576
Accounts receivable, net Other payables
Accounts receivable, net 484,838 367,030 Total other payables 443,888 345,434
Other receivables Current tax liabilities 65,769 63,658
Other receivables, net 2,880 1,428 Other current liabilities
Inventories Advance receipts
Total inventories 1,916,706 1,595,829 Total advance receipts 11,148 12,133
Prepayments Long-term liabilities, current portion
Total prepayments 42,964 90,127 Total long-term liabilities, current portion 349,488 286,923
Other current assets Other current liabilities, others 20,666 16,462
Other current financial assets 9,254 0 Total other current liabilities 381,302 315,518
Total other current assets 9,254 0 Total current liabilities 2,377,004 2,047,612
Total current assets 3,233,741 2,835,839 Non-current liabilities
Non-current assets Long-term borrowings
Property, plant and equipment Total long-term borrowings 345,021 297,293
Total property, plant and equipment 1,676,375 1,461,141 Deferred tax liabilitiesTotal property, plant and equipment 1,676,375 1,461,141 Deferred tax liabilities
Deferred tax assets 17,676 13,070 Total deferred tax liabilities 2,574 0
Other non-current assets Other non-current liabilities
Guarantee deposits paid 199,291 152,998 Net defined benefit liability, non-current 808 6,493
Long-term prepaid rents 101,988 79,806 Guarantee deposits received 3,923 3,118
Other non-current assets, others Total other non-current liabilities 4,731 9,611
Total other non-current assets, others 9,723 10,351 Total non-current liabilities 352,326 306,904
Total other non-current assets 311,002 243,155 Total liabilities 2,729,330 2,354,516
Total non-current assets 2,005,053 1,717,366 Equity
Total assets 5,238,794 4,553,205 Share capital
Ordinary share 952,774 941,131
Stock dividend to be distributed
Total capital stock 952,774 941,131
Capital surplus
Total capital surplus, additional paid-in capital 473,319 394,551
Total capital surplus 473,319 394,551
Retained earnings
Legal reserve 357,480 284,378
Total unappropriated retained earnings (accumulated deficit) 725,891 578,629
Total retained earnings 1,083,371 863,007
Total equity 2,509,464 2,198,689
Total liabilities and equity 5,238,794 4,553,205
Equivalent issue shares of advance receipts for ordinary share 0 0
Number of shares in entity held by entity and by its subsidiaries 0 035
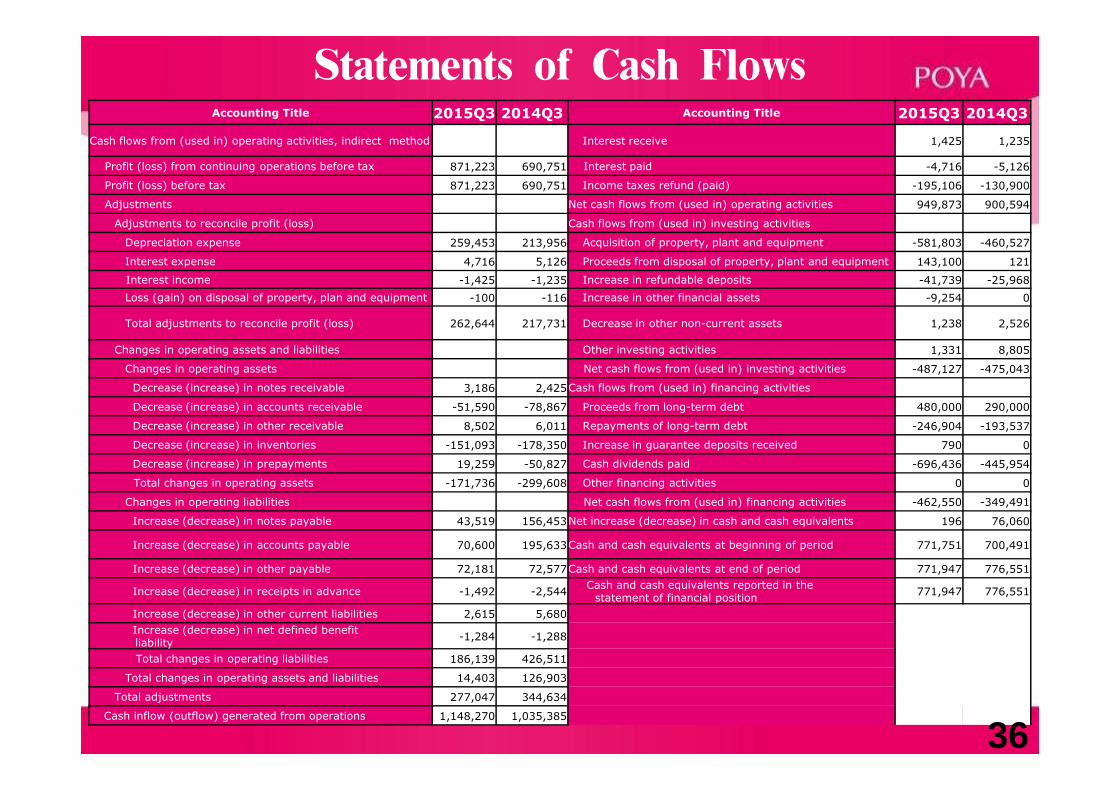
Statements of Cash FlowsAccounting Title 2015Q3 2014Q3 Accounting Title 2015Q3 2014Q3
Cash flows from (used in) operating activities, indirect method Interest receive 1,425 1,235
Profit (loss) from continuing operations before tax 871,223 690,751 Interest paid -4,716 -5,126
Profit (loss) before tax 871,223 690,751 Income taxes refund (paid) -195,106 -130,900
Adjustments Net cash flows from (used in) operating activities 949,873 900,594
Adjustments to reconcile profit (loss) Cash flows from (used in) investing activities
Depreciation expense 259,453 213,956 Acquisition of property, plant and equipment -581,803 -460,527
Interest expense 4,716 5,126 Proceeds from disposal of property, plant and equipment 143,100 121
Interest income -1,425 -1,235 Increase in refundable deposits -41,739 -25,968
Loss (gain) on disposal of property, plan and equipment -100 -116 Increase in other financial assets -9,254 0
Total adjustments to reconcile profit (loss) 262,644 217,731 Decrease in other non-current assets 1,238 2,526
Changes in operating assets and liabilities Other investing activities 1,331 8,805
Changes in operating assets Net cash flows from (used in) investing activities -487,127 -475,043
Decrease (increase) in notes receivable 3,186 2,425Cash flows from (used in) financing activities
Decrease (increase) in accounts receivable -51,590 -78,867 Proceeds from long-term debt 480,000 290,000
Decrease (increase) in other receivable 8,502 6,011 Repayments of long-term debt -246,904 -193,537
Decrease (increase) in inventories -151,093 -178,350 Increase in guarantee deposits received 790 0
Decrease (increase) in prepayments 19,259 -50,827 Cash dividends paid -696,436 -445,954
Total changes in operating assets -171,736 -299,608 Other financing activities 0 0
Changes in operating liabilities Net cash flows from (used in) financing activities -462,550 -349,491
Increase (decrease) in notes payable 43,519 156,453Net increase (decrease) in cash and cash equivalents 196 76,060
Increase (decrease) in accounts payable 70,600 195,633Cash and cash equivalents at beginning of period 771,751 700,491
Increase (decrease) in other payable 72,181 72,577Cash and cash equivalents at end of period 771,947 776,551
Increase (decrease) in receipts in advance -1,492 -2,544Cash and cash equivalents reported in the
statement of financial position771,947 776,551
Increase (decrease) in other current liabilities 2,615 5,680
Increase (decrease) in net defined benefit liability
-1,284 -1,288
Total changes in operating liabilities 186,139 426,511
Total changes in operating assets and liabilities 14,403 126,903
Total adjustments 277,047 344,634
Cash inflow (outflow) generated from operations 1,148,270 1,035,385
36
www.poya.com.tw/en/
![Cleco Protection System Part Deux- FINAL 20151203 · 12/4/2015 1 *A superficial ... compliance (e.g., automation of an Automatic Voltage Regulator [AVR] ... Cleco Protection System](https://img.pdfslide.us/doc/110x75/5add4f1d7f8b9a9d4d8cfdc7/cleco-protection-system-part-deux-final-1-a-superficial-compliance-eg.jpg)


![Genèsedesconcentraons de&NickelenNouvelle&Calédonie ......2001]. The Poya Terrane occurs as a package of steep fault-bounded sheets intercalated between the overlying Peridotite](https://img.pdfslide.us/doc/110x75/5f75976d8505fd0c340ae303/gensedesconcentraons-denickelennouvellecaldonie-2001-the.jpg)