Embed Size (px)
Citation preview

15 March 2018
Forward-looking Statements
Certain statements contained in this presentation may be viewed as “forward‐lookingstatements” within the meaning of Section 27A of the U.S. Securities Act of 1933 (asamended) and Section 21E of the U.S. Securities Exchange Act of 1934 (as amended). Suchforward‐looking statements are subject to known and unknown risks, uncertainties andother factors, which may cause the actual performance, financial condition or results ofoperations of the Company to be materially different from any future performance,financial condition or results of operations implied by such forward‐looking statements. Inaddition, we do not intend to update these forward‐looking statements. Furtherinformation regarding these risks, uncertainties and other factors is included in theCompany’s most recent Annual Report on Form 20‐F filed with the U.S. Securities andExchange Commission (the “SEC”) and in the Company’s other filings with the SEC.
2
Mr. Wang XiaochuChairman & CEO
Mr. Lu YiminExecutive Director & President
Mr. Li FushenExecutive Director & CFO
Mr. Shao GuangluExecutive Director & SVP
Management Present
3
Agenda
4
FINANCIAL PERFORMANCE
OVERALL RESULTS
OPERATING PERFORMANCE
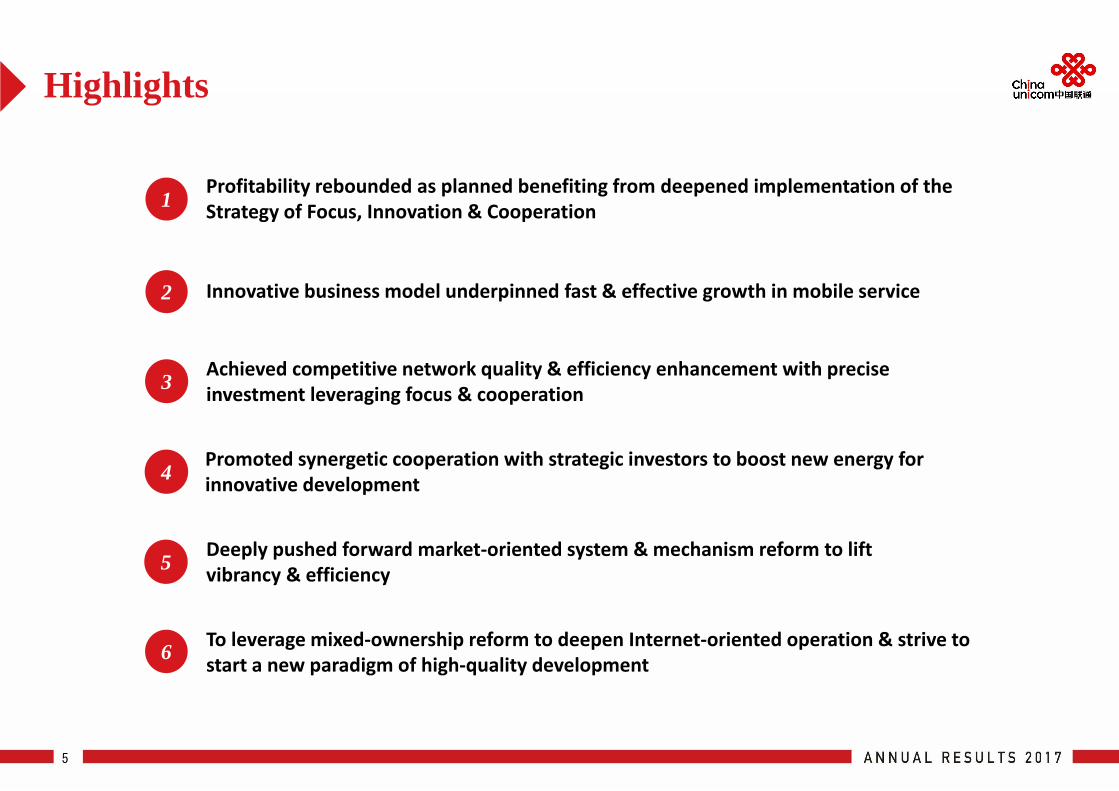
Profitability rebounded as planned benefiting from deepened implementation of the Strategy of Focus, Innovation & Cooperation1
Innovative business model underpinned fast & effective growth in mobile service2
Achieved competitive network quality & efficiency enhancement with precise investment leveraging focus & cooperation 3
Promoted synergetic cooperation with strategic investors to boost new energy for innovative development4
Deeply pushed forward market‐oriented system & mechanism reform to lift vibrancy & efficiency5
To leverage mixed‐ownership reform to deepen Internet‐oriented operation & strive to start a new paradigm of high‐quality development6
Highlights
5
Note: Unless otherwise stated in this presentation, 1. Service revenue = operating revenue – sales of telecommunications products. 2. In order to better satisfy the internal operation and management requirements, revenue from sales of products associated with the ICT business, which was previously recorded as part of the fixed‐
line service revenue, has been reclassified as part of the revenue from sales of telecommunications products. The related figures for 2016 have been restated. 3. EBITDA = profit for the year before finance costs, interest income, shares of net profit of associates, share of net profit of joint ventures, other income ‐ net, income tax, depreciation & amortisation. 4. Net profit represented profit attributable to equity shareholders of the Company.5. Free cash flow = operating cash flow – CAPEX.
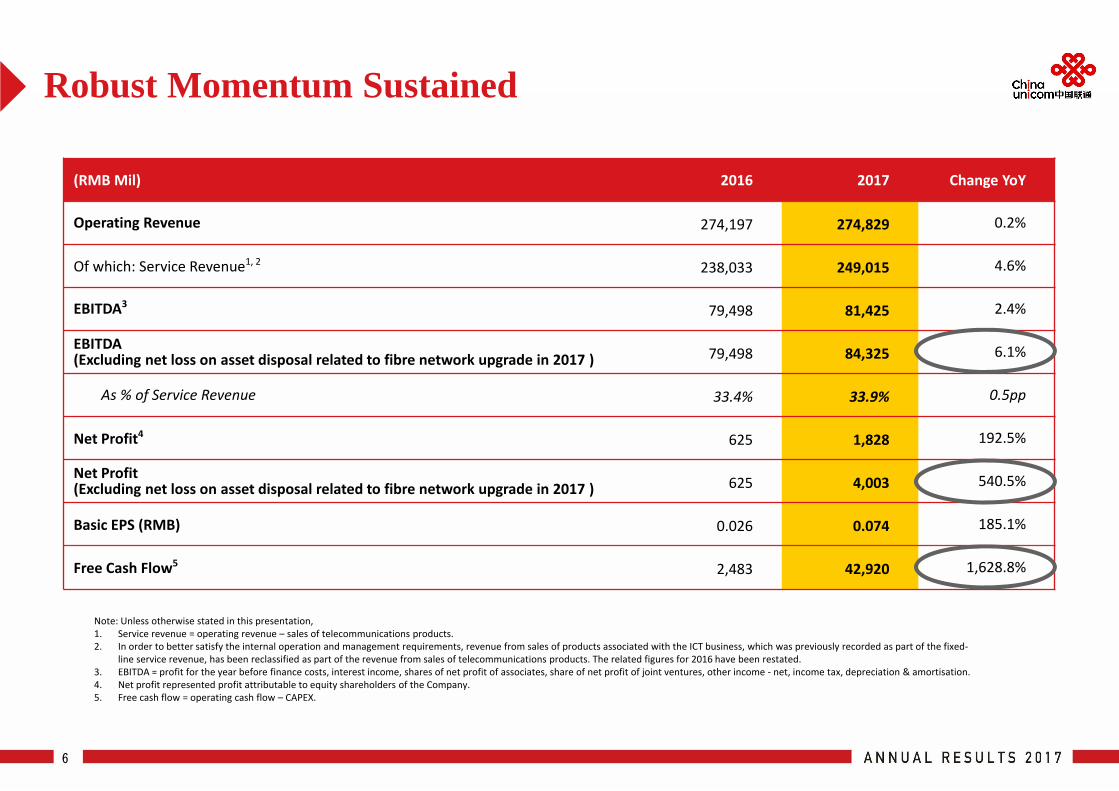
Robust Momentum Sustained
6
(RMB Mil) 2016 2017 Change YoY
Operating Revenue 274,197 274,829 0.2%
Of which: Service Revenue1, 2 238,033 249,015 4.6%
EBITDA3 79,498 81,425 2.4%
EBITDA (Excluding net loss on asset disposal related to fibre network upgrade in 2017 ) 79,498 84,325 6.1%
As % of Service Revenue 33.4% 33.9% 0.5pp
Net Profit4 625 1,828 192.5%
Net Profit (Excluding net loss on asset disposal related to fibre network upgrade in 2017 ) 625 4,003 540.5%
Basic EPS (RMB) 0.026 0.074 185.1%
Free Cash Flow5 2,483 42,920 1,628.8%
Note: 1. FCF yield = free cash flow / average market capitalisation of the Company. 2. Excluding net loss on asset disposal related to fibre network upgrade in 2017.
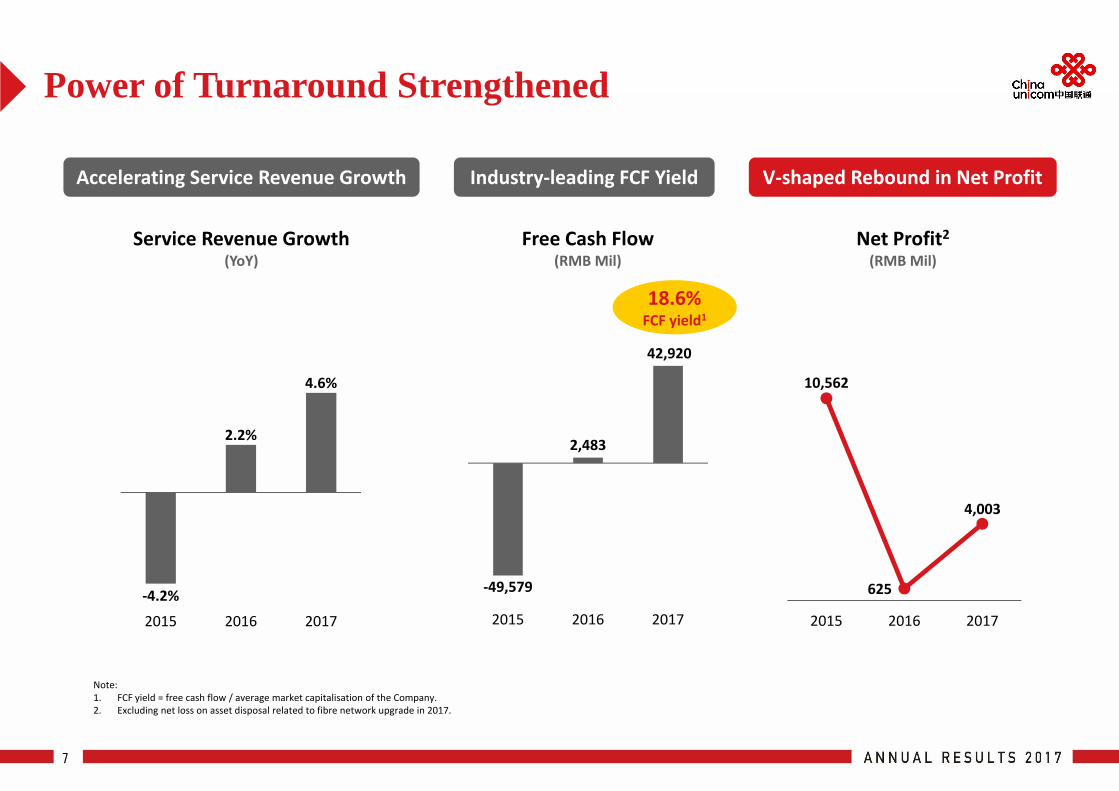
Power of Turnaround Strengthened
7
Service Revenue Growth (YoY)
Free Cash Flow(RMB Mil)
Net Profit2(RMB Mil)
‐4.2%
2.2%
4.6%
2015 2016 2017
Accelerating Service Revenue Growth
‐49,579
2,483
42,920
2015 2016 2017
10,562
625
4,003
2015 2016 2017
18.6%FCF yield1
Industry‐leading FCF Yield V‐shaped Rebound in Net Profit
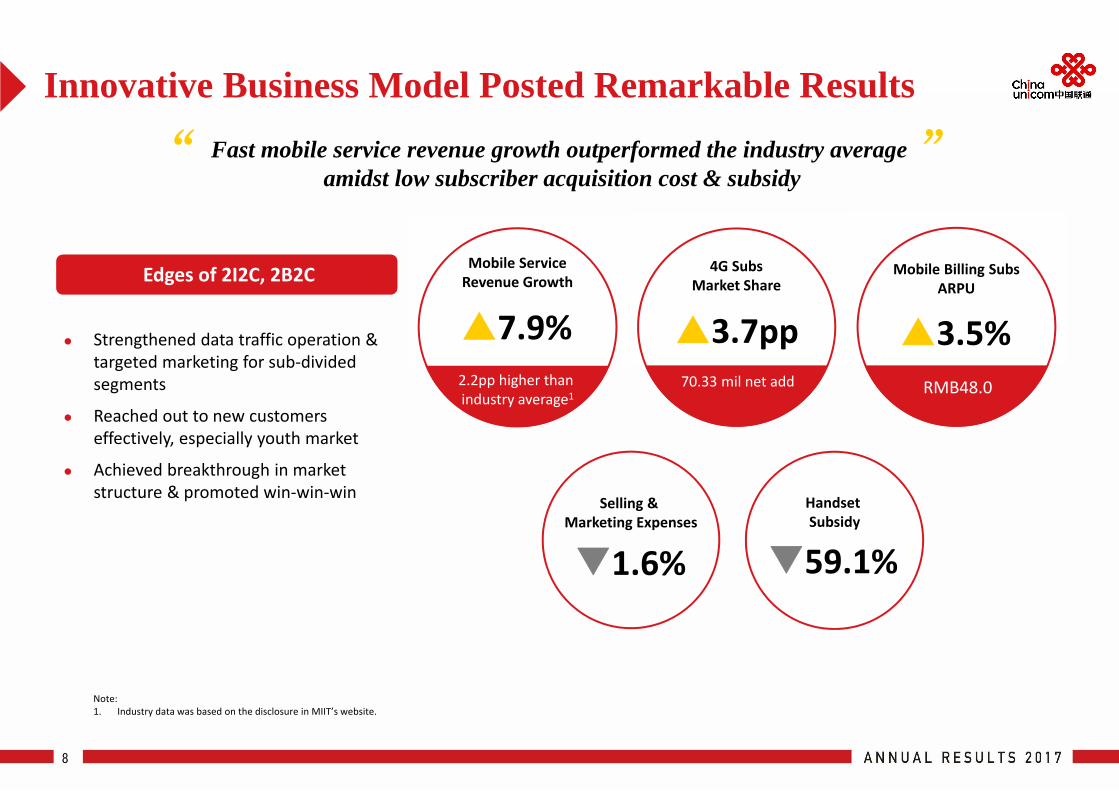
Fast mobile service revenue growth outperformed the industry average amidst low subscriber acquisition cost & subsidy
Innovative Business Model Posted Remarkable Results
8
Edges of 2I2C, 2B2C
Strengthened data traffic operation & targeted marketing for sub‐divided segments
Reached out to new customers effectively, especially youth market
Achieved breakthrough in market structure & promoted win‐win‐win
Note: 1. Industry data was based on the disclosure in MIIT’s website.
“ ”
Handset Subsidy
59.1%
Mobile Billing SubsARPU
3.5%RMB48.0
4G SubsMarket Share
3.7pp70.33 mil net add
Mobile ServiceRevenue Growth
7.9%2.2pp higher than industry average1
Selling & Marketing Expenses
1.6%
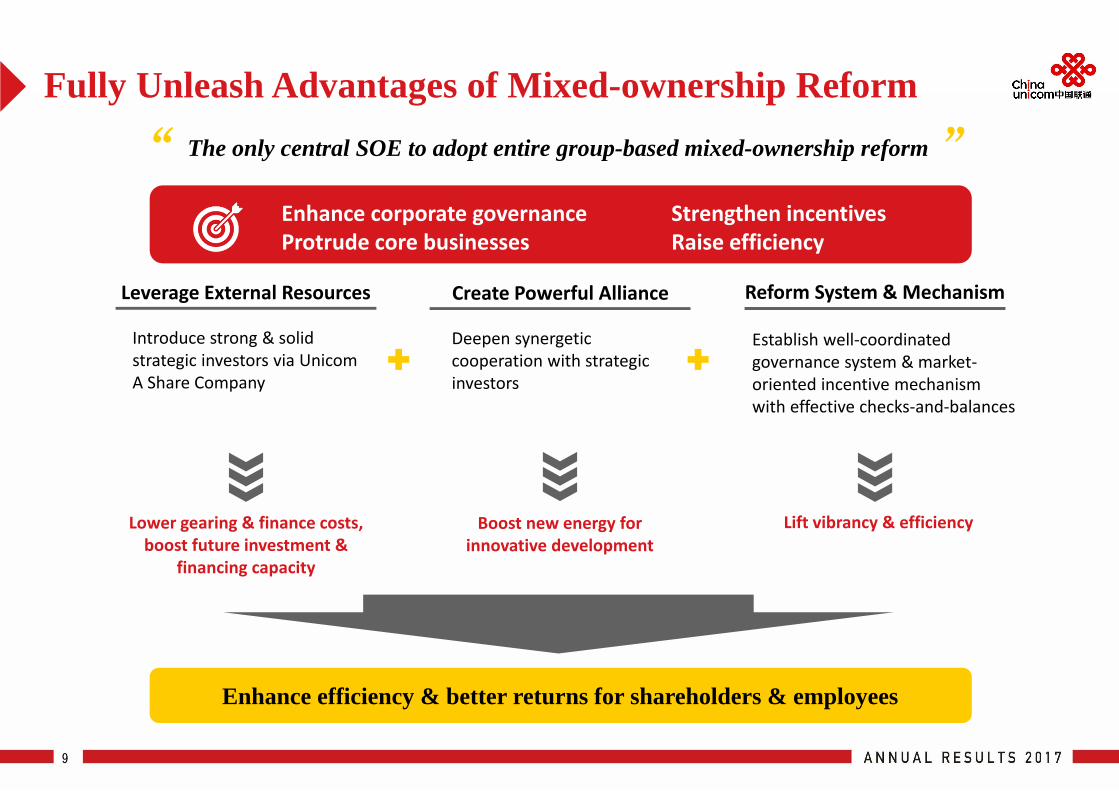
Enhance efficiency & better returns for shareholders & employees
Enhance corporate governanceProtrude core businesses
Strengthen incentivesRaise efficiency
Fully Unleash Advantages of Mixed-ownership Reform
9
The only central SOE to adopt entire group-based mixed-ownership reform“ ”
Introduce strong & solid strategic investors via Unicom A Share Company
Lower gearing & finance costs, boost future investment &
financing capacity
Leverage External Resources
Deepen synergetic cooperation with strategic investors
Boost new energy for innovative development
Create Powerful Alliance
Establish well‐coordinated governance system & market‐oriented incentive mechanism with effective checks‐and‐balances
Lift vibrancy & efficiency
Reform System & Mechanism
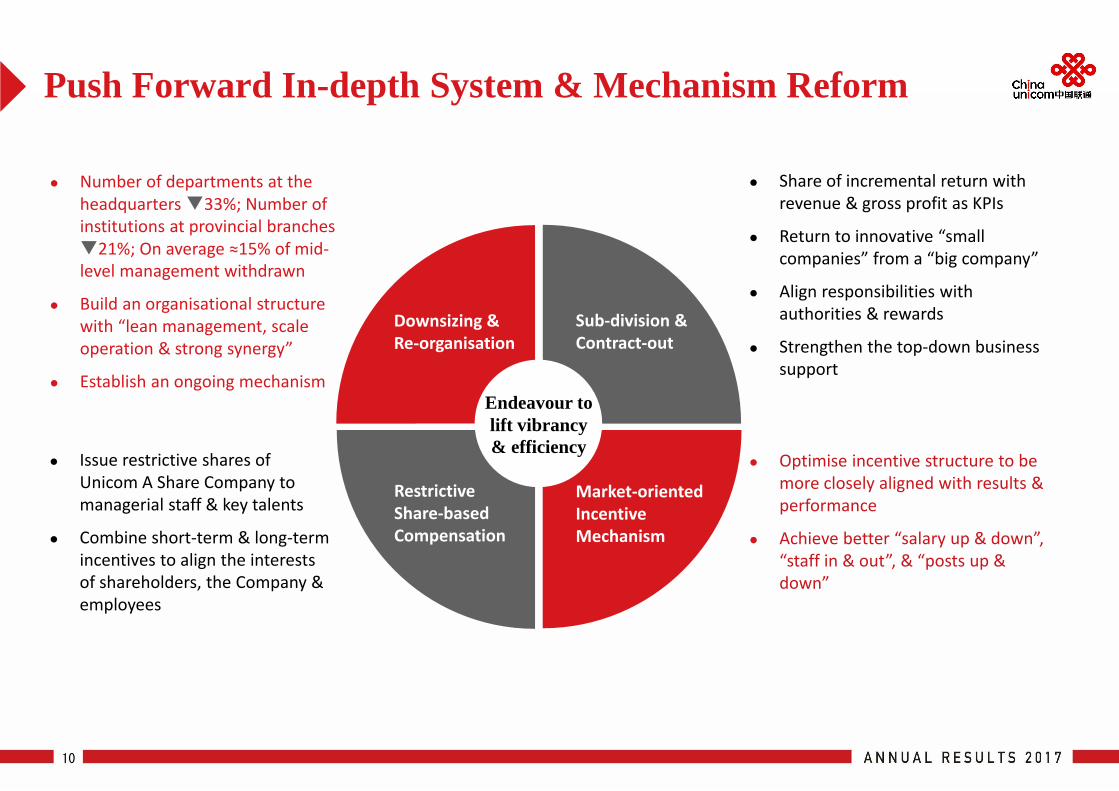
Push Forward In-depth System & Mechanism Reform
10
Number of departments at the headquarters 33%; Number of institutions at provincial branches 21%; On average ≈15% of mid‐level management withdrawn
Build an organisational structure with “lean management, scale operation & strong synergy”
Establish an ongoing mechanism
Share of incremental return with revenue & gross profit as KPIs
Return to innovative “small companies” from a “big company”
Align responsibilities with authorities & rewards
Strengthen the top‐down business support
Optimise incentive structure to be more closely aligned with results & performance
Achieve better “salary up & down”, “staff in & out”, & “posts up & down”
Issue restrictive shares of Unicom A Share Company to managerial staff & key talents
Combine short‐term & long‐term incentives to align the interests of shareholders, the Company & employees
Sub‐division & Contract‐out
Market‐oriented Incentive Mechanism
Downsizing & Re‐organisation
Restrictive Share‐based Compensation
Endeavour to lift vibrancy & efficiency
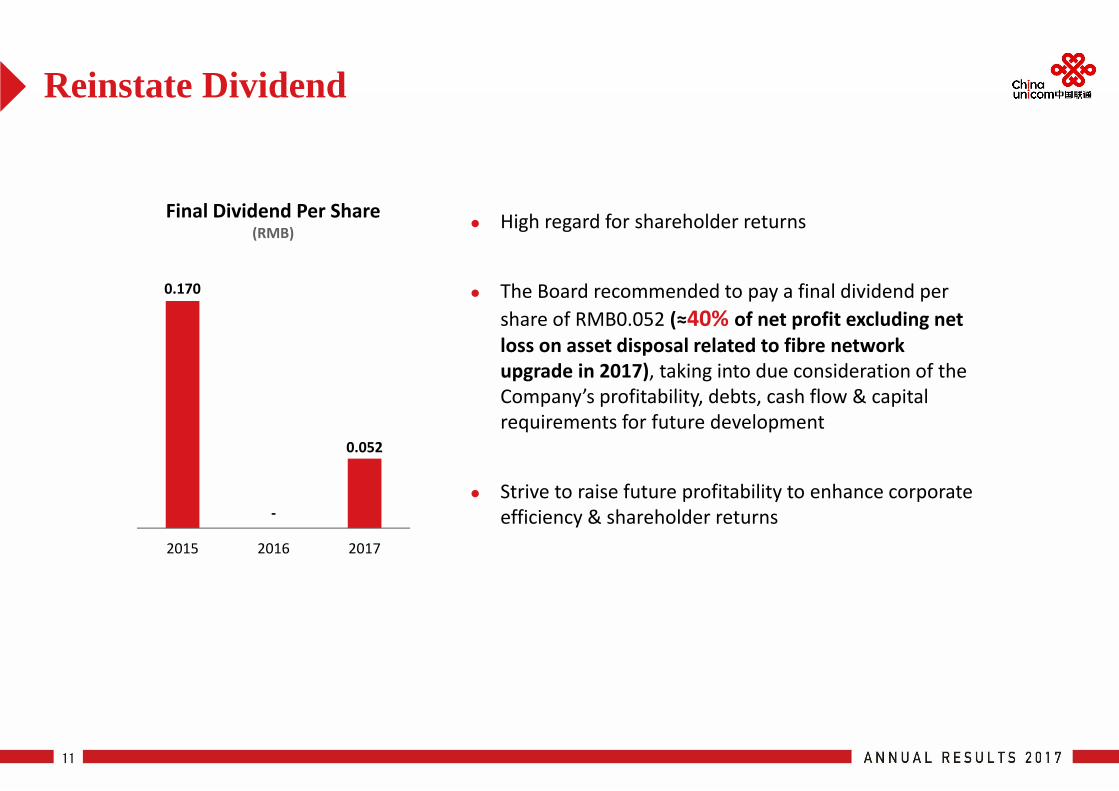
High regard for shareholder returns
The Board recommended to pay a final dividend per share of RMB0.052 (≈40% of net profit excluding net loss on asset disposal related to fibre network upgrade in 2017), taking into due consideration of the Company’s profitability, debts, cash flow & capital requirements for future development
Strive to raise future profitability to enhance corporate efficiency & shareholder returns
Final Dividend Per Share(RMB)
Reinstate Dividend
11
0.170
‐
0.052
2015 2016 2017
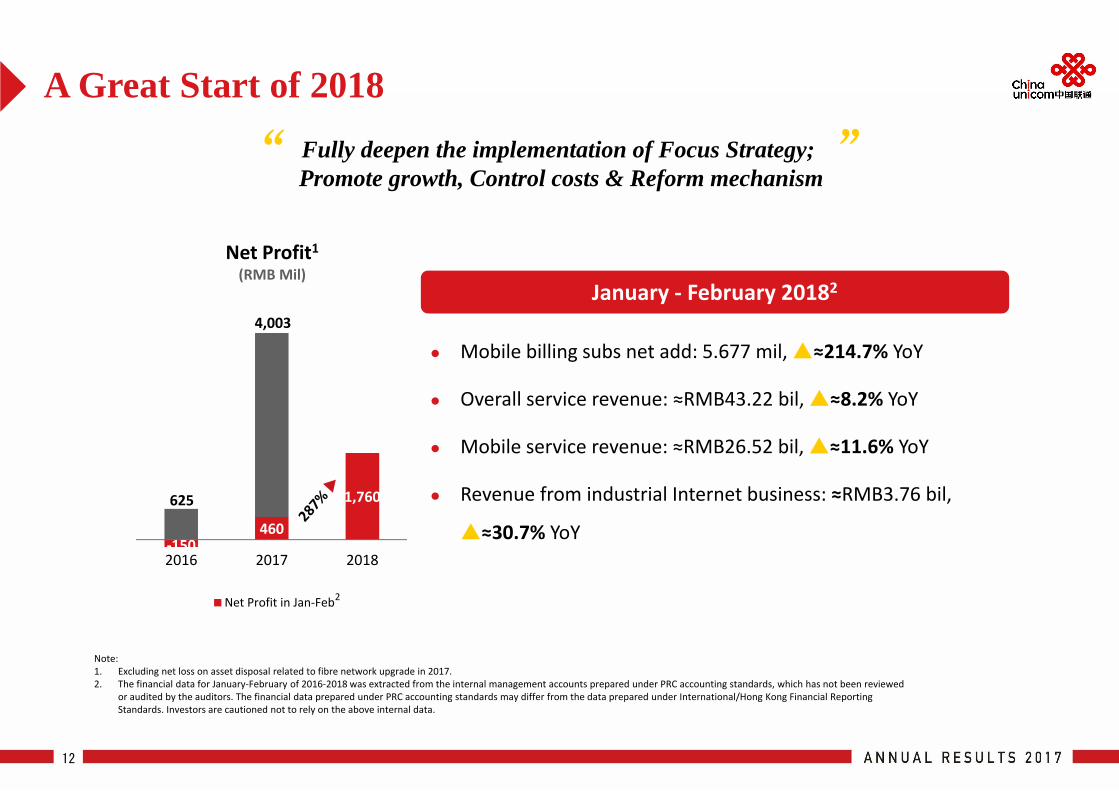
‐150460
1,760
2016 2017 2018
Net Profit in Jan‐Feb2
Note: 1. Excluding net loss on asset disposal related to fibre network upgrade in 2017. 2. The financial data for January‐February of 2016‐2018 was extracted from the internal management accounts prepared under PRC accounting standards, which has not been reviewed
or audited by the auditors. The financial data prepared under PRC accounting standards may differ from the data prepared under International/Hong Kong Financial Reporting Standards. Investors are cautioned not to rely on the above internal data.
A Great Start of 2018
12
“ ”Fully deepen the implementation of Focus Strategy; Promote growth, Control costs & Reform mechanism
Mobile billing subs net add: 5.677 mil, ≈214.7% YoY
Overall service revenue: ≈RMB43.22 bil, ≈8.2% YoY
Mobile service revenue: ≈RMB26.52 bil, ≈11.6% YoY
Revenue from industrial Internet business: ≈RMB3.76 bil,
≈30.7% YoY
January ‐ February 20182Net Profit1(RMB Mil)
625
4,003
Note: 1. For the details of Unicom A Share Company’s employee share incentive scheme, please refer to the related Unicom A Share Company’s public announcements filed with The
Shanghai Stock Exchange on 11 February 2018.2. For the comparison between the historical financial data of Unicom Red Chip Company and Unicom A Share Company, please refer to slide 38.3. Pre‐tax profit in 2017 excluded net loss on asset disposal related to fibre network upgrade.
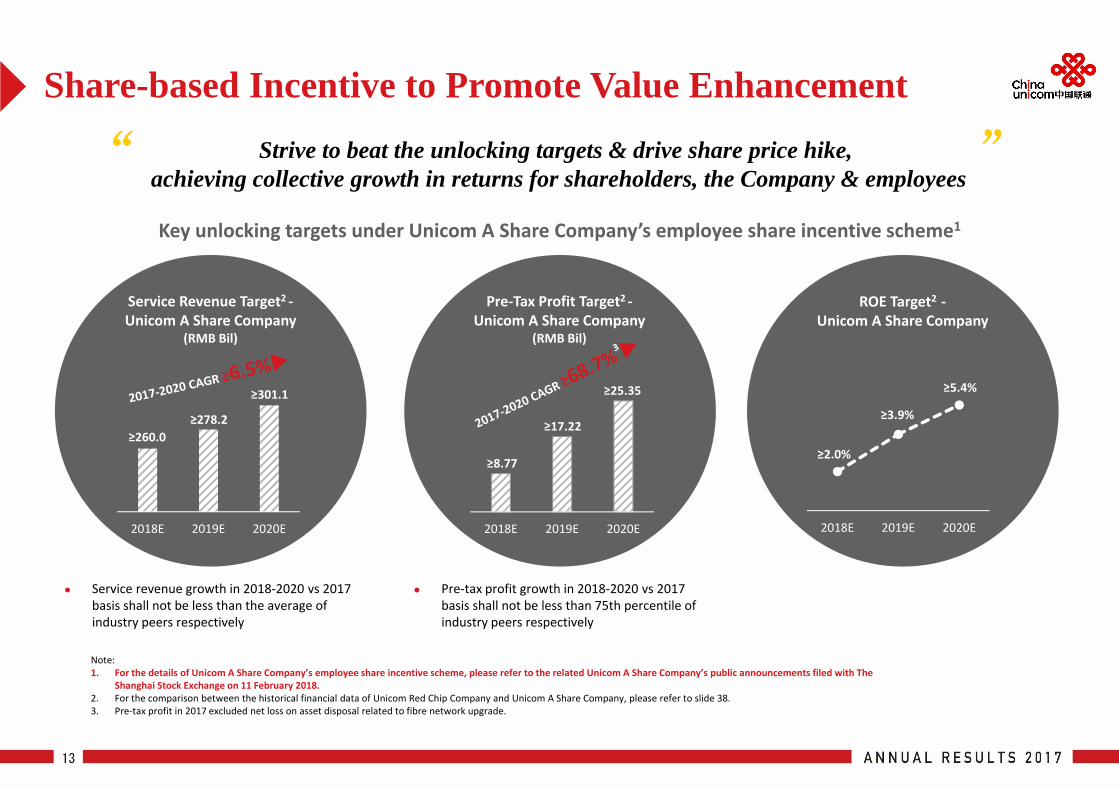
Service Revenue Target2 ‐Unicom A Share Company
(RMB Bil)
Pre‐Tax Profit Target2 ‐Unicom A Share Company
(RMB Bil)
ROE Target2 ‐Unicom A Share Company
Service revenue growth in 2018‐2020 vs 2017 basis shall not be less than the average of industry peers respectively
Pre‐tax profit growth in 2018‐2020 vs 2017 basis shall not be less than 75th percentile of industry peers respectively
2018E 2019E 2020E
≥260.0≥278.2
≥301.1
2018E 2019E 2020E
≥8.77
≥17.22
≥25.35
2018E 2019E 2020E
≥2.0%
≥3.9%
≥5.4%
Key unlocking targets under Unicom A Share Company’s employee share incentive scheme1
Strive to beat the unlocking targets & drive share price hike, achieving collective growth in returns for shareholders, the Company & employees
Share-based Incentive to Promote Value Enhancement
13
“ ”
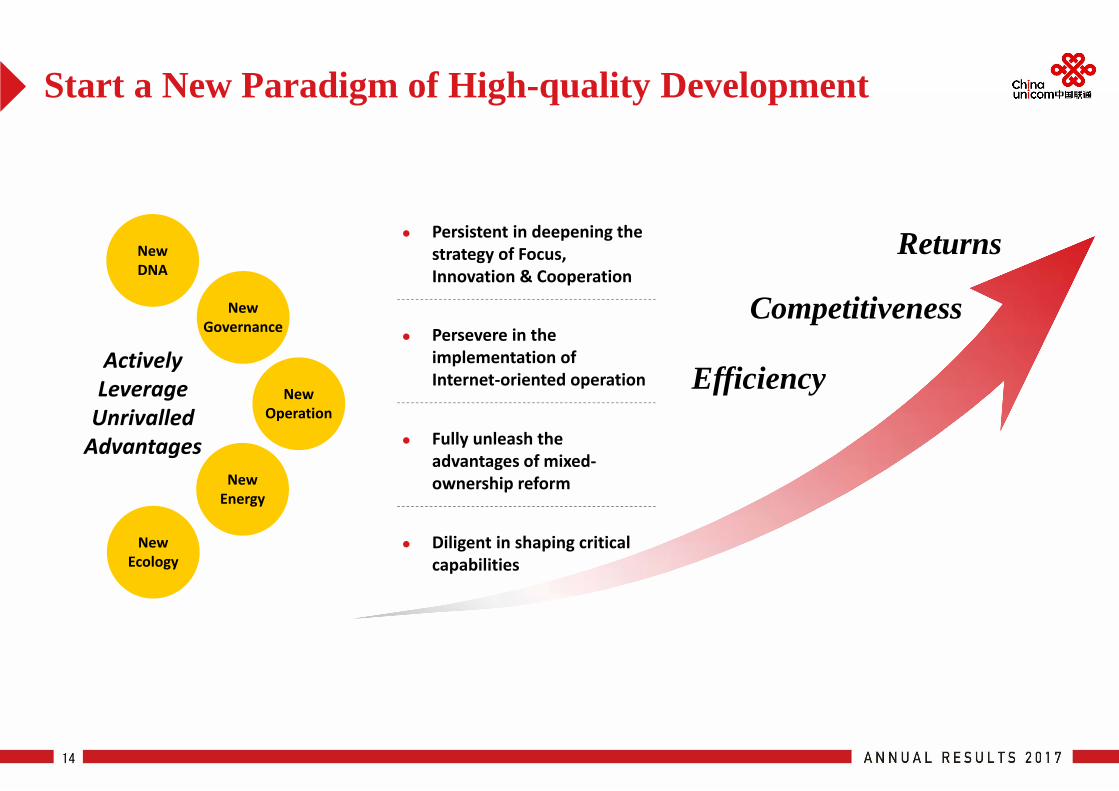
Start a New Paradigm of High-quality Development
14
ActivelyLeverageUnrivalledAdvantages
New DNA
New Governance
New Operation
New Energy
New Ecology
Efficiency
Persistent in deepening the strategy of Focus, Innovation & Cooperation
Persevere in the implementation of Internet‐oriented operation
Fully unleash the advantages of mixed‐ownership reform
Diligent in shaping critical capabilities
Competitiveness
Returns
Agenda
15
OVERALLRESULTS
FINANCIAL PERFORMANCE
OPERATING PERFORMANCE
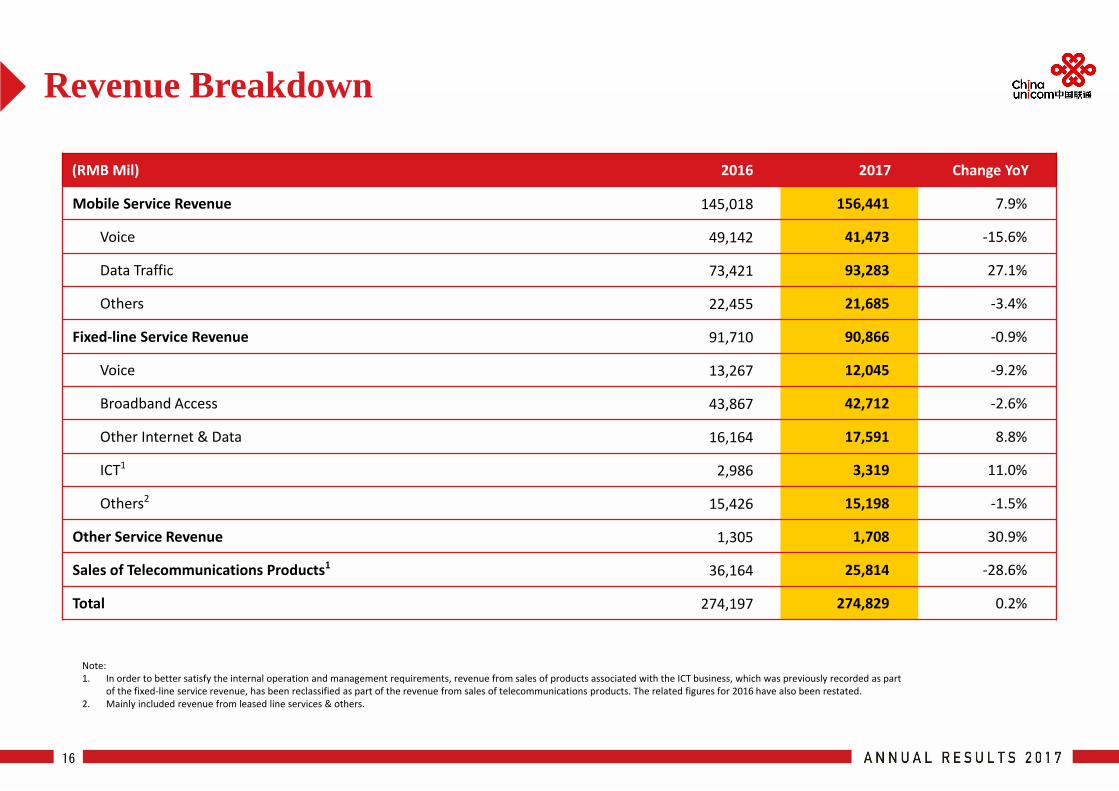
Revenue Breakdown
16
Note:1. In order to better satisfy the internal operation and management requirements, revenue from sales of products associated with the ICT business, which was previously recorded as part
of the fixed‐line service revenue, has been reclassified as part of the revenue from sales of telecommunications products. The related figures for 2016 have also been restated.2. Mainly included revenue from leased line services & others.
(RMB Mil) 2016 2017 Change YoY
Mobile Service Revenue 145,018 156,441 7.9%
Voice 49,142 41,473 ‐15.6%
Data Traffic 73,421 93,283 27.1%
Others 22,455 21,685 ‐3.4%
Fixed‐line Service Revenue 91,710 90,866 ‐0.9%
Voice 13,267 12,045 ‐9.2%
Broadband Access 43,867 42,712 ‐2.6%
Other Internet & Data 16,164 17,591 8.8%
ICT1 2,986 3,319 11.0%
Others2 15,426 15,198 ‐1.5%
Other Service Revenue 1,305 1,708 30.9%
Sales of Telecommunications Products1 36,164 25,814 ‐28.6%
Total 274,197 274,829 0.2%
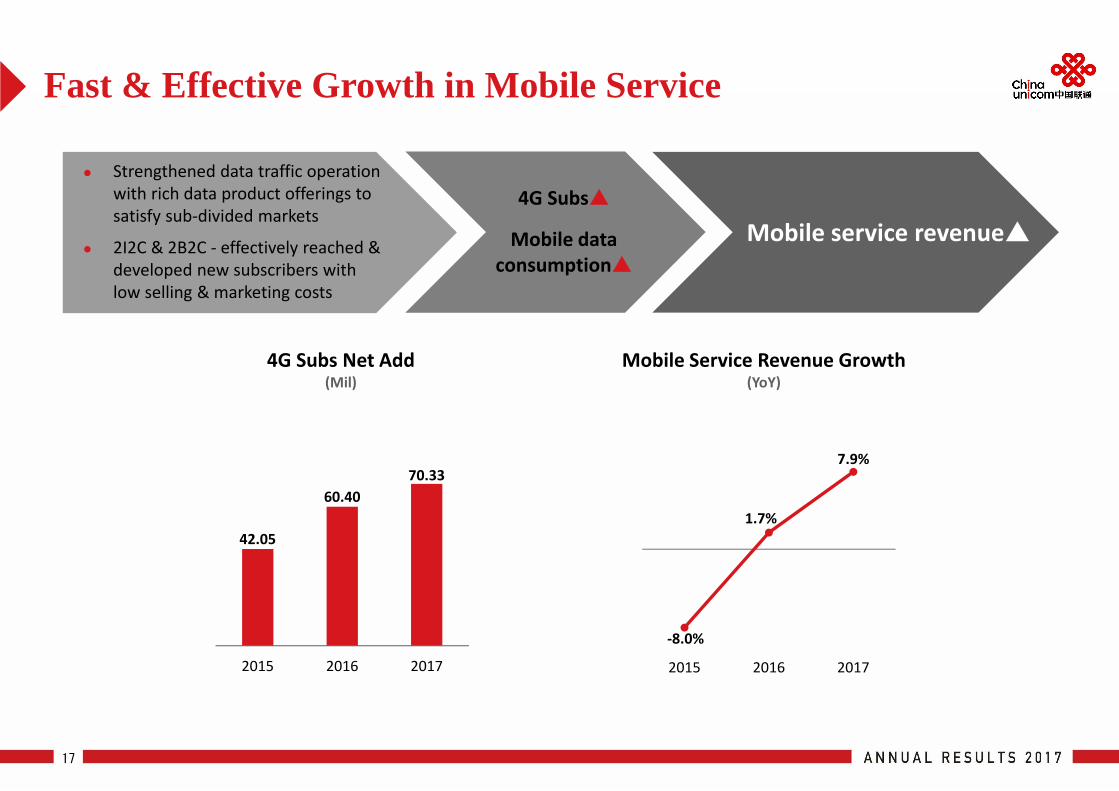
Fast & Effective Growth in Mobile Service
17
Mobile service revenue
Strengthened data traffic operation with rich data product offerings to satisfy sub‐divided markets
2I2C & 2B2C ‐ effectively reached & developed new subscribers with low selling & marketing costs
4G Subs
Mobile data consumption
42.05
60.40 70.33
2015 2016 2017
‐8.0%
1.7%
7.9%
2015 2016 2017
Mobile Service Revenue Growth(YoY)
4G Subs Net Add(Mil)
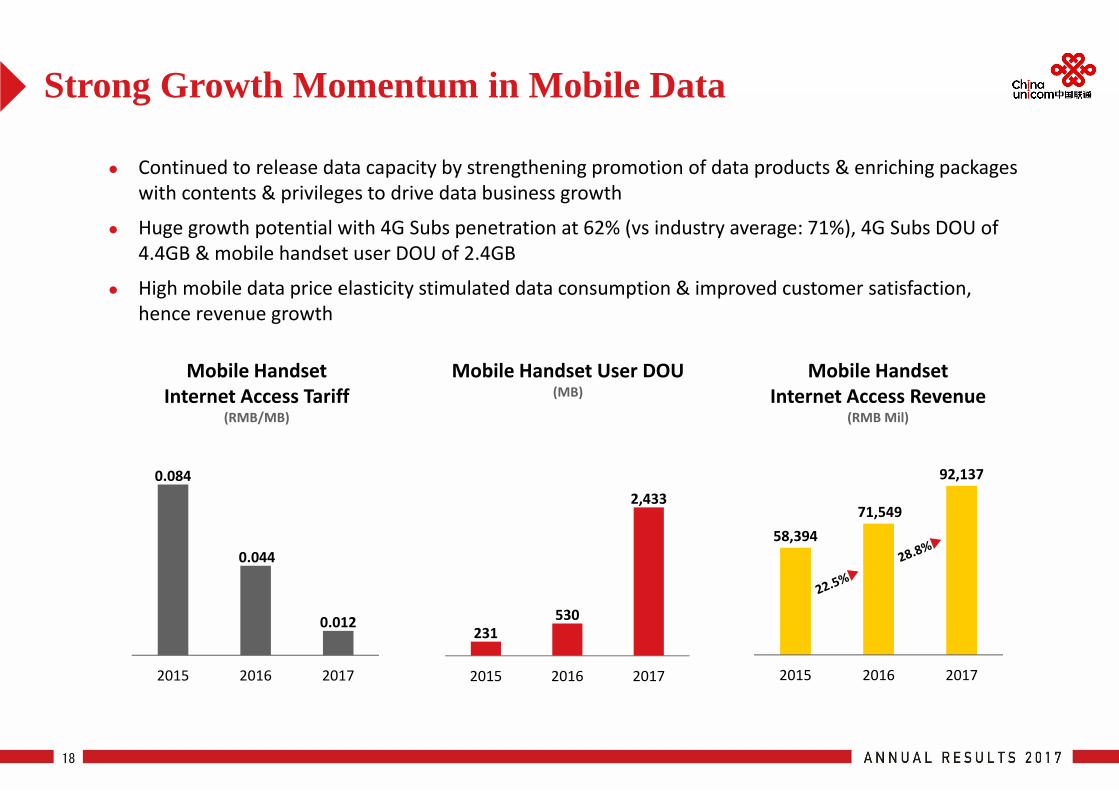
Strong Growth Momentum in Mobile Data
18
58,394 71,549
92,137
2015 2016 2017
231530
2,433
2015 2016 2017
0.084
0.044
0.012
2015 2016 2017
Continued to release data capacity by strengthening promotion of data products & enriching packages with contents & privileges to drive data business growth
Huge growth potential with 4G Subs penetration at 62% (vs industry average: 71%), 4G Subs DOU of 4.4GB & mobile handset user DOU of 2.4GB
High mobile data price elasticity stimulated data consumption & improved customer satisfaction, hence revenue growth
Mobile Handset Internet Access Tariff
(RMB/MB)
Mobile Handset User DOU(MB)
Mobile Handset Internet Access Revenue
(RMB Mil)
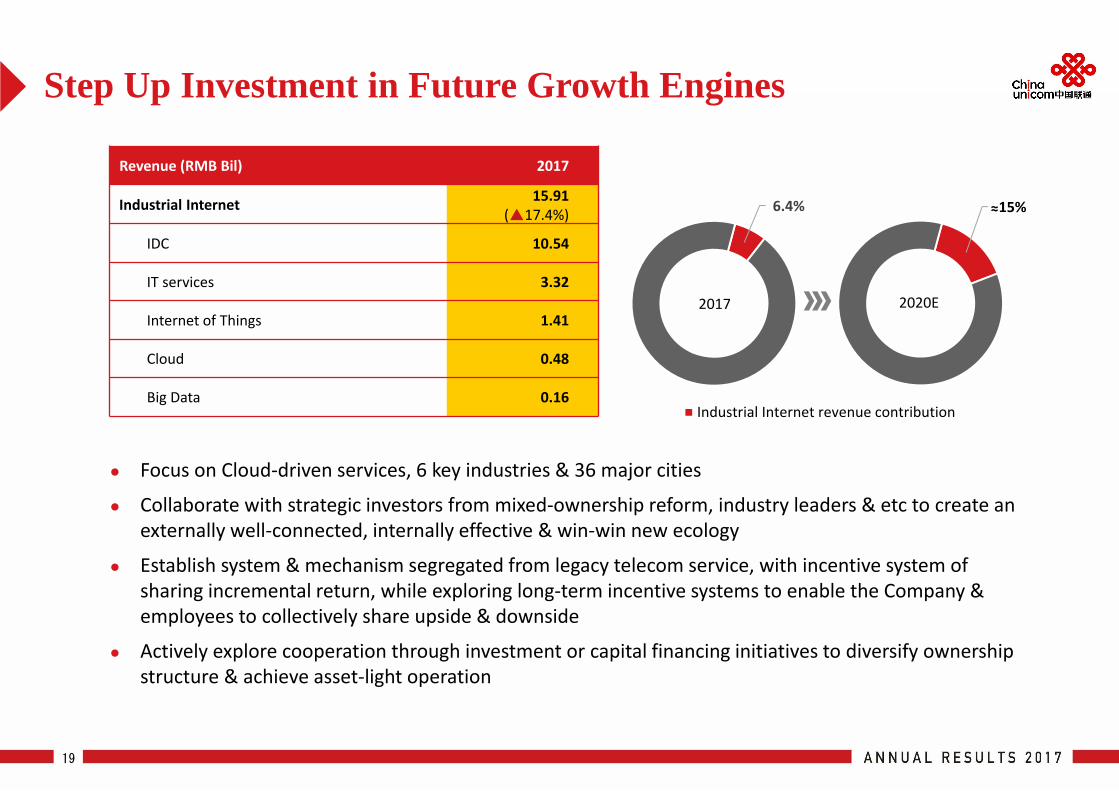
6.4%
Industrial Internet revenue contribution
2017
15%
2020E
Step Up Investment in Future Growth Engines
19
Focus on Cloud‐driven services, 6 key industries & 36 major cities
Collaborate with strategic investors from mixed‐ownership reform, industry leaders & etc to create an externally well‐connected, internally effective & win‐win new ecology
Establish system & mechanism segregated from legacy telecom service, with incentive system of sharing incremental return, while exploring long‐term incentive systems to enable the Company & employees to collectively share upside & downside
Actively explore cooperation through investment or capital financing initiatives to diversify ownership structure & achieve asset‐light operation
Revenue (RMB Bil) 2017
Industrial Internet 15.91(17.4%)
IDC 10.54
IT services 3.32
Internet of Things 1.41
Cloud 0.48
Big Data 0.16
≈
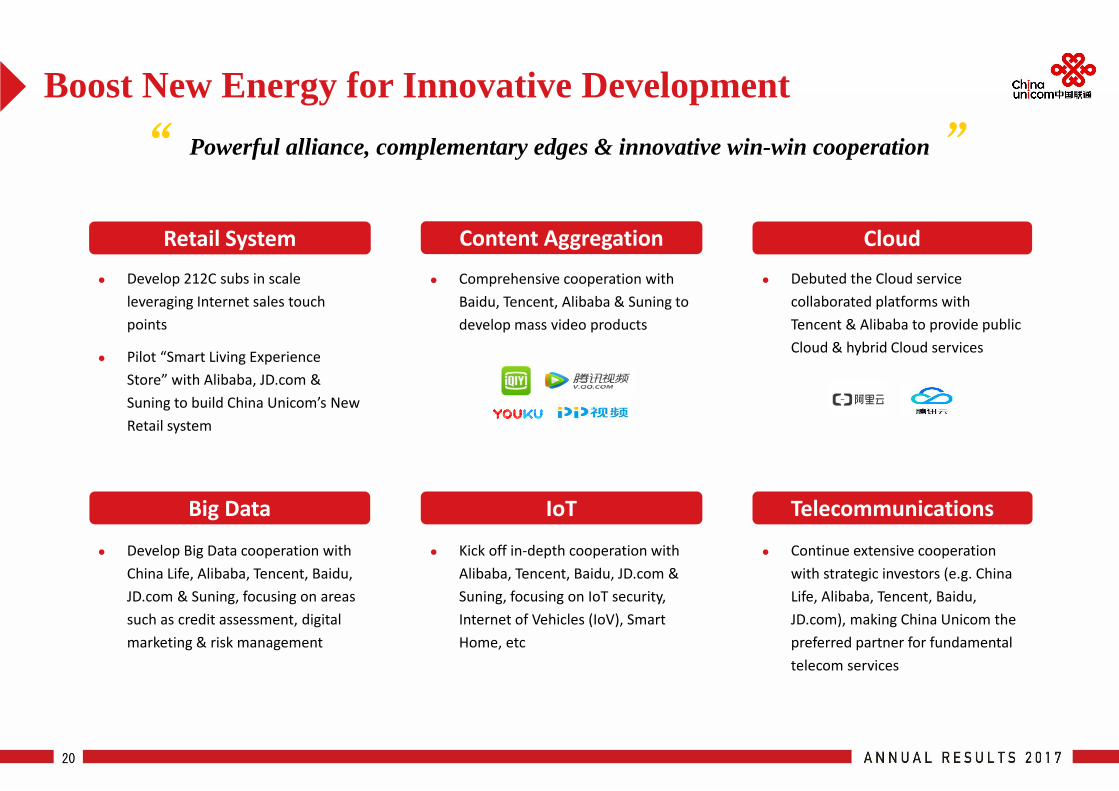
Boost New Energy for Innovative Development
20
Develop 212C subs in scale leveraging Internet sales touch points
Pilot “Smart Living Experience Store” with Alibaba, JD.com & Suning to build China Unicom’s New Retail system
Develop Big Data cooperation with China Life, Alibaba, Tencent, Baidu, JD.com & Suning, focusing on areas such as credit assessment, digital marketing & risk management
Comprehensive cooperation with Baidu, Tencent, Alibaba & Suning to develop mass video products
Kick off in‐depth cooperation with Alibaba, Tencent, Baidu, JD.com & Suning, focusing on IoT security, Internet of Vehicles (IoV), Smart Home, etc
Debuted the Cloud service collaborated platforms with Tencent & Alibaba to provide public Cloud & hybrid Cloud services
Continue extensive cooperation with strategic investors (e.g. China Life, Alibaba, Tencent, Baidu, JD.com), making China Unicom the preferred partner for fundamental telecom services
Retail System
Big Data IoT Telecommunications
CloudContent Aggregation
Powerful alliance, complementary edges & innovative win-win cooperation“ ”
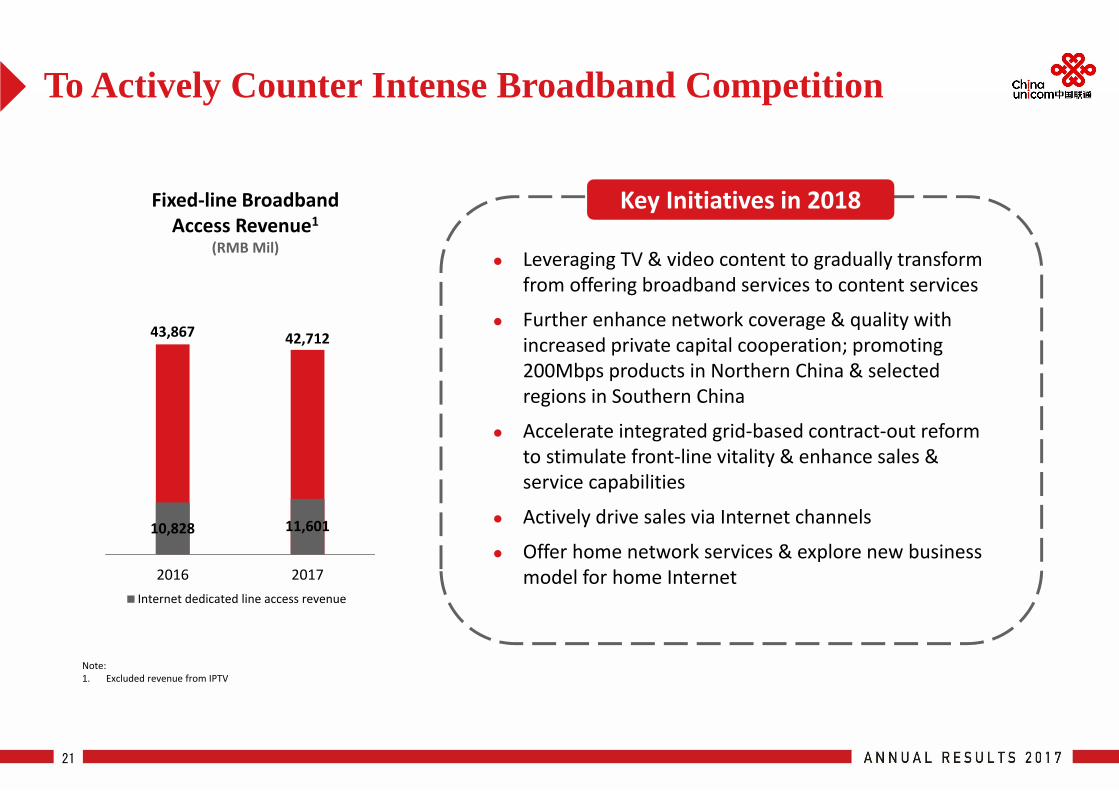
To Actively Counter Intense Broadband Competition
21
Note: 1. Excluded revenue from IPTV
43,867 42,712
10,828 11,601
2016 2017Internet dedicated line access revenue
Fixed‐line Broadband Access Revenue1
(RMB Mil) Leveraging TV & video content to gradually transform
from offering broadband services to content services
Further enhance network coverage & quality with increased private capital cooperation; promoting 200Mbps products in Northern China & selected regions in Southern China
Accelerate integrated grid‐based contract‐out reform to stimulate front‐line vitality & enhance sales & service capabilities
Actively drive sales via Internet channels
Offer home network services & explore new business model for home Internet
Key Initiatives in 2018
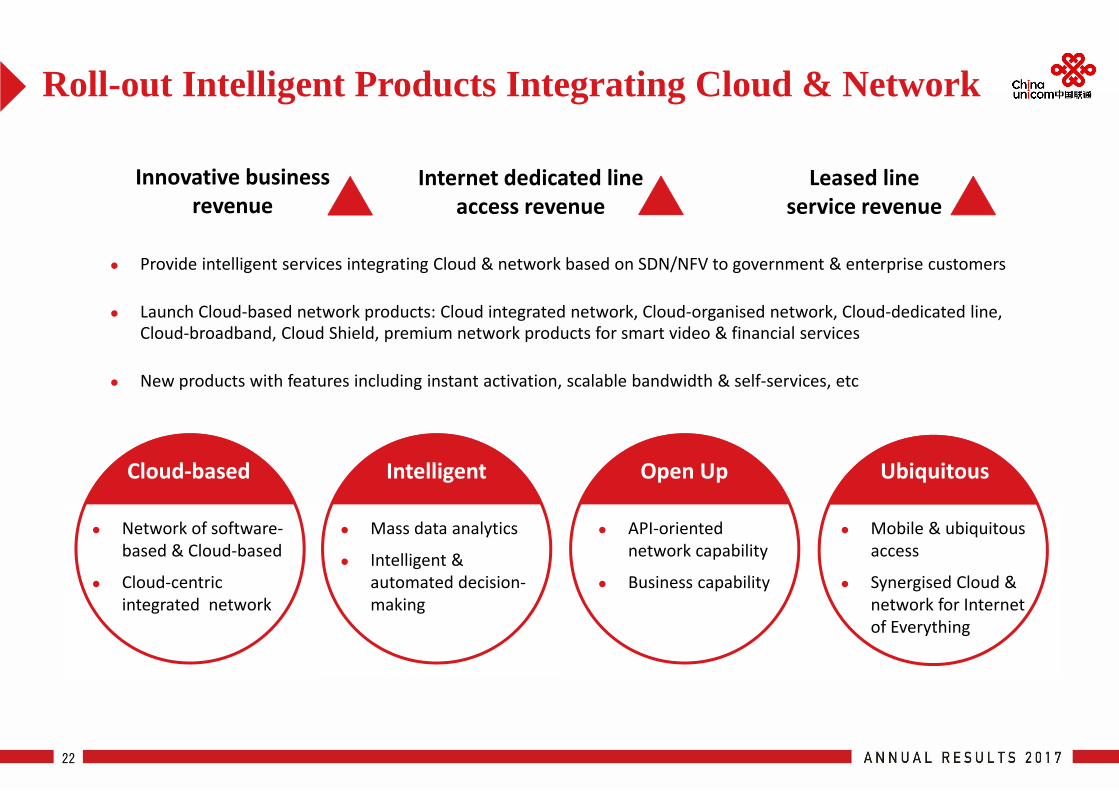
Roll-out Intelligent Products Integrating Cloud & Network
22
Innovative business revenue Internet dedicated line
access revenue Leased line service revenue
Provide intelligent services integrating Cloud & network based on SDN/NFV to government & enterprise customers
Launch Cloud‐based network products: Cloud integrated network, Cloud‐organised network, Cloud‐dedicated line, Cloud‐broadband, Cloud Shield, premium network products for smart video & financial services
New products with features including instant activation, scalable bandwidth & self‐services, etc
Network of software‐based & Cloud‐based
Cloud‐centric integrated network
Cloud‐based
Mass data analytics
Intelligent & automated decision‐making
Intelligent
API‐oriented network capability
Business capability
Open Up
Mobile & ubiquitous access
Synergised Cloud & network for Internet of Everything
Ubiquitous
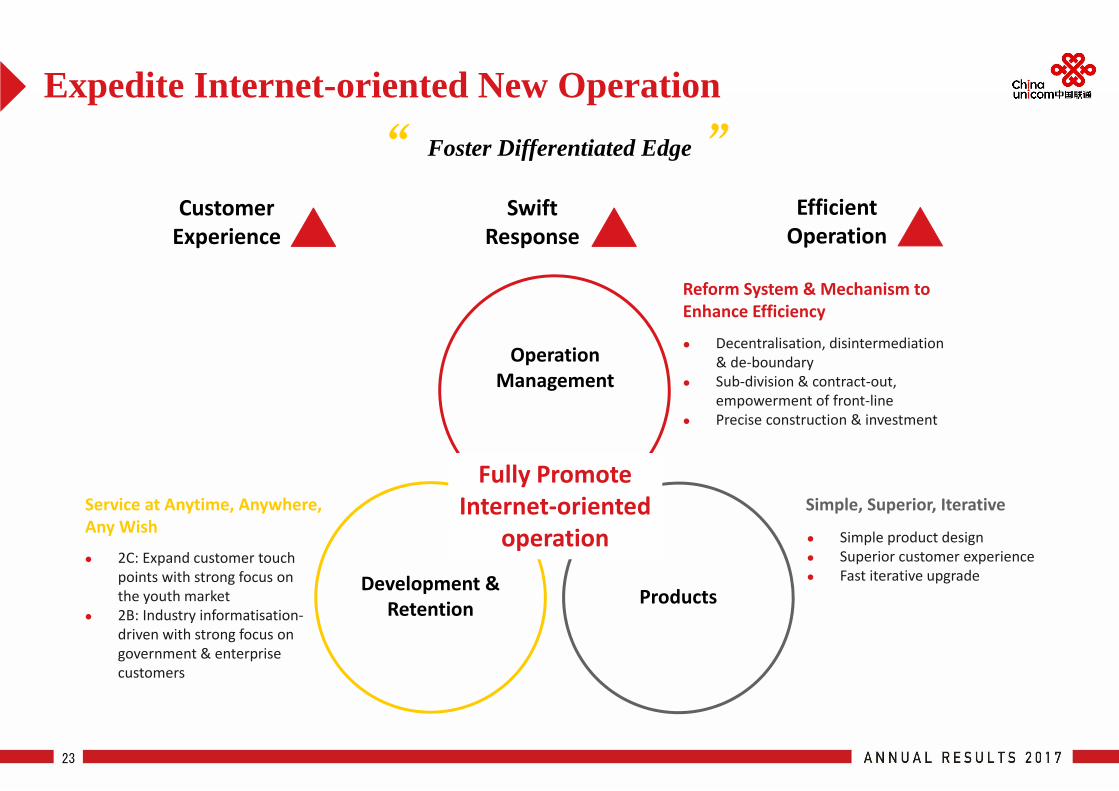
Expedite Internet-oriented New Operation
23
Foster Differentiated Edge
Operation Management
Service at Anytime, Anywhere, Any Wish
Development & Retention Products
2C: Expand customer touch points with strong focus on the youth market
2B: Industry informatisation‐driven with strong focus on government & enterprise customers
Fully Promote Internet‐oriented
operation
Reform System & Mechanism to Enhance Efficiency
Decentralisation, disintermediation & de‐boundary
Sub‐division & contract‐out, empowerment of front‐line
Precise construction & investment
Simple, Superior, Iterative
Simple product design Superior customer experience Fast iterative upgrade
“ ”Swift
ResponseEfficient Operation
Customer Experience
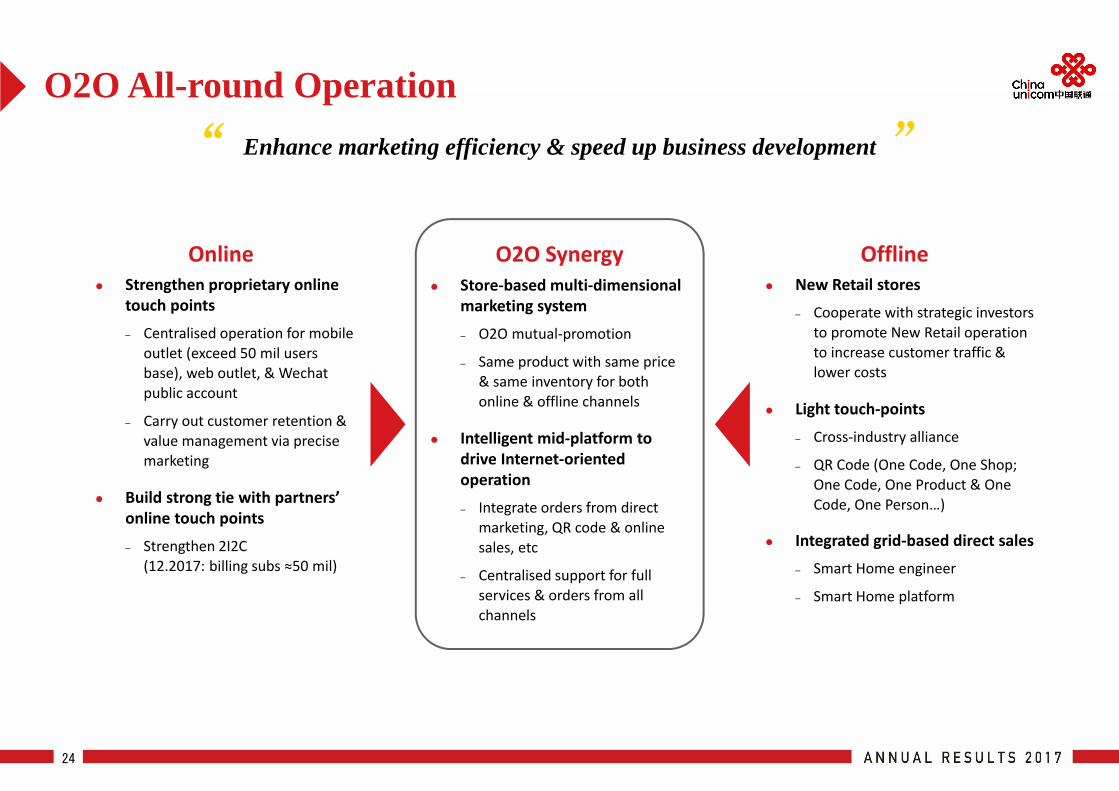
O2O All-round Operation
24
Enhance marketing efficiency & speed up business development
Online O2O Synergy Offline Strengthen proprietary online
touch points
─ Centralised operation for mobile outlet (exceed 50 mil users base), web outlet, & Wechatpublic account
─ Carry out customer retention & value management via precise marketing
Build strong tie with partners’ online touch points
─ Strengthen 2I2C (12.2017: billing subs ≈50 mil)
Store‐based multi‐dimensional marketing system
─ O2O mutual‐promotion
─ Same product with same price & same inventory for both online & offline channels
Intelligent mid‐platform to drive Internet‐oriented operation
─ Integrate orders from direct marketing, QR code & online sales, etc
─ Centralised support for full services & orders from all channels
New Retail stores
─ Cooperate with strategic investors to promote New Retail operation to increase customer traffic & lower costs
Light touch‐points
─ Cross‐industry alliance
─ QR Code (One Code, One Shop; One Code, One Product & One Code, One Person…)
Integrated grid‐based direct sales
─ Smart Home engineer
─ Smart Home platform
“ ”
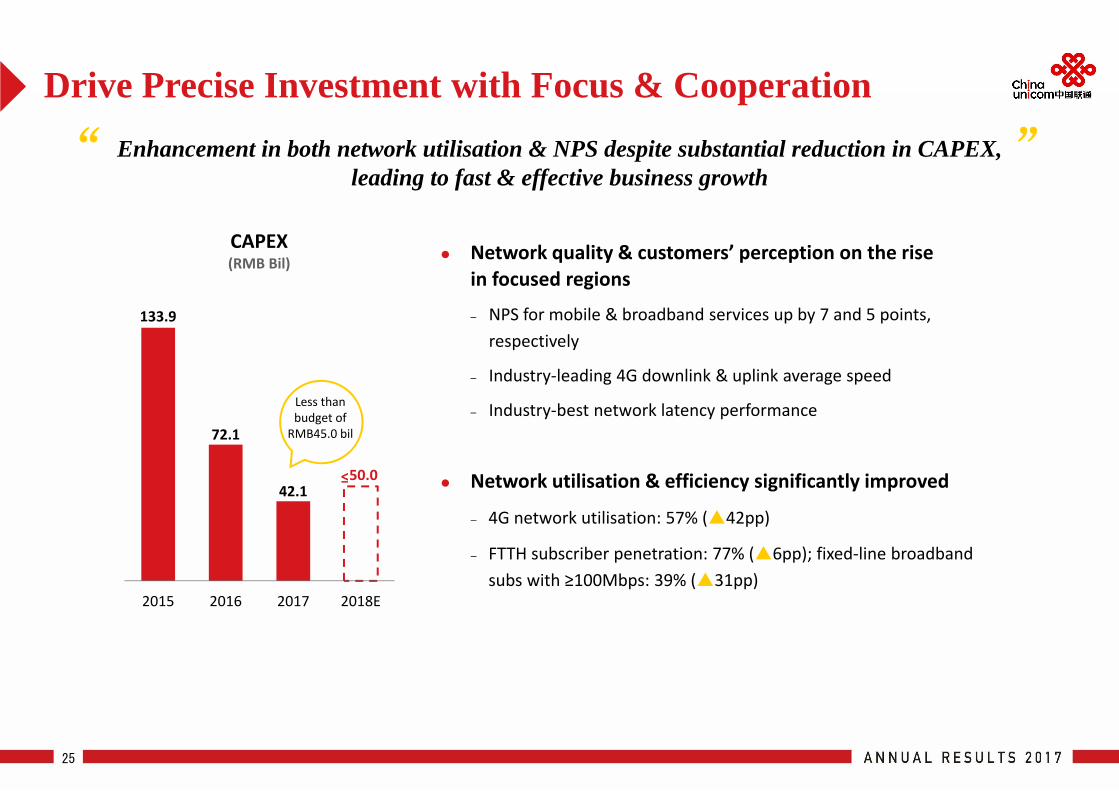
Network quality & customers’ perception on the rise in focused regions
─ NPS for mobile & broadband services up by 7 and 5 points, respectively
─ Industry‐leading 4G downlink & uplink average speed
─ Industry‐best network latency performance
Network utilisation & efficiency significantly improved
─ 4G network utilisation: 57% (42pp)
─ FTTH subscriber penetration: 77% (6pp); fixed‐line broadband subs with ≥100Mbps: 39% (31pp)
133.9
72.1
42.1 50.0
2015 2016 2017 2018E
Drive Precise Investment with Focus & Cooperation
25
CAPEX(RMB Bil)
≤
Enhancement in both network utilisation & NPS despite substantial reduction in CAPEX, leading to fast & effective business growth
Less than budget of RMB45.0 bil
“ ”
Priorities in 2018
26
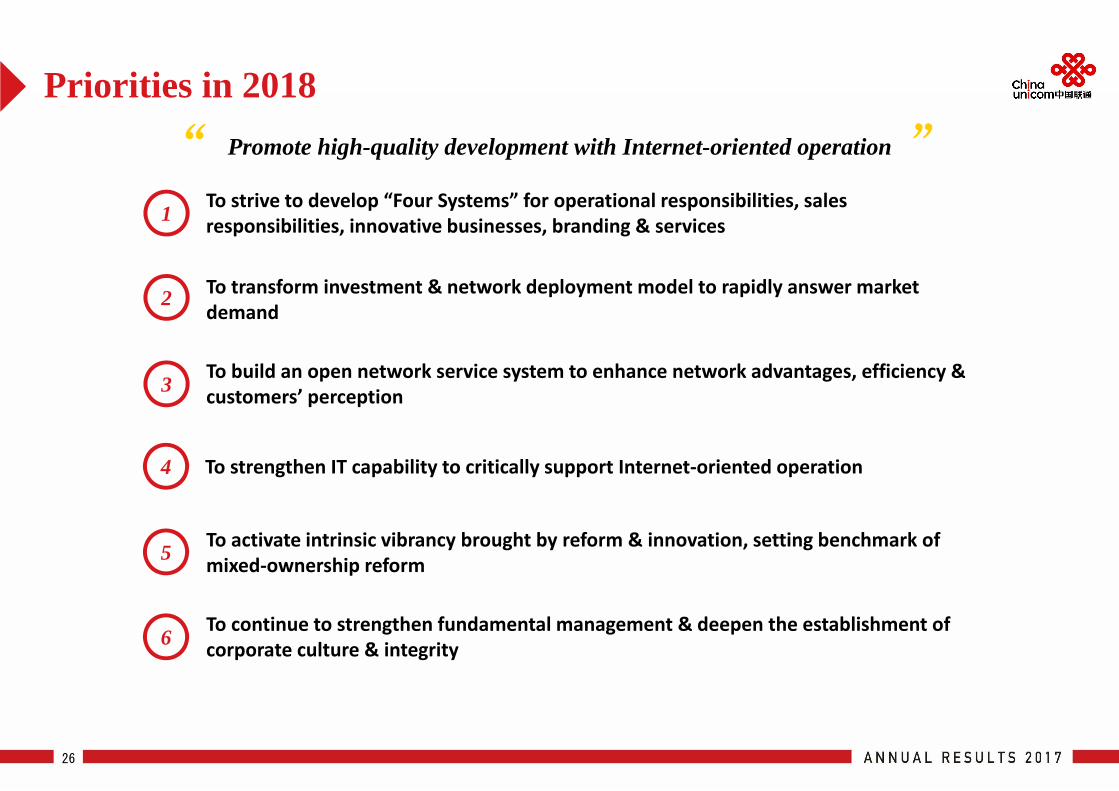
Promote high-quality development with Internet-oriented operation “ ”To strive to develop “Four Systems” for operational responsibilities, sales responsibilities, innovative businesses, branding & services
To transform investment & network deployment model to rapidly answer market demand
To build an open network service system to enhance network advantages, efficiency & customers’ perception
To strengthen IT capability to critically support Internet‐oriented operation
To activate intrinsic vibrancy brought by reform & innovation, setting benchmark of mixed‐ownership reform
To continue to strengthen fundamental management & deepen the establishment of corporate culture & integrity
1
2
3
4
5
6
Agenda
27
FINANCIALPERFORMANCE
OPERATING PERFORMANCE
OVERALL RESULTS
Key Financial Information
28
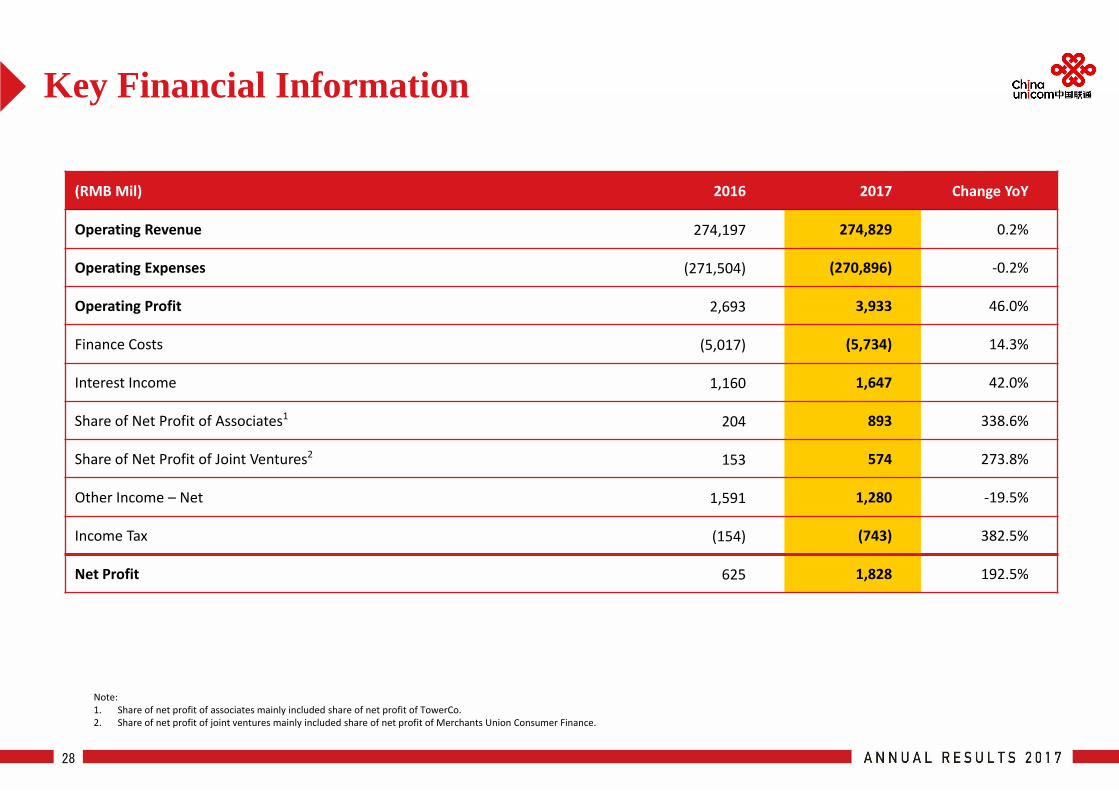
(RMB Mil) 2016 2017 Change YoY
Operating Revenue 274,197 274,829 0.2%
Operating Expenses (271,504) (270,896) ‐0.2%
Operating Profit 2,693 3,933 46.0%
Finance Costs (5,017) (5,734) 14.3%
Interest Income 1,160 1,647 42.0%
Share of Net Profit of Associates1 204 893 338.6%
Share of Net Profit of Joint Ventures2 153 574 273.8%
Other Income – Net 1,591 1,280 ‐19.5%
Income Tax (154) (743) 382.5%
Net Profit 625 1,828 192.5%
Note: 1. Share of net profit of associates mainly included share of net profit of TowerCo.2. Share of net profit of joint ventures mainly included share of net profit of Merchants Union Consumer Finance.
Cost Control
29
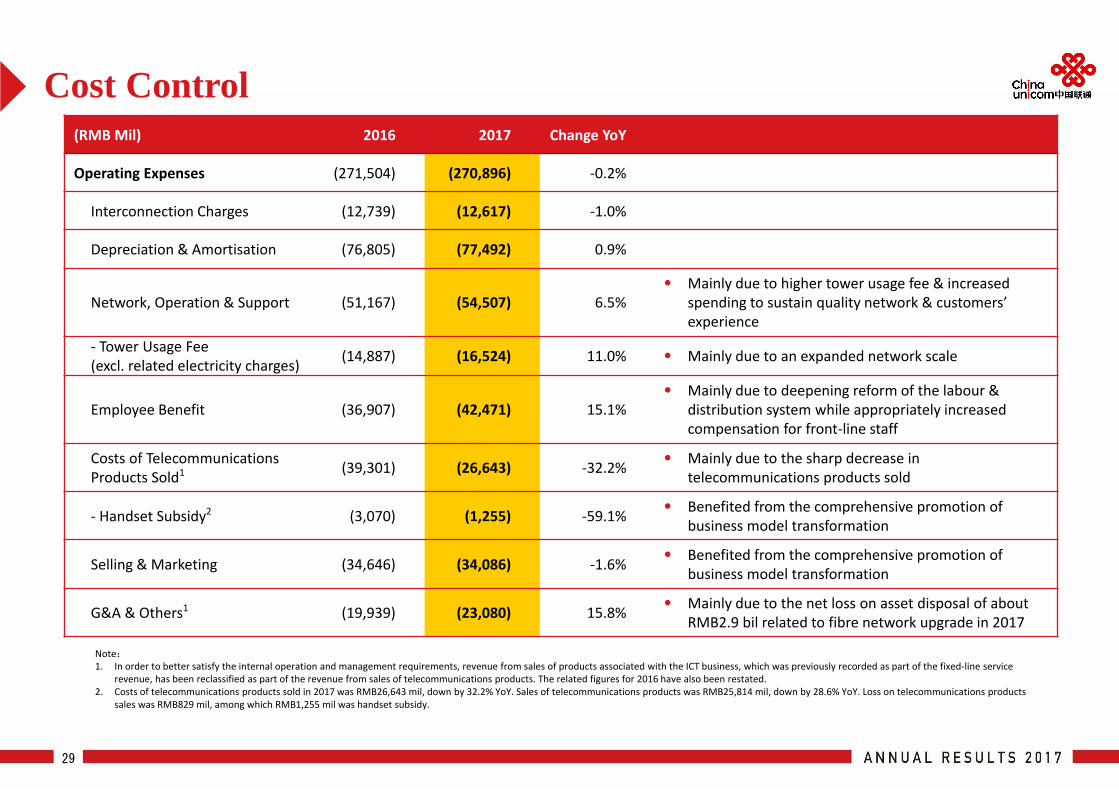
(RMB Mil) 2016 2017 Change YoY
Operating Expenses (271,504) (270,896) ‐0.2%
Interconnection Charges (12,739) (12,617) ‐1.0%
Depreciation & Amortisation (76,805) (77,492) 0.9%
Network, Operation & Support (51,167) (54,507) 6.5% Mainly due to higher tower usage fee & increased
spending to sustain quality network & customers’ experience
‐ Tower Usage Fee(excl. related electricity charges) (14,887) (16,524) 11.0% Mainly due to an expanded network scale
Employee Benefit (36,907) (42,471) 15.1% Mainly due to deepening reform of the labour &
distribution system while appropriately increasedcompensation for front‐line staff
Costs of Telecommunications Products Sold1 (39,301) (26,643) ‐32.2%
Mainly due to the sharp decrease in telecommunications products sold
‐ Handset Subsidy2 (3,070) (1,255) ‐59.1% Benefited from the comprehensive promotion of
business model transformation
Selling & Marketing (34,646) (34,086) ‐1.6% Benefited from the comprehensive promotion of
business model transformation
G&A & Others1 (19,939) (23,080) 15.8% Mainly due to the net loss on asset disposal of about
RMB2.9 bil related to fibre network upgrade in 2017
Note:1. In order to better satisfy the internal operation and management requirements, revenue from sales of products associated with the ICT business, which was previously recorded as part of the fixed‐line service
revenue, has been reclassified as part of the revenue from sales of telecommunications products. The related figures for 2016 have also been restated.2. Costs of telecommunications products sold in 2017 was RMB26,643 mil, down by 32.2% YoY. Sales of telecommunications products was RMB25,814 mil, down by 28.6% YoY. Loss on telecommunications products
sales was RMB829 mil, among which RMB1,255 mil was handset subsidy.
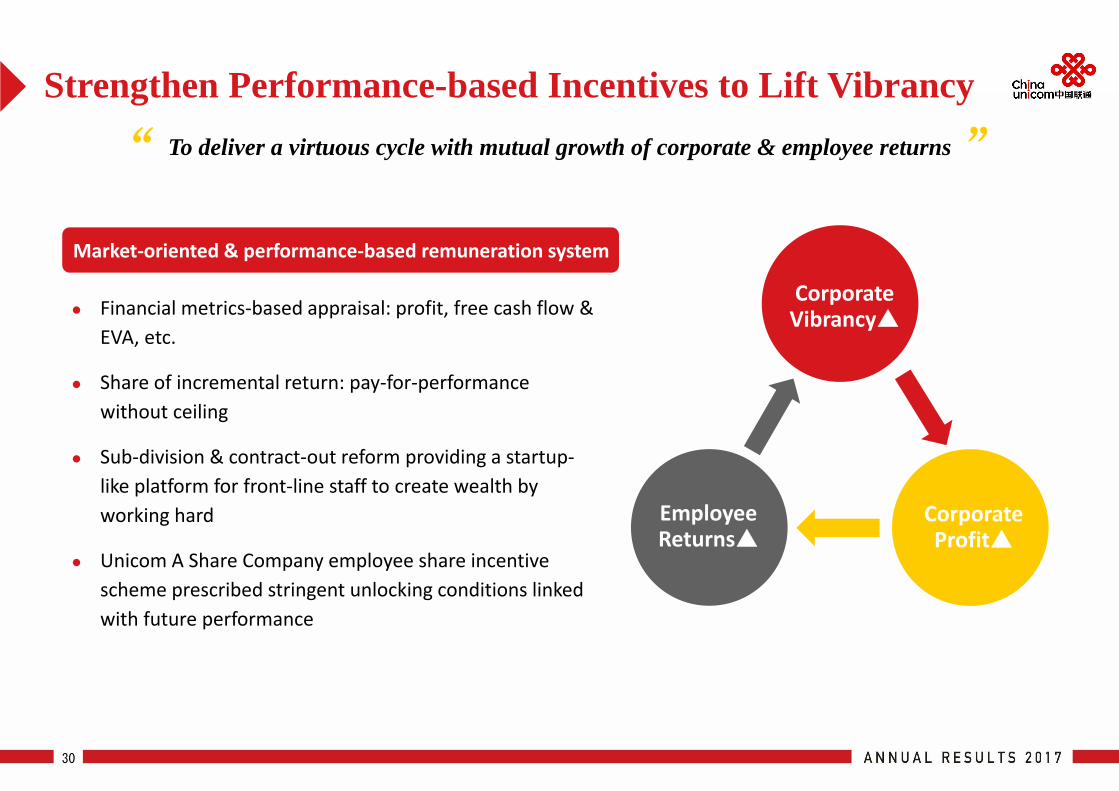
Strengthen Performance-based Incentives to Lift Vibrancy
30
To deliver a virtuous cycle with mutual growth of corporate & employee returns
Financial metrics‐based appraisal: profit, free cash flow & EVA, etc.
Share of incremental return: pay‐for‐performance without ceiling
Sub‐division & contract‐out reform providing a startup‐like platform for front‐line staff to create wealth by working hard
Unicom A Share Company employee share incentive scheme prescribed stringent unlocking conditions linked with future performance
Market‐oriented & performance‐based remuneration system
“ ”
CorporateVibrancy
CorporateProfit
EmployeeReturns
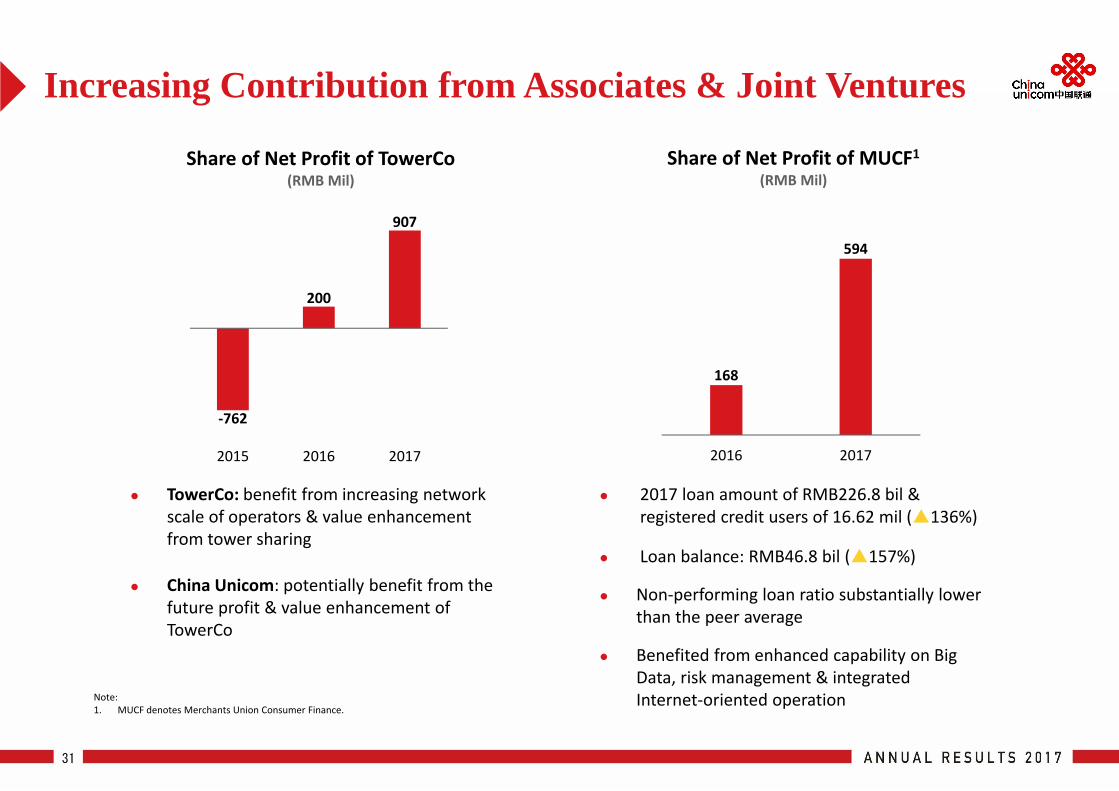
Increasing Contribution from Associates & Joint Ventures
31
‐762
200
907
2015 2016 2017
Share of Net Profit of TowerCo(RMB Mil)
TowerCo: benefit from increasing network scale of operators & value enhancement from tower sharing
China Unicom: potentially benefit from the future profit & value enhancement of TowerCo
168
594
2016 2017
Share of Net Profit of MUCF1(RMB Mil)
2017 loan amount of RMB226.8 bil & registered credit users of 16.62 mil (136%)
Loan balance: RMB46.8 bil (157%)
Non‐performing loan ratio substantially lower than the peer average
Benefited from enhanced capability on Big Data, risk management & integrated Internet‐oriented operationNote:
1. MUCF denotes Merchants Union Consumer Finance.
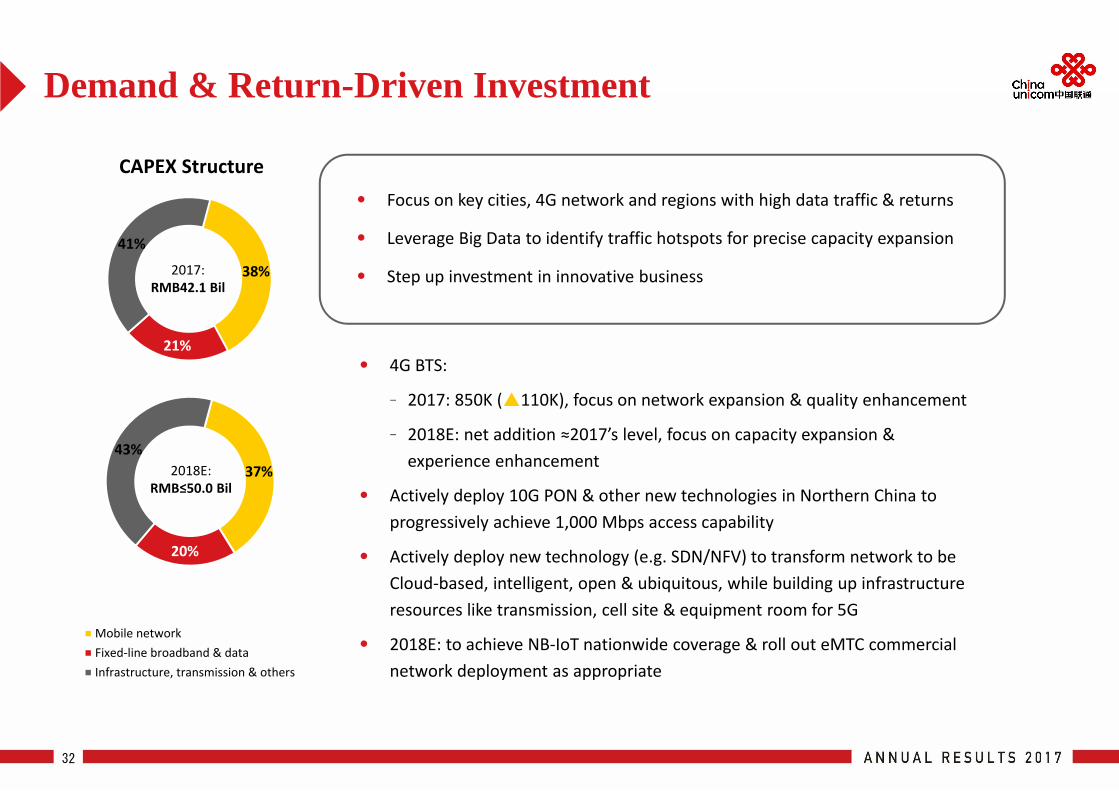
4G BTS:
─ 2017: 850K (110K), focus on network expansion & quality enhancement
─ 2018E: net addition ≈2017’s level, focus on capacity expansion & experience enhancement
Actively deploy 10G PON & other new technologies in Northern China to progressively achieve 1,000 Mbps access capability
Actively deploy new technology (e.g. SDN/NFV) to transform network to be Cloud‐based, intelligent, open & ubiquitous, while building up infrastructureresources like transmission, cell site & equipment room for 5G
2018E: to achieve NB‐IoT nationwide coverage & roll out eMTC commercial network deployment as appropriate
Demand & Return-Driven Investment
32
Focus on key cities, 4G network and regions with high data traffic & returns
Leverage Big Data to identify traffic hotspots for precise capacity expansion
Step up investment in innovative business38%
21%
41%
2017:RMB42.1 Bil
37%
20%
43%
Mobile networkFixed‐line broadband & dataInfrastructure, transmission & others
2018E:RMB≤50.0 Bil
CAPEX Structure
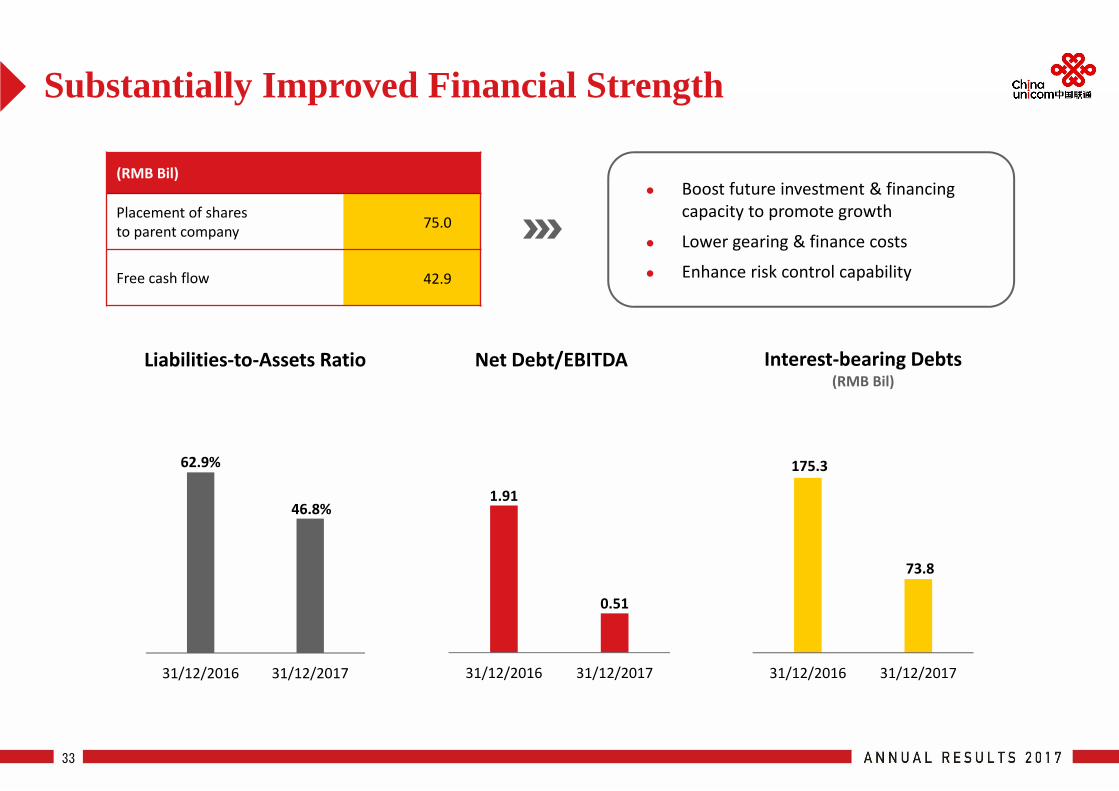
Substantially Improved Financial Strength
33
(RMB Bil)
Placement of shares to parent company 75.0
Free cash flow 42.9
1.91
0.51
31/12/2016 31/12/2017
62.9%
46.8%
31/12/2016 31/12/2017
175.3
73.8
31/12/2016 31/12/2017
Interest‐bearing Debts(RMB Bil)
Net Debt/EBITDALiabilities‐to‐Assets Ratio
Boost future investment & financing capacity to promote growth
Lower gearing & finance costs
Enhance risk control capability
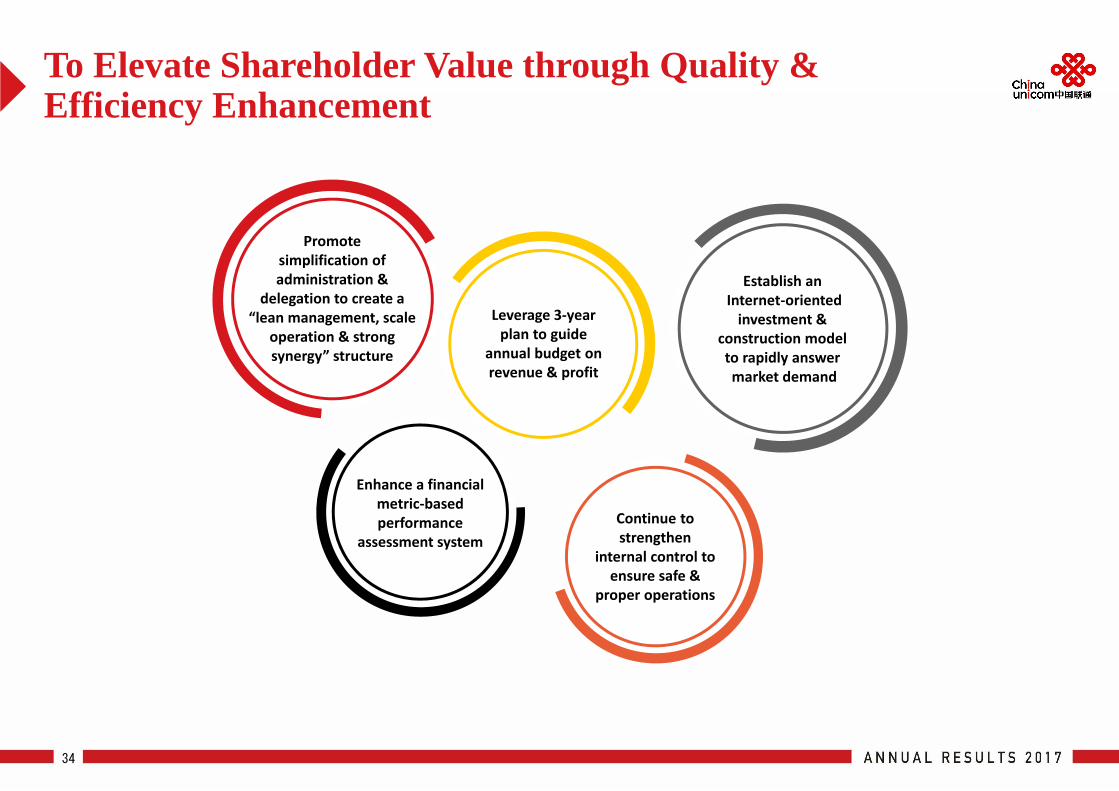
To Elevate Shareholder Value through Quality & Efficiency Enhancement
34
Enhance a financial metric‐based performance
assessment system
Leverage 3‐year plan to guide
annual budget on revenue & profit
Establish anInternet‐oriented investment &
construction model to rapidly answermarket demand
Continue to strengthen
internal control to ensure safe &
proper operations
Promote simplification of administration &
delegation to create a “lean management, scale
operation & strong synergy” structure

Thank You!
35
Asia’s Best Management Team
Asia's No.1 Most Honored
Telecom Company
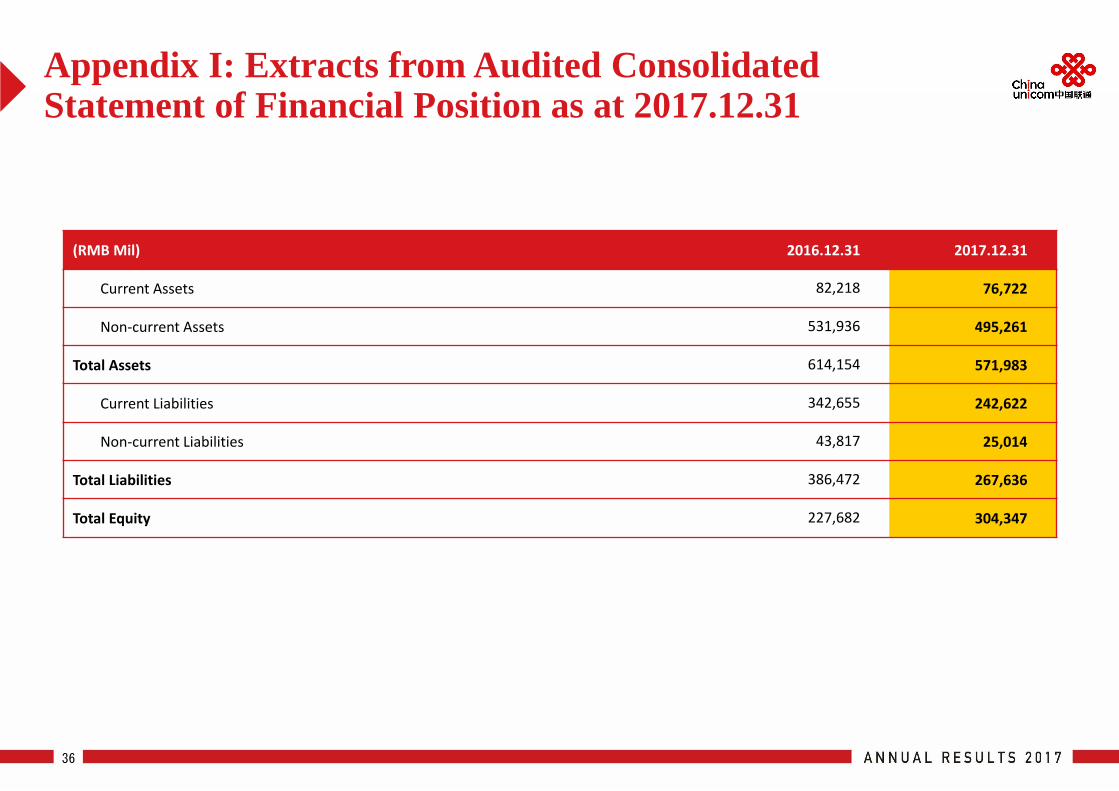
Appendix I: Extracts from Audited Consolidated Statement of Financial Position as at 2017.12.31
36
(RMB Mil) 2016.12.31 2017.12.31
Current Assets 82,218 76,722
Non‐current Assets 531,936 495,261
Total Assets 614,154 571,983
Current Liabilities 342,655 242,622
Non‐current Liabilities 43,817 25,014
Total Liabilities 386,472 267,636
Total Equity 227,682 304,347
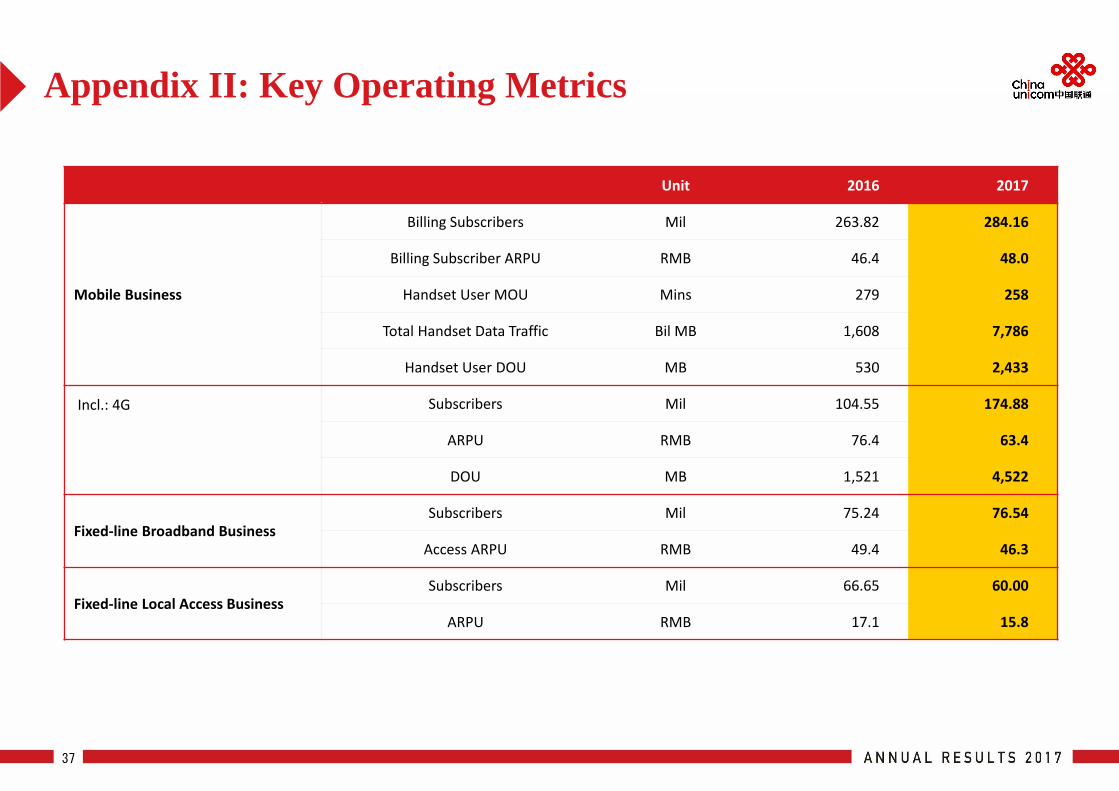
Appendix II: Key Operating Metrics
37
Unit 2016 2017
Mobile Business
Billing Subscribers Mil 263.82 284.16
Billing Subscriber ARPU RMB 46.4 48.0
Handset User MOU Mins 279 258
Total Handset Data Traffic Bil MB 1,608 7,786
Handset User DOU MB 530 2,433
Incl.: 4G Subscribers Mil 104.55 174.88
ARPU RMB 76.4 63.4
DOU MB 1,521 4,522
Fixed‐line Broadband BusinessSubscribers Mil 75.24 76.54
Access ARPU RMB 49.4 46.3
Fixed‐line Local Access BusinessSubscribers Mil 66.65 60.00
ARPU RMB 17.1 15.8
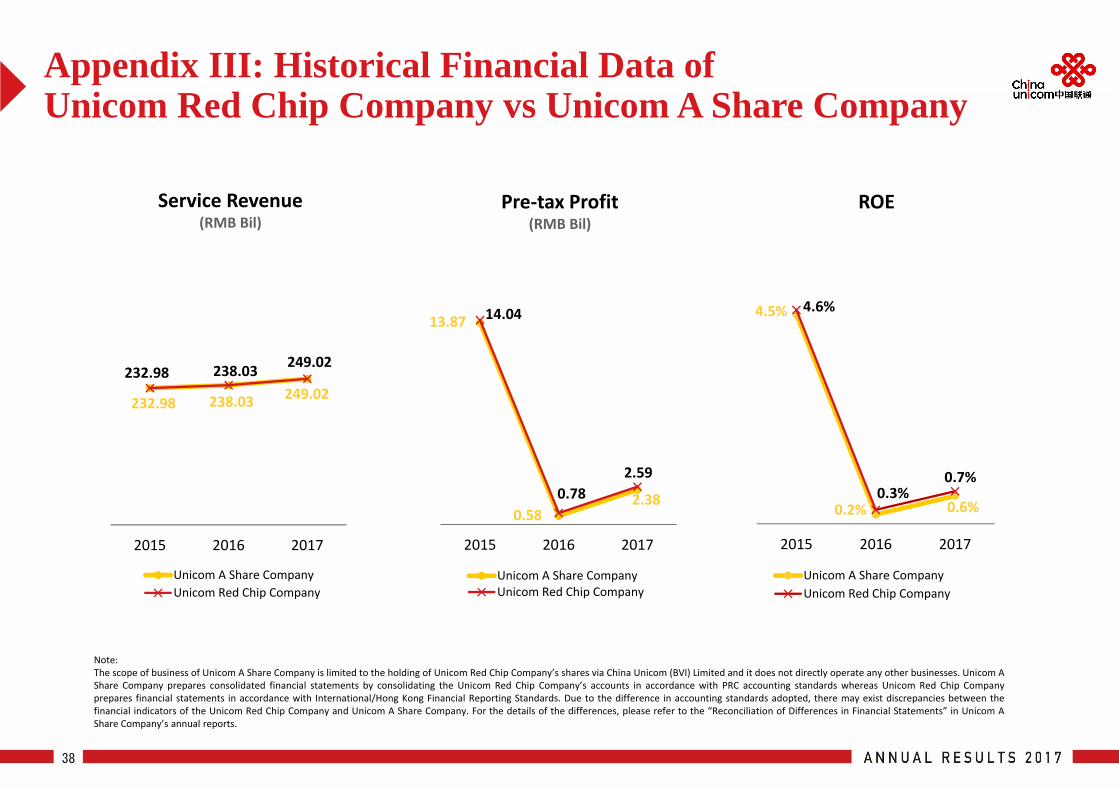
Appendix III: Historical Financial Data of Unicom Red Chip Company vs Unicom A Share Company
38
13.87
0.582.38
14.04
0.782.59
2015 2016 2017
Unicom A Share CompanyUnicom Red Chip Company
4.5%
0.2% 0.6%
4.6%
0.3%0.7%
2015 2016 2017
Unicom A Share CompanyUnicom Red Chip Company
Note:The scope of business of Unicom A Share Company is limited to the holding of Unicom Red Chip Company’s shares via China Unicom (BVI) Limited and it does not directly operate any other businesses. Unicom AShare Company prepares consolidated financial statements by consolidating the Unicom Red Chip Company’s accounts in accordance with PRC accounting standards whereas Unicom Red Chip Companyprepares financial statements in accordance with International/Hong Kong Financial Reporting Standards. Due to the difference in accounting standards adopted, there may exist discrepancies between thefinancial indicators of the Unicom Red Chip Company and Unicom A Share Company. For the details of the differences, please refer to the “Reconciliation of Differences in Financial Statements” in Unicom AShare Company’s annual reports.
232.98 238.03 249.02
232.98 238.03 249.02
2015 2016 2017
Unicom A Share CompanyUnicom Red Chip Company
Pre‐tax Profit(RMB Bil)
ROEService Revenue(RMB Bil)
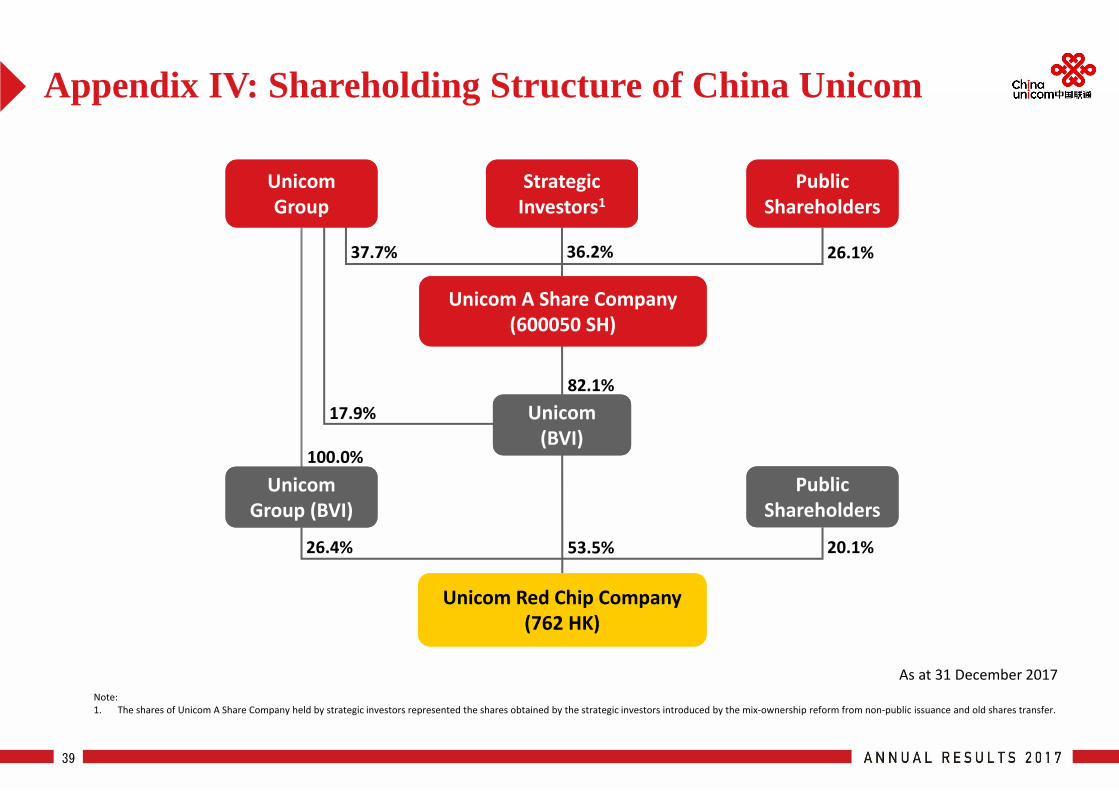
Appendix IV: Shareholding Structure of China Unicom
39
As at 31 December 2017
37.7% 36.2% 26.1%
UnicomGroupUnicomGroup
Strategic Investors1Strategic Investors1
Public Shareholders
Public Shareholders
Unicom Red Chip Company(762 HK)
Unicom Red Chip Company(762 HK)
Unicom (BVI)
Unicom (BVI)
Unicom Group (BVI)Unicom
Group (BVI)Public
ShareholdersPublic
Shareholders
17.9%
100.0%
82.1%
20.1%53.5%26.4%
Unicom A Share Company (600050 SH)
Unicom A Share Company (600050 SH)
Note: 1. The shares of Unicom A Share Company held by strategic investors represented the shares obtained by the strategic investors introduced by the mix‐ownership reform from non‐public issuance and old shares transfer.