Embed Size (px)
Citation preview
PPPs and Project Overruns: Evidence fromRoad Projects in India
Thillai A. Rajan1; Govind Gopinath2; and Monalisa Behera3
Abstract: Construction cost overrun and time overrun are significant problems in infrastructure projects. This study provides acomparative analysis of the incidence of project overruns in Public Private Partnership (PPP) and non-PPP road projects. Datafrom national road projects in India was used as the study sample. Means analysis, both using an unmatched sample andmatched pair analysis indicated significant overruns between PPP and non-PPP projects. While cost overruns were higher in PPP proj-ects, time overruns were higher in non-PPP projects. These trends persisted in OLS regression estimates. A three stage least squaresregression estimated to address the simultaneity bias also showed that use of PPP increased cost overrun, though it did not affect timeoverrun. Results obtained in this study are contrary to the findings of the previous studies, which have been based on PPP projects indeveloped economies. The findings emphasize the need for developing countries like India to strengthen their capabilities in PPP modelsto take advantage of private sector efficiencies. DOI: 10.1061/(ASCE)CO.1943-7862.0000797. © 2013 American Society of CivilEngineers.
Author keywords: Public Private Partnership; Road projects; Cost overruns; Time overruns; India; Cost and schedule.
Introduction
There has been a steady increase in the level of Public PrivatePartnership (PPP) in infrastructure projects over the years,particularly in the case of developing countries. Faced with theneed to constrain deficit, governments have been liberalizing theinfrastructure sector for PPP. For example in the 12th five yearplan period (2012-17), the investment requirement in India was es-timated at about $1 trillion, and more than 50% of the expectedinvestment is expected to come from the private sector.
Infrastructure projects are more often than not, plagued bysubstantial cost and time overruns. Given the common occurrenceof project overruns, there have been many research papers on thistopic. What is different about this paper is to analyze, usingempirical evidence, the impact of using PPP on project overruns.Previous studies that looked at the link between PPP and projectoverruns have been limited, and the analysis was based on a limitednumber of projects. An unique aspect of this study is a reasonablylarge sample set of projects, and the use of rigorous econometrictechniques in the analysis. The sample for this study consisted ofcentral sector road projects in India.
Given the perceived efficiency of the private sector, the hypoth-esis was that incidence of project overruns would be lesser in PPPprojects as compared to non-PPP projects. Moreover, the overrunsshould show a decreasing trend over time with the advancements in
engineering, construction technology, and project management.However, our results indicated that cost overruns were higher inPPP’s as compared to that of non-PPP projects, whereas therewas no impact on time overrun as a result of using PPP. In ourdataset, we found that nearly 69 per cent and 89 per cent of theprojects experienced cost overruns and time overruns respectively.It was seen that 88.1 per cent of PPPs had cost overruns ascompared with 54.37 per cent in non-PPP projects. However, onan average, higher proportion of non-PPP projects had time over-runs (92.23 per cent) as compared with PPPs (80.95 per cent). Theaverage percentage cost overrun in a PPP was close to three timesthat of what was observed in a non-PPP project. These numbersachieve even more significance if we consider that the averageproject size of a PPP (Rs 382.46 crore, $76.49 million) is about50 per cent more than that of a non-PPP project (Rs 253.89 crore,$50.78 million).
Literature Review
Time and cost form important parameters in construction andimprovements in one may often result in trade-offs in the other.Given the common occurrence of cost and time overruns in con-struction and infrastructure projects (Flyvberg et al. 2003a, b), therehave been several studies on this topic. Dey et al. (1994) indicatedthat changes in the construction environment are the primary bar-riers to project completion resulting in cost and time trade-offs.Arditi et al. (1985) showed a clear connection between delaysand cost overrun. The results suggested that mistakes in the initialestimates of cost and time often manifest as overruns.
Several studies have sought to estimate the factors that lead toproject overruns in construction projects. For instance, Hinze et al.(1992) analyzed cost overruns associated with WashingtonState highway projects and found that the cost overruns, ex-pressed as a percentage of the contract amount, increased withproject size. Flyvbjerg et al. (2004), in road infrastructure projects,found that cost escalation was strongly influenced by the imple-mentation phase length and project type, and suggested that
1Associate Professor, Dept. of Management Studies, Indian Institute ofTechnology-Madras, Chennai, Tamilnadu 600036, India (correspondingauthor). Email: [email protected]
2Graduate student, Dept. of Civil Engineering, Indian Institute ofTechnology-Madras, Chennai, Tamilnadu 600036, India.
3Research Associate, Dept. of Management Studies, Indian Institute ofTechnology-Madras, Chennai, Tamilnadu 600036, India.
Note. This manuscript was submitted on March 6, 2013; approved onSeptember 17, 2013; published online on December 31, 2013. Discussionperiod open until May 31, 2014; separate discussions must be submittedfor individual papers. This paper is part of the Journal of ConstructionEngineering and Management, © ASCE, ISSN 0733-9364/04013070(10)/$25.00.
© ASCE 04013070-1 J. Constr. Eng. Manage.
J. Constr. Eng. Manage. 2014.140.
Dow
nloa
ded
from
asc
elib
rary
.org
by
Uni
vers
ity o
f W
ater
loo
on 0
6/18
/14.
Cop
yrig
ht A
SCE
. For
per
sona
l use
onl
y; a
ll ri
ghts
res
erve
d.
decision makers and planners should be duly concerned aboutlong implementation phases. Sambasivan and Soon (2006) ana-lyzed the causes and effects of delay in Malaysian constructionprojects, and identified 10 most important causes from a list of28 different causes, using empirical techniques. Vijaymohananand Kannan (2003) estimated the causes behind cost overrunsin power projects in Kerala through a questionnaire approach.Using data from Norwegian projects, Odeck (2004) indicated thatcost overruns were predominant in smaller projects as compared tolarger ones.
Singh (2010) used empirical correlation models and mappedcorresponding causes of overruns to their effects in infrastructureprojects. The research involved data of over 800 projects, in variousdomains such as power, roads and water projects. However, thefindings were very broad-based given the different sectors to whichthe projects belonged and thus reduced the specificity associatedwith the recommendations. Moreover, the study did not appropri-ately account for the endogeneity among the study variables. Interms of methodology, a variety of methods have been used to studythe issue of project overruns. Singh (2010) used OLS estimates.Attalla and Hegazy (2003) used artificial neural networks and re-gression in predicting cost deviation in reconstruction projects.Shaheen et al. (2007) used neuro-fuzzy models in analyzing thecauses of overruns.
In recent years, infrastructure projects in developing countriesare increasingly being developed as PPP model as compared tothe traditional public procurement. In the PPP format, the privatesector assumes a significant share of the project risks as comparedthat of the traditional public sector procurement. Apart fromaccessing private capital for project development, it is felt thatprivate sector involvement can reduce the inefficiencies seen inthe traditional procurement, such as project overruns. While therehave been many studies that have compared traditional procure-ment and PPP on project costs and time (for example, Blanc-Brudeet al. 2009), on the whole, there have been very few studies on theimpact of PPP on project overruns. This study is an attempt toaddress that gap. Summary of the studies that addressed this topicis given below.
In a perception based study of different project stakeholders,Hampton et al (2012) made a comparison between the traditionalpublic sector procurement and PPP models on time overruns. Itwas perceived that there was greater “delay potential” undertraditional vis-à-vis PPP procured projects. The respondentspreferred PPP for achieving best “time performance”. Basedon a study of 12 large PPP highway projects in North Americaand benchmarking with the findings of previous studies, Chaseyet al. (2012) found that PPP projects had significantly lower costand time overruns. A study by Iacobacci (2010) based on 19 PPPprojects that were completed substantially indicated that theseprojects had a high degree of cost and time certainty (i.e., loweroverruns) as compared to traditional procurement. Grimsey andLewis (2007) in their article cite several studies done on UK proj-ects, which showed that PPP projects had significantly lowercost and time overruns as compared to public projects. Evidenceof superior performance of PPP projects in terms of overrunswas also found by Bain (2007) and Infrastructure PartnershipsAustralia (2007).
Methodology
The main variables of interest for this study are the cost andtime overrun. The cost overrun was defined as the differencebetween the actual costs incurred for completing the
project and the initial project cost estimate. It was calculatedas follows:
Cost overrun
¼ Actual expenditure incurred − Initial project cost estimate
ð1ÞThe time overrun variable was defined as the difference between
the estimated project duration and the actual time taken to completethe project. It was calculated as follows:
Net duration
¼ Date of project commencement − Date of project approval
ð2Þ
Time overrun ¼ Net duration−Project duration ð3ÞDepending the actual cost and time taken vis a vis the estimates,
the overrun can be positive, negative, or nil. The overruns havebeen analyzed using comparison of means, OLS regression and3SLS regression.
Comparison of Means
The first level of analysis involved a means comparison of costand time overruns between the PPP and non-PPP projects. Sincethe data did not exhibit any particular form of distribution, thenon parametric Wilcoxon rank-sum technique was used forcomparing the means. It was seen that the dataset was highlyimbalanced because of difference in terms of sample size andvariable values of other project characteristics. Therefore, to in-crease the accuracy of the means comparison we used a matchingtechnique. We matched the PPP and Non-PPP projects data basedon parameters like road length, number of lanes and projectduration. The method of Coarsened Exact Matching (CEM) usingstata software, as suggested by Blackwell et al. (2009) was usedfor matching PPP and Non-PPP projects. CEM was used to matchboth exact values and values that were closely related. After thematching, the means were compared for PPP and Non-PPPprojects using Wilcoxon rank-sum (Mann-Whitney) mean com-parison test.
OLS Regression
An OLS regression model was estimated to see the impact ofexplanatory variables, on the dependent variables, viz., costoverrun and time overrun. Equation (4) and (5) gives the estimationused for calculating cost overrun and time overrun.
Costoverrun ¼ αc0 þ αc1timeoverrunþ αc2RoadLength
þ αc3D Lanesþ αc4ProjectDuration
þ αc5D Terrainþ αc6D Consultant
þ αc7CostKmLaneþ αc8Contractor
þ αc9Estimateþ αc10D Multilateral Banks
þ αc11D PPPþ αc12D Land Use
þ αc13D Categoryþ αc14D Multi State
þ αc15TimeLapseþ αc16PerCapitaStateGDP
þ αc17PropertyRightsIndexþ εi ð4Þ
© ASCE 04013070-2 J. Constr. Eng. Manage.
J. Constr. Eng. Manage. 2014.140.
Dow
nloa
ded
from
asc
elib
rary
.org
by
Uni
vers
ity o
f W
ater
loo
on 0
6/18
/14.
Cop
yrig
ht A
SCE
. For
per
sona
l use
onl
y; a
ll ri
ghts
res
erve
d.
Timeoverrun ¼ αt0 þ αt1costoverrunþ αt2RoadLength
þ αt3D Lanesþ αt4ProjectDuration
þ αt5D Terrainþ αt6D Consultant
þ αt7Contractor þ αt8Estimate
þ αt9D Multilateral Banksþ αt10D PPP
þ αt11D Land Useþ αt12D Category
þ αt13D Multi Stateþ αt14TimeLapse
þ αt15PerCapitaStateGDP
þ αt16PropertyRightsIndex
þ αt17InfraIndex þ υi ð5Þ
where αc0 and αt0 are constant terms; α’s are vectors of estimableparameters; εi’s and vi’s are disturbance or error terms thatcapture unobserved effects
The model comprised variables that were commonly used inliterature (see for example Singh 2010). Conceptually, the variableswere divided into three categories—project technical variables,economic variables, and state specific context variables. A totalof 17 independent variables were used in the estimation models.Description of these variables is given below. Data sources forthe different variables are given in Table 1.
Project Technical VariablesThese variables pertain to the technical and engineering features ofthe project. The variables were classified under this category are asfollows:1. Road Length, RoadLength: The length of road is an indicator
of the size of the project. Greater the road length, greater is therequirement for resources and pre-construction planning.Increased road length increases the requirement for more landand heightens the land acquisition process. The naturalexpectation in this case, is increased overrun with increasedlength.
2. Number of Lanes, D_Lanes (dummy): The projects in thedataset are either 4 or 6 laning projects, i.e., it is either a 2-lane to 4-lane project or a 4-lane to 6-lane project. A 6-laneproject will involve lateral land acquisition on the 4-lane road,which is better developed than a 2-lane road, thereby hikingland prices and at the same time facilitating a time-consuminglitigation process. So, greater the number of lanes, greateroverrun is expected. There were a total of 135 4-laningprojects and 10 6-laning projects.
3. Terrain, D_Terrain (dummy): This variable is an indicator ofproject complexity where the presence of difficult terrain istaken into account. For example, a rocky terrain would forcethe requirement for additional resources, for drilling in therock and providing suitable support systems before layingthe road. Since most of these requirements were based onin-situ measurements, the resources to address a difficult ter-rain were generally unaccounted for during pre-constructionplanning (Swaminathan 1999). Hence, overruns wereexpected to increase with difficult terrain.
4. Foreign Consultant, D_Consultant (dummy): Consultantswere primarily involved in the design stage, for the technicaldesign and traffic forecasts for the tolling process. Ineffectivedesign often leads to excessive resource utilization and delayapart from causing accidents, resulting in overrun. Foreignconsultants were routinely engaged with the expectationthat they would be able to produce a more effective design.
Therefore, the presence of foreign consultants is expectedto lead to a reduction in overruns.
5. Contractor, Contractor: This variable is an indicator of theconstruction effectiveness of the contractor. The contractoris the sole entity involved during the construction phaseand is entirely responsible for any delays and excess costs thatare incurred. More effective the contractor, the lesser would bethe project overrun.
Economic VariablesThese variables captured the financial and commercial features ofthe project.1. Time taken, ProjectDuration: This indicated the initial
estimated time for completing the project and is another indica-tor of project size. Greater project duration generally increasedthe resource requirement, which should increase the overrun.Longer projects were also susceptible to changes in theconstruction environment, such as changes in weather,commodity prices, etc. which could heighten the overrun.However, an alternate possibility is the increased duration re-sults in better pre-construction planning that shortens the delay.
2. Estimated Cost, Estimate: This is the estimated initial cost ofthe project and is an indicator of project size. A greaterestimated cost was expected to result in overrun, but a greaterestimate also forced the need for better pre-constructionplanning which should reduce overrun. In other words, a trendsimilar to that seen for ProjectDuration was expected.
3. Cost=km=lane, CostKmLane: This is another indicator ofcomplexity in the project. Increased cost=km=lane was anindication of greater number of bridges and culverts in theconstruction and the presence of difficult terrain. A higherdegree of project complexity was expected to result inincreased overrun.
4. Multilateral Banks, D_Multilateral_Banks (dummy): Thevariable is used to indicate the presence of multilateral orbilateral funding for the project. Projects that receiveassistance from such institutions are expected to follow morestringent processes in all aspects of project development. Thisdetailed compliance can potentially result in an increase inproject overruns.
5. PPP, D_PPP (dummy): This variable captured the type ofproject, PPP or non-PPP. Because of the involvement ofprivate sector, PPP projects were expected to have lower de-lays and overruns.
6. Land Use, D_Land_Use (dummy): This variable indicated thepresence of forest land along the path of the road under con-struction. Obtaining government clearance when a road waspassing through or adjacent to forest land was a cumbersomeand time consuming process. Therefore, the presence of forestland was expected to result in project overruns.
7. Category, D_Category (dummy): This variable was used tocapture the political will that was seen in the case of fast-trackprojects. Government is expected to process land acquisitionand other clearances faster for those projects that have beenidentified for fast track development as compared to standardprojects. Therefore, overruns were expected to be lower forsuch fast track projects.
8. Multi-State, D_Multi_State (dummy): Highways account forsignificant traffic flow across state borders, providing avenuesfor the governments to collect taxes on both sides. A betterroad is expected to increase the traffic and hence, the tax col-lected. The quicker these roads are established, the sooner thetraffic will increase. In other words, overruns are expected tobe lesser in inter-state projects.
© ASCE 04013070-3 J. Constr. Eng. Manage.
J. Constr. Eng. Manage. 2014.140.
Dow
nloa
ded
from
asc
elib
rary
.org
by
Uni
vers
ity o
f W
ater
loo
on 0
6/18
/14.
Cop
yrig
ht A
SCE
. For
per
sona
l use
onl
y; a
ll ri
ghts
res
erve
d.
9. Time Lapse, TimeLapse: This variable has been used to cap-ture the effect of technology development and expertise ac-quired in construction project management. More recentprojects were expected to have lower overruns as a resultof better planning and management.
District and State Specific IndicatorsThese location specific variables have been used to capture thefeatures of the operating environment of the project1. Per-capita State GDP, PerCapitaStateGDP: This variable is an
indicator of the income and the level of demand for transportservices in the state. States with a higher per-capita State GDPhave a higher level of economic activity and hence, have astronger demand for road transport infrastructure. It wasexpected that higher income states would have a more robustenvironment for development of infrastructure projects, whichwould result in lower project overruns.
2. Property Rights Index, PropertyRightsIndex: This variable isan indication of the legal framework available in the state tosafeguard the private property of the individuals. Road
development projects invariably involve acquisition of land.Acquisition of private land can become difficult in those stateswhere private owners have better safeguards for their property.Therefore, projects developed in states having values ofproperty rights index were expected to have higher overruns.
3. District Infrastructure Index, InfraIndex: The level ofinfrastructure within the district is captured by this variable.Better infrastructure is very effective in garnering adequate re-sources to the project development site thereby reducing theexpected overrun. On the other hand, better infrastructurehikes the land rates, which may prove detrimental to the landacquisition process through expensive and long litigations,thereby, increasing the expected overrun.
The estimated parameters of an OLS regression equationare unbiased, efficient and consistent provided there is a linearrelationship between the dependent and independent variablesand the variables are normally distributed. We checked for thelinearity of the OLS equations by plotting the estimated residualsof both the equations with that of the predicted values of theirrespective dependent variables. The resulting scatter plot of the
Table 1. Data Sources for Variables
Variable Name Data source Description
Technical variablesRoad length Program implementation status reports (quarterly),
Ministry of Statistics and ProgrammeImplementation (MOSPI) (2012)
Project size indicator, represented in km
Number of lanes Program implementation status reports(quarterly)—MOSPI (2012)
Project size indicator, either 4 or 6, indicating4-laning and 6-laning process
Time undertaken Program implementation status reports(quarterly)—MOSPI (2012)
Project size indicator, difference between thetime of project approval and project commencement,represented in months
Terrain (dummy) Authors’ analysis based on topographicalmaps from Survey of India
Construction complexity indicator, 1 for anysloping terrain along the route, 0 otherwise
Foreign consultant(dummy)
Program implementation status reports(quarterly)—MOSPI (2012)
Design effectiveness indicator, 1 for a foreignconsultant, 0 otherwise
Cost/km/lane Our calculations Construction complexity indicator, total estimatedcost/road length/number of lanes, represented in crore/km/lane
Economic variablesContractor Program implementation status reports
(quarterly)—MOSPI (2012),CPWD (2012) contractor grades,construction week online (2012)
Execution effectiveness indicator, contractor gradesused as follows, Grade I – 1 Grade II – 2Grade III – 3 others – 4
Estimated cost Program implementation status reports(quarterly)—MOSPI (2012)
Project size indicator, represented in crore
Multilateral banks(dummy)
Program implementation status reports(quarterly)—MOSPI (2012)
Financing effectiveness indicator, 1 for a foreign /multilateral bank funded project, 0 otherwise
PPP (dummy) Program implementation status reports(quarterly)—MOSPI (2012),PPP project database (2011 a, b)
PPP indicator, 1 for PPP, 0 otherwise
Land Use (dummy) Authors’ analysis based on maps ofnational parks & sanctuariesin India from survey of India
Land acquisition effectiveness indicator, 1 if anyforest /sanctuary land falls within the pathway ofthe road, 0 otherwise
Category (GQ/NS/EW)(dummy)
Program implementation status reports(quarterly)—MOSPI (2012)
Political will indicator, 1 for GQ/NS/EW, 0 otherwise
Multi-state (dummy) Program implementation status reports(quarterly)—MOSPI (2012)
Tax sensitiveness indicator, 1 for roads thatcross state borders, 0 otherwise
Time lapse Our calculations Built capacity indicator, represented as numberof months since Jan. 2000 to the date of project approval
State-specific variablesPer-capita state GDP Central Statistical Office (2012) State economic effectiveness indicator, represented
in dollars/personProperty rights index Debroy et al. (2011) Land acquisition effectiveness indicator, state-specific,
ranging from 0 to 1, averaged for multi-state projectsInfrastructure indexof district
Centre for Monitoring IndianEconomy (CMIE) (2012)
District infrastructure effectiveness indicator,district-specific, averaged for multi-district projects
© ASCE 04013070-4 J. Constr. Eng. Manage.
J. Constr. Eng. Manage. 2014.140.
Dow
nloa
ded
from
asc
elib
rary
.org
by
Uni
vers
ity o
f W
ater
loo
on 0
6/18
/14.
Cop
yrig
ht A
SCE
. For
per
sona
l use
onl
y; a
ll ri
ghts
res
erve
d.
residuals did not show any significant relationship pattern orcurves, which indicated the presence of a linear relationshipbetween the dependent and independent variables. To check fornormality of the equations we plotted the fractiles of error distri-bution versus the fractiles of a normal distribution. There was nosignificant parabolic or S shaped pattern to indicate the presence ofskewness or kurtosis in the data set. Hence the distribution of theerror term was normal. To check for multicollinearity, a correlationcoefficient analysis was done. Though some values in the resultantcorrelation coefficient matrix were higher as expected (such as thecorrelation between road length and estimated cost, which was0.7168), the overall results were acceptable.
3 SLS Regression
Given the possibility of simultaneity bias between cost overrun andtime overrun we did Durbin-Wu-Hausman (DWH) chi-square testto check for endogeneity using Instrumental Variables (IV). Cost/km/lane was used as an instrumental variable for cost overrun andInfrastructure Index was used as an instrumental variable for timeoverrun. Infrastructure index indicated the presence of robust insti-tutional structure to facilitate and develop infrastructure projects.Projects in those states that have high infrastructure index valueswould have comparatively lower time overruns. Therefore, we usedinfrastructure index variable to instrument time overrun. Similarly,we used cost/km/lane to instrument cost overrun, as the former is anindication of project complexity which can lead to cost overruns.The test using the IV indicated the endogeneity of time overrun inthe cost overrun equation and vice versa. Therefore a 3 SLS esti-mate was adopted for a more unbiased and efficient estimation ofthe simultaneous equations. Equations (6) and (7) give the 3SLSestimations.
costoverrun ¼ βc0 þ λc1timeoverrun þ βc2RoadLength
þ βc3D Lanesþ βc4ProjectDuration
þ βc5D Terrainþ βc6D Consultant
þ βc7CostKmLaneþ βc8Contractor
þ βc9Estimateþ βc10D Multilateral Banks
þ βc11D PPPþ βc12D Land Use
þ βc13D Categoryþ βc14D Multi State
þ βc15TimeLapse þ βc16PerCapitaStateGDP
þ βc17PropertyRightsIndex þ εi ð6Þ
Timeoverrun ¼ βt0 þ λt1costoverrunþ βt2RoadLength
þ βt3D Lanesþ βt4ProjectDuration
þ βt5D Terrainþ βt6D Consultant
þ βt7Contractor þ βt8Estimate
þ βt9D Multilateral Banksþ βt10D PPP
þ βt11D Land Useþ βt12D Category
þ βt13D Multi Stateþ βt14TimeLapse
þ βt15PerCapitaStateGDP
þ βt16PropertyRightsIndexþ βt17InfraIndexþ υið7Þ
where βc0 and βt0 are constant terms; β’s are vectors of estimableparameters; λ’s are estimable scalars of the endogenous covariates,and εi’s and vi’s are disturbance or error terms that captureunobserved effects
The equations were uniquely identified by ensuring that thenumber of exogenous variables excluded from each of theequations was equal to the number of endogenous variable includedin the right hand side of the equation. The 3SLS method ofestimation was done in STATA using the reg3 command.
Data Description
Quarterly reports from the Ministry of Statistics and Program Im-plementation (MOSPI) provided data for all infrastructure projectsthat are undertaken by the government. The reports covered over600 projects over the study period (2004–11), both completed andongoing. Out of these, there were 186 completed projects, includ-ing PPP and non-PPP projects that had begun operations by 2011.Data from these 186 projects formed the sample for our study. Thedata was cross-checked with alternative data sources, such as theNational Highways Authority of India and Central StatisticalOrganization website, and the inconsistent data points wereremoved. This left a total of 145 projects, out of which 42 werePPP projects and the remaining 103 being non-PPP projects.
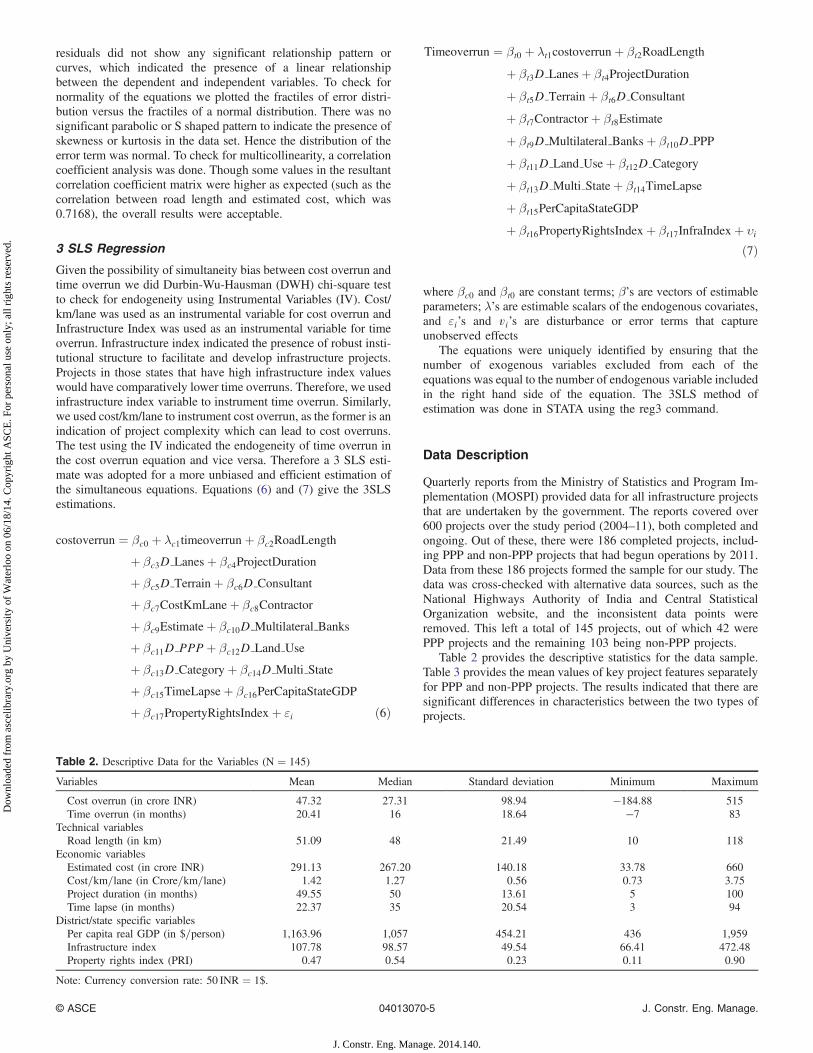
Table 2 provides the descriptive statistics for the data sample.Table 3 provides the mean values of key project features separatelyfor PPP and non-PPP projects. The results indicated that there aresignificant differences in characteristics between the two types ofprojects.
Table 2. Descriptive Data for the Variables (N ¼ 145)
Variables Mean Median Standard deviation Minimum Maximum
Cost overrun (in crore INR) 47.32 27.31 98.94 −184.88 515Time overrun (in months) 20.41 16 18.64 −7 83
Technical variablesRoad length (in km) 51.09 48 21.49 10 118
Economic variablesEstimated cost (in crore INR) 291.13 267.20 140.18 33.78 660Cost=km=lane (in Crore=km=lane) 1.42 1.27 0.56 0.73 3.75Project duration (in months) 49.55 50 13.61 5 100Time lapse (in months) 22.37 35 20.54 3 94
District/state specific variablesPer capita real GDP (in $=person) 1,163.96 1,057 454.21 436 1,959Infrastructure index 107.78 98.57 49.54 66.41 472.48Property rights index (PRI) 0.47 0.54 0.23 0.11 0.90
Note: Currency conversion rate: 50 INR ¼ 1$.
© ASCE 04013070-5 J. Constr. Eng. Manage.
J. Constr. Eng. Manage. 2014.140.
Dow
nloa
ded
from
asc
elib
rary
.org
by
Uni
vers
ity o
f W
ater
loo
on 0
6/18
/14.
Cop
yrig
ht A
SCE
. For
per
sona
l use
onl
y; a
ll ri
ghts
res
erve
d.

Results
Comparison of Means
Table 4 and 5 provides the results from comparison of meansanalysis on cost overrun and time overrun respectively. Table 4indicates that the mean cost overrun for PPP projects is INR104.66 crore (about USD 20.93 million) whereas for the non-PPPprojects, it is INR 23.94 crore (about USD 4.79 million). Thedifference in means is significant at the 0.1% level. As a robustnesscheck of the unmatched sample results, the mean cost overrun be-tween the two types of projects was also compared after matchingthe projects on different parameters such as road length, numberof lanes, and project duration. The difference persisted for all thematching criterion. Since the N values do not differ significantlyfor the different matching variables, it can be considered that the
original unmatched sample is also fairly balanced for both typesof projects.
Table 5 indicates that the mean time overrun for PPP projects is6.43 months whereas for the non-PPP projects, it is 26.11 months.This difference in means is significant at the 0.1% level. Thedifference was consistent even after matching the projects onvarious parameters. The results from the means analysis showan opposing trend on cost and time overrun. While PPP projectshave a higher cost overrun as compared to non PPP projects, itwas the reverse in the case of time overrun.
Though the means analysis indicates a difference in thevariables of interest between the two types of projects, itcannot be said for certain that this difference can be attributedto the treatment effect. We use regression (OLS and 3SLS)methods to estimate the impact of PPP on cost and timeoverruns.
Table 4. Match Pair Sampling Results for Cost Overrun (in Crore INR)
Type of project Descriptive statistics
Variables used for matching
Unmatched sample Road length (km) Number of lanesProject duration(in months)
PPP Mean 104.66 96.74 104.66 104.66N 42 40 42 42
Non-PPP Mean 23.94 23.94 23.94 20.13N 103 103 103 96
P-value 0.00a 0.00a 0.00a 0.00a
Note: Currency conversion rate: 50 INR ¼ 1$.aSignificant at 0.1% level of significance.
Table 5. Match Pair Sampling Results For Estimated Time Overrun (in Months)
Type of project Descriptive statistics
Variables used for matching
Unmatched sample Road length (km) Number of lanes Project duration (in months)
PPP Mean 6.43 6.05 6.43 6.43N 42 40 42 42
Non-PPP Mean 26.11 26.12 26.12 25.35N 103 103 103 96
P-value 0.00a 0.00a 0.00a 0.00a
aSignificant at 0.1% level of significance.
Table 3. Mean Comparison Analysis for Different Variables
Variables
Mean
P-Value (Wilcoxonrank-sum test)
PPP Samplesize ¼ 42
Non-PPP Samplesize ¼ 103
Cost overrun (in crore INR) 104.66 23.94 0.00a
Average percentage of cost overruns 27.32% 8.43% 0.00a
Time overrun (in months) 6.43 26.12 0.00a
Average percentage of time overruns 12.98% 75.56% 0.00a
Technical variablesRoad length (in km) 61.86 46.71 0.002a
Economic variablesProject duration (in months) 53.57 47.91 0.005a
Cost=km=lane (in Crore=km=lane) 1.51 1.39 0.009a
Estimated cost (in crore INR) 382.46 253.89 0.00a
Time lapse (in months) 38.33 15.86 0.00a
District/state specific variablesPer capita real GDP (in $=person) 1,392.81 1,070.64 0.00a
Infrastructure index 104.20 109.24 0.908Property rights index (PRI) 0.55 0.44 0.002a
Note: Currency conversion rate: 50 INR ¼ 1$.aSignificant at 1% level of significance.
© ASCE 04013070-6 J. Constr. Eng. Manage.
J. Constr. Eng. Manage. 2014.140.
Dow
nloa
ded
from
asc
elib
rary
.org
by
Uni
vers
ity o
f W
ater
loo
on 0
6/18
/14.
Cop
yrig
ht A
SCE
. For
per
sona
l use
onl
y; a
ll ri
ghts
res
erve
d.
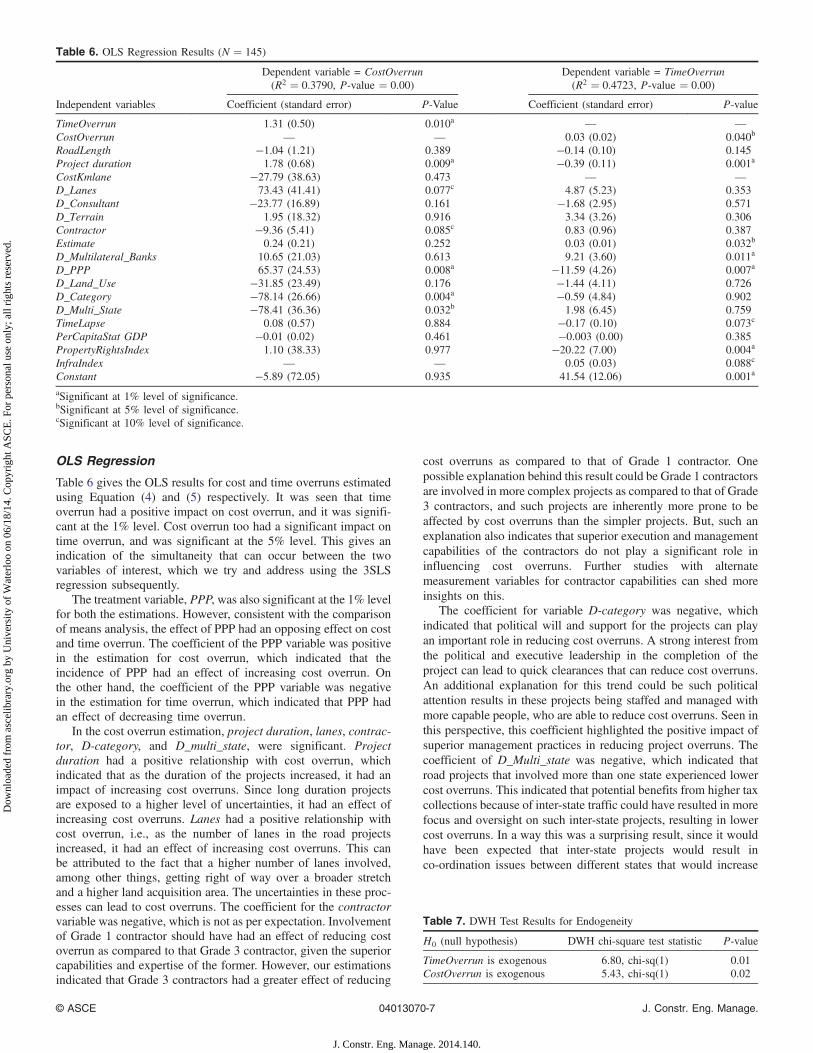
OLS Regression
Table 6 gives the OLS results for cost and time overruns estimatedusing Equation (4) and (5) respectively. It was seen that timeoverrun had a positive impact on cost overrun, and it was signifi-cant at the 1% level. Cost overrun too had a significant impact ontime overrun, and was significant at the 5% level. This gives anindication of the simultaneity that can occur between the twovariables of interest, which we try and address using the 3SLSregression subsequently.
The treatment variable, PPP, was also significant at the 1% levelfor both the estimations. However, consistent with the comparisonof means analysis, the effect of PPP had an opposing effect on costand time overrun. The coefficient of the PPP variable was positivein the estimation for cost overrun, which indicated that theincidence of PPP had an effect of increasing cost overrun. Onthe other hand, the coefficient of the PPP variable was negativein the estimation for time overrun, which indicated that PPP hadan effect of decreasing time overrun.
In the cost overrun estimation, project duration, lanes, contrac-tor, D-category, and D_multi_state, were significant. Projectduration had a positive relationship with cost overrun, whichindicated that as the duration of the projects increased, it had animpact of increasing cost overruns. Since long duration projectsare exposed to a higher level of uncertainties, it had an effect ofincreasing cost overruns. Lanes had a positive relationship withcost overrun, i.e., as the number of lanes in the road projectsincreased, it had an effect of increasing cost overruns. This canbe attributed to the fact that a higher number of lanes involved,among other things, getting right of way over a broader stretchand a higher land acquisition area. The uncertainties in these proc-esses can lead to cost overruns. The coefficient for the contractorvariable was negative, which is not as per expectation. Involvementof Grade 1 contractor should have had an effect of reducing costoverrun as compared to that Grade 3 contractor, given the superiorcapabilities and expertise of the former. However, our estimationsindicated that Grade 3 contractors had a greater effect of reducing
cost overruns as compared to that of Grade 1 contractor. Onepossible explanation behind this result could be Grade 1 contractorsare involved in more complex projects as compared to that of Grade3 contractors, and such projects are inherently more prone to beaffected by cost overruns than the simpler projects. But, such anexplanation also indicates that superior execution and managementcapabilities of the contractors do not play a significant role ininfluencing cost overruns. Further studies with alternatemeasurement variables for contractor capabilities can shed moreinsights on this.
The coefficient for variable D-category was negative, whichindicated that political will and support for the projects can playan important role in reducing cost overruns. A strong interest fromthe political and executive leadership in the completion of theproject can lead to quick clearances that can reduce cost overruns.An additional explanation for this trend could be such politicalattention results in these projects being staffed and managed withmore capable people, who are able to reduce cost overruns. Seen inthis perspective, this coefficient highlighted the positive impact ofsuperior management practices in reducing project overruns. Thecoefficient of D_Multi_state was negative, which indicated thatroad projects that involved more than one state experienced lowercost overruns. This indicated that potential benefits from higher taxcollections because of inter-state traffic could have resulted in morefocus and oversight on such inter-state projects, resulting in lowercost overruns. In a way this was a surprising result, since it wouldhave been expected that inter-state projects would result inco-ordination issues between different states that would increase
Table 6. OLS Regression Results (N ¼ 145)
Independent variables
Dependent variable = CostOverrun(R2 ¼ 0.3790, P-value ¼ 0.00)
Dependent variable = TimeOverrun(R2 ¼ 0.4723, P-value ¼ 0.00)
Coefficient (standard error) P-Value Coefficient (standard error) P-value
TimeOverrun 1.31 (0.50) 0.010a — —CostOverrun — — 0.03 (0.02) 0.040b
RoadLength −1.04 (1.21) 0.389 −0.14 (0.10) 0.145Project duration 1.78 (0.68) 0.009a −0.39 (0.11) 0.001a
CostKmlane −27.79 (38.63) 0.473 — —D_Lanes 73.43 (41.41) 0.077c 4.87 (5.23) 0.353D_Consultant −23.77 (16.89) 0.161 −1.68 (2.95) 0.571D_Terrain 1.95 (18.32) 0.916 3.34 (3.26) 0.306Contractor −9.36 (5.41) 0.085c 0.83 (0.96) 0.387Estimate 0.24 (0.21) 0.252 0.03 (0.01) 0.032b
D_Multilateral_Banks 10.65 (21.03) 0.613 9.21 (3.60) 0.011a
D_PPP 65.37 (24.53) 0.008a −11.59 (4.26) 0.007a
D_Land_Use −31.85 (23.49) 0.176 −1.44 (4.11) 0.726D_Category −78.14 (26.66) 0.004a −0.59 (4.84) 0.902D_Multi_State −78.41 (36.36) 0.032b 1.98 (6.45) 0.759TimeLapse 0.08 (0.57) 0.884 −0.17 (0.10) 0.073c
PerCapitaStat GDP −0.01 (0.02) 0.461 −0.003 (0.00) 0.385PropertyRightsIndex 1.10 (38.33) 0.977 −20.22 (7.00) 0.004a
InfraIndex — — 0.05 (0.03) 0.088c
Constant −5.89 (72.05) 0.935 41.54 (12.06) 0.001a
aSignificant at 1% level of significance.bSignificant at 5% level of significance.cSignificant at 10% level of significance.
Table 7. DWH Test Results for Endogeneity
H0 (null hypothesis) DWH chi-square test statistic P-value
TimeOverrun is exogenous 6.80, chi-sq(1) 0.01CostOverrun is exogenous 5.43, chi-sq(1) 0.02
© ASCE 04013070-7 J. Constr. Eng. Manage.
J. Constr. Eng. Manage. 2014.140.
Dow
nloa
ded
from
asc
elib
rary
.org
by
Uni
vers
ity o
f W
ater
loo
on 0
6/18
/14.
Cop
yrig
ht A
SCE
. For
per
sona
l use
onl
y; a
ll ri
ghts
res
erve
d.

project overruns rather than reducing it. However, because of thecommercial benefits of inter-state traffic, our estimatesindicated that the states have been managing the coordinationamong themselves effectively.
In the time overrun equation, the other variables that weresignificant are Projectduration, Estimate, D_multilateral_banks,Timelapse, and PropertyRightsIndex. The coefficient of Projectdu-ration was negative, indicating that long duration projects hadlower time overruns. Though a bit surprising, it can be attributedto the reason that project planning for long duration projects couldhave incorporated appropriate buffer for delays in the projectschedule. However, it is interesting to note that the effect of suchdetailed project planning have resulted in opposing effects—itincreased cost overruns, but reduced time overruns. Additionalstudies are needed to investigate this further. The coefficient ofEstimate was positive, which indicated that projects with highercosts had an effect of increasing time overruns. This was onexpected lines—as the project size increased, the complexity in-creased, which had an effect of increasing time overruns. The co-efficient of D_multilateral_banks had a positive coefficient, whichindicated that projects with investment from multilateral banks hadhigher time overruns as compared to projects that did not. This canbe attributed to the loan covenants of such institutions that requireadherence to tighter project management processes (such as astrong rehabilitation policy for project affected people, use ofinternational competitive bidding processes, etc.). The coefficientof Timelapse was negative, indicating that projects in recent yearshad experienced lower time overruns as compared to projects de-veloped in earlier years. This showed that over time, because of theprogress achieved in overall project management techniques, it hasbeen possible to reduce the duration of time overruns. The coeffi-cient of PropertyRightsIndex was positive, which indicated that themodel estimated an increase in time overrun that offered higherprotection for property rights. Road development projects invaria-bly involved land acquisition. Projects that were implemented instates that reportedly provided better protection to property rights(and therefore having higher property index values) could have
been subjected to a higher level of litigation from project affectedpeople, which could have had an effect of increasing time overruns.
3SLS Regression
Given the possibility of simultaneity bias between cost and timeoverruns, the DWH test was used to check for endogeneity inthe OLS regressions. The test results are given in Table 7.
Since the test results indicated endogeneity, a 3SLS regressionwas estimated for the variables of interest. Table 8 gives theregression results.
The results on cost overrun indicated that PPP had a significantimpact on cost overrun. Projectduration and Timeoverrun also re-tained its significance. However, other variables that were signifi-cant in the OLS regression viz., lanes, contractor, D-category, andD_multi_state, were not significant in the 3SLS regression. How-ever, it can be seen that the direction of these coefficients was con-sistent in both the regressions. The results on time overrun did notshow any significance for any of the variables. PPP, which wassignificant in the OLS regression estimates on time overrun, wasnot seen as significant and the direction of the coefficient alsochanged. Similarly, the other variables, viz., Costoverrun, Project-duration, Estimate, D_multilateral_banks, Timelapse, and Proper-tyRightsIndex, were also not seen as significant. This showed thatnone of the variables used in this study had significant impact ontime overrun. Additional robustness checks need with alternate in-strumental variables in the case of time overrun, are needed to val-idate these results and can be considered as scope for future work.
Conclusions
Cost and time overruns in infrastructure projects are a commonoccurrence. The objective of this paper was to examine whetherthe use of PPP had any impact on these project overruns. It wasfound that use of PPP led to higher cost overruns, while it didnot have significant impact on time overrun. These findings arecontrary to the findings of the previous studies, which clearly
Table 8. 3SLS Regression Results (N ¼ 145)
Independent variables
Dependent variable = CostOverrun Dependent variable = TimeOverrun
Coefficient (standard error) P-value Coefficient (standard error) P-value
TimeOverrun 9.39 (5.45) 0.084a — —CostOverrun — — −0.43 (0.56) 0.445RoadLength −3.27 (2.46) 0.184 −0.25 (0.29) 0.389Project duration 5.11 (2.48) 0.039b 0.21 (0.78) 0.790CostKmlane −160.03 (108.20) 0.139 — —D_Lanes 109.44 (71.47) 0.126 28.77 (32.20) 0.372D_Consultant 3.87 (33.07) 0.907 −12.91 (15.74) 0.412D_Terrain −17.16 (32.38) 0.596 10.64 (12.39) 0.390Contractor −12.08 (8.98) 0.179 −1.87 (4.16) 0.653Estimate 0.56 (0.41) 0.167 0.08 (0.07) 0.256D_Multilateral_Banks −61.09 (58.78) 0.299 21.68 (17.91) 0.226D_PPP 133.74 (60.54) 0.027b 19.80 (39.80) 0.619D_Land_ Use −8.66 (41.20) 0.833 −18.64 (23.59) 0.429D_Category −41.51 (49.75) 0.404 −31.93 (40.21) 0.427D_Multi_State −88.06 (59.46) 0.139 −36.34 (49.64) 0.464TimeLapse 2.14 (1.66) 0.196 −0.20 (0.26) 0.444PerCapitaState GDP 0.01 (0.04) 0.704 −0.02 (0.02) 0.385PropertyRightsIndex 128.40 (105.24) 0.222 −46.56 (37.02) 0.208InfraIndex — — 0.26 (0.27) 0.328Constant −338.56 (250.69) 0.177 37.74 (32.31) 0.243aSignificant at 10% level of significance.bSignificant at 5% level of significance.
© ASCE 04013070-8 J. Constr. Eng. Manage.
J. Constr. Eng. Manage. 2014.140.
Dow
nloa
ded
from
asc
elib
rary
.org
by
Uni
vers
ity o
f W
ater
loo
on 0
6/18
/14.
Cop
yrig
ht A
SCE
. For
per
sona
l use
onl
y; a
ll ri
ghts
res
erve
d.
indicate the superior performance of PPP projects. However, it mustbe noted that the sample size of the previous studies in general havebeen very limited. The findings of this study, atleast for costoverrun, persist with robustness checks and bias corrections.
The following reasons can be used to explain this trend. First, isthe time period used for selecting the projects. Though there wasexperience of implementing PPP projects globally, these were theinitial years in the country when PPP’s were being activelyconsidered for developing road projects. It was a learning phaseand there was a lot of experimentation and learning in structuringand contracting PPP projects, which resulted in cost overruns insuch projects. However, adequate support could not be found inour analysis for this argument since the cost overrun did not showa declining trend in recent years as compared to earlier years. Notonly was the coefficient for the variable TimeLapse insignificant, italso had a positive sign. This indicated that, cost overruns increasedin recent years, though the effect was not significant.
Second, the PPP contractual structure either provided an incen-tive for incurring cost overruns or did not discourage it adequatelyin terms of penalties. While additional studies that examined thePPP contracts are needed to verify this, it is not uncommon to haveincidences of costs exaggeration by private sector where there is norisk in recovering such excess costs and along with correspondingreturns (see for example Parikh (1995). This phenomenon of “gold-plating” was the central theme in the well known paper by Averchand Johnson (1962). The results of this paper clearly suggest theneed for a thorough relook of the PPP agreements and make ittighter to reduce the incidence of cost overruns.
PPP projects did not have a significant impact on time overrun.In essence, PPP projects were no more or no less effective ascompared to the non-PPP projects in reducing time overruns. Addi-tional studies are needed to determine whether incentives could beprovided to complete projects earlier than budgeted, without anycorresponding impact on cost.
Incidence of time overrun was predicted with an increase in costoverrun, but not vice versa. This was on expected lines. A projectprogressing as planned with respect to time was unlikely to incurany cost overruns. But any deviation is likely to have a correspond-ing impact on cost over runs. In the estimation of cost overrun, it isimportant to note the positive co-relation with time overrun.Though not significant, it was however, interesting to note thenegative sign for the cost overrun coefficient in the regressionestimate for time overrun. This can be explained by the rationalethat when project need to be completed before schedule (negativetime overrun), additional costs need to be incurred that were notbudgeted for (i.e., a positive cost overrun).
On the whole, our study indicated that PPP projects were worseoff than non-PPP projects in managing project overruns. In the caseof time overrun, they were as good as non-PPP projects, whereas inthe case of cost overrun, PPP projects were predicted to result in anincrease cost overrun. Several reasons could be advanced toexplain the result. First, generally PPP projects were larger, andtherefore probably involved greater complexity in construction.This complexity could be a reason for higher cost overruns inPPP projects. Better project planning with a more completeunderstanding of the ex-ante ground realities can help in reducingcost overruns. Second, the private sector seems more comfortablewith a cost overrun in its balance sheet, when contracts arestructured on the basis of cost recovery. Increased project costshave an impact on the entire project lifecycle (in terms of highertolls or annuity payments by the government). Use of performanceincentives which are based on deliverables rather than recovery ofproject cost can be more effective in reducing cost overruns.
The findings also imply that defective planning and contractualfailures can lead to cost overruns and consequently for a wastage ofpublic resources. Since long duration projects significantly increasecost overruns, structuring projects as smaller road stretches can bean effective way to reduce cost overrun. There is also a need tooverhaul project planning and management. Rather than payinga higher cost later on, it is worth investing resources to have moreprecise initial estimates of project time and cost.
Our interaction with field officials indicated that, during thestudy period, construction contracts were generally awarded evenbefore the required land for the project was acquired. Similarly,utilities were shifted only during the construction phase. Invari-ably, several departments are involved in approving and the actualshifting of power, water and sewer lines and other utilities.Government agencies rarely do what they were required to do,but can use a cobweb of complicated rules and procedures to passon the blame for delays to one another. So much so that even if thedelay is caused by the contractor it is almost impossible to punishhim, since the contractor can easily prove a contributorynegligence on the part of one or the other department (Singh2010). This explained why contracts were rarely terminated, evenwhen contractors caused prolonged delays. Quicker landacquisition and shifting of utilities through a more efficientgovernment processes is critical. Moreover, a prerogative to allotland prior to construction which can enable the government toprovide incentives for projects that deliver on time and qualityshould be exercised.
Policymakers seem to be keen to privatize the funding, manage-ment and ownership of infrastructure facilities. The problems ofdelays and cost overruns with the public delivery systems are beingused to justify privatization of roads and other infrastructuresectors. However, the results imply that following a PPP route isbound to increase the cost overrun in the projects and thus, changein ownership in itself cannot mitigate all the problems with thesupply and administration of infrastructure facilities.
The regression estimations used in this study has helped us toeffectively understand the impact of PPP in managing projectoverruns. However, before ending it would be pertinent to outlinescope for future work. First, including variables that account foradditional project level differences that prevail between PPP andnon-PPP projects can enrich our understanding even further. Forinstance, that there are substantial differences in the operatingenvironments of PPP and non-PPP projects. Key differencescould be obtained using surveys and interviews with relevantindustry specialists and the government, which can then be incor-porated in the estimations. Second, the dataset used for the studycomprised of 145 projects, which were drawn from only thenational road projects. It would be interesting to see the trendby including state level road projects also. Third, inclusion ofthe effects of the contracting method and extent of competitionat the project bidding stage on overruns can also provide interest-ing insights. Fourth pertains to methodology—identification anduse of alternate instrumental variables can help to improve thevalidity of the results.
Acknowledgments
The authors would like to acknowledge the helpful commentsprovided by the anonymous reviewers in improving the paper.Financial support received from Human Settlement ManagementInstitute of the Housing and Urban Development CorporationLimited is also being gratefully acknowledged.
© ASCE 04013070-9 J. Constr. Eng. Manage.
J. Constr. Eng. Manage. 2014.140.
Dow
nloa
ded
from
asc
elib
rary
.org
by
Uni
vers
ity o
f W
ater
loo
on 0
6/18
/14.
Cop
yrig
ht A
SCE
. For
per
sona
l use
onl
y; a
ll ri
ghts
res
erve
d.
References
Arditi, D., Akan, G. T., and Gurdamar, S., (1985). “Cost overruns in publicprojects.” Int. J. Proj. Manage., 3(4), 218–224.
Attalla, M., and Hegazy, T., (2003). “Predicting cost deviation inreconstruction projects: Artificial neural networks versus regression.”J. Constr. Eng. Manage., 10.1061/(ASCE)0733-9364(2003)129:4(405), 405–411.
Averch, H., and Johnson, I. L., (1962). “Behaviour of the firm underregulatory constraint.” Am. Econ. Rev., 52, 1052–1069.
Bain, R. (2007). “PPP construction risk: International evidence from theroads sector.” Proc., of the European Transport Conf., Association ofEuropean Transport, Noordwijkerhout, Netherlands.
Blackwell, M., Iacus, S., King, G., and Porro, G. (2009). “CEM: Coarsenedexact matching in Stata.” STATA J., 9(4), 524–546.
Blanc-Brude, F., Goldsmith, H., and Välilä, T. (2009). “A comparison ofconstruction contract prices for traditionally procured roads and public–private partnerships.” Rev. Ind. Organ., 35(1), 19–40.
Central Public Works Department (CPWD). (2012). “List of enlistedcontractors.” Class I—Class V ⟨http://www.cpwd.gov.in/⟩ (Mar. 17,2012).
Central Statistics Office. (2012). “Per-capita Net State GDP(2011-2012), as on Mar. 1, 2012.” Directorate of Economics andStatistics of individual states, ⟨http://mospi.nic.in/Mospi_New/upload/State_wise_SDP_2004-05_14mar12.pdf⟩ (Mar. 21, 2012).
Centre for Monitoring Indian Economy (CMIE). (2012). “Infrastructuredevelopment index, Annex -3, India.” ADB/UNESCAP ConcludingWorkshop on Enhancing Social and Gender Statistics, Bangkok,⟨http://www.unescap.org/stat/meet/esgs2/esgs2_india_an3.pdf⟩ (Mar. 15,2012).
Chasey, A. D., Maddex, W. E., and Bansal, A. (2012). “Comparison ofpublic-private partnerships and traditional procurement methods inNorth American highway construction.” Transportation ResearchRecord: Journal of the Transportation Research Record, No. 2268,Transportation Research Board of the National Academies, Washing-ton, DC, 26–32.
ConstructionWeekOnline. (2012). “Top 30 infrastructure companies.” ⟨http://www.constructionweekonline.in/article-7581-top_30_infrastructure_companies/⟩ (Mar. 26, 2012).
Debroy, B., Bibek, L., and Laveesh Bhandari, S. S. A. (2011). “Economicfreedom of the States of India 2011.”Academic Foundation, New Delhi,⟨http://www.freetheworld.com/pdf/EconomicFreedomIndia-2011.pdf⟩(May 12, 2013).
Dey, P. K., Tabucanon, M. T., and Ogunlana, S. O. (1994). “Planning forproject control through risk analysis: A case of petroleum pipelinelaying project.” Int. J. Proj. Manage., 12(1), 23–33.
Flyvbjerg, B., Bruzelius, N., and Rothengather, W. (2003a).Megaprojects and risk: An anatomy of ambition, CambridgeUniversity Press, Cambridge, U.K.
Flyvbjerg, B., Holm, M. K. S., and Buhl, S. L., (2003b). “How commonand how large are cost overruns in transport infrastructure projects?”Transport Rev., 23(1), 71–88.
Flyvbjerg, B., Holm, M. K. S., and Buhl, S. L., (2004). “What causes costoverrun in transport infrastructure projects?” Transport Rev., 24(1),3–18.
Grimsey, D., and Lewis, M. (2007). “PPP and public procurement.”Agenda, 14(2), 171–188.
Hampton, G., Baldwin, A. N., and Holt, G. (2012). “Project delays and costStakeholder perceptions of traditional v. PPP procurement.” J. Financ.Manage. Property Construct., 17(1), 73–91.
Hinze, J., Selstead, G., and Mahoney, J. P. (1992). “Cost overruns onstate of Washington construction contracts.” Transport. Res., 1351,87–93.
Iacobacci, M. (2010). Dispelling the myths: A pan Canadian assessment ofpublic-private partnerships for infrastructure investments, ConferenceBoard of Canada, Ottawa, Canada.
Infrastructure Partnerships Australia. (2007). Performance of PPP’s andtraditional procurement in Australia.
Ministry of Statistics and Programme Implementation (MOSPI).(2012). “Project implementation status report for central sectorprojects.” Quarterly Reports, Mar. 2004–Jun. 2009 ⟨http://mospi.nic.in/Mospi_New/site/inner.aspx?status=3&menu_id=128⟩ (Feb. 10,2012).
Odeck, J. (2004). “Cost overruns in road construction—what are their sizesand determinants?” Transport Pol., 11, 43–53.
Parikh, K. S. (1995). “Enron episode: Lessons for power policy.” Econ.Polit. Wkly., 30(41–42), 2543–2546.
PPP Project Database. (2011a). “Master list of PPP projects, as on Jan. 31,2011.” ⟨http://www.pppindiadatabase.com/Uploads/Master%20List%20PPP%20Projects%20in%20India%20as%20on%20January%2031,2011.pdf⟩ (Mar. 9, 2012).
PPP Project Database. (2011b). “Status of PPP projects, as on Jul. 31,2011.” ⟨http://www.pppindiadatabase.com/Uploads/Status%20of%20PPP%20Projects%20as%20on%20July%2031,%202011.pdf⟩ (Mar.9, 2012).
Sambasivan, M., and Soon, Y. W. (2006). “Causes and effects ofdelays in Malaysian construction industry.” Int. J. Proj. Manage.,25(20), 517–526.
Shaheen, A. A., Fayek, A. R., and AbouRizk, S. M. (2007). “Fuzzy num-bers in cost range estimating.” J. Constr. Eng. Manage., 10.1061/(ASCE)0733-9364(2007)133:4(325), 325–334.
Singh, R. (2010). “Delays and cost overruns in infrastructure projects:Extent, causes and remedies.” Econ. Polit. Wkly., 45(21), 43–54.
Swaminathan, A. K. (1999). Study on delays due to pre-construction ac-tivities in national highway projects, World Bank, New Delhi, India.
Vijayamohanan, P. N., and Kannan, K. P. (2003). “Time and cost over-runsof the power projects in Kerala.” WP No 320, Centre for DevelopmentStudies, Thiruvananthapuram.
© ASCE 04013070-10 J. Constr. Eng. Manage.
J. Constr. Eng. Manage. 2014.140.
Dow
nloa
ded
from
asc
elib
rary
.org
by
Uni
vers
ity o
f W
ater
loo
on 0
6/18
/14.
Cop
yrig
ht A
SCE
. For
per
sona
l use
onl
y; a
ll ri
ghts
res
erve
d.