Embed Size (px)
Citation preview

PPE Effectiveness in
Agricultural Settings
Abigail Sutphen
A Thesis Submitted in partial fulfillment of the requirements
for the degree of Master of Science
University of Washington
2013
Committee:
Mike Yost
Rich Fenske
Kit Galvin
Program authorized to offer degree:
School of Public Health

ii
©Copyright 2013
Abigail Sutphen

iii
Abstract
University of Washington
Personal Protective Equipment (PPE) is usually required for pesticide applications, but how
effective it actually is against exposure to chlorpyrifos, solvents and oils is unknown. Therefore,
a pilot study has been created to get a more accurate estimate of whether or not there is
pesticide breakthrough while wearing a half mask respirator and 15 mil nitrile gloves and if so,
when that breakthrough occurs. An ambient sampling train and a sampling train behind a
cartridge were created to compare the air concentrations in respirators, and positioned near the
applicator during pesticide application. Passive media patches were placed underneath gloves
to measure dermal exposure. Charcoal media was used to sample for horticultural oil, and PUF
media was used to sample for chlorpyrifos. Two sites were sampled; chlorpyrifos and
horticultural oil was sprayed at Site A and only horticultural oil was sprayed at site B. Media
was changed out once a day. The sampling media was tested for hydrocarbons, alkanes,
aromatics, chlorpyrifos, chlorpyrifos oxon, pentadecane, siloxanes and trimethyl benzene. The
concentrations of the compounds were measured, and the frequency of breakthrough was
calculated for each kind of media. A mass-to-mass ratio, comparing the ambient concentrations
from the cartridge concentrations, was also calculated. The results show that the PPE that is
worn is not providing adequate protection from the pesticides that are being sprayed, but more
study is needed to elaborate on these results.
PPE Effectiveness in Agricultural Settings
Abigail Sutphen
Dr. Mike Yost, PhD
Department of Occupational and Environmental Health Sciences

iv
Table of Contents
Chapter 2: Introduction .............................................................................................................13
Chapter 3: Background Information ........................................................................................16
3.1: Chlorpyrifos.............................................................................................................16
3.2: Horticultural Oil .....................................................................................................18
3.3: Current Practices ....................................................................................................19
Chapter 4: Literature Review ....................................................................................................20
Chapter 5: Significance and Necessity ......................................................................................25
Chapter 6: Specific Aims ............................................................................................................27
Chapter 7: Design and Methods ................................................................................................29
7.1: Design .......................................................................................................................29
7.2: Methods in Lab and Field .......................................................................................33
7.2.1: Pump Flow Rates .....................................................................................34
7.2.2: Lab Preparation ........................................................................................35
7.2.2.1: DryCal Calibration ....................................................................35
7.2.2.2: Media Preparation .....................................................................37
7.2.2.2.1: Preparation of Charcoal Tubes .................................38
7.2.2.2.2. Preparation of Charcoal Cloth Circles ...................39
7.2.2.3: Measuring Glove Thickness ......................................................40
7.2.3: Calibration ................................................................................................42
7.2.3.1: Calibration of SKC Pump for Ambient Samples ...................42

v
7.2.3.2: Calibration of Leland Pumps for Cartridge Samples ............45
7.2.4: Set-Up of Polycarbonate Cases................................................................48
7.2.5: Sampling Train Set-Up ............................................................................50
7.2.6: Change-out Plan .......................................................................................51
7.2.7: Set-Up of Plastic ags................................................................................53
7.2.8: In the Field for Respirators .....................................................................56
7.2.8.1: Data Collection ...........................................................................57
7.2.8.2: Change-out of Media .................................................................59
7.2.9: In the Field for Gloves ..............................................................................62
7.2.9.1: Data Collection ...........................................................................60
7.2.9.2: Change-out for loves................................................................61
7.2.10: Quality Control .......................................................................................64
7.2.11: Labeling ...................................................................................................65
7.3: Analysis in ab..........................................................................................................66
7.4: Statistical Methods ..................................................................................................67
Chapter 8:Results........................................................................................................................70
8.1: Lab Analysis .............................................................................................................71
8.2: Qualitative Results for Respirator Samples ..........................................................71
8.2.1: Unknown Alkanes .....................................................................................71
8.2.2: Non-Aromatic Hydocarbons ...................................................................73
8.2.3: Unknown Aromatics .................................................................................75
8.2.4: Siloxanes ....................................................................................................77

vi
8.2.5: Trimethyl benzene ....................................................................................78
8.2.6: Chlorpyrifos and Chlorpyrifos Oxon .....................................................79
8.3: Qualitative Results for Gloves ................................................................................81
8.3.1: Unknown Alkanes .....................................................................................82
8.3.2: Pentadecane ...............................................................................................83
8.3.3: Non-aromatic hydrocarbons ....................................................................85
8.3.4: Unknown Aromatics .................................................................................87
8.4: Data Analysis.............................................................................................................89
8.4.1: Frequency of its.......................................................................................91
8.4.2: Mass-to-Mass Ratios.................................................................................95
Chapter 9: Discussion .................................................................................................................98
9.1: Discussion of Results ...............................................................................................98
9.2: Limitations .............................................................................................................102
9.3 Recommendations ...................................................................................................106
Chapter 10: Conclusions ..........................................................................................................109
Chapter 11: Acknowledgements ..............................................................................................110
Chapter 12: References ............................................................................................................111
Chapter 13: Appendixes ...........................................................................................................114
Appendix A: Comprehensive list of Materials .............................................................114
Appendix B: Method for Sampling Chlorpyrifos with PUFs .......................................120
Appendix C: Calculations for Flow Rate and Face Velocity ........................................124
Appendix D: Calibration of the Defender DryCal..........................................................127

vii
Appendix E: Number of Samples Used ........................................................................128
Appendix F: Glove Measurements ................................................................................130
Appendix G: Calibration Data .......................................................................................131
Appendix H: Table of Contents from Field Manuals ....................................................133
Appendix I: Data Sheets ................................................................................................135
Appendix J: Supplies .....................................................................................................137
Appendix K: Quality Control Spiking ...........................................................................138
Appendix L: Labeling ....................................................................................................139
Appendix M: Pictures of Field Work ............................................................................140
Appendix N: Demographic Data ...................................................................................145
Appendix O: Quality Assurance from Lab ....................................................................145
Appendix P: Calculations of Upper Limit of Non-Hits .................................................147
Appendix Q: Calculations of Adjusted Mass ................................................................149

viii
List of Figures
Figure 1: Method for Sampling Inside Respirator
Figure 2: Calibration of PUF Tube for Ambient Sampling Train- Appendix B
Figure 3: Calibration of PUF Tube for Cartridge Sampling - Appendix B
Figure 4: Sampling Train Set-Up for Cartridge Sample- Appendix B
Figure 5: Sampling Train Set-Up for Ambient Sampling Train - Appendix B
Figure 6: Set-up of the DryCal with the Bubble burette
Figure 7: Graph of DryCal verses Bubble Burette – Appendix D
Figure 8: Cassette Set Up
Figure 9: A Mitutoyo dial thickness gage
Figure 10: Parts of the Glove
Figure 11: Calibration Set-Up for Ambient Sample with Charcoal Tube
Figure 12: Calibration Set Up for Leland Pump
Figure 13: Polycarbonate Case
Figure 14: Ambient Sampling Train
Figure 15: Cartridge Sampling Train
Figure 16: Diagram of Change out of Ambient Sample
Figure 17: Diagram of Change out of Cartridge Sample
Figure 18: AM Sampling Bags
Figure 19: PM Sampling Bags
Figure 20a and 20b: Sampling Trains inside Polycarbonate Case
Figure 21a, 21b, and 21c: Sampling Train in Box on Tractor

ix
Figure 22: Change out on Back of Tractor
Figure 23: Putting Media on the Inside of Gloves
Figure 24: Explanation of a respirator label- Appendix L
Figure 25: Explanation of a Glove Label- Appendix L
Figure 26: Explanation of a Quality Control Label- Appendix L
Figure 27: Abigail and Maria changing out media on a tractor during lunch break –Appendix M
Figure 28: Pablo and Miyoko changing out media on a glove during lunch break – Appendix M
Figure 29: Sampling Box on the back of a tractor – Appendix M
Figure 30: Mixing and Loading Station – Appendix M
Figure 31: Lime Sulfur being poured – Appendix M
Figure 32: Pouring Pesticide into Applicator on Back of Tractor – Appendix M
Figure 33: Field Team: From Left, Miyoko Abigail, Maria, Kit and Pablo – Appendix M
Figure 34: Average Differences in Concentration for Unknown Alkanes at Site A (ug/L)
Figure 35: Average Differences in Concentration for Unknown Alkanes at Site B (ug/L)
Figure 36: Mean Concentration Non-aromatic Hydrocarbons at Site A (ug/L)
Figure 37: Mean Concentration Non-aromatic Hydrocarbons at Site B (ug/L)
Figure 38: Mean Concentration for Unknown Alkanes at Site A (ug/L)
Figure 39: Mean Concentration for Unknown Alkanes at Site B (ug/L)
Figure 40: Mean Concentration for Triemthyl benzene (ug/L)
Figure 41: Mean Concentration for Chlorpyrifos
Figure 42: Mean Concentration for Chlorpyrifos Oxon
Figure 43: Mean Mass of Unknown Alkanes at Site A
Figure 44: Mean Mass of Unknown Alkanes at Site B

x
Figure 45: Mean Mass of Pentadecane at Site A
Figure 46: Mean Mass of Pentadecane at Site B
Figure 47: Mean Mass of Non-aromatic Hydrocarbons at Site A
Figure 48: Mean Mass of Non-aromatic Hydrocarbons at Site B
Figure 49: Mean Mass of Unknown Aromatics at Site A
Figure 50: Mean Mass of Unknown Aromatics at Site B
Figure 51: Respirators- Frequency of Hits by Site
Figure 52: Respirators- Frequency of Hits by Time
Figure 53: Gloves: Frequency of Hits by Site
Figure 54: Gloves: Frequency of Hits by Time
Figure 55: Gloves: Frequency of Hits by Location

xi
List of Tables
Table 1: Amount of Field Samples for Respirators
Table 2: Amount of Field Samples for Gloves
Table 3: Measurements of Media – Appendix C
Table 4: Calculations of Flow Rates for Ambient Sample with Charcoal Tube – Appendix C
Table 5: Summary of Flow Rates of Ambient Air Samples with Charcoal Tubes – Appendix C
Table 6: Summary of Flow Rates of Cartridge Samples with Cassettes – Appendix C
Table 7: Summary of Flow Rates of Cartridge Samples with PUF Tubes – Appendix C
Table 8: DryCal flow rate and Bubble burette flow rate – Appendix D
Table 9: Amount of Each Kind of Media Used for Respirators – Appendix E
Table 10: Total Number of Samples for Gloves – Appendix E
Table 11: Glove Thickness- Appendix F
Table 12: Calibration Data from Ambient Sample with SKC Personal Pump – Appendix G
Table 13: Calibration Data from Cartridge Sample with Leland Legacy Pump – Appendix G
Table 14: Supplies for Respirators – Appendix I
Table 15: Supplies for Gloves – Appendix I
Table 16: Quality Control Spiking Solution – Appendix K
Table 17a and b: Demographic Data for Respirators – Appendix N
Table 18: Demographic Data for Gloves- Appendix N
Table 19: Quality Assurance for Charcoal Cloth Circles- Appendix O
Table 20: Quality Assurance for Charcoal Tubes- Appendix O

xii
Table 21: Quality Assurance for Glove Charcoal Cloth Circles at Site A- Appendix O
Table 22: Quality Assurance for Glove Charcoal Cloth Circles at Site B- Appendix O
Table 23: Unknown Alkanes Concentrations
Table 24: Concentrations of Non-aromatic Hydrocarbons
Table 25: Concentrations of Unknown Aromatics
Table 26: Concentrations of Siloxanes
Table 27: Concentrations of Trimethyl Benzene
Table 28: Concentrations of Chlorpyrifos
Table 29: Concentration of Chlorpyrifos OxonCharcoal Cloth Blanks- Appendix O
Table 30: Mass of Unknown Alkanes
Table 31: Mass of Pentadecane
Table 32: Mass of Non-aromatic Hydrocarbons
Table 33: Mass of Unknown AromaticsTable 26: Gloves Blanks- Appendix O
Table 34: Charcoal Tube Blanks- Appendix P
Table 35: Charcoal Cloth Blanks- Appendix P
Table 36: Glove Blanks- Appendix P
Table 37: Adjusted Mass for Ambient Samples
Table 38: Adjusted Mass for Cartridge Samples
Table 39: Mass to Mass Ratio
Table 27: Adjusted Mass for Ambient Samples- Appendix P
Table 28: Adjusted Mass for Cartridge Samples- - Appendix P

13
Chapter 2: Introduction
For decades pesticides have been acknowledged as harmful not only to pests, but to
humans who come in contact with them as well. It was not until years after Rachel Carson‘s
book, Silent Spring, that many people began to take notice of the harm that pesticides can do.
Many studies have been done to test the hazards of various pesticides and the best ways to be
protected from them. With the new trend of eating organic foods, many people are aware of
pesticides on the food they eat, but fewer think about the hazards that the pesticide applicators
themselves face daily as part of their jobs.
Since there are many varieties of pesticides that are used in America‘s agricultural
production, there are many different levels of hazards. These products harm living organisms
(pests), and so therefore they can do great harm to people as well. Storage of chemicals,
preparing the sprayer, handling and mixing of chemicals and field applications are all parts of the
pesticide process that can be hazardous to humans, both through inhalation, ingestion and
absorption through skin (Baker , 1997).
Apple orchard workers in places such as Yakima Valley in Washington, like millions of
other farmers around the country, use pesticides as a way of maximizing the profit for the apples
that they sell. The pesticide that these particular farmers use are Lorsban-4E, which is largely
made up of chlorpyrifos, an organophosphate. Coupled with Lorsban-4E is Supreme Oil, which
contains hydrocarbons and other solvents that also may be harmful to humans. Although these
pesticides are still widely used, they present many hazards. The workers wear complete Personal
Protective Equipment (PPE) while working on the farms spraying pesticides, but it is uncertain if

14
enough protective measures are being taken. These farmers wear 15 mil reusable nitrile gloves,
Tyvec Chem resistant suits, chemical resistant goggles, chemical resistant boots, hats, and an
organic vapor (OV) respirator cartridge with an R-95 pre-filter. The respirator cartridges are
changed out once a day, or after an 8 hour shift; whichever is longer. Questions have been raised
about whether the 8 hour a day single change out schedule for the organic vapor and pre-filter
combination used with half mask air purifying respirators is adequate or not. There have been
some studies where breakthrough times for cartridges and chemicals have been determined in
controlled atmospheres and in laboratories, but these tests do not simulate the situations that are
encountered in the agricultural setting and therefore cannot provide accurate data to help answer
the question of change out time. To determine breakthrough time for the specific combination of
an organic vapor cartridge and an R95 pre-filter that is typically worn for the pesticide
application, sampling media will be used to test the airborne concentrations of solvents and oils
and chlorpyrifos that are generated by the application of the pesticides with the air-blast
sprayers.
Another form of PPE, the reusable gloves, is also not replaced very frequently, and it is
uncertain if there is dermal exposure due to breakthrough from the gloves. Therefore, the
airborne concentrations of the chlorpyrifos and some solvents and oils will be measured by
placing patches on the inside of the gloves. The same compounds that were tested for inside the
respirators will be tested for inside of the gloves.
Both of the types of PPE that is being evaluated will be tested for breakthrough twice a
day, or have a change-out of sampling media during the workers‘ lunch break. If there is
breakthrough after only half a day, or if the amount of solvents detected in the afternoon
sampling media is greater than the solvents detected in the morning media, then this will show

15
that the workers should be changing out their PPE more frequently than the once a day change
out that they currently do, and will provide a rough time schedule of when change-out should
occur.
Samples will be taken to evaluate the effectiveness of the respirator cartridges by taking
matched pairs of ambient samples and samples behind a respirator cartridge to see the difference
in air concentrations, and then to determine a workplace protection factor. Samples will be taken
to evaluate the effectiveness of the 15 mil nitrile gloves on the front and back of the hand to
determine if there is breakthrough through the gloves and where the breakthrough is the most
prevalent (Introduction and project proposal adapted from grant proposal written by Galvin, et.
al.)

16
Chapter 3: Background Information
This background section will discuss in more detail the pesticides that are used, the
hazards that are faced by farmers as they apply the pesticide, and the current practices of
application and awareness of hazards.
3.1: Chlorpyrifos
Lorsban-4E, which is the insecticide that the apple orchard workers will be using, is
generally used for the control of certain insects that infest field, fruit, nut, and vegetable crops. It
should not be applied directly to water, as drift and runoff may be hazardous, and is combustible.
It should not be applied in a way that will contact other workers or other people in the vicinity,
particularly in the case of insecticide drift. Lorsban is considered an emulsifiable agent for use
in certain listed crops. In addition, it resists wash-off once it is dry (Dow AgriSciences 2007).
The active ingredient is chlorpyrifos: O, O-diethyl-O- (3,5,6 –trichloro-2-pyridinyl)
phosphorothioate, which accounts for 44.9% of Lorsban. Also, the mixers and loaders using the
mechanical transfer loading system must wear chemical-resistant gloves, a chemical resistant
apron, a NIOSH- approved dust mist filtering respirator with MSHA/NIOSH approval number
prefix TC-21C or a NIOSH-approved respirator with any R,P, or HE filter. There are certain
engineering controls that are also in place, such as the requirement to wear the personal
protective equipment, protective eyewear, and be aware of what to do in an
emergency(DowAgriSciences, 2006).
Chlorpyrifos is classified as an organophosphate, which is an ester with phosphoric acid.

17
Organophosphates are in many common pesticides and present a serious health hazard to
millions of pesticide applicators. The organophosphate group affects the functioning of the
nervous system, and is among EPA's highest priority for review under the Food Quality
Protection Act (Environmental Protection Agency, 2002). Chlorpyrifos can cause cholinesterase
inhibition in humans, and is classified as a neurotoxin. The most common exposure pathway is
inhalation (US EPA). The symptoms of Chlorpyrifos poisoning can appear within minutes or
hours after exposure. These symptoms can last for days or weeks as the body works on replacing
the depleted enzymes in the nervous system so that it can function properly again. Exposure to
small amounts of chlorpyrifos can cause runny nose, tears, increase saliva, sweating, headaches,
nausea, and dizziness. Greater exposures can cause vomiting, abdominal muscle cramps, muscle
twitching, tremors and weakness, and loss of coordination. Severe poisoning can lead to
unconsciousness, loss of bladder and bowel control, convulsions, difficulty in breathing, and
paralysis (Environmental Protection Agency, 2002). In addition to affecting the nervous system,
chlorpyrifos can also affect the cardiovascular and the respiratory system, as well as being a skin
and eye irritant (National Pesticide Information Center, 2010). People who have certain
respiratory ailments, cholinesterase impairment, or liver malfunctions can be at greater risk from
exposure to chlorpyrifos (Dow, 2012). Chronic effects of chlorpyrifos can include many of the
same symptoms as that from acute exposure, but can also include impaired memory and
concentration, disorientation, confusion, irritability, depression, speech difficulties, and insomnia
(Environmental Protection Agency, 2002). Once there is exposure, chlorpyrifos quickly spreads
all over the body. chlorpyrifos is not toxic in its pure form, but it creates a toxic form called
chlorpyrifos oxon when the body attempts to break it down. chlorpyrifos oxon binds
permanently to enzymes in the body that control the messages that travel between neurons,
leading to nerves and muscles not functioning correctly. However, generally the body can break

18
down chlorpyrifos oxon in small amounts and it will be excreted in the urine or feces within a
few days (National Pesticide Information Center, 2010) The NIOSH Recommended Exposure
Limit for chlorpyrifos is 0.2 mg/m3 (Organophosphorous Pesticides, 1994).
3.2: Horticultural Oil
Supreme Oil is also an insecticide that will be used by the workers that are being
monitored. The active ingredient is mineral oil. Long sleeved shirts and long pants are required
when using this insecticide, shoes plus socks, as well as chemical resistant gloves. Only
protected handlers may be in the area during the application of this product, and PPE is required
for entry into an area within four hours of application. It cannot be applied when winds are
greater than 15 mph, due to wind drift. It must be released at a height of no more than four feet,
or if an aerial application a height no more than 10 feet (Loveland 2010). In order to measure for
contamination of supreme oil, according to the NIOSH standards for aromatic hydrocarbons, a
solid sorbent tube (100mg/50mg) must be used, with gas chromatography for measurement. The
reagents of hydrocarbons can include carbon disulfide, low benzene, and chromatographic
quality (Aromatic Hydrocarbon 2012).
Any horticultural oil that is being used contains amounts of hydrocarbons. Most of the
dangerous hydrocarbons are derived from petroleum distillates and include aliphatic
(straightchain) hydrocarbons and aromatic (benzene-containing) hydrocarbons. Respiratory
symptoms can begin in the first few hours after exposure to hydrocarbons. Most of these
symptoms are resolved after 2-8 days, but there can be complications that may include hypoxia,
barotrauma due to mechanical ventilation, and acute respiratory distress syndrome. Prolonged
exposure to aromatics and aliphatics may result in encephalopathy, seizures, and death
(Goldstein et al.2011).

19
The NIOSH approved REL for aromatic hydrocarbons is 3.5 mg/m3 (Aromatic Hydrocarbon
2012).
Trimethyl benzene is also something that can be harmful in the pesticides that are being
applied. Any direct contact with 1,2,4-trimethyl benzene is irritating to the skin and breathing
the vapor is irritating to the respiratory tract, which can pneumonitis. Breathing high
concentrations of the chemical vapor causes headache, fatigue, and drowsiness (EPA, Office of
Pollution Prevention and Toxics, 1994). The NIOSH REL is 125 mg/m3 (CDC NIOSH, 2010).
3.3: Current Practices
The farmers in Yakima Valley undergo training through cooperation with Washington
State University Cooperative Extension and other members of the farming community. Hands on
handler training was implemented in the late 1990s. There is a daylong training session, which
provides pesticide safety training by use of interactive techniques. According to the training
website, some of the goals for undergoing this training are to: ―Provide high-quality, relevant
training to pesticide handlers, increase the training potential within the Hispanic community, and
increase training opportunities by partnering with the agricultural community to sponsor handson
training events‖ (Washington State Department of Agriculture). It is thought that this type of
training is very effective because both the trainers and the trainees are valued for the experience
and knowledge that they bring to the table (Washington State Department of Agriculture).

20
Chapter 4: Literature Review
According to an article about the Bureau of Mines, It is well known that respirators are
the last resort for protection from harmful solvents. If at all possible, according to the hierarchy
of controls, administrative or engineering controls should be used first to protect the individual
worker without resorting to Personal Protective Equipment. However, quite frequently industrial
hygienists view respiratory protection as the be all end all for inhalation exposure, but there are
not really schedules that are in place for certain types of exposure. These are just some of the
problems that the Bureau of Mines has with certain types of respirators (Jordan, 149).
However, there have been previous studies on the effectiveness of respirators in the
workforce. Sampling inside of a respirator cartridge has always been a problem, as there is not a
good way to put sampling media on the internal side of a cartridge. However, many creative
ways have been developed to sample the amount of breakthrough through the cartridges.
A study was done in that looked at the effectiveness of respirators in a paint plant in Iran.
The respirator cartridges were previously only changed out every 48 to 72 hours, but it was
established that they should be changed out every four hours. Direct reading instruments were
used to measure for breakthrough of the respirators, and tested for benzene, toluene and xylene.
A sampling train was created that went from the respirator to a direct reading instrument that was
attached to a pump. The set up was set up in the vicinity of the workers in order to get an
accurate assessment of their exposure. All of the pumps were calibrated using a calibrated

21
rotameter. The results of the study were that ultimately established that ventilation and other
engineering controls would be useful for countering the effects of the respirators.
(Karimi, et al, 2013). Another study was done at a Japanese plastics factory, and the
effectiveness of the respiratory protective equipment that was worn was evaluated. However, in
this study, there were three types of respirators that were evaluated, but one was a half mask OV
respirator. The methodology for doing this study was comparing the amounts of styrene that was
extracted from passive samplers that were placed on the collars of the workers and urinary
samples collected from the workers, which showed the amount of styrene that the workers had in
their body. The results of this study showed that the amounts of styrene that the workers were
exposed to, which was measured in ppm, exceeded the exposure limit for safe work. (Nakayama
et al, 2013)
In another study, Styrene was measured in the breathing zone and inside the face piece of
air-purifying half mask respirators worn by workers while they were making fiberglassreinforced
bathtubs and shower stalls. The participants were fit tested for half mask respirators according to
protocol, and probes were inserted into the cartridges. These were the same probes that were
used for fit testing of respirators. Charcoal solvent tubes were attached to the probe, which was
attached outside of the mask. The sampling train apparatus was worn by the workers for an hour
shift, which is the same amount of time that they would normally wear the respirators to do their
work. Styrene concentrations were measured outside of the breathing zone. Air samples were
collected inside and outside the respirators simultaneously. This study was primarily done to
measure the fit of the respirators, and it established that with different people, who obviously
have different face shapes, there are different fits (Galvin et al, 1990).

22
Generally, in the agriculture world, employers are not willing to spend a great deal of
money on the protection of their employees. Therefore, it can be difficult to persuade people to
buy new respirator cartridges, when it may be the preference to just reuse the cartridges.
Therefore, in a study on reusability of respirator cartridges- an equation was developed.
(Wood et al., 2011).
This project clearly will be a bit different than the previous projects because it deals with
personal protective equipment for agriculture use. In one study, respiratory health hazards from
organic dust in grain handling and poultry and swine livestock productions was analyzed.
Qualitative evaluations were conducted on which respirator the workers most preferred. Personal
samples were attached to the workers, with closed faced cassettes attached to personal air
sampling pumps. In mask samples were collected using an aluminum probe to the front of the
respirator. However, the effectiveness of this method and the probe are yet to be evaluated.
There was a large amount of variability of performance within the kind of mask, which indicates
that some workers do not experience very much protection. Generally the half mask was
preferred by various workers, but did not have as great of a WPF as a powered air purifying
helmet. (Popendorf et al.,2011). There has also been a study that was done to evaluate the
effectiveness of tractor cabs to prevent exposure to pesticides that was done (Heitbrink et al.,
2003).
A new system was used to determine the workplace protection factors (WPF) for dust
and bio-aerosols in agricultural environments. In short, the sampling system consisted of two
sampling lines (in-face-piece and ambient sampling lines) that were used to collect particle
samples inside and outside the respirator. Airborne dust and microorganisms were sampled

23
through the sampling probes at a flow rate of 10 L/min and drawn through Tygon tubing to a
metal sampling chamber at the end of each sampling line. A portion of each aerosol flow (2.8
L/min) was sampled from the chamber into an optical particle counter for dust measurement.
The rest of the aerosol flow (7.2 L/min) passed through a filter sampler that collected the
airborne microorganisms. Thus, the APF of 10 for N95 filtering facepiece respirators seems
inadequate against microorganisms [Figure 1] (Lee, et al 2005).
Figure 1: Method for Sampling Inside Respirators

24
In another study, the quantitative fit tests were evaluated. Currently, all Quantitative Fit Tests
performed by aerosol detection are conducted with a sampling probe imbedded in the respirator body
in the breathing region between nose and mouth or at the mouth. This idea has been used to attempt
to determine a methodology for how to sample the inside of the respirator. Disposable sampling
probes were designed to be compatible with different filtering face-piece respirators so that the
wearers would be able to choose different brands of respirators for the fit test. Therefore, based on
the principle of the fit test setup, a portable personal sampling setup has been designed in this study
for measuring the concentrations of dust and microorganisms inside and outside a respirator. This
study therefore adapted conventional quantitative fit testing that would be performed in a laboratory
setting, for field use in workplace environments (Lee 2004).

25
Chapter 5: Significance and Necessity
This project has a connection to the DEOHS MA/AF mission, with the focus on specific
measures to reduce pesticide exposure for Washington State workers. The study results will
target larger audiences than just the agricultural community; the results will be disseminated to
the individual participants, the agricultural community, and other planned PNASH dissemination
activities.
There is a great necessity for this project. The overall project covers the testing of three
different kinds of PPE: respirators, gloves, and testing for personal protective hats, which is not
covered in this study. The need for the evaluation of these types of PPE have been identified but
not yet addressed by the Intervention project‘s Expert Working Group. This project is important
because it will have an evaluation of breakthrough for chemical mixtures at air concentrations
during the work activity. In addition, conducting this study in the field will provide data that is
directly relevant to workers in Washington State, or to many other workers in the occupation of
applying pesticides. Also, the methodology that was created will be able to provide the basis for
further development of this methodology for sampling in this manner for many other industrial
hygiene applications. This is a pilot study, so this may provide a baseline for further use of these
methods and the realization that more study is needed on this topic in the future.
There have been some breakthrough times that have been determined for single
chemicals, including carbon tetrachloride and liquid particulates, but these studies have been
done in the lab, and limited studies have actually taken place concurrent with workplace
conditions. The laboratory testing does not reflect all of the conditions that would be

26
encountered in the agricultural workplace, and therefore cannot provide adequate data to
satisfactorily answer the change out schedule question (NIOSH 2006, 2007).

27
Chapter 6: Specific Aims
For this project, the current PPE used during the application of pesticides where agricultural
workers are concerned will be evaluated. The specific aims are as follows:
1. To create a sampling train that can be used to simulate respirator use
The sampling train will consist of a respirator cartridge (identical to the ones that the
workers wear), sampling media, various tubing, and two pumps to create a sampling train
that can be used to simulate a worker breathing. There will be a sampling train to
measure the ambient air concentrations compared to a sampling train that will measure
the air concentrations when filtered through a respirator cartridge.
2. To evaluate a respirator cartridge and filter combination to determine its’
effectiveness.
The matched sampling train set with the sampling media will be attached to a tractor
close to an applicator‘s breathing zone and should collect the chlorpyrifos and oils and
solvents that are present in the pesticides and the pump will be representative of the
employees‘ breathing rate.
3. To determine whether nitrile gloves provide adequate protection against dermal
exposure to agricultural oil

28
Dermal patch testing will be used to test for solvents and oil breakthrough that would
result in dermal exposure. Patches will be placed on the palm and the back of the hand to
determine where the breakthrough is most likely if breakthrough occurs.
4. To share the results of this study with each participant and agricultural worker, as well
as the agricultural community and anyone else that the data would apply to.

29
Chapter 7: Design and Methods
All of these designs and methods that are described below are based on an evaluation of
the PPE that is actually worn under field conditions while the handlers apply pesticides, and will
include a functionality or efficacy component. This study will determine if the respirators and
gloves are capable of providing adequate protection under typical field use conditions. A
comprehensive list of materials including serial numbers that were used in the respirator and
glove project can be found in Appendix A.
7.1: Design
The Primary Question: Is the current practice of respirator change out and glove change
out adequate? Sampling of media will determine the time and the magnitude of breakthrough due
to chlorpyrifos, oils and solvents.
H0: βdifference in breakthrough = 0: The null hypothesis is that there is no difference
between the air concentrations of chlorpyrifos, solvents that are found in the
cartridge sampling train and the ambient sampling train.
Ha: βdifference in breakthrough ≠ 0: The alternative hypothesis is that there is a
difference between the air concentrations of chlorpyrifos, solvents and oils that
are found in the cartridge sampling train and the ambient sampling train, or that
the cartridge has a protective effect.

30
For the respirator portion of the project, it was necessary to determine how much
chlorpyrifos, oils and solvents would breakthrough while the respirator was being used in an
occupational setting. Since the breakthrough would be very difficult to measure while someone
is wearing a respirator cartridge, a sampling train was to be created that would be exposed to the
same amount of pesticides that the applicator is exposed to without the necessity of actually
measuring a respirator while it is being worn by an applicator. Side by side air samples, or a
matched set, were to be collected to test the ambient air concentration and for the amount, if any,
that breaks through the cartridge/filter combination. Matched sets were created for sampling both
the solvents and oils and for sampling the chlorpyrifos, so there were two matched sets, or four
total sampling trains (ambient solvents, cartridge solvents, ambient chlorpyrifos, and cartridge
chlorpyrifos). Charcoal media was used to sample for solvents, and PUF media was used to
sample for chlorpyrifos.The approximate time that it takes for the breakthrough (if any is
evident) to occur was also to be measured. The sampling train for the ambient sample was to
consist of a charcoal tube or a PUF tube, an SKC personal pump, and tubing to connect it. The
sampling train for the sample behind the cartridge (hereafter referred to as cartridge sample) was
to consist of a R95 respirator cartridge with pre-filter attached to either a charcoal tube or a PUF
tube, a Leland Legacy Pump, and tubing for connection. The sampling trains were to be
positioned close together and attached to a tractor close to the workers breathing zone, since it is
easier to attach to a tractor than to an actual person, and this can also help minimize interference
from the worker and can side step the challenge of inside respirator sampling for multiple
chemicals. The pumps from the sampling train were to be placed in a clear polycarbonate case
with holes drilled in the top for the tubing of the sampling train to come out of. The sampling
media and the respirator cartridge were to be on the outside of the sampling train.
31
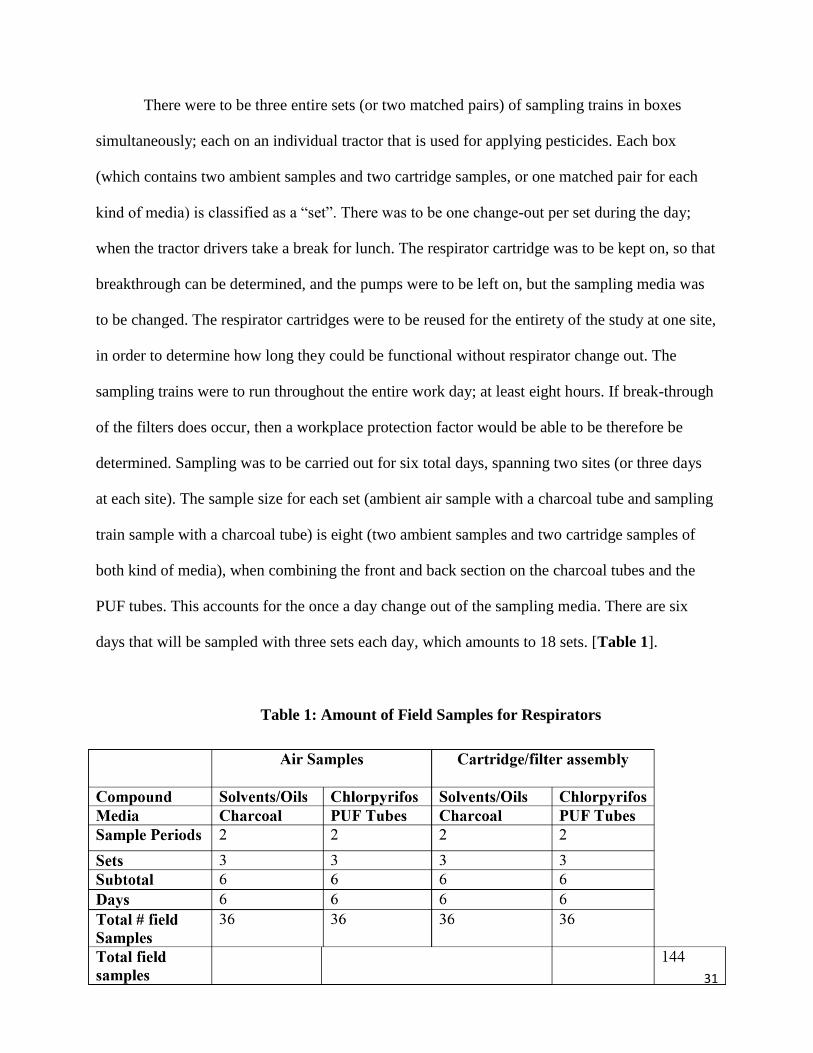
There were to be three entire sets (or two matched pairs) of sampling trains in boxes
simultaneously; each on an individual tractor that is used for applying pesticides. Each box
(which contains two ambient samples and two cartridge samples, or one matched pair for each
kind of media) is classified as a ―set‖. There was to be one change-out per set during the day;
when the tractor drivers take a break for lunch. The respirator cartridge was to be kept on, so that
breakthrough can be determined, and the pumps were to be left on, but the sampling media was
to be changed. The respirator cartridges were to be reused for the entirety of the study at one site,
in order to determine how long they could be functional without respirator change out. The
sampling trains were to run throughout the entire work day; at least eight hours. If break-through
of the filters does occur, then a workplace protection factor would be able to be therefore be
determined. Sampling was to be carried out for six total days, spanning two sites (or three days
at each site). The sample size for each set (ambient air sample with a charcoal tube and sampling
train sample with a charcoal tube) is eight (two ambient samples and two cartridge samples of
both kind of media), when combining the front and back section on the charcoal tubes and the
PUF tubes. This accounts for the once a day change out of the sampling media. There are six
days that will be sampled with three sets each day, which amounts to 18 sets. [Table 1].
Table 1: Amount of Field Samples for Respirators

32
The workers also wear a thick reusable nitrile glove, but this may not provide adequate
protection. The main issue with these gloves is that they are not the recommended material for
Lorsban 4E, since solvents are part of the formation of the glove (Dow Agrisciences 2007). In
the US EPA Chemical Resistance Category Chart, Vitron and barrier laminate are recommended
for materials for gloves (US EPA 2012). However, these gloves are not entirely compatible with
pesticide application tasks and can be very expensive, nor have they been adopted with the
industry. A dermal patch is to be attached to the skin under the glove in order to determine
whether there is dermal exposure to solvents under the gloves. Initial bench studies by the
Department EH lab will be conducted to determine the most suitable media for the chlorpyrifos
and horticultural oil dermal patch.
For gloves, the design was approached in a different way. It was necessary to test the
gloves that the applicators usually wear to see if they are effective enough for the job that they
are being used for. A PermaTech charcoal patch and a foam circlewas attached to the inside of
the glove on both the palm of the hand and the back of the hand to test for solvents and oils and
chlorpyrifos, respectively. The charcoal cloth circle was adhered with aluminum foil tape to
ensure that it stays in the correct placement on either the palm or the back of the hand, and the
foam patch was attached with medical tape covered by aluminum foil tape.
Three applicators at each site, who are classified as ―subjects‖, are to wear a set of two
patches on their dominant hand each morning and afternoon that they apply oils and solvents
with pesticides for three days. There will be one change out at their lunch break. One of the
patches was to be on the palm side, and one was to be on the back side of the hand. The solvent
patches will be attached in the same location on both the palm of the hand and on the back of the
hand each time that they are changed out, and the gloves will be reused by the same workers for

33
the entirety of the study, in order to test for dermal breakthrough over time. The amount of
pesticide applied by the applicator, the number of tanks, the duration of application, and the
timing and duration of the spray and the break periods will be recorded [Table 2].
Table 2: Amount of Field Samples for Gloves
Each of the samples were to be taken back to the EHS lab and analyzed for various
compounds. Then, a breakthrough time was to be determined, as well as a workplace protection
factor.
7.2 Methods in Lab and Field
This section illustrates how the design was carried out and changed; both the preparation
in the lab and the carry out of the design in the field work, as well as with the methods of the
analysis of the results. Initially, this project was meant to measure the amount of chlorpyrifos, as
well as oils and solvents that the tractor drivers were exposed to. However, due to weather
conditions and other factors, only one day of chlorpyrifos sampling happened. Therefore, the
research project was focused on the oils and solvents, of which there is more data. The results

34
were still reported for the chlorpyrifos data, but the majority focused on the solvent data. The
methods used for sampling chlorpyrifos can be found in Appendix B.
7.2.1: Pump Flow Rates
A pump was used on the sampling train to simulate the lungs of the applicators. Many
factors are involved with inhalation exposures, since the oxygen exchange with carbon dioxide
takes place in the distal portion of the lung, and so therefore, lung volume is also dependent on
many factors. In regards to the activity level of the apple orchard farmers, as they were driving
tractors all day, their activity can be defined as sedentary, since driving the tractors does not
require a great deal of movement. Assuming that the workers are in the age range of
approximately 21 to 60, an average inhalation range of 8.2 L/min will be used. It should be noted
that these amounts are regarding short term exposure values (Salem and Katz 28).
Therefore, the Leland Legacy pumps that were attached to the cartridge sampling train
were calibrated to run at 8 L/min (8 L/min was used instead of 8.2 L/min in order to make
calibration of the pumps easier) to simulate this breathing rate as closely as possible. However,
the ambient sample was not attached to a respirator, and therefore did not have the interference
that a respirator cartridge could bring. The face velocities at the entrance of both the ambient
sample and the respirator cartridge had to be matched so the sampling media would have an
equal amount of solvents drawn into it, so therefore the ambient sample had to be set to run at a
much lower flow rate.
The face velocity was calculated by using the formula of flow rate divided by area. The
diameter of a charcoal tube (the media for the ambient sample) was measured. Using the flow
rate of 8 L/min, the face velocity of the respirator cartridge was calculated, which was set equal
35
to the face velocity of the charcoal tube. Using this face velocity, the flow rate of the charcoal
tube for the ambient sample could be calculated [Appendix C]. The flow rates for the ambient
samples for charcoal were 1.037 L/min, and the flow rates for the cartridge samples were 8
L/min.(The flow rates for the ambient samples for PUF tubes were 4.62 L/min, and the flow rate
for the cartridge samples was again 8 L/min).
The Leland Legacy Pumps would flow fault when they were attached to a charcoal tube,
used as the sampling media for the solvents and oils. Therefore, since charcoal or carbon was
required for the cartridge sampling train to match to the ambient sampling train, charcoal cloth
inside cassettes was used as sampling media instead.
7.2.2: Lab Preparation
There are several preparations that were made in the lab prior to work in the field.
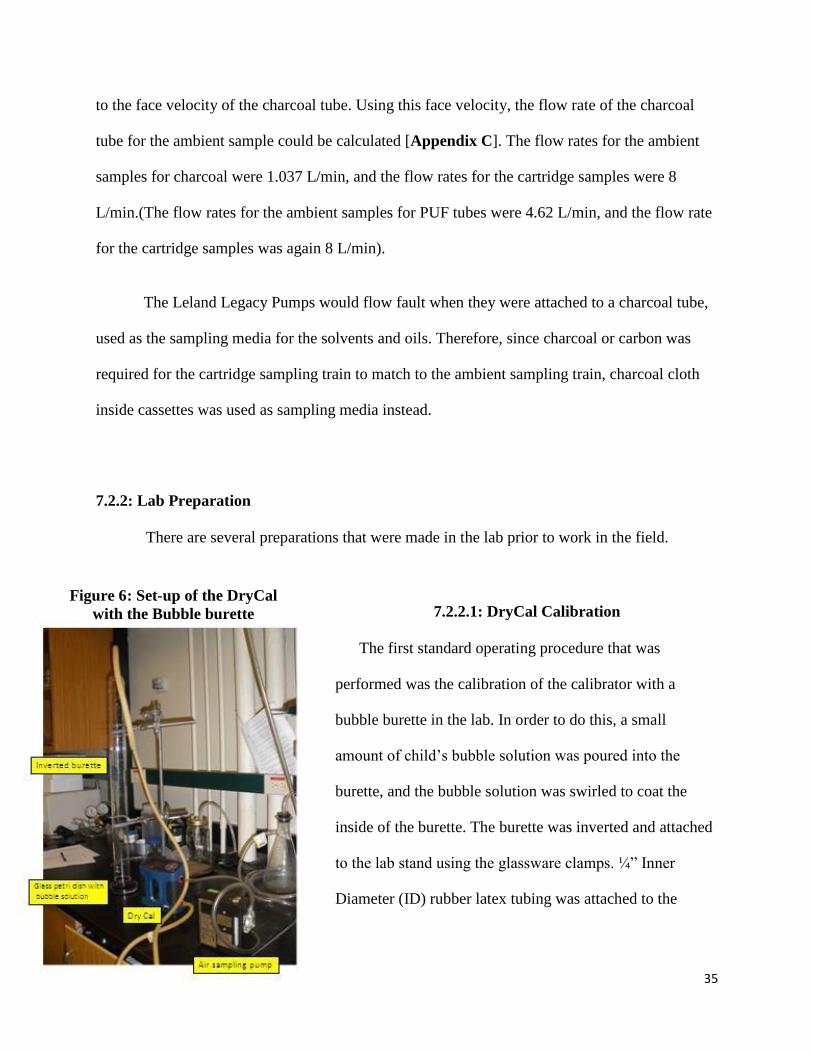
7.2.2.1: DryCal Calibration
The first standard operating procedure that was
performed was the calibration of the calibrator with a
bubble burette in the lab. In order to do this, a small
amount of child‘s bubble solution was poured into the
burette, and the bubble solution was swirled to coat the
inside of the burette. The burette was inverted and attached
to the lab stand using the glassware clamps. ¼‖ Inner
Diameter (ID) rubber latex tubing was attached to the
Figure 6 : Set - up of the DryCal
with the Bubble burette

36
inverted burette and the other end of the rubber latex tubing was attached to the bottom inlet of
the DryCal. Another extension of ¼‖ ID Latex tubing was attached to the top inlet of the DryCal,
with the other end of the tubing connected to the Leland Legacy Pump [Figure 2]. The glass
petri dish was partially filled with bubble solution and placed below the inlet of the burette,
without letting the top layer of the bubble solution touch the burette inlet. Once the burette and
calibration train has been set up, the pump and DryCal was turned on and the pump was set to 8
L/min, since that is the highest flow rate that will be run in the field. The bowl was briefly lifted
to the burette rim so that the top layer of the bubble solution in the bowl touches the rim of the
burette and a thin bubble is formed that traveled up the length of the tube. This process was
repeated several times to re-coat the inside of the burette with bubble solution; timed trials were
not started until bubbles were able to travel the entire length of the burette without popping. For
timed trials, the DryCal was reset by re-starting it and briefly touching the top layer of the bubble
solution in the bowl to the burette rim so that a thin bubble is formed. When the bubble reached
the 1,000 mL mark on the inverted burette, the stopwatch was started, and when the bubble
reaches the 0 mL mark on the inverted burette, the stopwatch was stopped, and then the DryCal
was stopped. The travel volume (which should be 1,000 mL), the travel time, and the flow rate
displayed on the DryCal were all recorded on the calibration sheet. Each of the timed trials was
repeated three times with the Leland Legacy Pump. Then, the entire procedure was repeated with
the SKC personal sampler pump (when connecting the DryCal to the SKC pump, the ¼‖ Tygon
tubing was still used), with the flow rate at 1.038 L/min instead of 8 L/min.
The DryCal average per pump speed setting was recorded. Then, the pump had time to
equilibrate (approximately 2-3 minutes) before repeating the burette coating and the timed trials
at other flow rates.

37
The bubble meter flow rate (in L/min) was calculated by dividing the bubble travel volume
(1,000 mL) by the bubble travel time. This was repeated for each trial.
Flow rate (L/min) = travel volume (L)
travel time (min)
Then, the DryCal flow rate versus the bubble meter flow rate was plotted and a linear model was
fit to the data. The slope equation was calculated from the data (the calibration curve) y = mx + b
• y = rotameter reading in L/min
• m = slope
• x = DryCal reading I L/min
• b = y- intercept
The equation of the best-fitting line was used to adjust the DryCal flow-rates to be equivalent
to the desired ―true‖ flow-rate. The line of best fit for the DryCal verses the bubble burette flow
rate is y= .9997x +.0003, and the r2 value is 1. See Appendix C for the data and graph on the
DryCal flow rates as compared to the bubble burette.
7.2.2.2: Media Preparation
In order to calibrate and successfully set up the media, (the charcoal tubes and the
charcoal cloth circles) to be sampled, there were several preparations that had to take place in the
lab prior to going out into the field. The ideal total number of media needed was calculated, and
is shown in Appendix E. For the respirator project, 50 samples of each different kind of media
were to be prepared (since each sample has two charcoal cloth circles on it, the number was

38
doubled for that). Therefore, 50 charcoal tubes were prepared, and 100 charcoal cloth circles
were prepared. For the glove project, 70 samples of PermaTech charcoal patches were needed.
7.2.2.2.1: Preparation of Charcoal Tubes
The 1800/200 mg charcoal tubes that were used in the ambient sampling train to measure
solvents and oils had to be cut in the lab prior to going out into the field. The glass charcoal
tubes were to be cut with a clean break at the top of the tube, where there is no charcoal present.
It was important to have an even face all around the break, so that this would not affect the flow
of the particles into the charcoal tube. Safety glasses and glass proof gloves were required for
cutting the charcoal tubes, as well as a broken glass container. Once the safety equipment has
been put on, a small amount of dish soap was rubbed around where the desired cut will be. Then,
the charcoal tube was positioned onto the grove in the glass cutter at the desired place for the cut.
After the glass cutter and the tube were placed on a low surface, the glass cutter was closed and a
large amount of force was used to push on the glass cutter with the charcoal tube inside it while
rotating the tube once around (360 degrees) so that an even score is created. Then, the tube was
positioned on a pencil with the score at the top of the pencil, and a heavy clamp was used to hit
the top of the tube in order to break the scored section off. Once the charcoal tube glass had been
cut, all the broken glass was placed in a glass disposal area and the dish soap was carefully
wiped off the charcoal tube. Pliers were used, on a flat surface for safety, to attach plastic red
caps to the broken end to create a firm seal. Fifty 1800/200 mg charcoal tubes were cut in this
manner. Once the charcoal tubes were cut, they were stored in a plastic bag in a freezer.

39
7.4.2.2: Preparation of Charcoal Cloth Circles
For the sampling train with the respirator cartridge, charcoal cloth circles were used
instead of charcoal tubes, because the Leland Legacy pumps could not handle the back flow
from the charcoal tubes, and thusly would flow fault on a regular basis. In order to use the
charcoal cloth circles as sampling media, charcoal cloth was cut in circles that would fit a 37 mm
cassette. There were two charcoal cloth circles that were used for each sampling train; a front
section and a back section. To cut and prepare the charcoal cloth circles, a craft di-cut was used.
Gloves were used as protection from the charcoal cloth and to protect it from any human
impurities it may have gotten on it, and then the di-cut and a pair of scissors was rinsed with
acetone in a fume hood. The di-cut was used to cut 100 1.5 inch charcoal cloth circles, which
were placed in a plastic bag. Between the cutting of each charcoal cloth circle with the di-cut, a
.75 mm crochet hook, that had also been washed with acetone, was used to clean the charcoal
cloth fibers out of the di-cut so that it did not get jammed. Then, once all the charcoal cloth
circles were cut, they were cleaned in a Thermolyne oven with nitrogen. Using acetone-washed
forceps, about 50 charcoal cloth circles were placed in the metal tube that attaches to a line of
nitrogen in the Thermolyne oven. A stirring rod was used to push all the charcoal cloth circles
down into the metal tube. The charcoal cloth circles were placed stacked on top of each and
extended fully, so that they would all get an even amount of nitrogen as much as possible.
Wrenches were used to tighten the metal tube, which was then attached to the nitrogen valve
inside the Thermolyne oven. The charcoal cloth circles were heated in the oven at 260 degrees
Celsius for two hours.
Then, the oven door was opened so that the charcoal cloth circles could cool for another hour.
Once again with nitrile gloves, the charcoal cloth circles were unloaded using forceps and the

40
stirring rod onto a lab diaper. Each charcoal cloth circle was placed in a 4 mL vial using two
pairs of forceps and capped with the lid,
with great care to not puncture the
charcoal cloth circles with the sharp
forceps. As charcoal cloth is highly
absorptive, the charcoal cloth circles were
not exposed to air again until they were
ready to be used as sampling media.
Each cassette had a front and back
section, with separate charcoal cloth for
each section; separated by a middle ring. A porous plastic support pad was used behind the
charcoal cloth as a backing so that the charcoal cloth would stay flush and would not get sucked
into the cassette or puckered by the suction of the pump. In order to set up the 37 mm cassettes,
acetone washed forceps were used to insert two porous plastic pads into the plastic cassette
rings; one was flush with the gridded end of the cassette set, and the other was resting on the
middle ring, above it. Using forceps that have been acetone washed, a nitrogen cleaned charcoal
cloth circle was taken out of a 4 mL vial and placed on top of each porous plastic pad. See
Figure 8 for clarification on the cassette set-up.
7.2.2.3: Measuring Glove Thickness
There was also preparatory work that had to be done for the glove portion of the project
in the lab before going out into the field. In order to measure the amount of oils and other
solvents that were getting through the gloves that the pesticide applicators were wearing, the
TO PUMP
Luer ¼‖ tubing
Porous Plastic
Support Pad
Charcoal cloth
Front
section Middle Ring
Back S ection
Figure 8: Cassette Set Up

41
thickness of the gloves had to first be determined. 5 mil nitrile gloves were donned, which would
protect the test glove from any contaminants that could have been introduced by human
handling. A Mitutoyo dial thickness gage [Figure 9] was used to measure the thickness of the
gloves.
The gage was held at the handle so that the dial arrow rests at the zero marking. Once the bezel
was properly zero-set, the lifting lever was pushed down, with care that the spindle did not move
too quickly. The spindle moves up and the contact point moves away from the anvil. A small
(1)
(4)
(3)
(6)
(5)
(2)
Figure 9 : A Mitutoyo dial thickness gage.
1) Bezel
2) Handle
3) Contact Point
4) Anvil
5) Lifting Lever
6) Spindle

42
space is created which allows the test glove piece to be inserted between the contact point and
the anvil. A 15 mil glove, such as the pesticide applicators wear, was inserted so that the palm
side was between the contact point and the anvil. See Figure 10 to determine the parts of the
glove.
Once the glove was inserted, the spindle was slowly moved down to take a reading. The
location of the reading was selected on the palm side where the patch on the glove was expected
to be placed. The reading was recorded, and the procedure was repeated two additional times on
the palm side for a total of three thickness readings, and then the entire procedure was repeated
three times for the back side of the glove. See Appendix F for the glove thickness
measurements.
7.2.3: Calibration
In the field, pre-calibration and post-calibration for the pumps for the respirator project
was done every day. The methods are different for the calibration of the ambient as compared to
the cartridge sampling train, since each has different media and a
different pump.
7.2.3.1: Calibration of SKC Pump for Ambient Sampling
Media
One of the cut charcoal tubes that had already been prepared
was labeled as ―Calibration only‖ with lab tape and a Sharpie
Back side
Palm side
Figure 10 : Parts of the Glove

43
marker. Then, the unbroken tip of the charcoal tube was broken. After putting on safety glasses,
the unbroken tip of the charcoal tube was inserted into the smallest hole in the black glass cutter
and, over a broken glass container, the end was snapped. This one tube, labeled ―Calibration
only‖, was used as the only Calibration tube for the entirety of the project. An arrow was put on
the label that indicated which direction the air should be flowing, so the calibration charcoal tube
would never be inadvertently attached backwards. When it was time to calibrate, 3/8‖ ID Tygon
tubing was attached to each end of the charcoal tube. A ¼‖ to 3/8‖ reducing connector was
attached to the other end of each extension of 3/8‖ ID tubing, and then the other end of each ¼‖
to 3/8‖ reducing connector was connected to the ¼‖ ID Tygon tubing. The ¼‖ Tygon tubing was
connected to the SKC personal pump. The arrow on the label for the Calibration Tube was
always pointing towards the pump. The ¼‖ Tygon tubing attached to the other end of the
Calibration charcoal tube wasattached to the DryCal [Figure 11].

44
Once the Calibration sampling train was set up, calibration for the SKC personal pump to
be used for the ambient sampling train was possible. The pump was turned on and allowed to run
for one minute in order to stabilize the flow rate. A small 5/62‖ flat head screwdriver was used to
adjust the pump to as close 1.038 L/min as possible. The Defender DryCal was then turned on.
The ―Measure‖ icon was selected by pushing the ―Enter‖ button. The Defender was set to take
continuous measurements by clicking the left arrow to select ―Continuous‖. If the flow rate was
not in the 1.038 L/min range (with a .01 margin of error either way), then the screwdriver was
used clockwise to increase the flow rate or counterclockwise to decrease the flow rate until the
flow rate was at the desired amount, or 1.038 L/min. Once the flow rate is in the desired range,
the arrow keys were used to select ―Reset‖, and then ―Burst‖ was selected, which gives an
average of ten measurements. This average was recorded as the calibration level. The DryCal
Charcoal
tube
/8‖ tubing 3 3 /8‖ tubing
¼‖ tubing
¼‖ tubing
SKC pump
DryCal
Figure 11 Calibration Set : - Up for Ambient Sample with Charcoal Tube

45
Defender was then turned off, and for post calibration, the pump was also turned off, but for
precalibration, the pump was left on for its‘ sampling period. See Appendix G for the
calibration
data from all of the sampling days for the SKC personal pump for the ambient air samples.
7.2.3.2: Calibration of Leland Legacy Pumps for Cartridge Samples
Since the cartridge sampling train could not be securely fitted from the DryCal to the
pump due to the respirator cartridge as part of the sampling train, a gray calibration case was
used. The case gave an airtight seal, which ensured that there was a steady flow from the DryCal
to the Leland Legacy pump, while still allowing the respirator cartridge to be part of the
sampling train. 37 mm Cassettes were used in the Cartridge Sampling Train with the Leland
Legacy Pump instead of charcoal tubes to prevent flow faulting. After the cassette was set up in
the way that has already been shown in the media preparation section, a cassette was put together
with the charcoal cloth circles inside and labeled as ―Calibration‖. This cassette set up was used
for every calibration for Leland Legacy Pumps and Cartridge sampling trains. A label with an
arrow pointing toward the gridded end of the cassette set-up was used; the label (and the gridded
end)goes towards the pump. Luers were securely attached to each end of the cassette set-up. In
order to set up the rest of the sampling train, nitrile 5 mil gloves were donned. The R-95 prefilter
and cap was detached from the plastic backing, which was discarded. The R-95 pre-filter and cap
were attached securely to the North OV cartridge. This same cartridge and pre-filter was used for
all future calibrations for the Leland Legacy Pump and the cartridge sampling train. Teflon Tape
was then wrapped around the threaded side of a ½‖ to ¾‖ hose barb the side of thehose barb that
is threaded and was screwed into the matching threaded opening of the cartridge. The hose barb
46
was not screwed in completely, since the end of the hose barb was too long for the opening that
was in the cartridge, and would otherwise be pushing on the internal filter of the cartridge, which
could influence the air flow. Then, the ½‖ ID Tygon Tubing was attached to the extended end of
the Hose Barb. A ¼‖ to ½‖ reducing connector was attached to the ½‖ ID Tygon tubing. At the
other end of the ¼‖ to ½‖ reducing connector, ¼‖ Tygon tubing was attached. Then, the
Calibration cassette set-up was attached to the ¼‖ Tygon tubing, with the arrow facing away
from the cartridge. Another extension of ¼‖ Tygon tubing was attached to the other end of the
cassette set-up. The entire sampling train was then placed inside the grey calibration case, and
the extended ¼‖ Tygon tubing was attached to the left inlet on the inside of the case labeled ―to
pump‖. The grey calibration case was then shut and latched. ¼‖ Tygon tubing was attached to
the outlet on the left side of the grey calibration case that is labeled to pump. (This is the other
side of the inlet that the sampling train is attached to). The ¼‖ Tygon tubing was then attached to
the Leland Legacy pump. Since the tubing is slightly too small for the pump inlet, a Q-tip dipped
in Isopropyl alcohol was used to temporarily melt the inside of the ¼‖ Tygon tubing in order to

47
get a secure fit on the Leland Legacy Pump. Finally, another extension of ¼‖ Tygon tubing was
attached to the right side of the outlet on the outside of the grey calibration case that is labeled
‗To DryCal‘. The DryCal Defender was then attached to the extended end of the ¼‖ Tygon
tubing, thus completing an air-tight seal for calibration [Figure 12].
Once the Calibration sampling train was completed, the Leland Legacy Pump could be
calibrated. The Leland Legacy Pump can be turned on by pressing any button to get it out of
Sleep mode. Pressing the up and down arrow buttons simultaneously started the Leland Legacy
Pump to run. Once it was running, pressing star, up arrow, down arrow, star will cause the pump
to go into the ―Set-up‖ mode. The words ―flow rate‖ will appear and the word ―set‖ should be
flashing. The up and down arrows can be used to set the flow rate to 8 L/min. The pump was
then allowed to run for one minute in order for the flow rate to stabilize; meanwhile the
Defender DryCal was turned on. The ―Measure‖ icon was selected by pushing the ―Enter‖
45
Calibration Case
DryCal
Pump
¼‖ tubing
¼‖ tubing
¼‖ tubing
Cassette set
½‖ tubing Cartridge with
pre - filter
Figure 12: Calibration Set Up for Leland Pump

48
button. The Defender was set to take continuous measurements by clicking the left arrow to
select ―Continuous‖. The up and down arrows were used to increase and decrease the flow rate
on the pump until the DryCal is measuring 8 L/min. Once the flow rate was in the desired range,
the arrow keys were used to select ―Reset‖, and then ―Burst‖ was selected, which gave an
average of ten measurements. This average was recorded as the calibration level. In order to set
this flow rate on the pump, the star button was pushed until the ―End‖ key appeared, and then
pushing up and down arrow simultaneously selects the ―end‖ key, which saves the flow rate. The
DryCal Defender was then turned off, and for post calibration, the pump was also turned off, but
for pre-calibration, the pump was left on for its‘ sampling period. See Appendix G for the
calibration data from all of the sampling days for the Leland Legacy pump for the cartridge
samples.
7.2.4: Set up of Polycarbonate Cases
Polycarbonate boxes were used to contain the sampling trains, attach them to the tractors,
and keep the pumps as safe as possible from the vibrations, dust, pesticides, and oils that would
incur over a full shift of pesticide application. Holes were drilled in the bottom of the
polycarbonate cases, and a U-bracket was attached around a bar on the back of the tractor to
secure the polycarbonate case onto the tractor. Aluminum poles were secured with a connector to
form a cross shape, and two of these was placed at either end of the polycarbonate case as a
place for the sampling media to rest. These aluminum pole crosses were secured to the
polycarbonate cases with zip ties. Two holes were drilled in the lid of the polycarbonate cases of
the size of
3/8‖, which is the size of the outer diameter of the ¼‖ Tygon tubing. An SKC pump and a

49
Leland Legacy pump were placed in one polycarbonate case, with the ¼‖ tubing attached to both
pumps. This tubing was threaded out through the holes in the top of the lid, which were secured
with rubber stoppers to make sure that no air was getting in or out of the case except through the
tubing. Lubricant was necessary to slide the Tygon tubing into the holes in the lid of the
polycarbonate case. Velcro strips were measured and cut to hold the pumps to the polycarbonate
case. The hooked end of the Velcro was placed on the bottom of the polycarbonate case and
matching fuzzy ends of the Velcro was placed on the bottom of both the SKC pumps and the
Leland Legacy pumps. Once the polycarbonate case was secured to the tractor, it was left on the
tractor for each of the subsequent days. See Figure 13 for the empty Polycarbonate Case that
was created.
Figure 13 : Empty Polycarbonat e Case to Contain Sampling Train

50
7.2.5: Sampling Train Set-Up
The set-up for both the ambient and the cartridge sampling trains is fairly similar to the
calibration set-up. For the ambient sample, the 1800/200 mg charcoal tube was prepared as was
discussed earlier in the media preparation section and the tip was broken off over the broken
glass container. Then, 3/8‖ inner diameter Tygon Tubing was attached to the end of the Charcoal
tube with the small break, so that the straight cut end of the charcoal tube was facing out. ½‖ ID
PVC pipe was used as a cover for the charcoal tube, since the tube is clear, and the PVC pipe
would protect the tube from the sun, getting hot and possible contamination. ½‖ ID PVC pipe
was cut with a hacksaw in the lab prior to going out into the field into the length required by the
charcoal tube, and the tube attached to the 3/8‖ Tygon Tubing was inserted into the cut PVC pipe
so the wide cut end was as close to the
end of the pipe as possible. The PVC
pipe was secured to the 3/8‖ ID Tygon
tubing with electrical tape. Then, the
end of the 3/8‖ ID Tygon Tubing was
attached to the ¼‖ to 3/8‖ reducing
connector, and the ¼‖ inner diameter
Tygon tubing was attached to the open
end of the ¼‖ to 3/8‖ reducing
connector. The other end of the ¼‖
inner diameter Tygon Tubing was attached to the SKC pump [Figure 14].
The cartridge sampling train used the Leland Legacy pump with 37 mm cassettes and
charcoal cloth. After the pump had been calibrated, nitrile gloves were put on and the R95 pre-
Pump
¼‖ tubing
3 /8‖ tubing
PVC pipe
as casing Charcoal
tube inside
Figure 14: Ambient Sampling Train

51
filter and cap was removed from the plastic backing and attached securely to the North OV
cartridge. Then, Teflon Tape was wrapped around the threaded end of a ½‖ to ¾‖ hose barb. The
hose barb was screwed into the
threaded opening. The ½‖
inner diameter Tygon tubing
was attached to the extended
end of the hose barb, and then
the ¼‖ to ½‖ reducing
connector was attached to the
½‖ inner diameter Tygon
tubing. ¼‖ ID Tygon Tubing
was attached to the extended
end of the ¼‖ to ½‖ Reducing Connector. The cassette set-up was done in the same way as was
shown in Figure 4. The ¼‖ Inner diameter Tygon tubing was attached the other side of the
cassette set; to the gridded end (this side goes towards the pump). The ¼‖ Tygon tubing was
attached to the Leland Legacy pump. Since the tubing is slightly too small for the pump inlet, a
Q-tip dipped in Isopropyl alcohol was used to temporarily melt the inside of the ¼‖ Tygon
tubing in order to get a secure fit on the Leland Legacy pump [Figure 15].
7.2.6: Change-out plan
The exact place where the morning media would be disconnected from the sampling train
and the exact replacement for the afternoon change-out time was determined. For the ambient
sampling train, the ¼‖ Tygon tubing was cut just below the 3/8‖ to ¼‖ reducing connector. The
replacement media consisted of a 3/8‖ to ¼‖ reducing connector, and a small extension of 3/8‖
Pump
¼‖ tubing
¼‖ tubing
PVC pipe as
casing
Cassette set inside
1 /2‖ tubing
Cartridge with
pre - filter
Figure 15: Cartridge Sampling Train

52
tubing that was attached to a charcoal tube covered in a PVC pipe. See Figure 16 for
clarification on how the media was replaced.
Replacement (PM) Media
For the cartridge sampling train, the ¼‖ Tygon tubing that attached to the ¼‖ to ½‖
reducing connector between the cassette set and the respirator cartridge was cut, and an X-
Acto knife was used to remove the excess tubing from the ¼‖ to ½‖ reducing connector. The
luer was then disconnected from the cassette set, and the media was placed in the ―dirty‖ box
to be taken back and packaged. The replacement media was then easily inserted. See Figure
17 for clarification on how the media was replaced. It should be noted that because the Tygon
tubing was cut on both the ambient and the cartridge sample, the flow distance will be slightly
less on the afternoon samples than the morning samples. This was done because there was not
Pump
/ 3 8 ”
¼” Charcoal tube
Cut for change out
Sampling Train with Original (AM) Media
Figure 16: Diagram of Change-out of Ambient Sample

53
enough time to change out all of the tractors that were coming in during the twenty minutes
that the workers had for lunch if exact measurements of the Tygon tubing was take place.
However, there are so many other confounding factors, that this should not pose a large
variation in data.
7.2.7: Set-Up of Plastic Bags
The necessary media and supplies for each of the sets was packaged together by set and
change out time to make the process of setting up the sampling trains in a limited time setting
easier. For each set, there were four plastic bag packages: an AM ambient bag, an AM cartridge
bag, a PM ambient bag, and a PM cartridge bag. Packaged in the AM plastic bags for the
ambient sample was the PVC pipe for containing the charcoal tube and a small extension of 3/8‖
A
Pump
Respirat or Cartridge
¼” tubing
¼” tubing Leur
½” tubing
Cassette set
Replacement (PM) Media
Sampling Train with Original (AM) Media
Figure 17: Diagram of Change - out of Cartridge Sample

54
Tygon tubing for the charcoal tube to go into connected to a ¼‖ to 3/8‖ reducing connector.
Therefore, once in the field, the only necessary preparation was to retrieve the pre-cut charcoal
tube from the dry ice in the cooler, break the charcoal tube as was illustrated previously, insert
the charcoal tube into the 3/8‖ tubing, and use electrical tape to secure the PVC pipe around the
charcoal tube.
In the plastic bag for the AM cartridge sample there was the cassette set up without the
charcoal cloths inserted yet, two 4 mL vials that contained the charcoal cloths, a ½‖ to ¾‖ hose
barb wrapped with Teflon tape inserted into an extension of ½‖ ID tubing, which was connected
to a ½‖ to ¼‖ reducing connector connected to an extension of ¼‖ Tygon tubing. The Tygon
tubing was connected directly to the cassette set up, without the use of luers. The cassette set up
had the plastic porous support pads in it, but did not yet have the charcoal cloths inside. A 2‖ ID
PVC pipe was in the bag to be inserted over the cassette set up once the charcoal cloths were in
place. Isopropyl alcohol and a Q-tip were used to melt the inside of the Tygon tubing to make it
wide enough to fit over the opening to the cassettes. A luer was attached on the back end of the
cassette set however, in order to make the change out in the middle of the day easier. In order to
set up the cartridge sampling train, an OV cartridge had to be removed from the package and
attached to an R-95 pre-filter with a plastic cap, which was then screwed into the hose barb that
was wrapped with Teflon tape. The hose barb was then connected to ½‖ ID Tygon Tubing. The
connection between the hose barb and ½‖ Tygon tubing had to be secure so that there was no air
flow leakage, so a zip tie was used around the junction to ensure that no air flow was lost.
Connected to the other end of the ½‖ ID hose barb was a ½‖ to ¼‖ reducing connector, which
was connected to a stretch of ¼‖ ID Tygon tubing. This was connected to the cassette set. Using
two acetone washed forceps, the charcoal cloth circles were removed from the 4 mL vials and
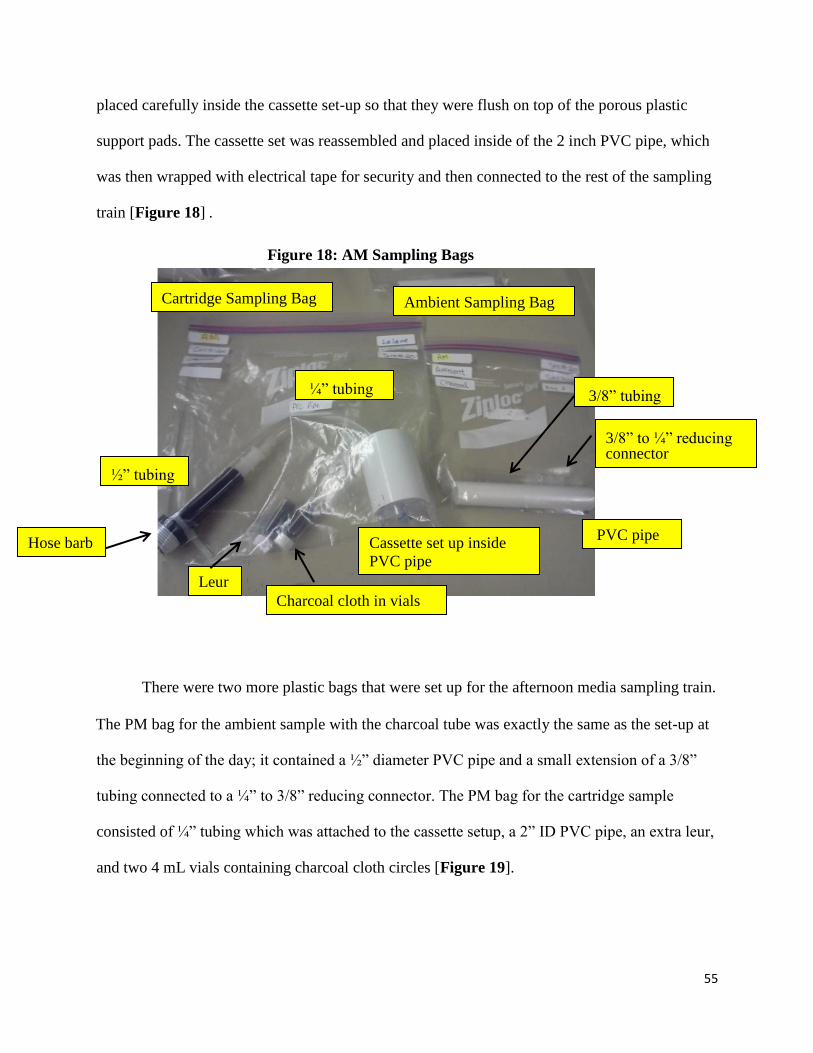
55
Cartridge Sampling Bag Ambient Sampling Bag
Hose barb
½‖ tubing
¼‖ tubing
Charcoal cloth in vials
Leur
Cassette set up inside
PVC pipe
PVC pipe
/8‖ to ¼‖ reducing 3 connector
/8‖ tubing 3
Figure 18: AM Sampling Bags
placed carefully inside the cassette set-up so that they were flush on top of the porous plastic
support pads. The cassette set was reassembled and placed inside of the 2 inch PVC pipe, which
was then wrapped with electrical tape for security and then connected to the rest of the sampling
train [Figure 18] .
There were two more plastic bags that were set up for the afternoon media sampling train.
The PM bag for the ambient sample with the charcoal tube was exactly the same as the set-up at
the beginning of the day; it contained a ½‖ diameter PVC pipe and a small extension of a 3/8‖
tubing connected to a ¼‖ to 3/8‖ reducing connector. The PM bag for the cartridge sample
consisted of ¼‖ tubing which was attached to the cassette setup, a 2‖ ID PVC pipe, an extra leur,
and two 4 mL vials containing charcoal cloth circles [Figure 19].

56
7.2.8: In the field for Respirators
The night before going out into the field, all the pumps were calibrated. All five Leland
Legacy pumps and all five SKC personal pumps were calibrated, even though three would be
used at a time (as there would be three sets a day). Calibrating all of the pumps ensured that
should something go wrong with any of the pumps there would be back-ups. All of the
calibration data was recorded on the calibration data sheets. Also, the gloves were marked for
where the PermaTech patches would go the next day.
A field manual was prepared for both the respirator project and the glove project. The
field manuals contained all pertinent information about the projects including the Standard
operating procedures (SOPs), materials, personal contact information, safety guidelines, and
operation manuals for the instruments. See Appendix H for Table of Contents from both field
manuals. There was also a data box that contained unused data sheets, completed data sheets,
and labels. See Appendix I for sample data sheets for both respirators and gloves.
Figure 19 PM Sampling Bags :
Cartridge Sampling Bag Ambient Sampling Bag
Charcoal cloth circles
¼‖ tubing
PVC p ipe
/8‖ to ¼‖ reducing 3 connector
/8‖ tubing 3

57
Once in the field, the entire team had to don certain personal protective equipment (PPE)
to be around the tractors and collect the samples. Respirators with Organic Vapor combination
cartridges with P100 pre-filter were used, a disposable Tyvec Chem suit, chemical protective
gloves (5 mil nitrile gloves), chemical protective boots, and chemical protective goggles. Thick
coveralls were worn under the disposable Tyvec Chem suit as an added layer of protection. A
first aid kit, a fire extinguisher, and personal eye washes were also brought along for
emergencies. After the sampling was done for each day, dish soap and toilet brushes were used
for decontamination of the PPE, particularly boots.
7.2.8.1: Data Collection
Once in the field, all the materials should have been set up. See Appendix J for a comprehensive
list of supplies. In the morning before the tractor drivers arrived, the pumps were flow checked
with the calibrators to ensure that the pre-calibration that had been done the night before was still
accurate, and then the media was set up using the AM bags and the way to set up the sampling
trains that have been previously discussed. Once out in the field, the sampling train was set up
inside the polycarbonate box. There were two sampling trains in each set that went on a tractor;
an ambient sample and a cartridge sample. An extension of ¼‖ Tygon tubing was attached to the
Leland Legacy pump and to the SKC personal pump. Since the tubing is slightly too small for
the pump inlet, a Q-tip dipped in isopropyl alcohol was used to slightly melt the plastic on the
inside of the Tygon tubing in order to get a secure fit on the Leland Legacy pump. Both the
Leland pump and the SKC pump were attached with an extension of ¼‖ Tygon tubing about a
foot long. For each set, a Leland pump with tubing, an SKC pump with tubing, a set-up ambient
sampling train and a set-up cartridge sampling train were carried in a kitty litter box out to the

58
polycarbonate box on the back of the tractor. The Leland and the SKC pumps were attached to
the Velcro on the inside of the polycarbonate case, and the ¼‖ Tygon tubing that was attached to
them was subsequently threaded out of the holes in the lid. The pumps were situated so that they
were facing outward, with the total elapsed time running on display. The pumps were not turned
off during the changeout in the middle of the day; just the time running was recorded for the
pumps.
Once the lid of the polycarbonate case was secure, the ¼‖ tubing protruding from the
case was attached to the ¼‖ to 3/8‖ and to the luer on the ambient sampling train and the
cartridge sampling train, respectively. The time when the media was attached to the pump (when
the sampling train was completed) was recorded. The face of the charcoal tube inside the PVC
pipe for the ambient sample and the face of the respirator cartridge for the cartridge sample were
positioned on the cross made from the tin poles that was attached to the side of the polycarbonate
case. The faces of both sampling trains were positioned in the same way, so that theoretically
they would be exposed to a similar amount of pesticides. The portion of the sampling train that
Figure 20a: Sampling Trains
in Polycarbonate Case
Figure 20b: Sampling Trains
in Polycarbonate Case

59
was on the outside of the polycarbonate case was secured with zip ties, although not around the
Tygon tubing to avoid creating kinks. See Figure 20 for a picture of the sampling trains inside.
7.2.8.2: Change-out of Media
The pesticide applicators took an approximately twenty minute lunch break during the
day. This was the only opportunity for change out, since there was not another time that they
were off their tractors for long enough to be able to change the media out. The media was
Figure 21b: Sampling Train in
Box on Tractor
Once the sampling train was set
up inside the polycarbonate case, the
entire sampling train was wrapped in
aluminum foil to prevent the sun from
going through the transparent
polycarbonate aluminum case and
heating the pumps up too much, as well
as protecting the polycarbonate case and sampling tr ain
from excess dirt and grime that may have gotten on it
during the duration of the sampling period. Blue masking
tape was used to secure the aluminum foil. Finally, once
the tractors took off for the day, the time that they left
was recorded. See Figures 21 a, b and c for a picture of
the polycarbonate box wrapped in aluminum foil on the back of the
tractor.
Figure 21a: Sampling Train
in Box on Tractor

60
prepared in the same way that it was in the
morning, but the PM sampling bags were
used, as there was fewer supplies and
equipment that was needed. Once the tractors
came in for lunch, the prepared change out
media was taken out to the tractor in a
―clean‖ box, along with a ―dirty‖ box that
would be for the removal of the media off
the tractor, that contained scissors, wire
cutters to snip the zip ties, and an X-Acto
knife to cut the tubing off the reducing
connectors. On the tractor set-up, the
aluminum foil was removed from the tractor box, but the polycarbonate box with the pumps was
not opened or disturbed. The elapsed time was recorded for each of the pumps. The respirator
cartridge on the cartridge sample also was not disturbed, as the goal of this project is to
determine if breakthrough happens on the respirator cartridge or not.
For the cartridge sampling train, any zip ties tethering the cassettes set to the tractor box
were severed with wire cutters. The ¼‖ Tygon tubing that attached to the ¼‖ to ½‖ reducing
connector between the cassette set and the respirator cartridge was cut, and an X-Acto knife was
used to remove the excess tubing from the ¼‖ to ½‖ reducing connector. The luer was then
disconnected from the cassette set, and the media was placed in the ―dirty‖ box to be taken back
and packaged. The replacement media was easily inserted, and it was re-zip tied.
Figure 21c: Sampling Train in
Box on Tractor

61
For the ambient sampling train, the zip ties securing the charcoal tube to the
polycarbonate case were cut, and then the ¼‖ Tygon tubing was cut just below the 3/8‖ to ¼‖
reducing connector. The charcoal tube inside the PVC pipe with the tubing still attached was
placed in the ―dirty‖ box to be taken down, and the replacement media was easily substituted in.
It was then re-zip tied and the entire tractor box was re-wrapped with aluminum foil and re-
secured with masking tape. The time that the morning media came off of the tractor and the time
that the afternoon media went on the tractor was recorded. [Figure 22].
Once the media was taken off the tractor and taken back to the work station (for both the
morning samples and the afternoon samples), the take-down commenced as quickly as possible
Figure 22 : Change out on Back of Tractor

62
so no sampling media would be exposed to any more contaminants once it was no longer on the
tractor or around pesticides. The cassette was pried open with a large flat headed screwdriver,
and the front and back sections of the charcoal cloth circles were taken out of the cassette with
acetone-washed forceps and carefully placed in clean 4 mL vials, which were then labeled and
wrapped with Parafilm. The charcoal tubes were disconnected from the Tygon tubing using the
X-Acto knife, and were then quickly wrapped with Parafilm or capped with red caps on both
ends, and also labeled. All the samples were then placed on dry ice as quickly as possible.
The tubing and the cassettes were discarded after each sample, and the hose barbs, the
reducing connector, the PVC pipes and the luers were washed with soap and water for re-use the
following day. At the end of the day, the pumps were taken out of the polycarbonate cases, and
were wiped down with Clorex disinfecting wipes, and post-calibrated. On the last day of
sampling at each site, the polycarbonate boxes were also taken down off of the tractors and
cleaned as well.
2.9: In the Field for Gloves
Once the glove thickness has been determined, there was more preparatory work to be
done in the lab before going out into the field. Each glove that was to be tested was assigned an
identifying number (Glove #) and was written on the glove using a chemical resistant marking
pen. The night before sampling, places that the PermaTech patches would be placed were
marked using a lab pen on the inside of the glove on both the palm side and the back side of the
glove.
7.2.9.1 Data Collection
The dominant hand of each of the subjects was determined, and that glove was used. The
dominant hand was used for testing because it was assumed that the subject‘s dominant hand is

63
the hand that he or she would use more often, and would therefore be exposed to more oils and
solvents. After donning 5 mil nitrile gloves, the PermaTech charcoal cloth circles were placed on
the inside of the gloves at the places where they had been previously marked. Then, an
aluminum foil tape square was used to cover the PermaTech charcoal cloth circle. This was done
for both the palm side and the back side of the glove. The time that patches were placed on the
gloves was noted on the data sheets. See Figure 23 for how the media was put on the gloves in
the field.
7.2.9.2: Change out for Gloves
At the pesticide applicator‘s lunch break, the patches on the inside of their gloves were
changed out. After donning 5 mil nitrile gloves, the gloves of the applicators were turned inside
Figure 23: Putting Media on the Inside of Gloves

64
out, and the aluminum foil tape and the PermaTech patch was removed. Using acetone washed
forceps, the PermaTech patch was disconnected from the aluminum foil tape, and carefully
placed in a 2 mL vial. The vial was then capped and sealed with ParaFilm and labeled. Then,
new PermaTech patches were placed at the same spot on the glove, and covered with aluminum
foil tape. The time off of the morning patches and the time on of the afternoon patches were
noted on the data sheets. This process was the same for the taking off of the patches at the end of
the day, except that no new patches were put on.
The same gloves were used for each consecutive day at a site, in order to determine if,
when the pesticide applicators re-use their gloves from day to day, to see if there is a
breakthrough if they continue to re-use the same gloves for an extended period of time.
7.2.10: Quality Control
Field blanks and field spikes were used as a control for all of the sampling media, and to
ensure that the results from the media are actually the result of field work, rather than other
confounding factors. High spikes and low spikes were used. Two high spikes, one low spike, and
two blanks were used on the first sampling day at each site, and then just two blanks were used
on the second day. The EHS lab performed the blanks and spikes for all of the media. See
Appendix K for the amount that each media was spiked.
In the field, once the sampling apparatus had been set up, the field blanks and spikes
were taken out. For the charcoal tubes, the field blanks were unbroken tubes. Both tips were
snapped off using the hole in the glass cutter over the broken glass container (the front end was
not cut with the glass cutter as the rest of the media was cut), the charcoal tube was taken outside

65
to where the pesticides were being applied, and then the ends were capped with either red caps or
Parafilm and stored in a freezer. The spikes were cut with a glass cutter, and then broken in the
lab and re-capped after the spike was put in. The spikes had their caps taken off, and then were
also taken outside to where the pesticides were being applied and then re-capped and stored in a
freezer. The time and type of quality control was recorded. The quality control for charcoal cloth
circles was very similar. Acetone-washed forceps were used to open a PermaTech patch, which
exposed the patch to the air in which the pesticides were being applied. They were then put in 2
mL vials and put in the freezer.
7.2.11: Labeling
Labels were pre-made for every sample. The labeling system for the respirator project
displayed the project and year, the site, the set number, the day, the period of sampling, whether
the sample was ambient or cartridge set up, the fact that the sample had charcoal tube or cloth,
and a unique identification number. The labeling system for the glove project displayed the
project and the year, the site, the subject number, the day, the change out time, whether the patch
was on the front or the back of the hand, the fact that the sample had PermaTech charcoal cloth,
and a unique identification number. The labeling for the quality control had the project and year,
the site, the day number, what kind of quality control it was (Blank, High spike, or low spike),
media (which was always charcoal), and the unique identification number. See Appendix L for
an example of a respirator, glove and a QC label.

66
7.3: Analysis in Lab
For respirators, a total of 13 ambient samples and 13 cartridge samples for horticultural
oil were taken, and 4 ambient and 4 cartridge samples were taken for chlorpyrifos. For gloves,
15 back of hand samples and 15 palm samples for gloves were taken for horticultural oil, and 6
back of hand samples and 6 palm samples were taken of chlorpyrifos. A total of 6 blanks of each
kind of media (charcoal tube, charcoal cloth, and PUF tubes), 4 high spikes, and 4 low spikes of
each kind of media were taken. Once the samples were brought back to the University of
Washington, they were stored in the freezer, logged into the computer, and sent to the
Environmental Health Lab to be analyzed. The solvents and oils were analyzed by gas
chromatography based on
NIOSH 1500 Hydrocarbons, at 216 degrees Celsius. The chlorpyrifos was analyzed by LC-
Mass Spectroscopy for PUF disks. All samples were analyzed as separate front and back
sections, and then added together for the combined breakthrough.
In the lab, for the analysis of the solvents and oils, all of the unknown peaks were
quantified as pentadecane. Aromatics were not distinguished from aliphatics on retention time,
as there was no aromatic component. The results were not corrected for spike recovery
efficiency, and the results were corrected for both reagent and matrix blank values. Field blanks,
when submitted, were analyzed and reported as samples; no correction was made for the field
blanks. The samples were analyzed as separate front and back sections. For the charcoal cloth
circles, separate front and back section samples were submitted, as each cassette had two
charcoal cloth circles. For the charcoal tubes and PUF tubes, the front and back sections were
both in the charcoal tubes and were submitted as one sample, and then broken up into front and
back sections by the lab. The EHS lab sampled for p-Xylene, o-Xylene, Cumene, 1,2,4

67
Trimethyl benzene, petadecane, and unknown alkanes. Later, the results were re-processed by
the lab and the unknown alkanes was broken up into the categories of non-aromatic
hydrocarbons, unknown aromatics (which includes alicyclics and aliphatics), and siloxanes (for
respirators) and nonaromatic hydrocarbons, unknown aromatics, and pentadecane (for gloves).
7.4: Statistical Methods
A binary probability analysis was used. Each sample was to be classified as a ―hit‖, or if
it was contaminated, or not. In order to do this, it was necessary to determine the mass of the
total amount of all of the compounds that came through the respirator cartridge that was not due
to pre-existing contamination on the sampling media. Therefore, the amount of mass of solvents
that was collected on the blanks (the blank charcoal tubes, the blank charcoal cloth circles, and
the blank PUF tubes) was looked at. An average of the mass of solvents that was found on the
blanks for each compound for each kind of sampling media was calculated, and then the standard
error of the mean was calculated. In order to have a confidence level between 99.0% and 99.5%,
4 standard errors were added to the mean mass, which was established as the upper limit of
noncontamination. In other words, any media that had a mass of solvents greater than that of 4
standard errors added to the average mass of the blank media was defined as a ―hit‖, or was
judged to be contaminated. This was done for both the media for the respirator cartridges and the
media for the gloves, and for the ambient samples, the cartridge samples, and the glove samples.
The amounts of each kind of compound on each of the collected sample media was then
compared to the value that was calculated. However, for the respirators, the flow rate was not the
same for all of the cartridge samples. In order to equalize them, a multiplier was calculated. This
multiplier was created by choosing a number close to the average total liters of air that was taken

68
in at each sample for each type of media. The adjusted mass was calculated by dividing the
multiplier by the total liters of air that was taken in in that sample, and then multiplied by the
mass of the sample.
Adjusted Mass = Multiplier/Liters air x Reported Mass
Therefore, the adjusted mass was able to be comparable for various flow-rates. Once the
adjusted mass was calculated, the adjusted mass for the combined front and back sections of
each collected sample media, as well as the mass on the sample media for the gloves, was
compared to the upper limit of non-contamination. The results are paired by ambient and
cartridge samples for the respirators, as well as by AM and PM samples and by set, and by palm
and back samples for the gloves, as well as by AM and PM samples. (An adjusted mass was not
calculated for the glove sample since there was no concentration).
Once the calculated adjusted mass was compared to the upper limit of noncontamination,
then ―hits‖ could be established. The binomial frequencies of hits over total samples for each
category of sample was calculated.
A one sided binomial probability p-test was performed on these frequencies that were
calculated.
H0: Frequency of hits in blanks = Frequency of hits in media Ha: Frequency
of hits of the media > Frequency of hits of the blanks
An alpha of .05 was used.

69
A secondary analysis that was done only on the respirators was to calculate an estimated
protection factor. Since a standard multiplier was used for the ambient and cartridge samples of
the respirator cartridges, a ratio of the standard multipliers was calculated. This ratio could be
used to equate the flow rates, by multiplying the ratio by the adjusted mass for the ambient
sample. This enabled the ambient samples to be able to be compared to the cartridge samples.
Then, a mass to mass ratio, or an estimated workplace protection factor was established by
dividing the equated ambient mass by the adjusted cartridge mass. This ratio of expected over
observed showed a rough value of what the protection estimate was. If the resulting ratio was
equal to 1, then there was no established difference between the mass of alkanes inside and
outside of the respirator cartridge, and the cartridge offers no protection. If the resulting ratio
was less than 1, then the cartridge absorbs more mass of alkanes wearing no cartridge at all does,
and if the resulting ratio was greater than 1, then the cartridge is protective against the absorption
of the alkanes. The greater the value is above 1, then the more protective the cartridge is. For the
matched sets in which both ambient and cartridge samples were classified as ―hits‖, then a low
estimated protection factor is expected. For the matched sets in which neither ambient nor
cartridge samples were classified as ―hits‖, a high protection factor was expected, since there did
not seem to be evidence of many solvents outside of the cartridge. For the matched sets in which
the ambient was classified a ―hit‖ and the cartridge sample was not, there is evidence that the
cartridge was in fact protective, since nothing seemed to get through. It was also generally
expected that the afternoon samples would have a lower protective factor than the morning
samples, since as time goes on it is expected that there will be more absorption and therefore
more breakthrough.
See Appendix M for pictures from sampling.

70
Chapter 8: Results
8.1: Lab Analysis
The sampling actually took place for one day in Yakima Valley, and for two days in
North Central Washington. Demographic data on the qualitative information about the workers,
the tractors, and the farms was taken, and this data can be found in Appendix N. The
demographic data for the respirator cartridge study focuses on the types and amounts of
pesticides, the tractors, and the amount that was sprayed. The demographic data for the glove
study focuses on the applicators themselves, and their qualitative demographic data.
On all sites, the amounts of p-Xylene, o-Xylene, cumene, and pentadecane on both the
ambient and charcoal sampling media for both the respirators and the gloves was below the limit
of detection. Site A had amounts of 1,2,4 Trimethyl benzene for both the ambient and the
cartridge samples that were detected, but the amounts on the sampling media for Trimethyl
benzene at Site B was below the limit of detection. See Appendix O for the limits of detection
that were used for each of the solvents that were tested for. However, with regards to the
horticultural oil, a great number of unknown alkanes showed up in both Site A and Site B. These
alkanes were unexpected as according to the MSDS sheets, and therefore were lumped together
as ―unknown alkanes‖. It was attempted to divide up the unknown alkanes category by the
peaks that were evident on the spectroscopy that was performed, and then by looking at the
peaks on the chromatographs.

71
8.2: Qualitative Results for Respirator Samples
For the respirators, the mass of the amount of each of the samples was added together for
the front and back sections for the ambient and cartridge samples. The total run time for each
sample was multiplied by the flow rate in order to get the total liters of air that went through the
sample. Then, the mass of the solvents that was detected was divided by the total liters of air in
order to get the concentration of each of the solvents. The difference between the matched set of
the ambient and the cartridge samples was also calculated. (It should be noted that any amount
that was below the limit of detection, see Appendix O, was treated as zero). The cells in the
table are highlighted in blue if the cartridge concentration exceeded the ambient concentration,
or if the difference between the two was a negative number. The two sites that were sampled had
very different conditions, and therefore very different results. At Site A, chlorpyrifos and
horticultural oil was being sprayed, so both Trimethyl benzene and unknown alkanes were
detected. In the second site, only horticultural oil was sprayed, and so only unknown alkanes
were detected, and at much smaller quantities.
8.2.1: Unknown Alkanes
The results all show that very small amounts of unknown alkanes were detected [Table
23, Figure 34 and 35]. There was a high concentration of unknown alkanes behind the cartridge
at Site A, but this average was impacted by one very high data point. At Site B, there were
greater concentrations of unknown alkanes in the ambient samples than the samples behind the
cartridges. However, all of the concentrations found, both ambient and cartridge, were very
small.

72
Table 22: Unknown Alkanes Concentrations
Site Set Unknown Alkanes Concentrations
Ambient Cartridge Difference
A
AM Set 11 1.2 0.37 0.83
PM Set 11 6.0 11 -5.00
AM Set 12 0.83 0.30 0.53
PM Set 12 0.69 0.20 0.49
B
AM Set 13
PM Set 13
AM Set 14
PM Set 14
AM Set 15
PM Set 15
AM Set 16
AM Set 17
AM Set 18
0.054 0.0021 0.05
0.15 0.0039 0.15
0.052 0.027 0.03
<LOD <LOD <LOD
0.25 <LOD 0.25
0.18 0.0024 0.18
0.54 0.006 0.53
1.18 0.0065 1.17
0.37 0.0064 0.36
Figure 34 Mean Concentrations for Unknown Alkanes at Site A (ug/L)
1.0
3.3
0.34
5.6
0.0
1.0
2.0
3.0
4.0
5.0
6.0
AM PM
Unknown Alkanes at Site A
Ambient
Cartridge

73
Figure 35: Average Differences in Concentration for Unknown Alkanes at Site B (ug/L)
8.2.2: Non-Aromatic Hydrocarbons
The unknown alkanes were broken up into the three sub categories (non-aromatic
hydrocarbons, unknown aromatics, and siloxanes. For non-aromatic hydrocarbons, [Table 24
and Figure 36 and 37] there was a much higher concentration that were found in the cartridge
than outside it, particularly in the afternoon at Site A. At Site B, there were not many
nonaromatic hydrocarbons were found except on the morning of the second day, and very few
seemed to get into the respirator.
0.12 0.17
0.70
0.015 0.0032 0.0063 0.00
0.10
0.20
0.30
0.40
0.50
0.60
0.70
0.80
AM Day 1 PM Day 1 AM Day 2
Unknown Alkanes at Site B
Ambient
Cartridge

74
Table 24: Concentrations of Non-Aromatic Hydrocarbons
Site Set
Air Concentration of Unknown
Alkanes (ug/L)
Ambient Cartridge Difference
A
AM Set 11 0 436 -436.00
PM Set 11 1010 19030 -18020.00
AM Set 12 0 0 0.00
PM Set 12 0 38 -38.00
B
AM Set 13 0 0 0.00
PM Set 13 0 0 0.00
AM Set 14 0 0 0.00
PM Set 14 0 0 0.00
AM Set 15 0 0 0.25
PM Set 15 0 0 0.00
AM Set 16 150 0 150.00
AM Set 17 368 0 368.00
AM Set 18 122 0 122.00
Figure 36: Mean Concentration for Non-aromatic Hydrocarbons at Site A (ug/L)
0.0 505.0 218.00
9534.0
0.0
2000.0
4000.0
6000.0
8000.0
10000.0
12000.0
AM PM
Non - Aromatic Hydrocarbons at Site A
Ambient
Cartridge

75
Figure 37: Mean Concentration for Non-aromatic Hydrocarbons at Site B (ug/L)
8.2.3: Unknown Aromatics
For the unknown aromatics [Table 25 and Figures 38 and 39] at Site A, there was a high
amount that was present both inside the cartridge and outside the cartridge, but there seemed to
be a greater amount inside the cartridge. At Site B, generally there also seemed to be a greater
amount that was found inside the cartridge as well.
0.00 0.00
213.33
0.000 0.0000 0.0000 0.00
50.00
100.00
150.00
200.00
250.00
AM Day 1 PM Day 1 AM Day 2
Non - Aromatic hydrocarbons at Site B
Ambient
Cartridge

76
Table 24: Concentrations of Unknown Aromatics
Site Set
Air Concentration of Unknown Aromatics
(ug/L)
Ambient Cartridge Difference
A
AM Set 11 415 326 89.00
PM Set 11 535 631 -96.00
AM Set 12 238 567 -329.00
PM Set 12 0 288 -288.00
B
AM Set 13
PM Set 13
AM Set 14
PM Set 14
AM Set 15
PM Set 15
AM Set 16
AM Set 17
AM Set 18
0 11 -11.00
0 3 -3.00
0 7 -7.00
17 4 13.00
0 32 0.25
0 0 0.00
0 15 -15.00
0 19 -19.00
0 18 -18.00
Figure 38: Mean Concentration for Unknown Alkanes at Site A (ug/L)
326.5
267.5
446.50 459.5
0.0
50.0
100.0
150.0
200.0
250.0
300.0
350.0
400.0
450.0
500.0
AM PM
Unknown Aromatics at Site A
Ambient
Cartridge

77
Figure 39: Mean Concentration for Unknown Alkanes at Site B (ug/L)
8.2.4: Siloxanes
There was only one ambient sample that was found that contained siloxanes and one
cartridge sample, so it was judged to be a red herring and to be issue with contamination [Table
26].
0.00
5.67
0.00
16.667
2.3333
17.3333
0.00
2.00
4.00
6.00
8.00
10.00
12.00
14.00
16.00
18.00
20.00
AM Day 1 PM Day 1 AM Day 2
Unknown Aromatics at Site B
Ambient
Cartridge

78
Table 26: Concentrations of Siloxanes
Site Set Air Concentration of Siloxanes (ug/L)
Ambient Cartridge Difference
A
AM Set 11 0 0 0.00
PM Set 11 90 0 90.00
AM Set 12 0 0 0.00
PM Set 12 0 0 0.00
B
AM Set 13 0 0 0.00
PM Set 13 0 0 0.00
AM Set 14 0 45 -45.00
PM Set 14 0 0 0.00
AM Set 15 0 0 0.25
PM Set 15 0 0 0.00
AM Set 16 0 0 0.00
AM Set 17 0 0 0.00
AM Set 18 0 0 0.00
8.2.5: 1,2,4 Trimethyl Benzene
1,2,4 Trimethyl benzene was only detected at Site A in the respirator samples. There was
a greater amount of trimethyl benzene in the ambient air than behind the cartridge [Table 27 and
Figure 40]
Table 27: Concentrations of Trimethyl benzene
Set Air Concentration 1,2,4 Triemethyl Benzene (ug/L)
Ambient Cartridge Difference
AM Set 11 0.032 0.0088 0.0232
PM Set 11 0.077 0.018 0.059
AM Set 12 0.01 0.013 -0.003
PM Set 12 0 0 0

79
Figure 40: Mean Concentration for Trimethyl benzene (ug/L)
8.2.6:Chlorpyrifos and chlorpyrifos oxon
Chorpyrifos and chlorpyrifos oxon was also detected at Site A, although there was a very
small sample size. There seemed to be a much greater concentration behind the cartridge than in
the ambient samples at Site A, although there were only four ambient samples and three
cartridge samples at Site A, since one of the pumps stopped working. At Site B, there seemed to
be a difference in the amount of chlorpyrifos oxon in the ambient and cartridge samples varying
with the morning and the afternoon [Tables 28 and 29, and Figures 41 and 42].Looking at the
REL for chlorpyrifos from NIOSH, which is .2 mg/m3, the amounts found in the ambient air are
not close to that. Therefore, the workers theoretically should not be exposed to a great amount of
chlorpyrifos at all.
0
0.01
0.02
0.03
0.04
0.05
0.06
0.07
0.08
0.09
AM PM
1 ,2,3 Trimethyl benzene for Site A
Ambient
Cartridge

80
Table 27: Concentrations of chlorpyrifos
Set Air Concentration chlorpyrifos (ng/L)
Ambient Cartridge Difference
AM Set 11 0.00 136.48 -136.48
PM Set 11 0.00 - -
AM Set 12 0.00 197.76 -197.76
PM Set 12 0.71 0.12 0.59
Table 29: Concentration of Chlorpyrifos oxon
Set
Air Concentration chlorpyrifos
oxon (ng/L)
Ambient Cartridge Difference
AM Set 11 0.00 0.03 -0.03
PM Set 11 0.00 - -
AM Set 12 0.01 0.04 -0.03
PM Set 12 0.31 0.00 0.31
Figure 41: Mean Concentration of Chlorpyrifos
Figure 41: Mean Concentration for ch
0.0 0.4
167.12
0.1 0.0
20.0
40.0
60.0
80.0
100.0
120.0
140.0
160.0
180.0
AM PM
Chlorpyrifos at Site A (ng/L)
Ambient
Cartridge
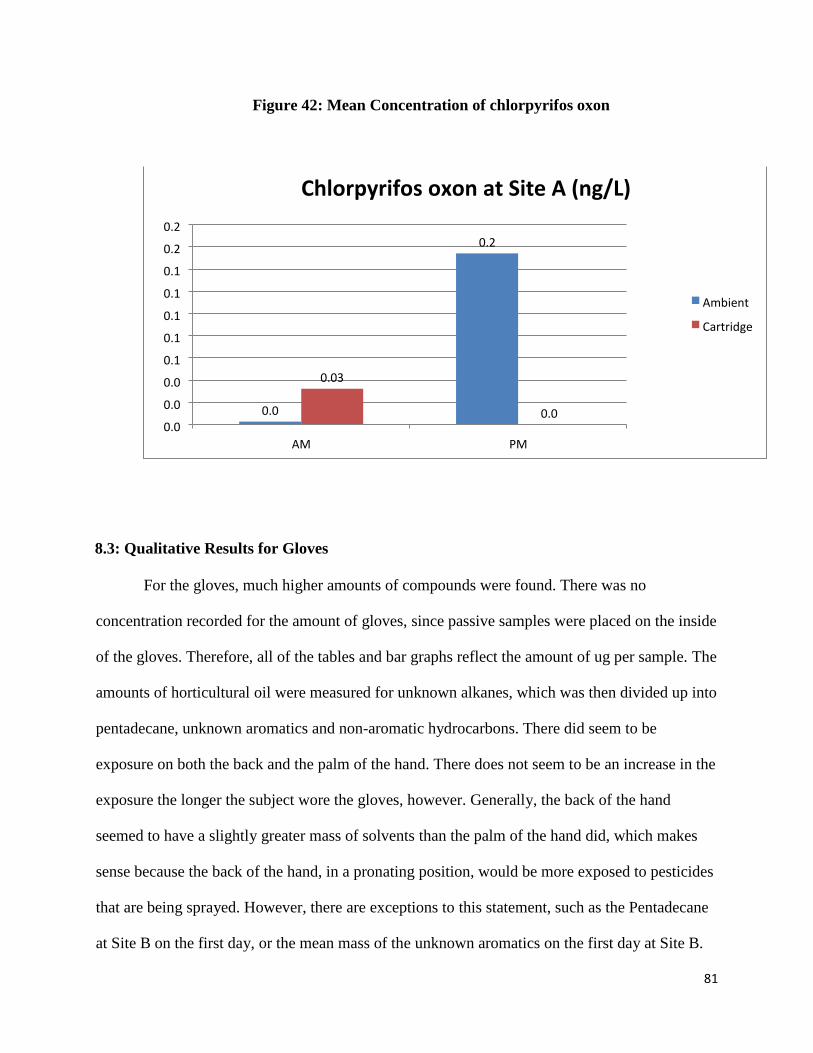
81
Figure 42: Mean Concentration of chlorpyrifos oxon
8.3: Qualitative Results for Gloves
For the gloves, much higher amounts of compounds were found. There was no
concentration recorded for the amount of gloves, since passive samples were placed on the inside
of the gloves. Therefore, all of the tables and bar graphs reflect the amount of ug per sample. The
amounts of horticultural oil were measured for unknown alkanes, which was then divided up into
pentadecane, unknown aromatics and non-aromatic hydrocarbons. There did seem to be
exposure on both the back and the palm of the hand. There does not seem to be an increase in the
exposure the longer the subject wore the gloves, however. Generally, the back of the hand
seemed to have a slightly greater mass of solvents than the palm of the hand did, which makes
sense because the back of the hand, in a pronating position, would be more exposed to pesticides
that are being sprayed. However, there are exceptions to this statement, such as the Pentadecane
at Site B on the first day, or the mean mass of the unknown aromatics on the first day at Site B.
0.0
0.2
0.03
0.0 0.0
0.0
0.0
0.1
0.1
0.1
0.1
0.1
0.2
0.2
AM PM
Chlorpyrifos oxon at Site A (ng/L)
Ambient
Cartridge
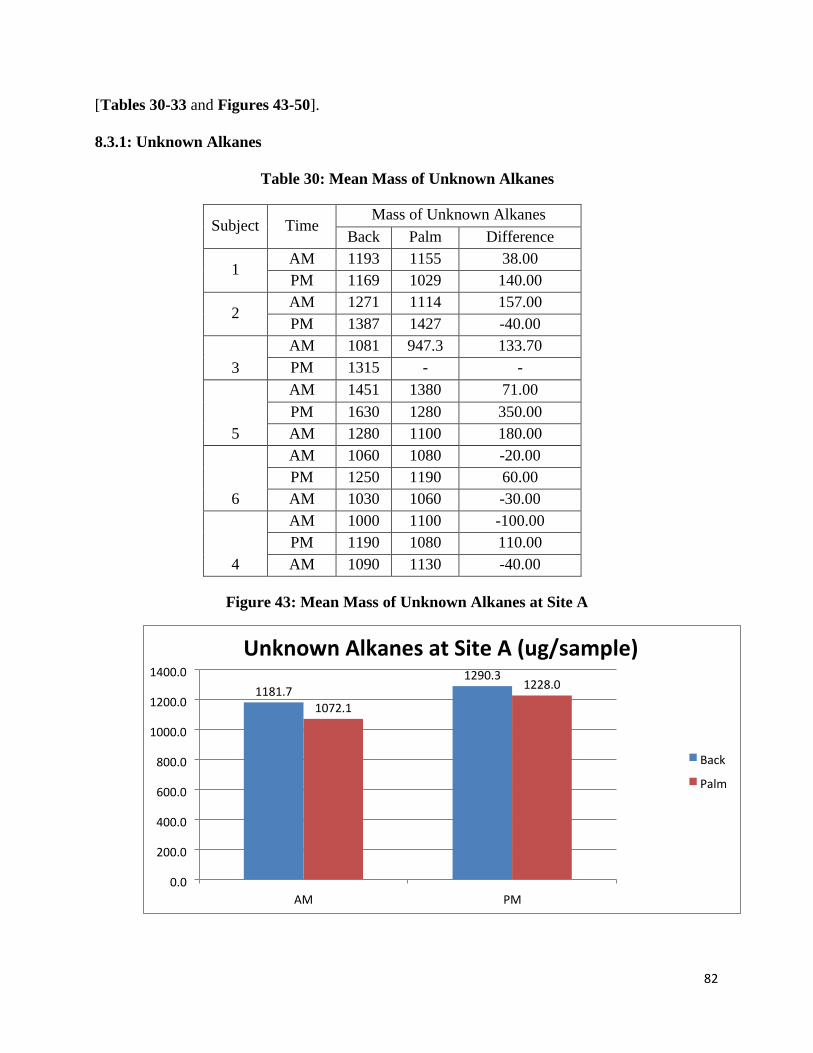
82
[Tables 30-33 and Figures 43-50].
8.3.1: Unknown Alkanes
Table 30: Mean Mass of Unknown Alkanes
Subject Time Mass of Unknown Alkanes
Back Palm Difference
1 AM 1193 1155 38.00
PM 1169 1029 140.00
2 AM 1271 1114 157.00
PM 1387 1427 -40.00
3
AM 1081 947.3 133.70
PM 1315 - -
5
AM 1451 1380 71.00
PM 1630 1280 350.00
AM 1280 1100 180.00
6
AM 1060 1080 -20.00
PM 1250 1190 60.00
AM 1030 1060 -30.00
4
AM 1000 1100 -100.00
PM 1190 1080 110.00
AM 1090 1130 -40.00
Figure 43: Mean Mass of Unknown Alkanes at Site A
1181.7
1290.3
1072.1
1228.0
0.0
200.0
400.0
600.0
800.0
1000.0
1200.0
1400.0
AM PM
Unknown Alkanes at Site A (ug/sample)
Back
Palm

83
8.3.2: Pentadecane
Table 31: Mean mass of Pentadecane
Subject Time Mass of Unknown Alkanes
Back Palm Difference
1 AM 1 3 -2.00
PM 1 2 -1.00
2 AM 1 1 0.00
PM 1 2 -1.00
3 AM 2 1 1.00
PM 5 - -
5
AM 2.7 7 -4.30
PM 6 5 1.00
AM 4 1 3.00
6
AM 3 1 2.00
PM 2 1 1.00
AM 3 1 2.00
4
AM 1 4 -3.00
PM 1 3 -2.00
AM 4 6 -2.00
Figure 44: Mean Mass of Unknown Alkanes at Site B
1170.33
1356.67
1133.33 1186.67 1183.33
1096.67
0.00
200.00
400.00
600.00
800.00
1000.00
1200.00
1400.00
1600.00
AM Day 1 PM Day 1 AM Day 2
Mean Mass of Unknown Alkanes (ug/sample) at Site B
Back
Palm

84
Figure 46: Mean Mass of Pentadecane at Site B
Figure 45 : Mean Mass of Pentadecane at Site A
1.3
2.3
1.7
2.0
0.0
0.5
1.0
1.5
2.0
2.5
AM PM
Pentadecane (ug/sample) at Site A
Back
Palm
2.23
3.00
3.67 4.00
3.00 2.67
0.00
0.50
1.00
1.50
2.00
2.50
3.00
3.50
4.00
4.50
AM Day 1 PM Day 1 AM Day 2
Mean Mass of Pentadecane (ug/sample) at Site B
Back
Palm

85
8.3.3: Non-aromatic hydrocarbons
Table 32: Mean mass of Non-aromatic hydrocarbons
Time
Mass of Non-aromatic
hydrocarbons
Back Palm Difference
1
2
3
AM
PM
AM
PM
AM
PM
1130
1100
1200
1400
1100
1220
1374
1601
1239
1022
1181
992
918
1159
1082
1060
932
1060
1420
962
-
70.00
168.00
140.00
-20.00
138.00
-
5
6
AM
PM
AM
AM
PM
AM
1275
1209
1038
1032
1114
1008
1004
99.00
392.00
201.00
-10.00
67.00
-16.00
4
AM
PM
AM
-86.00
1014
1077
145.00
5.00
Figure 47: Mean Mass of Non-Aromatic Hydrocarbons at Site A
1143.3 1240.0
1027.3
1176.0
0.0
200.0
400.0
600.0
800.0
1000.0
1200.0
1400.0
AM PM
Non - aromatic hydrocarbons (ug/sample)
Back
Palm

86
Figure 48: Mean mass of non-aromatic hydrocarbons
1104.67
1313.67
1104.33 1103.67 1112.33 1041.00
0.00
200.00
400.00
600.00
800.00
1000.00
1200.00
1400.00
AM Day 1 PM Day 1 AM Day 2
Mean Mass of Non - aromatic hydrocarbons ( ug/sample )
Back
Palm

87
8.3.4:Unknown Aromatics
Table 33: Mass of Unknown Aromatics
Subject Time Mass of Unknown Alkanes
Back Palm Difference
1
2
3
AM
PM
AM
PM
AM
PM
112
78
100
161
92
188
100
124
153
103
87
81
123
61
68
91
104
52
92
74
-
21.00
-26.00
48.00
69.00
18.00
-
5
6
AM
PM
AM
AM
PM
AM
125
116
89
161
96
82
127
-25.00
8.00
64.00
-58.00
-9.00
-1.00
4
AM
PM
AM
-4.00
65
63
-4.00
5.00

88
Figure 49: Mean mass of Unknown Aromatics at Site A
Figure 49: Mean Mass of Unknown Aromatics at Site B
101.3
142.3
72.3
98.0
0.0
20.0
40.0
60.0
80.0
100.0
120.0
140.0
160.0
AM PM
Mean Mass of Unknown Aromatics ( ug/sample )
Back
Palm
108.67
90.67 100.67
137.67
92.33 78.00
0.00
20.00
40.00
60.00
80.00
100.00
120.00
140.00
160.00
AM Day 1 PM Day 1 AM Day 2
Mean Mass of Unknown Aromatics ug/sample ) (
Back
Palm

89
8.4: Data Analysis
Each sample was to be classified as a ―hit‖, or whether that particular kind of PPE was
not effective (or whether the media contained an amount of pesticides that could not be
contributed to contamination error) or not. In order to do this, it was necessary to determine the
mass of the total amount of all of the compounds that came through the respirator cartridge that
was not due to pre-existing contamination on the sampling media. The field blanks were looked
at, and the mean mass for each of the field blanks was calculated, as well as the standard error of
that mean for each of the kinds of samples. Any media that had a mass of solvents greater than
that of 4 standard errors added to the average mass of the blank media was defined as a ―hit‖.
Four standard errors was used as this would give a 99.0 to 99.5% amount of confidence that
anything greater than the mean plus the four standard errors would actually be media behind PPE
that was not working effectively. However, this means that some of the blanks could also be
classified as ―hits‖, if they had a mass that was outside of the mean mass plus four standard
errors. These blanks would be outliers, and not be considered to be the norm for blanks. On
unknown aromatics for the respirators and non-aromatic hydrocarbons for the charcoal cloths,
the upper limit of non-hits was 0. That means that the amount of those compounds that was
detected on the blanks was zero, and therefore any media that had any mass at all of those
compounds would be considered a ―hit‖. See Appendix P for the calculation of the upper limit
of non-hits.
A multiplier was calculated to compare the masses of the compounds in the respirator
samples since the flow rates of the cartridge samples had some that were at 6 L/min and some
that were 8 L/min. This multiplier was created by choosing a number close to the average total
liters of air that was taken in at each sample for each type of media (2000 was chosen as the

90
multiplier for the charcoal cloths, and 330 was chosen as the multiplier for the charcoal tubes).
The adjusted mass was calculated by dividing the multiplier by the total liters of air that was
taken in in that sample, and then multiplied by the mass of the sample.
Adjusted Mass = Multiplier/Liters air x Reported Mass
Therefore, the adjusted mass was able to be comparable for various flow-rates. See Appendix Q
for the calculations of the adjusted mass.
Once the adjusted mass was calculated, the adjusted mass for the combined front and
back sections of each collected sample media, as well as the mass on the sample media for the
gloves, was compared to the calculated upper limit from the mean and standard error the blanks.
The results are paired by ambient and cartridge samples for the respirators, as well as by AM and
PM samples and by set, and by palm and back samples for the gloves, as well as by AM and PM
samples. (An adjusted mass was not calculated for the glove sample since there was no
concentration). Anything that is highlighted was a ―hit‖, or was higher than this upper limit.
Then, the proportion of hits was calculated. The proportion of hits for each Site, each
time, and for gloves, each location was calculated. This proportion is what percent chance each
sample has of being contaminated based on the site it is at and the time that the sample is taken
from, or the location of the sample (just for the gloves). A 95% confidence interval for each of
the frequencies was calculated, and a bar charts with error bars were created.

91
8.4.1: Frequency of Hits
Looking at the Respirator Frequency of Hits by Site, (Figure 51) at Site A there was a
high frequency in all of the compounds, including a 100% frequency of unknown alkanes and
unknown aromatics. Site B did not have any frequency for non-aromatic hydrocarbons, but all
sites and days had a frequency of unknown alkanes.
0
0.1
0.2
0.3
0.4
0.5
0.6
0.7
0.8
0.9
1
Unknown
Alkanes
Non-aromatic
hydrocarbons
Unknown
Aromatics
Figure 50: Respirators: Frequency of Hits by Site
Site A
Site B Day 1
Site B Day 2

92
Looking at the respirator frequency of hits by time, (Figure 52) we would expect there to be a
greater amount of his in the afternoon as compared to the morning, since this would show that
there was breakthrough over time. However, this is not what we saw. Generally there was a high
frequency of hits, but only in non-aromatic hydrocarbons was there an increase in the frequency
of hits in the afternoon.
A single tailed p-test was performed, and on all three compounds, on unknown alkanes,
non-aromatic hydrocarbons, and unknown aromatics, we reject the null hypothesis, and can state
that there is a statistically significant difference between the frequency of hits in the media in the
blanks and the frequency of hits in the media.
For the gloves, the frequency of hits by site (Figure 53) shows that generally there is a
greater frequency of hits in Site A than there is in Site B, except for pentadecane. However, this
frequency of hits is smaller than what showed up in the respirator results.
0
0.1
0.2
0.3
0.4
0.5
0.6
0.7
0.8
0.9
1
Unknown Alkanes Non-aromatic
hydrocarbons
Unknown Aromatics
Figure 52: Respirators: Frequency of Hits by Time
AM
PM

93
Looking at the frequency of hits by time, (Figure 54) we would expect that there would
be more dermal exposure the longer the gloves are worn, because there would be a greater
amount of breakthrough. However, except for pentadecane, this was not true. The frequency of
hits for unknown alkanes and non-aromatic hydrocarbons did not seem to make a difference no
matter what the time period was, and the frequency of hits or unknown aromatics actually
seemed to decrease the longer the gloves were worn.
0
0.1
0.2
0.3
0.4
0.5
0.6
0.7
0.8
0.9
1
Unknown
Alkanes
Pentadecane Non-aromatic
hydrocarbons
Unknown
Aromatics
Figure 53: Gloves: Frequency of Hits by Site
Site A
Site B

94
In the results that compared the frequency of hits by location (Figure 55), generally the
back of the hand had a greater frequency of hits than the palm of the hand did. This may have
been because the subject‘s hands were pronated while gripping the steering wheel, and therefore
have more exposure on the back of the hand that on the palm of the hand.
0
0.1
0.2
0.3
0.4
0.5
0.6
0.7
0.8
0.9
1
Unknown
Alkanes
Pentadecane Non-aromatic
hydrocarbons
Unknown
Aromatics
Figure 54: Gloves Frequency of : Hits by Time
a
b
c

95
A single tailed p test was performed for the gloves as well, and for all four compounds
that we looked at regarding the gloves (unknown alkanes, non-aromatic hydrocarbons, unknown
aromatics, and pentadecane), we should accept the null hypothesis, or there is not a statistically
significant difference between the frequency of hits in the blanks as compared to the frequency
of the hits in the media.
8.4.2: Mass to Mass Ratios
Since a standard multiplier was used for the ambient and cartridge samples of the
respirator cartridges, a ratio of the standard multipliers was calculated, by dividing 2000 by 330
(cartridge/ambient ratio). This ratio could be used to equate the flow rates, by multiplying the
ratio by the adjusted mass for the ambient sample. This enabled the ambient samples to be able
0
0.1
0.2
0.3
0.4
0.5
0.6
0.7
0.8
0.9
1
Unknown
Alkanes
Pentadecane Non-aromatic
hydrocarbons
Unknown
Aromatics
Figure 55: Gloves: Frequency of Hits by Location
Back
Palm

96
to be compared to the cartridge samples. Then, a mass-to- mass ratio was established by dividing
the equated ambient mass by the adjusted cartridge mass. This ratio of expected over observed
showed a rough value of what the protection was. If the resulting ratio was equal to 1, then there
was no established difference between the mass of alkanes inside and outside of the respirator
cartridge, and the cartridge offers no protection. If the mass-to-mass Ratios was 0, then no mass
of compounds was found in the ambient samples. I the MTMR was -, then there was no mass of
compounds that was found in the cartridge sample, and since nothing can be divided by zero, and
a mass-to-mass ratio was unable to be calculated [Table 39]. (In the table, anything highlighted
in yellow is considered a ―hit‖, that was established in section 8.4.1).

97
Table 39: Mass to Mass Ratio
Mass to Mass:
Expected/Observed
Set Set Type Time ID Combined Hit
Equating Flow
Rates
Estimated Protection
Factor
A
11
Ambient AM 501 410.00 1 2484.848485 3.4416184
Cartridge AM 503 722.00 1
Ambient
Cartridge
PM 505 1860.00
18620.00
1 11272.72727 0.605409628
PM 507 1
12
Ambient AM 537 240.00
527.00
1 1454.545455 2.760048301
Cartridge AM 539 1
Ambient PM 541 220.00 1 1333.333333 4.004004004
Cartridge PM 543 333.00 1
B
13
Ambient AM 525 90.00 1 545.4545455 #DIV/0!
Cartridge AM 527 0.00 0
Ambient
Cartridge
PM
PM
529
531
50.00
5.00
0
0 303.030303 60.60606061
14
Ambient
Cartridge
AM
AM
573
575
20.00
6.00
0
0 121.2121212 20.2020202
Ambient
Cartridge
PM
PM
577
615
40.00
9.00
0
0 242.4242424 26.93602694
15
Ambient AM 609 20.00 0 121.2121212 1.534330648
Cartridge AM 611 79.00 1
Ambient
Cartridge
PM
PM
613
615
0.00
0.00
0
0 0 -
16 Ambient
Cartridge
AM
AM
630
631
200.00
17.00
1
1 1212.121212 71.30124777
17 Ambient
Cartridge
AM
AM
632
633
480.00
19.00
1
1 2909.090909 153.1100478
18 Ambient
Cartridge
AM
AM
634
635
150.00
18.00
1
1 909.0909091 50.50505051
2000/330: 6.06 = Ratio of Standard Multiplier

98
Chapter 9: Discussion
9.1: Discussion of Results
Site A had a high frequency of hits for unknown alkanes, non-aromatic hydrocarbons, and
unknown aromatics. Site B had a higher frequency of hits for non-aromatic hydrocarbons and
unknown aromatics in the afternoon as compared to the morning, which may suggest that there
was breakthrough after four hours of use. Generally, most of the frequencies for respirators
indicate that there is a high probability of breakthrough occurring through the respirator
cartridge. There seems to be a higher frequency of breakthrough at Site A than at Site B, on
either day. On Site B, there seems to be a higher frequency of breakthrough in the afternoon,
which suggests that the respirator cartridges are not providing protection for as long as they
should.
For chlorpyrifos, there was a high frequency of breakthrough of chlorpyrifos and
chlorpyrifos oxon even after the morning sample, which suggests that the respirators are not
being very protective, and this frequency suggests that it is almost certain that there will be
breakthrough. However, there were only three samples, so it is difficult to say for certain.
For the gloves, looking at all of the frequencies of the hits, generally there were greater
frequencies of hits in Site A than in Site B, but the frequency of hits did not seem to increase
with longer glove use. There seems to be slightly more hits on the back of the hand than on the
palm of the hand. Also, there is an assumption of a steady state of permeation. Even some of the
applications of the pesticides may have not been continuous, we are still assuming a steady of
state of permeation for the glove results.

99
For the respirators, the results showed that there were some samples that were classified
as ―hits‖ in both the ambient and the cartridge matched pair, some that were classified as ―hits‖
with just the ambient sample of the matched pair (which would indicate that the cartridge has a
protective effect) and some that were classified as ―hits‖ in just the cartridge set of the matched
pair (which would indicate that the cartridge actually has a negative effect of breathing the mass
of alkanes in; possibly due to the high concentration of alkanes that would be trapped inside the
cartridge and then breathed in). There many reasons that this could happen; the charcoal in the
cartridge could be migrating through. Since the retention time is directly related to volatility, the
shorter the retention time that the solvents are able to be retained by the charcoal filter, the more
volatile the particles that are being breathed in are. However, there is a possibility that this
contamination could be minimalized by changing the cartridge out in the afternoon, so that the
worker is not breathing in already absorbed and collected solvent particles at a high
concentration.
Looking at the respirator results, it is obvious that there are some patterns that are
present, but not definite patterns. The estimated protection factor that was calculated for the
respirator cartridges generally shows that when both the ambient and cartridge matched sets had
breakthrough (particularly in Site A), then the morning samples have a much greater protection
rate than the afternoon samples. This is to be expected. However, in Site B, there was less
incidences of breakthrough. When neither was contaminated, generally there was a similar
estimated protection factor, or sometimes even a greater one in the afternoon. This could be due
to some contamination of samples, or other confounding factors.
Although there are certainly some exceptions, overall, most of the samples have a
relatively high estimated protective factor, which shows that wearing the cartridge is preferable

100
to not wearing any cartridge at all. This indicates that although the cartridges are not as ideally
protective as they should be, they still are better than no protection whatsoever. One interesting
point to note is that on the one matched pair where the cartridge sample was classified as a ―hit‖,
which would indicate that a workplace protection would be low, since it seems it was the
opposite of protective to be wearing a respirator cartridge, the workplace protection factor was
still close to 2. This is not a very high estimated protection factor, but it still indicates that there
is some level of protection.
One interesting phenomenon is that several samples were found in which the cartridge
samples had a higher amount of breakthrough than the ambient samples did. Human error, either
with the field team or the EHS lab might be one possible explanation for this. Another
explanation would be that solvents might be migrating through the charcoal cartridge and
through the carbon cloth, as well as through the charcoal that is inside the respirator. The
particles evaporate in the air, and this could cause this migrating through the pre-filters. With the
higher flow rate of the cartridge pump, if these compounds are migrating, there is a chance that a
cartridge could appear to be less protective than the ambient sample, however, in actuality, a
cartridge would always be more protective, because a person‘s lungs would always be operating
at a high flow rate (around 8 L/min), and so the cartridge would prove to be more protective. It is
important to note as well that retention time indirectly corresponds to volatility, which means
that the compounds that are being retained the least amount of time are the most volatile.
Another explanation of this phenomenon could be the location of the samplers. There is a
possibility that, although great care was taken to match the ambient and the cartridge samples as
much as possible, that the cartridge samples could have gotten a greater exposure to pesticides
due to the location on the tractor for some reason. This could have happened when the tractor
turned, possibly brushing a high concentration of pesticides into the cartridge sample, or possibly

101
have something to do with the location of the nozzle that sprays pesticide on the tank (if it was
closer to the cartridge sample this could have affected the results).
Looking at the results, the compounds that were expected to be analyzed in the lab did
not show up. The analyzing of the oil sample from Site B showed that there were no aromatics
that were found, and yet aromatics still showed up in the analyzing of the samples. This shows
either that there was some problem with the lab, some contamination issues (such as residue
being stuck inside the tank or the sprayer). There could be other sources for the aromatics that
were found in the sampling media. It is possible that the fuel that the tractors use, which would
contain benzene, has aromatics in it and is contaminating the sampling media, but this would
obviously not show up in the bulk tank sample. It is possible that the sampling media themselves
contained aromatics, and therefore those are showing up in the lab. Also, there is a possibility
that some contamination in the lab or contamination in bringing the samples back from the field
resulted in their containing aromatics.
The two sites that were sampled had very different conditions, and therefore very
different results. At Site A, chlorpyrifos and horticultural oil was being sprayed, so both
Trimethyl benzene and unknown alkanes were detected. In the second site, only horticultural oil
was sprayed, and so only unknown alkanes were detected, and at much smaller quantities.
However, very small amounts of all compounds were found, so more study is needed.
Since for all of the compounds on the respirators the frequency of hits in the blanks was
significantly different than the frequency of the hits in the media but for the gloves there was not
a statistical difference, this suggests that for some reason either the samples on the gloves got

102
contaminated more easily or the samples from the respirators had a higher exposure, and
therefore a higher frequency of contamination.
9.2: Limitations
Although there are many benefits to this project, there are many limitations as well. This
is a pilot study, and therefore had some problems in the field as well as a fairly small sample
size. However, sampling in this manner has never been done before, and could provide a solid
methodology that could lead to future studies or be used in future studies.
Initially, the proposal of the project was to measure the amount of chlorpyrifos, as well as
the amount of solvents and oils, that would break through the PPE that was worn (the respirators
and the gloves). However, the spraying of the pesticides is very dependent on the weather. If
there is too much rain, if the wind is too strong (causing drift of the pesticides), or if the weather
is either too hot or too cold, then chlorpyrifos cannot be sprayed. Also, if the flowers have begun
to open, then chlorpyrifos cannot be sprayed. Therefore, sometimes the farmers will end up not
spraying any chlorpyrifos at all during a year. This is particularly difficult, since there are only a
limited number of farms that it is possible to get contact with and that will allow sampling to
take place. Also, many farms have stopped using chlorpyrifos altogether, since there are many
hazards that are associated with it and many farms would rather not take the risks. Therefore, the
window of opportunity, coupled with the sites that it is possible to sample at, caused the research
to not be able to be done of chlorpyrifos this year. At Site A it was possible to sample for
chlorpyrifos, but since sampling was not able to be done on Site B or on any other farm, as well
ast the fact that the sampling done at Site A had many problems and therefore may not have had

103
the most accurate results, it was decided that the chlorpyrifos samples would not be the focus of
this study.
On Site A, the sampling that was done on 4/2/2013, there were some problems with the
method. Because it was the first time out in the field, and there were some major adjustments
that needed to be made to the methodology of the field work, some of the sampling did not go as
smoothly as the sampling at Site B. There were fewer tractors that were available to be sampled
at Site A than at Site B, which could have caused some discrepancies in the samples. Also, the
process was not set up as smoothly as it was at Site B (due to the fact that there was time prior to
Site B, after seeing what it was like to be in the field, to create an improved field design plan so
that things would run smoother). It is possible that there was some contamination in the change
out, because there was chlorpyrifos that was being sprayed all around the area where the work
station was set up, particularly in the afternoon. Also, on Site A, the preparation and set up was
done in an open field, with exposures from all different pesticides and other chemicals around,
whereas in Site B the preparation and set up was done in an enclosed space, that could be kept
more (theoretically) free of contaminants. Also, because the only media that was being used at
Site B was charcoal filters or charcoal tubes, (not PUFs), it was less complicated and therefore
subject to fewer errors.
At Site B, (the sampling done on 4/12/2013 and 4/13/2013), the workers did not actually
wear the type of cartridges that were used in the sampling. As oil is the only hazardous
substance, NIOSH approved N95 dust masks were used as PPE. They did have an adjustable
valve, but they were not the same as the OV cartridge with an R-95 pre-filter that was being used
for the sampling in the respirator portion of the project.

104
A problem with the patches on the gloves is that because during the day the hands of the
workers get sweaty, the stickiness on the back of the PermaTech charcoal patches tended to
come off, and sometimes would get lost completely (as is the case with one sample) or would
end up in the fingers of the gloves of the applicators, which is not the location which is supposed
to be measured. It may cause some problems in the samples because of any kinks or bends or
tears in the PermaTech charcoal patches.
On Site A, two of the samples were lost at the end of the day. One of the SKC personal
pumps, Number 23, flow faulted after 286 minutes for unknown reasons. Therefore, the PM
sample is subject to question. Also, Leland Legacy pump number 103 was gauged by the metal
inside the polycarbonate case during its‘ run time due to the vibration of the tractor, and has
stopped working. Because it stopped working completely, it is impossible to know how long it
ran for. Therefore, the sample that was attached to it (which was a PUF filter used to measure
chlorpyrifos) is also subject to question and may not be a good sample, and the air concentration
of the chlorpyrifos cannot be calculated. In addition, the DryCal Calibrator labeled ―Leland
Pump‖ stopped working for unknown reasons on Site B, which caused it to be necessary to use
the other Calibrator, which was not a high-flow calibrator, to calibrate the Leland Legacy
Pumps.
This could possibly have caused some discrepancy in the calibration.
At Site A, 3/8‖ tubing was used to connect to the Leland Legacy Pump. This is the tubing
that most fit over the pump, but it proved too loose in the field once the pump was subjected to
vibrations from the tractor and dirt, grime, oils, solvents and chlorpyrifos, and therefore did not
have as tight of a seal as it should have to completely prevent flow leakage. At site B, this was

105
rectified by using ¼‖ ID tubing to connect to the Leland Legacy pump, but the tubing could not
be connected without the use of isopropyl alcohol and Q-tips. Another problem was that there
could have been some leakage from the hose barb in the respirator cartridge to the ½‖ tubing that
was connecting it. This was solved by placing a zip-tie, secured tightly, around the joint, but this
was not done on all samples, which could lead to some discrepancy of samples.
When taking off the media for change out or for the end of the day, it is possible that
there was some contamination of media that was present. Even though there was a ―dirty‖ box
and a ―clean‖ box, occasionally things got mixed up in the frustrations with the lack of time and
the contamination of the tractor. This could cause some contamination problems on the samples.
Even though this project can give a rough estimate of how long it takes before there is
breakthrough on the both the gloves and the respirator cartridges, it does not give an exact time.
As there are only two change outs for both types of PPE, the amount of time it takes to
breakthrough cannot be narrowed down to any more than twice a day. Also, even though the
goal of this project was to simulate lung use by having a sampling train with a respirator, it is
unlikely that it will exactly and simulate it in a parallel manner. There will be some differences
between the set up and actual human use of the personal protective equipment. There is also the
possibility of bias among the workers because of the fact that they are being sampled, and may
have behaved differently than they ordinarily do.
During the analysis for the solvents and oils, all of the unknown peaks are classified as
pentadecane, even though it is uncertain if that is in fact what they are. It is possible that these
peaks may need to be quantified later as another compound, but for our purposes we classifed all
the unknown peaks as pentadecane. This shows that the MSDS sheets were not completely

106
accurate, as there were still unknown chemicals that were in the oil mix that were not listed on
the MSDS sheets. Getting a small sample of all the products used should be done in the future so
that this problem can be avoided. Also, aromatics were not distinguished from aliphatics based
on retention time, since there was not an aromatic component in the samples. These aromatics,
according to the analysis of the horticultural oil at Site B, should not have been present.
Another big limitation is that this project focused more on whether there was
contamination at all, or whether the respirator or gloves were effective, as opposed to the actual
amounts of the compounds. The sample size was not great enough to perform a solid statistical
analysis.
As this project is a pilot study, there are many problems that can be found with it.
However, it may give rise to other projects that can be used to test the PPE for difficult
occupations, and it provides a clear methodology of a development of how this may be done, not
just in agricultural settings, but in other occupations as well that use various types of PPE as
well.
9.3: Recommendations
If a study like this were to be done in the future, there are a few items that should be
changed. First of all, there was a great disconnection from the transition of lab preparatory work
to actual work out in the field. It would have been helpful to have a time to go out in the field,
possibly a month before the project was to take place, evaluate what was needed, and then still
have time to create a suitable set up, while having a better understanding of how it was going to
work in the field. Having no idea what going out into the field was going to be like ended up

107
hampering the effectiveness of the design of the project.It would be more useful if everyone was
trained in every job that he or she was going to perform. There were some people who know
what they were doing with regard to certain jobs more than others, and when the lesser informed
people tried to be of assistance, they ended up just slowing everyone down or being in the way.
Universal training would be useful. Also, it would be more helpful if there could be more
continuity in the organizing of going out into the field. It can be difficult to plan when often
what sampling that was supposed to happen could change at the last minute and be completely
out of the researcher‘s control.
We only used two field blanks per day, or a total of six field blanks for each kind of
media. As there was a great reliance on the average mass of the field blanks to determine
contamination of the media, a larger sample size of field blanks would be useful, and would give
us more confidence in establishing the mean mass of compounds that were collected on the field
blanks. In future studies, around 10 field blanks per day would be helpful.
There are several additional studies that could be done to continue in the vein of the work
of this study. More sampling should be done on chlorpyrifos, since the limited samples that we
have show that the respirator cartridges are not as protective as they should be. More studies
should be done to back this assumption up. Even though this project initially was to evaluate the
effects of chlorpyrifos, not very many chlorpyrifos samples were collected. More data should be
done on chlorpyrifos to see if the results that we gathered are consistent with other samples.
Also, since the sampling size was small for the horticultural oil as well, there could be
should be more studies on the effects of the horticultural oil and more sampling should be done
on the breakthrough of that.

108
There seems to be many confounding factors concerning why there is occasionally a
greater amount of breakthrough in the cartridge samples than in the ambient samples. This
should be analyzed more to find out the exact reasons for this breakthrough, and measures
should be taken to prevent these confounding factors from interfering with the sampling, or just
accounting for them in the analysis of the results.
Also, since the bulk sample collected from the tank was different than what was analyzed
in the lab, more study should be done to find out the reason for this.
However, the set-up of the sampling train was a unique idea, and the creation of using a
respirator cartridge to measure the amount of breakthrough is something that has not really been
done before and could be translated to many other uses and studies. The sampling train could be
used to test the respirator effectiveness for many jobs; not exclusively agricultural. This kind of
set-up for both inhalation exposure and dermal exposure could be useful for sampling in many
industries.
109
Chapter 10: Conclusions
This study paved the way for testing respirators in a unique way, and showed some data
about testing gloves as well. However, all of the masses that were collected from the sampling
media were very small. This study demonstrated that although wearing a cartridge is more
protective than not wearing one, there is still amounts of solvents and particles that are getting
through the respirator cartridge, into the workers breathing zone. This is particularly prevalent
for the afternoon samples. Therefore, it is possible that the respirator cartridges are generally not
being changed out enough to be completely protective for the duration of their use. For Site A,
the cartridges did not seem to be as protective as they did at Site B. However, the sample size
was very small and there may have been some contamination issues. More study and analysis is
needed to continue to understand this data and its‘ implications. Although further study is
needed, it is evident that the respirators that are currently being worn are not very protective. The
workers should evaluate the types of respirators that they are wearing, and change to something
more protective or provide a respirator cartridge change out more often. It does not appear that
the longer that the gloves are worn, they will cause more breakthrough, although there is some
breakthrough. Though wearing respirators and gloves is generally more protective than not
wearing any at all, they are not fully protecting the worker from the hazards of pesticides.

110
Chapter 11: Acknowledgements
Thanks to the participating orchards and the pesticide handlers participating in study.
Thanks to the DEOHS Medical Aid/Accident Fund for funding the study. Thanks to the PNASH
department for aiding in this project and ensuring it was able to be carried out. Thanks to Kit
Galvin for all her hard work and planning and leading in the field. Thanks to the rest of our field
team: Miyoko Sasakura, Pablo Palmández, and Maria Negrete. Thanks to Mike Yost and Rich
Fenske for supporting and helping with the project and providing supplies, and serving on my
committee. Thanks to Alicia Pearce, Maria Tchong and Theresa Bordianu for helping with the
ordering of supplies and the creation of some parts of the project. Thanks to the kind people at
the Oxford Inn and the Motel in Pateros for being understanding with our erratic schedule.
Thanks to the DEOHS EH lab for the analysis of our samples. Thanks for the support from my
classmates, co-workers and professors for enabling me to finish this project.

111
Chapter 12: References
"Aromatic Hydrocarbon." NIOSH Manuel of Analytic Methods, Fourth Edition. NIOSH.
Web. 16 Nov 2012. <http://www.cdc.gov/niosh/docs/2003-154/pdfs/1501.pdf>.
Baker, David E."Pesticide Safety." Agriculture. University of Missouri, Nov 1997. Web.
30 May 2012. <http://extension.missouri.edu/p/G1916>.
CDC: Center for Disease Control and Prevention. Workplace Safety and Health Topics:
Respirators. Atlanta: , 2010. Web. <http://www.cdc.gov/niosh/topics/respirators/>.
CDC. NIOSH. NIOSH Pocket Guide to Chemical Hazards: 1,2,4 Trimethylbenzene.
Atlanta, GA: , 2010. Web. <http://www.cdc.gov/niosh/npg/npgd0638.html>.
Dow AgriSciences. 2006. Lorsban®-4E Insecticide (NAF-163). Material Safety Data
Sheet.
Dow AgriSciences. 2007. Lorsban®-4E. Specimen Label.
Dow Elanco, . "Pesticide Information Profiles: chlorpyrifos."Extoxonet: Extension
Toxicology Network. N.p., n.d. Web. 16 Nov 2012. <http://extoxnet.orst.edu/pips/chlorpyr.htm>.
Environmental Protection Agency. Pesticides: Re-registration. chlorpyrifos facts. 2002.
Web. <. http://www.epa.gov/oppsrrd1/REDs/factsheets/chlorpyrifos_fs.htm>.
Environmental Protection Agency. Office of Pollution Prevention and Toxics. Chemical
Summary for 1,2,4 Trimethyl Benzene. 1994. Print. <http://www.epa.gov/chemfact/s_trimet.txt>.
Fenske, Richard A., Faysshal M. Farahat, et al. "Contributions of inhalation and dermal
exposure to chlorpyrifos dose in Egyptian cotton field workers. "International Journal of
Environmental and Occupational Health. 18.3 (2012): 198-209. Print.

112
Fenske RA. 2012. Final Report CDC/NIOSH Cooperative Agreement #5 U50 OH07544,
pgs 78-126.
Galvin K, Selvin S, Spear RC. 1990. Variability in Protection Afforded by Half-Mask
Respirators Against Styrene in the Field. Am. Ind. Hyg. Assoc. J. 51 (12):625-631. 1990.
Goldstein, Randy, and Timothy Cordon. "Hydrocarbons Toxicity." Medscape Reference
(2011): n.pag. Web. 1 Jun 2013. <http://emedicine.medscape.com/article/1010734overview>.
Heitbrink, William A., Ernest S. Moyer, et al. "Environmental Agricultural Tractor Cab
Filter Efficiency and Field Evaluation." AIHA Journal. 64.3 (2003): 394-400. Web. 2 Jun. 2013.
<http://oeh.tandfonline.com/doi/pdf/10.1080/15428110308984832>.
Jordan, Harry S. The Respirator Problem—an Industrial Hygienist's
Viewpoint, American Industrial Hygiene Association Journal, 19:2, 149-153
Karimi, Ali, Mehdi Jahangiri, et al. "Revising Organic Vapour Respirator Cartridge
Change Schedule: a Case Study of a Paint Plant in Iran." Archives of Industrial Hygiene and
Toxicology. 64.1 (2013): 133-138. Web. 2 Jun. 2013.
<http://www.degruyter.com/view/j/aiht.2013.64.issue-13/10004-1254-64-2013-
2256/100041254-64-2013-2256.xml;jsessionid=AD06A55127F503C3095BAEF90522F397>.
Lee, Shu-An, Atin Adhikari, et al. "Respiratory Protection Provided by N95 Filtering
Facepiece Respirators Against Airborne Dust and Microorganisms in Agricultural
Farms." Journal of Occupational and Environmental Hygiene . 2.11 (2005): 577-585. Web. 2
Jun. 2013. <http://oeh.tandfonline.com/doi/pdf/10.1080/15459620500330583>.
Lee, Shu-An. "Development of a New Method for Measuring the Protection Provided by

113
Respirators against Dust and Microorganisms." Aerosol and Air Quality Research. 4.1 (2004):
56-73. Web. 2 Jun. 2013. <http://aaqr.org/VOL4_No1_July2004/5_AAQR-04-07-OA-0005_56-
73.pdf>.
Loveland. 2010. Supreme Oil Insecticide. Label.
Organophosphorous Pesticides. NIOSH. Manual of Analytic Methods. Fourth Edition: ,
1994. Web. <http://www.cdc.gov/niosh/docs/2003-154/pdfs/5600.pdf>.
Nakayama, Shoji, Tadashi Nishide, et al. "Evaluation of the Efficiency of Respiratory
Protective Equipment based ." Journal of Occupational Health. 46.2 (2013): 132-140. Web. 2
Jun. 2013.
<http://ql3dq7xx6q.search.serialssolutions.com/?sid=Entrez:PubMed&id=pmid:15090688>.
NIOSH, 2003. Hydrocarbons, Aromatic Method. 1501. Manual of Analytical Methods,
4rth Ed. National Institute for Occupational Safety and Health.
NIOSH, 2006. Determination of Organic Vapor (Carbon Tetrachloride) Service Life
Test, Air-Purifying Respirators with Cartridges. Standard Testing Procedure No. TEB_APR-
STP-0046A. National Personal Protective Technology Laboratory. National Institute for
Occupational Safety and Health. http:/www.cdc.gov/niosh/npptl/stps/pdfs/TEB-APR-
STP0046.pdf.
NIOSH, 2007. Determination of Particulate filter Efficient Level for R95 series Filters
against Liquid Particultues for Non-Powered, Air-Purifying Respirators. Standard Testing
Procedure No. TEB-APR-STP-0056. National Personal Protective Technology Laboratory,
National Institute for Occupational Safety and Health.
National Pesticide Information Center. Chlorpyrifos General Fact Sheets. Oregon State
University, 2010. Web. <http://npic.orst.edu/factsheets/chlorpgen.html

114
PaintHealthy. 2011. PaintHealthy Collision Repair.
http://painthealthycollisionrepair.org/index.html.
Popendorf, William, James A. Merchant, et al. "Respirator Protection and Acceptability
Among Agricultural Workers." Applied Occupational and Environmental Hygiene. 10.7 (2011):
595-605. Web. 2 Jun. 2013.
<http://oeh.tandfonline.com/doi/pdf/10.1080/1047322X.1995.10387652>.
Salem, Harry, and Sidney Katz. Inhalation Toxicology. 2nd Ed. Boca Raton: Taylor &
Francis, 2006. 28. eBook.
<http://books.google.com/books?id=yPOowmPVLZcC&pg=PA36&lpg=PA36&dq=EPA
Whalan pettigrew health effects division pesticide
1998&source=bl&ots=rgYVCaXCyb&sig=3J_cs47TcBa7SqBDYvFt7gsP92A&hl=en&sa=X&e
i=xgcHUfaaO6L1iQKDwoDIDg&ved=0CDMQ6AEwAA
US EPA. Chemical Resistance Category Chart.
http://www.epa.gov/oppfead1safety/workers/equip.htm.
Wood, Gerry O., and Jay L. Snyder. "Estimating Reusability of Organic Air-Purifying
Respirator Cartridges."Journal of Occupational and Environmental Hygiene . 8.10 (2011): 609-
617. Web. 2 Jun. 2013. <http://oeh.tandfonline.com/doi/pdf/10.1080/15459624.2011.606536>.
Washington State Department of Agriculture. Farmworker Education. 2012. Print.
<http://agr.wa.gov/PestFert/LicensingEd/FarmworkerEducation.aspx.
Zanarini D. 2011. Glove Efficacy in Collision repair Shops Using Isocyanate and Solvent
Based Spray Paints: a Field Study.

115
Chapter 13: Appendix
Appendix A: Comprehensive list of Materials
Respirator Cartridge Effectiveness Study
• Materials for Media Preparation o Cutting charcoal tubes
1800/200 Charcoal Tubes (SKC product number 266-16-02) Red Caps for Charcoal Tubes or Parafilm Dish soap Glass cutter Safety Glasses Glass resistant gloves Glass receptacle Paper towels
o Preparation of Charcoal Circles
Charcoal cloth with no backing (Zorflex 100% activated woven carbon cloth) 1.5‖ diameter Di-cut Nitrile gloves (VWR 82026) 37 mm cassettes (2) (SKC product # 225-36050LF) Scissors Acetone Small crochet hook (.75 mm) Ziploc bags 4 mL vials (National Scientific- Waters Clear product # C4015-1) Caps for 4 mL vials (National Scientific- Waters Clear product # B7815-13) Small forceps (#08900- Fisher Brand; Medium Pointed, 4 ½ straight) Thermolyne oven (EH lab; HSB)
o Preparation of Polycarbonate Case
Polycarbonate Cases of various sizes (Storables and Fred Myer) Drill Safety Glasses Rubber Gaskets
o Cutting of Charcoal Tube casing
Safety Glasses Hacksaw Tape Measure SKC 1800/200 mg Charcoal Tube (product number 266-16-02) ½‖ ID Rigid PVC Pipe (Home Depot model # 1120) Sharpie

116
• Materials for DryCal Calibration in Lab
o DryCal Defender Calibrator (Model # 510-H) o 1,000 mL burette o Leland Legacy air sampler pump (SKC cat. Number 100-3002) o SKC sampler (Model 224-PCXR8) o Glass petri dish (wider than 1,000 mL burette) o
Bubble solution (same as what is used for children‘s bubbles) o ¼‖ latex Rubber tubing o ¼‖ ID Tygon Tubing (Cole Parmer product # 63010-064) o 3/8‖ ID Tygon tubing (USP
product # 054005) o ¼‖ to 3/8‖ reducing connector (Cole Parmer YO 30622-39) o Stopwatch
o DryCal calibration data sheet o Lab stand o Glassware clamp o Pen
• Materials for SKC Pump Calibration
o SKC personal pump (Model 224-PCR8) o DryCal Defender Calibrator (Model 510-H) o Flat
head screwdriver, 5/62‖ o SKC 1800/200 mg Charcoal Tube (product number 266-16-02) o
¼‖ ID Tygon Tubing (Cole Parmer product # 63010-064) o 3/8‖ ID Tygon Tubing (USP
product # 054005) o ¼‖ to 3/8‖ reducing connector (Cole Parmer YO 30622-39) o Data
Sheet for Calibration o Lab tape o Sharpie
• Materials for calibration of Leland Legacy Pumps
o Calibration of Cartridge samples with cassettes
Leland Legacy Air Sample personal pump (SKC cat. Number 100-3002) DryCal Defender Calibrator labeled ―Leland‖ (Model 510-H) Leland Legacy Quick Guide laminated sheet North Organic Vapor Respirator Cartridge (product # N 7500-1) North R95 pre-tube with cap (product # 7506R95) ¾‖ to ½‖ Hose barb (USP product # 1URN5) 37 mm cassettes (SKC product # 225-3050LF) 1.5‖ diameter charcoal cloth circles
Porous Plastic Support pads (SKC product # PFSP37) White Urea Lure adapters (SKC product # 225-13-2) ¼‖ ID Tygon Tubing (Cole Parmer product # 63010-064) ½‖ ID Tygon Tubing (USP product # 057246) ¼‖ to 3/8‖ Reducing connector (Cole Parmer product # YO 30622-39) ¼‖ to ½‖ Reducing connector (Cole Parmer product # EW 30703-56)
Grey Case for Respirator Cartridge Calibration Teflon tape Data Sheet for calibration
• Quality Control Materials
o Cut charcoal tubes that are capped o Red caps for charcoal tubes

117
o Prepared charcoal cloth circles in 4 mL vials (See SOP 1.4) o
Nitrile gloves o Cooler o Ice o Labels o Tape o Aluminum Foil o
Lab diaper o Small forceps o Safety Glasses o Spiking solution (taken care of in the EHS lab)
• Materials for Set-up of Sampling Trains
o Ambient Sample with Charcoal Tube
SKC 1800/200 mg Charcoal Tube (product number 266-16-02) SKC personal pump (Model 224-PCXR8)
¼‖ ID Tygon Tubing (Cole Parmer product # 63010-064) 3/8‖ Inner Diameter Tygon Tubing (USP product # 054005) ½‖ ID cut PVC Pipe (Home Depot model # 1120) Reducing connector ¼‖ to 3/8‖ (Cole Parmer) Electrical Tape Data Sheets
o Cartridge Sample with Cassettes
North Organic Vapor Respirator Cartridge (product # N 7500-1) North R95 pre-tube with cap (product # 7506R95) ¾‖ to ½‖ Hose barb (USP product # 1URN5) ½‖ ID Tygon Tubing (USP product # 057246) ¼‖ Inner Diameter Tygon Tubing (Cole Parmer product # 63010-064) 3/8‖ ID Tygon tubing (USP product # 054005)
¼‖ to 3/8‖ reducing connector (Cole Parmer YO 30622-39) ¼‖ to ½‖ Reducing connector (Cole Parmer product # EW 30703-56) 37 mm cassettes (SKC product # 225-3050LF) 2‖ Inner Diameter PVC Pipe (Home Depot) 1.5‖ diameter charcoal cloth circles- pre-prepared in the lab Porous Plastic Support pads (SKC product # PFSP37)
White Urea Lure adapters (SKC product # 225-13-2) Leland Legacy Air Sample personal pump (SKC cat. Number 100-3002) Teflon Tape Small forceps Data Sheet for Calibrations
• Set-Up in Polycarbonate Boxes
o Industrial Strength Velcro o Polycarbonate Case of various sizes o Both sampling trains
• Materials for Field Work
o Ambient Air sampling train with 1800/200 mg charcoal tube (see SOP 5.3.2) o Respirator
Cartridge sampling train with cassettes (see SOP 5.3.4) o Charging Station for Leland
Legacy Pumps (Li-Ion 5) o Charging Station for SKC Pumps (Model 223-1000) o SKC

118
1800/200 mg Charcoal Tube (product number 266-16-02) o ½‖ ID PVC Pipe for charcoal
tube casings o Flat head screwdriver- very small (5/62‖) o Phillips head screwdriver
o Data sheets o Aluminum Foil o Zip ties
o Polycarbonate plastic case o Masking Tape o Tin poles (4) o Alligator clamps o Duct Tape
o Clock/Stopwatch
o Acetone for rinsing PUF tube holders o Nitrile Gloves (VWR 82026) o 4 mL vials (National Scientific- Waters Clear product # C4015-1) and caps for 4 mL vials
(National Scientific- Waters Clear product # B7815-13)with charcoal cloth circles (see SOP
1.4) o Small forceps
• Materials for Storage and Transfer
o Cooler o Blue Ice o Dry Ice o Thermometer for cooler
Complete List of Materials for the Glove Project
• Glove Thickness
o 0.050" Mitutoyo Dial Thickness Gage No. 7326S MIT-7326 range 0.050inch. Victor Machinery Exchange, Inc. Brooklyn, NY (http://www.victornet.com/tools/Thickness- Gages/222.html) o 15mil Best Nitri-Solve® Unsupported Nitrile Gloves Ref: 727. Showa
Best Glove, Menlo, GA
o 5mil nitrile gloves (size to fit tester) o Lab diaper
• Permeation o Permea-Tec™ Sensor Solvent, Part No 3050. CLI Laboratories, Inc. Des Plaines, IL o 15mil Best Nitri-Solve® Unsupported Nitrile Gloves Ref: 727. Showa Best Glove, Menlo,
GA o 2‖ wide aluminum
tape o General® 1‖ arch
punch o Storage o Box to transport patches o Clear screw top vial 12x32 2mL with large opening, Supelco P/N 27265 o Solid cap, black
polypropylene F217/PTFE lines 10-425 thread, Supelco P/N 28659-U o Frozen blue ice (5) o
Cooler (1): to transport acetone o Dry ice o Styrofoam cooler (3): to transport QC samples, field samples, and dry ice
• Miscellaneous o Acetone o forceps o Tape o Chemical resistant marking pens o Sharpie pens o Paper o Ziploc bags (different sizes) o Scissors o Razor blades o Packing tape o Timer o Parafilm o Ruler o Tape measure o Pre
made labels o Acetone squirt bottles o Kimwipes o 0.050" Mitutoyo Dial Thickness Gage No. 7326S MIT-7326 range 0.050inch. Victor
Machinery Exchange, Inc. Brooklyn, NY (http://www.victornet.com/tools/Thickness- Gages/222.html)
o Beakers o Trash

119
bags o Blue lab
diapers o Vial rack for 2 mL vials (3 to 4) o Hair dryer o Foil

120
Appendix B: Methods for PUF tubes and Chlorpyrifos
Even though the nature of the project resulted in not sampling with PUF tubes or for
chlorpyrifos, standard operating procedures were made outlining the way that sampling would
have taken place (and did take place at Site A). These SOPs were turned into methods and put in
this appendix so that in any future studies, particularly ones involving sampling trains and PUF
tubes, these Methods can be used.
Set-up of Sampling Train for Calibration with PUF Tube
The calibration of both kinds of pumps was different with the PUF tubes instead of
the charcoal cloth circles and the charcoal tubes. For calibration of the ambient sample, the
calibration jar was used, with a PUF that was labeled as ―Calibration only‖ (Figure 2). This tube
was attached to the black tubing on the inside of the lid, and then the lid to the calibration jar was
replaced and screwed on tightly. The ¼‖ ID Tygon tubing that is attached to the center of the
calibration jar lid (which should be connected to the PUF tube on the inside of the lid) was
connected to the SKC personal pump, and the ¼‖ ID Tygon tubing attached to the L-shaped
connecter on the calibration jar to the top inlet of the DryCal Defender. Then, the pump was
turned on and allowed to run for one minute. A 5/62‖ screwdriver was used to adjust the pump to
as close as 4.624 L/min as possible. The Defender DryCal was turned on, and ―Enter‖ was
clicked in order to select the ―Measure‖ icon. The Defender was set to take single measurements
by clicking the left arrow to select ―Single‖. Three single flow rates were taken, until the average
of the flow rates was in the 4.624 L/min range. In order to adjust the flow rate, the 5/62‖
screwdriver was turned clockwise to increase the flow rate or counterclockwise to decrease the
flow rate until the flow rate was at the desired amount. Afterwards, the Defender DryCal was
reset when the flow rate was in the desired range (which was 4.624 L/min) (Figure 2).

121
For the calibration of the PUF tube for the respirator cartridge sampling train, the R-95
prefilter and cap was detached from the plastic backing and attached securely to the North OV
cartridge. Teflon Tape was wrapped around the threaded side of the hose barb. The hose barb
was screwed into the opening of the cartridge, and an extension of ½‖ ID Tygon Tubing was
attached to the extended end of the hose barb. Then, a ½‖ to ¾‖ reducing connector was attached
to the Tygon Tubing. The ¾‖ ID Tygon Tubing was attached to the outside of the wide end of
the PUF tube. A short amount of tubing was used so that the cartridge was as close to the PUF
tube as possible. The other end of the PUF tube was connected to ¼‖ ID Tygon tubing, and then
the ¼‖ Tygon tubing was connected to the inlet on the inside of the grey calibration case labeled
―to media‖. Another extension of ¼‖ ID Tygon Tubing was attached to the outlet on the outside
of the grey calibration case labeled ―to pump‖. Then, this tubing was attached to a Leland
Legacy Pump using isopropyl alcohol and a Q-tip on the inside of the tubing. Another extension
of ¼‖ ID Tygon Tubing was attached to the outlet on the outside of the grey calibration case
labeled ―To DryCal‖. The DryCal labeled ―Leland‖ was attached to the end of the ¼‖ Tubing.
The calibration took place much in the same way as it did for the charcoal cloth circles in the
cassettes. The pump was calibrated to 8 L/min. (Figure 3)
DryCa
SKC ¼‖ tubing
Calibration Jar
PUF tube
( inside )
Figur e 2: Calibration of PUF tube for Ambient Sampling Train
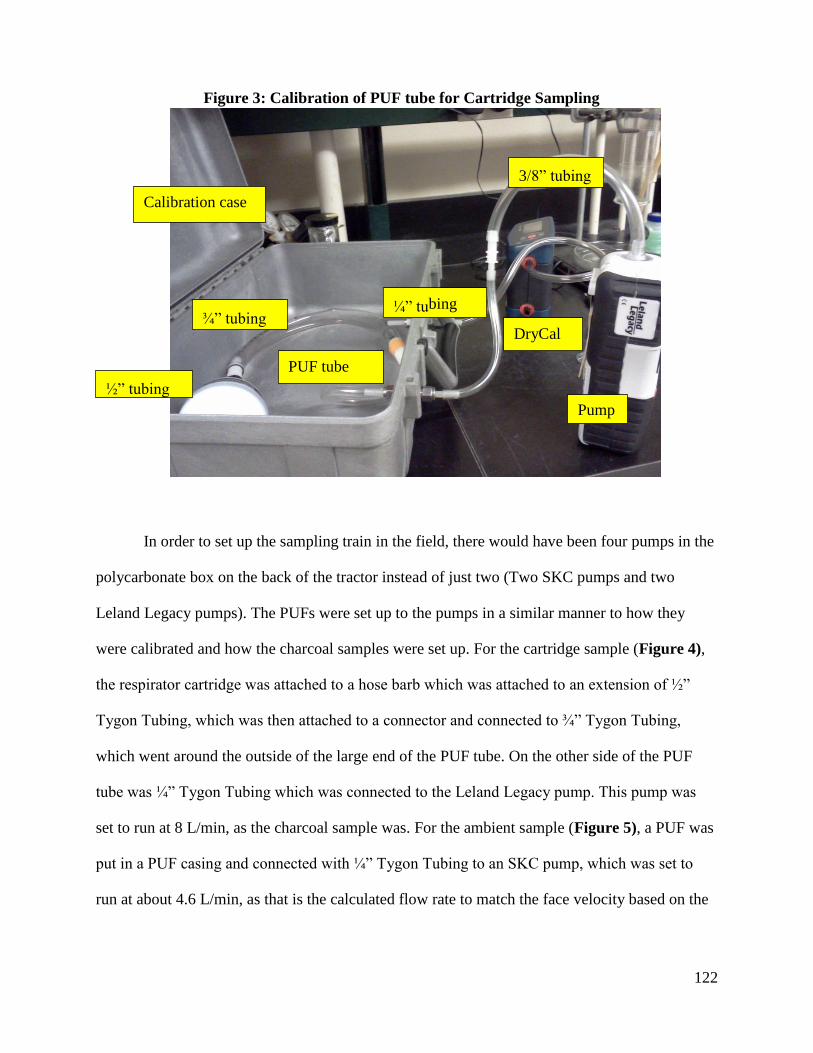
122
In order to set up the sampling train in the field, there would have been four pumps in the
polycarbonate box on the back of the tractor instead of just two (Two SKC pumps and two
Leland Legacy pumps). The PUFs were set up to the pumps in a similar manner to how they
were calibrated and how the charcoal samples were set up. For the cartridge sample (Figure 4),
the respirator cartridge was attached to a hose barb which was attached to an extension of ½‖
Tygon Tubing, which was then attached to a connector and connected to ¾‖ Tygon Tubing,
which went around the outside of the large end of the PUF tube. On the other side of the PUF
tube was ¼‖ Tygon Tubing which was connected to the Leland Legacy pump. This pump was
set to run at 8 L/min, as the charcoal sample was. For the ambient sample (Figure 5), a PUF was
put in a PUF casing and connected with ¼‖ Tygon Tubing to an SKC pump, which was set to
run at about 4.6 L/min, as that is the calculated flow rate to match the face velocity based on the
Calibration case
DryCal
/8‖ tubing 3
Pump
½‖ tubing
PUF tube
¼‖ tu bing ¾‖ tubing
Figure 3: Calibration of PUF tube for Cartridge Sampling
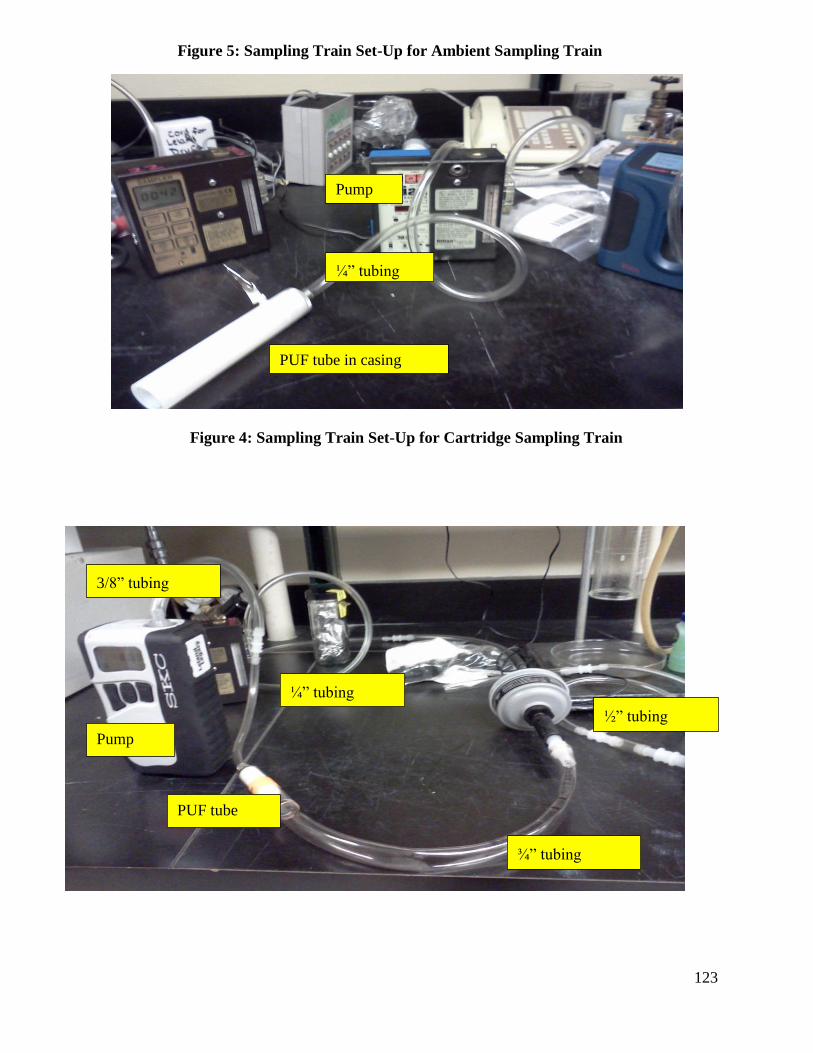
123
Figure 4: Sampling Train Set-Up for Cartridge Sampling Train
PUF tube
3 /8‖ tubing
¾‖ tubing
¼‖ tubing
Pump
½‖ tubing
Pump
¼‖ tubing
PUF tube in casing
Figure 5: Sampling Train Set - Up for Ambient Sampling Train

124
diameter of the PUF tube opening. These samples were set to run attached to the tractor, and
were changed out in a similar manner to how the charcoal samples were changed out. One taken
of the tractor, the PUF tubes were labeled, wrapped in aluminum foil, but back in their glass jars
and in their cardboard boxes, and then put in the dry ice to take back to the lab. In the lab,
Chloryrifos and chlorpyrifos oxon was analyzed for.
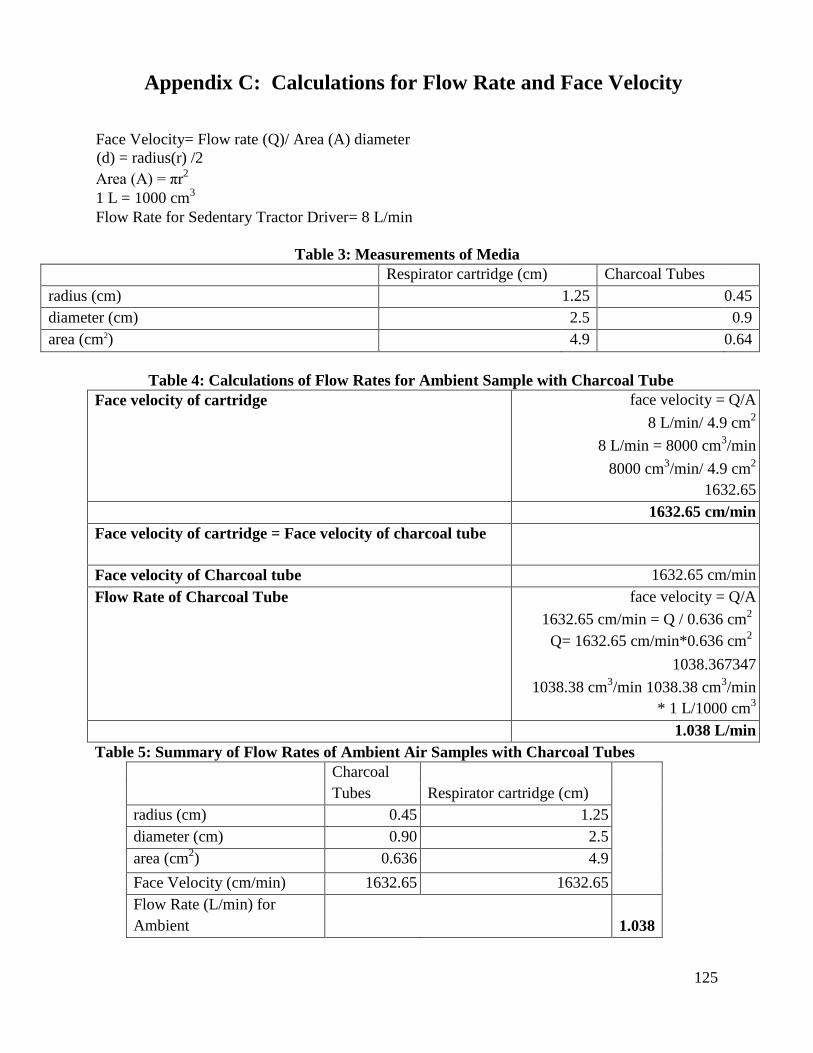
125
Appendix C: Calculations for Flow Rate and Face Velocity
Face Velocity= Flow rate (Q)/ Area (A) diameter
(d) = radius(r) /2
Area (A) = πr2
1 L = 1000 cm3
Flow Rate for Sedentary Tractor Driver= 8 L/min
Table 3: Measurements of Media
Respirator cartridge (cm) Charcoal Tubes
radius (cm) 1.25 0.45
diameter (cm) 2.5 0.9
area (cm2) 4.9 0.64
Table 4: Calculations of Flow Rates for Ambient Sample with Charcoal Tube
Face velocity of cartridge
face velocity = Q/A
8 L/min/ 4.9 cm2
8 L/min = 8000 cm3/min
8000 cm3/min/ 4.9 cm
2
1632.65
1632.65 cm/min
Face velocity of cartridge = Face velocity of charcoal tube
Face velocity of Charcoal tube 1632.65 cm/min
Flow Rate of Charcoal Tube
face velocity = Q/A
1632.65 cm/min = Q / 0.636 cm2
Q= 1632.65 cm/min*0.636 cm2
1038.367347
1038.38 cm3/min 1038.38 cm
3/min
* 1 L/1000 cm3
1.038 L/min
Table 5: Summary of Flow Rates of Ambient Air Samples with Charcoal Tubes
Charcoal
Tubes Respirator cartridge (cm)
radius (cm) 0.45 1.25
diameter (cm) 0.90 2.5
area (cm2) 0.636 4.9
Face Velocity (cm/min) 1632.65 1632.65
Flow Rate (L/min) for
Ambient 1.038

126
Table 6: Summary of Flow Rates of Cartridge Samples with Cassettes
Charcoal
Cloth
Respirator cartridge
(cm)
radius (cm) 0.45 1.25
diameter (cm) 0.90 2.5
Face Velocity (cm/min) 1632.65 1632.65
Flow Rate from inhalation rate of tractor drivers
(L/min) 8.00
Table 7: Summary of Flow Rates of Cartridge Samples with PUF Tubes
PUFs Respirator cartridge (cm)
radius (cm) 0.950 1.25
diameter (cm) 1.90 2.50
area (cm2) 2.83 4.90
Face Velocity
(cm/min)
1630 1630
Flow Rate (L/min) 4.62 8.00

127
Appendix D: Calibration of the Defender DryCal
Table 8: DryCal Flow Rate and Bubble Burette Flow Rate
Pump
Number
Pump
Speed Time
DryCal
flowrate
Avg
flowrate
Bubble
flowrate
Average bubble
flowrate
129609
1.0561
1.0561
1.0561
0.933333
0.95
0.933333
1.0714
1.0526
1.0526
1.058866667
1.071428571
1.052631579
1.071428571
1.065162907
4.61
4.61
0.216667
0.216667
4.6147
4.6147
4.6147
4.615384615
4.615384615
4.615384615
4.61 0.216667 4.6147 4.615384615
8.04 0.116667 8.57 8.57 8.571428571 8.571428571
8.04 0.116667 8.57 8.571428571
8.04 0.116667 8.57 8.571428571
113833
1.06
1.06
1.06
0.933333
0.933333
0.933333
1.0714
1.0714
1.0714
1.0714
1.071428571
1.071428571
1.071428571
1.071428571
4.61 0.216667 4.6147 1.538233333 4.615384615 4.615384615
4.61 0.216667 4.6147 4.615384615
4.61 0.216667 4.6147 4.615384615
Figure 7:Graph of DryCal verses Bubble Burette
y = 0.9997x + 0.003
0
2
4
6
8
10
0 2 4 6 8 10
DryCal vs. Bubble
DryCal vs. Bubble
Linear (DryCal vs. Bubble)
The line of best fit is
y= .9997x +.0003
The r 2 value is 1

128
Appendix E: Number of Samples Used
Table 9: Amount of Each Kind of Media Used for Respirators
Field Samples
Quality Control
Total Per
Day
# of
Sets
Change
outs
Field samples per
day
Level of Spike
Total QC 11
Day 1
3
2
6 High Spike 1 5
High Spike 1
Low Spike 1
Blank 1 1
Blank 2 1
Day 2 3 2 6 Blank 1 1 2 8
Blank 2 1
Day 3
3
2
6 High Spike 1 5
11
High Spike 1
Low Spike 1
Blank 1 1
Blank 2 1
Totals 18 12 30
Blanks for lab
Blanks for
6
Calibration Extras
1
13
Grand Total 50

129
Table 10: Total Number of Samples for Gloves
Field Samples
Quality Control
Total Per
Day
Subjects
Patches Per
Subject
Change
outs
Total per
day
Level of
Spike
Total
QC
Day 1 3 2 2 12
High
Spike 1 5 11
High
Spike 1
Low
Spike 1
Blank 1 1
Blank 2 1
Day 2 3 2 2 12 Blank 1 1 2 8
Blank 2 1
Day 3 3 2 2 12
High
Spike 1 5 11
High
Spike 1
Low
Spike 1
Blank 1 1
Blank 2 1
Totals 36 12 48
Blanks for
lab
Extras
6
16
Grand Total 70

130
Appendix F: Glove Measurements
Table 11: Glove Thickness
Subject
ID Glove
Size Domniant
Hand
Glove Thickness
Palm Back
#1 #2 #3 #1 #2 #3
1 9 Right 0.0173 0.0167 0.0166 0.0165 0.0172 0.0171
2 9 Right 0.0169 0.0161 0.0166 0.0172 0.0175 0.0172
3 9 Right 0.0170 0.0173 0.0171 0.0179 0.0178 0.0171
4 10 Right 0.0161 0.0159 0.0154 0.0167 0.0164 0.0168
5 10 Right 0.0163 0.0156 0.0162 0.0159 0.0162 0.0164
6 10 Right 0.0160 0.0169 0.0167 0.0163 0.0166 0.0157

131
Appendix G: Calibration Data
Table 12: Calibration Data from Ambient Sample with SKC Personal Pump
Date Time
Pump
Number
Pump
Type
Target
Flowrate
Average
Flowrate Media Pre/Post
4/1/2013 20:52 33 SKC 1.0 L/min 1.0566 L/min charcoal tube pre
4/1/2013 20:59 21 SKC 1.0 L/min 1.0537 L/min charcoal tube pre
4/2/2013 17:00 33 SKC 1.0 L/min 1.02 L/min charcoal tube post
4/2/2013 17:13 21 SKC 1.0 L/min 1.04 L/min charcoal tube post
4/11/2013 20:12 33 SKC 1.037 L/min 1.036 L/min charcoal tube pre
4/11/2013 20:42 22 SKC 1.037 L/min 1.03424 L/min charcoal tube pre
4/11/2013 20:42 23 SKC 1.037 L/min 1.0548 L/min charcoal tube pre
4/11/2013 20:45 32 SKC 1.037 L/min 1.013 L/min charcoal tube pre
4/12/2013 16:49 33 SKC 1.037 L/min 1.02 L/min charcoal tube post
4/12/2013 16:47 23 SKC 1.037 L/min 1.04 L/min charcoal tube post
4/12/2013 16:48 32 SKC 1.037 L/min 1.02 L/min charcoal tube post
4/12/2013 19:02 32 SKC 1.037 L/min 1.05 L/min charcoal tube pre
4/12/2013 19:03 22 SKC 1.037 L/min 1.028 L/min charcoal tube pre
4/12/2013 19:04 23 SKC 1.037 L/min 1.043 L/min charcoal tube pre
4/12/2013 19:05 33 SKC 1.037 L/min 1.008 L/min charcoal tube pre
4/13/2013 12:25 32 SKC 1.037 L/min 1.0249 L/min charcoal tube post
4/13/2013 12:23 23 SKC 1.037 L/min 1.028 L/min charcoal tube post
4/13/2013 12:27 33 SKC 1.037 L/min 1.024 L/min charcoal tube post
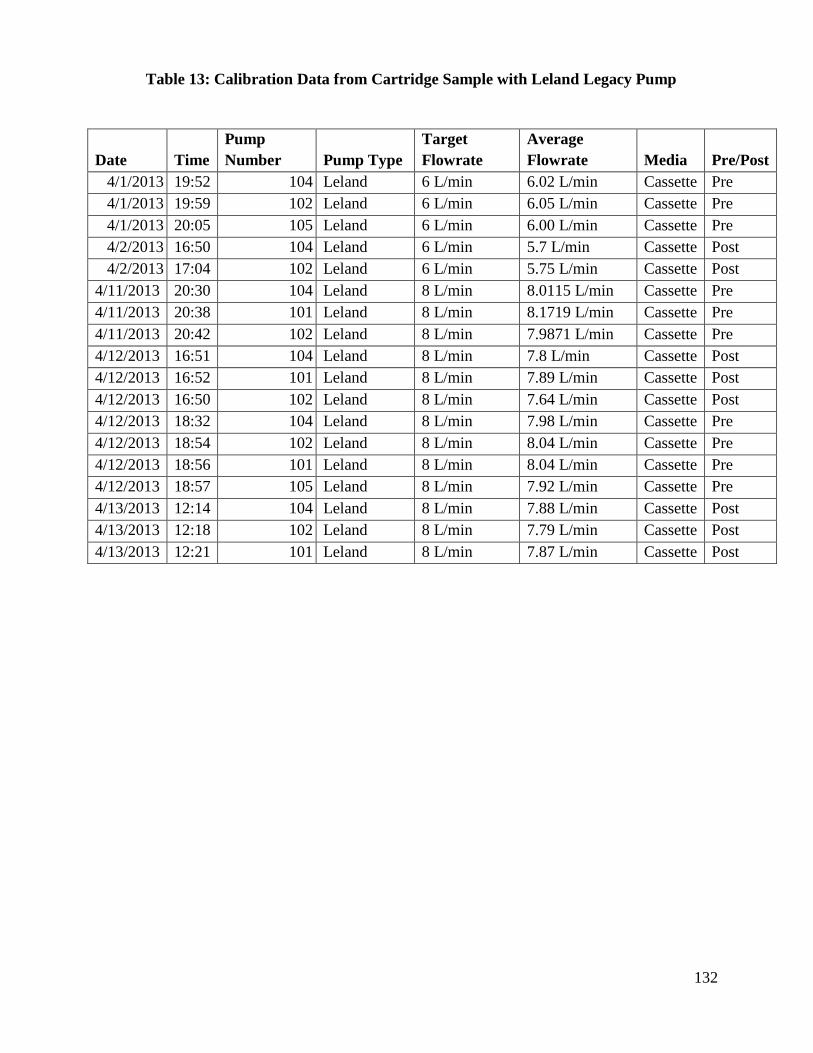
132
Table 13: Calibration Data from Cartridge Sample with Leland Legacy Pump
Date Time
Pump
Number Pump Type
Target
Flowrate
Average
Flowrate Media Pre/Post
4/1/2013 19:52 104 Leland 6 L/min 6.02 L/min Cassette Pre
4/1/2013 19:59 102 Leland 6 L/min 6.05 L/min Cassette Pre
4/1/2013 20:05 105 Leland 6 L/min 6.00 L/min Cassette Pre
4/2/2013 16:50 104 Leland 6 L/min 5.7 L/min Cassette Post
4/2/2013 17:04 102 Leland 6 L/min 5.75 L/min Cassette Post
4/11/2013 20:30 104 Leland 8 L/min 8.0115 L/min Cassette Pre
4/11/2013 20:38 101 Leland 8 L/min 8.1719 L/min Cassette Pre
4/11/2013 20:42 102 Leland 8 L/min 7.9871 L/min Cassette Pre
4/12/2013 16:51 104 Leland 8 L/min 7.8 L/min Cassette Post
4/12/2013 16:52 101 Leland 8 L/min 7.89 L/min Cassette Post
4/12/2013 16:50 102 Leland 8 L/min 7.64 L/min Cassette Post
4/12/2013 18:32 104 Leland 8 L/min 7.98 L/min Cassette Pre
4/12/2013 18:54 102 Leland 8 L/min 8.04 L/min Cassette Pre
4/12/2013 18:56 101 Leland 8 L/min 8.04 L/min Cassette Pre
4/12/2013 18:57 105 Leland 8 L/min 7.92 L/min Cassette Pre
4/13/2013 12:14 104 Leland 8 L/min 7.88 L/min Cassette Post
4/13/2013 12:18 102 Leland 8 L/min 7.79 L/min Cassette Post
4/13/2013 12:21 101 Leland 8 L/min 7.87 L/min Cassette Post

133
Appendix H: Table of Contents from Field Manuals
1. Researchers‘ Names and Contact Information 2. Timeline and Daily Checklist 3. Objective and Purpose of Study 4. Instrument Manuals
a. Defender DryCal b. SKC personal pump c. Leland Legacy Pump
5. Checklists a. List of Materials b. Packing List
6. In lab preparation a. SOP 1
7. Calibration a. Calibration for Calibrator
i. SOP 2 ii. Data Sheets
b. Calibration for pumps i. SKC Pump
1. SOP 3 ii. Leland Legacy pumps
1. SOP 4 iii. Data Sheets
8. Set-Up of Sampling Trains a. SOP 5
9. Field Sampling a. SOP 6 b. Data Sheets
10. Gloves a. Glove Description b. Permeatic Solvents
11. Quality Control Blanks/Spikes a. SOP 7 b. Table for Spiking amounts
12. Storage and Transport a. SOP 8
13. Labeling a. Labeling Instructions b. Labels
14. Chemical Information a. Lorsban
i. MSDS Sheet for Lorsban 4-E ii. Specimen Label for Lorsban 4-E
b. Supreme Oil i. MSDS Sheet for Supreme Oil
ii. Specimen Label for Supreme Oil
c. Acetone i. MSDS Sheet for Acetone

134
15. General Health and Safety a. Personal Safety and Welfare b. PPE and Safety Supplies c. UW policy for Workplace Violence d. UW vehicles

Appendix I: Data Sheets
Staff Initials:________ Site _________ Tractor _______ Date ________ Temperature ________ Barometric
Pressure________ Page ___/____
Respirator Cartridge Effectiveness Study-Personal Air Sampling Data Sheet
Sample_ID Pum
p #
Chk_flow Chk_flw
time
Media on
trctr time
Media off
trctr time
Chk_flw
or
Cal_flw
Chk_flw
time or
stop_flw
time
Run time Comments
PR13_airsampledatasheetAS_24March13

131
Filled out by: Date Site ID Day# SubjectID Glove #
PS PUF (Solvents) Change Out (Gloves)
Charcoal Patches Notes
Rep # On time Off time
Terms: CHR Rep#: The first set of Permeatec sensors is 1. The second set is 2, and so on. CHR On/Off Time: Time Permeatec Rep was placed onto and removed from the subject. Glove G#: This corresponds to the Glove Number on glove.

137
32
Appendix J: Supplies
Table 14: Respirator Supplies
Sampling Train Supplies General Attachment/Removal
to/from Tractor
Miscellaneous
Ambient SKC Pump ¼‖ Tubing ¼‖ to 3/8‖ Reducing Connector 3/8‖ Tubing Charcoal Tube
PVC Pipe Casing
Red
Caps/Parafilm
Plastic Bags
Glass Cutter
Safety Glasses
Broken Glass
Container
Electrical Tape
Polycarbonate Case
Rubber Gaskets
Metal things XXX
Velcro
Sampling Trains
Zip Ties
Aluminum Foil
Blue Masking Tape
Wire cutters
Scissors
Exacto Knife
Litter Boxes
Clorox Wipes
Lab Diapers
Labels
Kim Wipes
Dish soap
Trash Bags
Lab Tape
Allen Wrench
Cartridge Leland Legacy Pump
¼‖ Tubing
White Urea Leur
3 Piece Cassette
2 Porous Plastic Support
Pads
2 Charcoal Cloth circles
(packaged in vials) PVC Pipe ¼‖ to ½‖ Reducing Connector ½‖ Tubing
¾‖ to ½‖ Hose Barb
OV Cartridge with R-95
Pre-filter
Isopropyl Alcohol
Q-tips Flat head screwdriver Forceps Acetone
Plastic Beakers
Kim Wipes
4 mL Vials
Plastic Bags
Electrical Tape
Zip Ties
Parafilm
Teflon Tape
Table 15: Glove Supplies
Glove Testing Supplies General
15 mil Nitrile Gloves of the
correct size
PermaTech patches
Aluminum Foil Tape
Vials for Sampling Media
ParaFilm
5 mil Nitrile Gloves
Forceps
Lab Diapers
Acetone
Labels

138
Appendix K: Quality Control Spiking
Table 16: Quality Control Spiking
Media Day 1 Day 2 Day 3 Day 4
Charcoal tubes- ambient High
Field
Blank High
Field
Blank O-xylene
High dup
Field
Blank High dup
Field
Blank High Spike 200 ug
Low Low Low Spike 50 ug
Field
Blank
Field
Blank Pentadecane
Field
Blank
Field
Blank High Spike
Low Spike
200 ug
50 ug
Charcoal cloth circles-
cartridge High
Field
Blank High
Field
Blank
High dup
Field
Blank High dup
Field
Blank
1,2,4
Trimethylbenzene
Low Low High Spike 200 ug
Field
Blank
Field
Blank Low Spike 50 ug
Field
Blank
Field
Blank

139
Appendix L: Explanation of Labels
Explanation of a respirator label :
Project: PR for
PPE Respirators
for 13
2013 Site A Set 11 Day 1 Change out
time ―a‖ AM (
sample)
Charcoal Unique
ID
PR13_A11_1a_Fc_503
Cartridge
( F for
filter)
Project: PG
for PPE
Gloves
for 13
2013 Site A Subject 3 Day 1 Change out
time ―a‖ ( AM
sample)
Charcoal Unique
ID
PG1 _A 03 3 _1a _Bc_229
B for
back of
hand
Figure 25: Explanation of a Glove Label
Project: PR for
PPE Respirators
for 13
2013 Site A Day 1 Charcoal
cassettes (F
for fabric)
Unique
ID
PR13_A_1F_SH1_913
Spike high
sample 1
Figure 2 Explanation of a Quality Control 6:

140
Figure 27: Abigail and Maria changing out
media on a tractor during lunch break
Figure 29: Sampling Box on the
back of a tractor
Figure 28: Pablo and Miyoko
changing out media on a glove
during lunch break
Appendix M: Pictures of Field Work
Figure 30: Mixing and Loading Station

141
Figure 32: Pouring Pesticide into Applicator on Back of Tractor
Figure 31: Lime Sulfur being poured
Figure 33: Field Te am: From Left,
Miyoko Abigail, Maria, Kit and Pablo

142
Appendix N: Demographic Data Table 17a: Demographic Data for Respirators
Set # Tanks Tractor Type Sprayer Type Product Name EPA Reg # Pest. App Rate
11 8
New Holland TN
95FA airblast
1) Microthiol Disperss
2) Warhawk
70506-187
34704-857
1) Spider mite, Two
spotted mite 2)
Lygus bug
10 lb/acre
2 Qt/acre
3) Omni Supreme Spray 5905-368 3) San Jose' Scale 5 gal/acre
12 7
New Holland TN
95FA airblast
1) Microthiol Disperss
2) Warhawk
70506-187
34704-857
1) Spider mite, Two
spotted mite 2)
Lygus bug
10 lb/acre
2 Qt/acre
3) Omni Supreme Spray 5905-368 3) San Jose' Scale 5 gal/acre
13 3 New Holland TN
4040Y
Stainless
Turbo Mist
1) Lime Sulfur
2) Supreme Oil
71096-6
2935-405
1) Mildew
2) San Jose Scale,
European Red Mite
6 gal/acre
3 gal/acre
14 3 & 50
gallons
New Holland TN
4040Y
Stainless
Turbo Mist
1) Lime Sulfur
2) Supreme Oil
71096-6
2935-405
1) Mildew
2) San Jose Scale,
European Red Mite
6 gal/acre
3 gal/acre
15 3.5 New Holland TN
4040Y
Stainless
Turbo Mist
1) Lime Sulfur
2) Supreme Oil
71096-6
2935-405
1) Mildew
2) San Jose Scale,
European Red Mite
6 gal/acre
3 gal/acre
16 1 & 240
gallons
New Holland TN
4040Y
Stainless
Turbo Mist
1) Lime Sulfur
2) Supreme Oil
71096-6
2935-405
1) Mildew
2) San Jose Scale,
European Red Mite
6 gal/acre
3 gal/acre
17 2 & 350
gallons
New Holland TN
4040Y
Stainless
Turbo Mist
1) Lime Sulfur
2) Supreme Oil
71096-6
2935-405
1) Mildew
2) San Jose Scale,
European Red Mite
6 gal/acre
3 gal/acre
18 2.5 New Holland TN
4040Y
Stainless
Turbo Mist
1) Lime Sulfur
2) Supreme Oil
71096-6
2935-405
1) Mildew
2) San Jose Scale,
European Red Mite
6 gal/acre
3 gal/acre

143
Table 17b: Demographic Data for Respirators
Set
Concentration
Prod Sprayer Tank Size Comments
11
80%
44.90%
98% 400 gallons
First Day Spraying. Stopped Spraying
chlorpyrifos today and will continue
spraying this insecticide later- (maybe
April 5-2013)
12
80%
44.90%
98% 400 gallons
Stopped Spraying today (April 2-
2013). They will continue spraying
chlorpyrifos later (maybe on April
52013)
13 28%
99% 400 gallons
14 28%
99% 400 gallons
15 28%
99% 400 gallons
16 28%
99% 400 gallons
17 28%
99% 400 gallons
18 28%
99% 400 gallons

144
Table 18: Demographics for Gloves
Age Sex Ethnicity Race
Height
(in) Weight
Primary
Language
Seasons in
Industry
Seasons with
Orchard
Gloves
Underneath?
34 M Hispanic or
Latino White 71 - Spanish 4 4 No
37 M
Hispanic or
Latino White 69 - Spanish 11 1
Yes- Cloth
Gloves
21 M
Hispanic or
Latino White 63 37.1 kl Spanish 6 2 weeks No
25 M
Hispanic or
Latino Unknown 69.5 96.5 kl English 2 1
Yes- Nitrile
Gloves
24 M
Hispanic or
Latino Unknown 67 92.2 kl Spanish 4 1 Yes- Latex
21 M
Hispanic or
Latino White 69.5 93.1 kl Spanish 1 2 Yes-Latex

145
Appendix O: Quality Assurance from Lab
Table 19: Quality Assurance for Charcoal Cloth Circles (ug/sample)
Parameter p-Xylene (ug/sample) o-Xylene (ug/sample)
Cumene
(ug/sample) 1,2,4-Trimethyl benzene Pentadecane
Unknown
Alkanes
R2, calibration 1.0000 1.0000 1.0000 0.9999 1.0000 NA
Reporting Limit,
(ug) 2 2 1 2 1 1
SR Efficiency 86% 86% 91% 88% 87% NA
Table 20: Quality Assurance for Charcoal Cloth Tubes
Parameter p-Xylene o-Xylene Cumene 1,2,4-Trimethyl benzene Pentadecane Unknown Alkanes
Non-aromatic
hydrocarbons
R2, calibration 0.9998 0.9999 0.9999 0.9996 0.9998 NA
NA
Reporting Limit, Front
(ug) 2 2 2 2 5 10
5
Reporting Limit, Back
(ug) 1 1 1 1 2 NA
2
NA
SR Efficiency 74% 77% 81% 72% 68% NA
Table 21: Quality Assurance for Glove Charcoal Cloth Circles at Site A
Parameter p-Xylene (ug/sample) 1 Cumene (ug/sample) 1,2,4-Trimethyl benzene Pentadecane Unknown Alkanes
R2, calibration 1.0000 0.9999 0.9999 0.9996 0.9998 NA
Reporting Limit (ug) 2 2 0.6 2 8 NA
SR Efficiency 97% 77% 103% 96% 92% NA

146
Table 22: Quality Assurance for Glove Charcoal Cloth Circles at Site B
Parameter
p-Xylene
(ug/sample)
o-Xylene
(ug/sample)
Cumene
(ug/sample)
1,2,4-Trimethyl
benzene Pentadecane
Unknown
Alkanes
R2, calibration 1.0000 1.0000 1.0000 0.9999 1.0000 NA
Reporting Limit
(ug) 2 2 0.6 2 6 NA
SR Efficiency 108% 107% 108% 104% 106% NA

147
Appendix P: Calculations of Upper Limit of Non-Hits
Table 34: Charcoal Tube Blanks
Charcoal Tubes (in ug/sample)
ID Site
Mass of Unknown
Alkanes Average
Average Total
(ug/sample)
Standard
Deviation
Standard
Error Upper Limit
901
A
100 90
902
95 7.071067812 5 105
916
B
0
10
917
937 70 0
938
20 33.67 16.83 87.33
Totals 45 46.80 19.10 83.21

148
Table 35: Charcoal Cloth Blanks
Charcoal Cloths
ID Site
Mass of Unknown Alkanes
(ug/sample) Average
Average Total
(ug/sample)
Standard
Deviation
Standard
Error
Upper
Limit
911
A
3
2
912
2.5 0.707106781 0.5 3.5
920
B
0
22
3
0
921
932
933
6.25 10.59481005 5.297405025 27.4396201
Totals 5 8.438009244 3.444802849 11.8896057
Table 36: Gloves Blanks:
Charcoal Cloth for Gloves (ug/sample)
ID Site Mass of Unknown Alkanes Average
Average
Total Standard Deviation Standard Error Upper Limit
401
402 A
1246
1048
1147
413
414
415 B
1270
1220
993
416 1250
1183.25
1171.166667 119.0637084 48.60755543 1268.381778

149
Appendix Q: Calculations of Adjusted Mass
Table 37: Adjusted Mass for Ambient Samples
Ambient Sample- Charcoal Tube
ID Unknown Alkanes
(ug/sample)
Total Run Time
(min)
Flow Rate
(L/min)
Total Liters
air
Adjusted Mass Unknown Alkanes
(ug/sample)
501 410 283 1.2 339.6 398.41
505 1860 260 1.20 312.00 1967.31
537 240 264 1.10 290.40 272.73
541 220 290 1.10 319.00 227.59
525 90 358 1.02 365.16 81.33
529 50 265 1.02 270.30 61.04
573 20 362 1.02 369.24 17.87
577 40 260 1.02 265.20 49.77
609 20 368 1.05 386.40 17.08
613 0 260 1.04 270.40 0
630 200 355 1.04 367.60 179.54
632 480 389 1.04 405.57 390.56
634 150 391 1.04 404.69 122.32

150
Table 38: Adjusted Mass for Cartridge Samples
Cartridge Sample- Charcoal Cloth
ID Unknown Alkanes
(ug/sample)
Total Run Time
(min)
Flow Rate
(L/min)
Total Liters
air
Adjusted Mass Unknown Alkanes
(ug/sample)
503 722 284 6.80 1931.20 747.72
507 18620 305 5.70 1738.50 21420.77
539 527 264 6.60 1742.40 604.91
543 333 291 5.75 1673.25 389.03
527 0 361 7.92 2859.12 0
531 5 262 7.80 2043.60 4.89
575 6 365 7.97 2909.05 4.13
579 9 290 7.89 2288.10 7.87
611 79 369 7.87 2904.03 54.41
615 0 289 7.64 2207.96 0
631 17 357 7.96 2841.72 11.96
633 19 370 7.95 2941.50 12.92
635 18 347 8.07 2800.29 12.86