Embed Size (px)
Citation preview
PPAR activation Clinical evidence
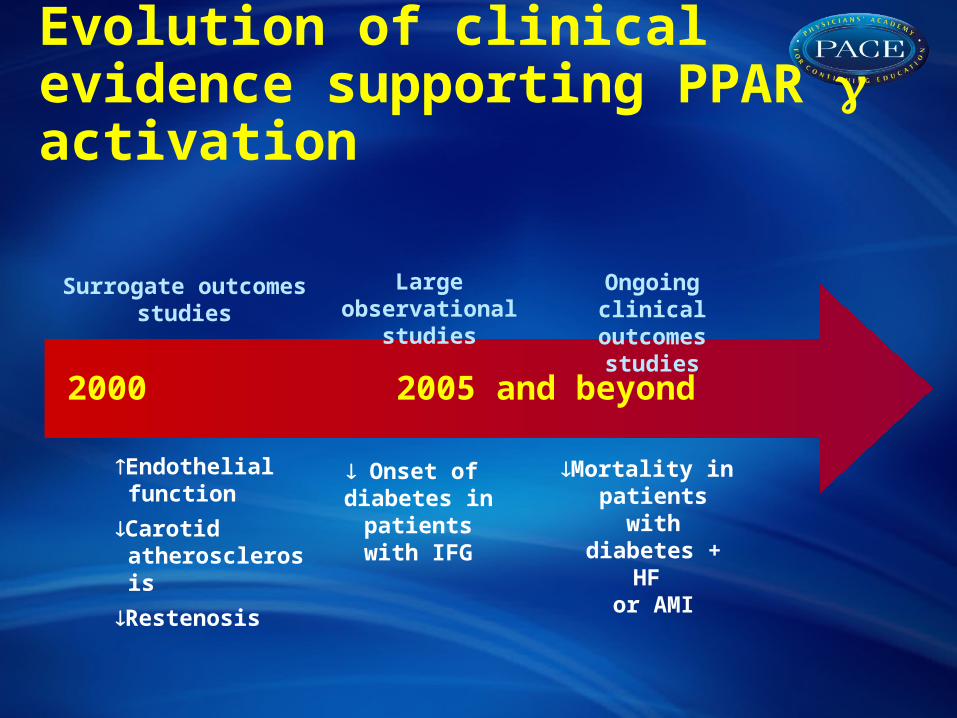
Evolution of clinical evidence supporting PPAR activation
2000 2005 and beyond
Surrogate outcomes studies Large observational studies
Ongoing clinical outcomes studies
Endothelialfunction
Carotid atherosclerosis
Restenosis
Mortality in patients with diabetes + HF
or AMI
Onset of diabetes in
patients with IFG
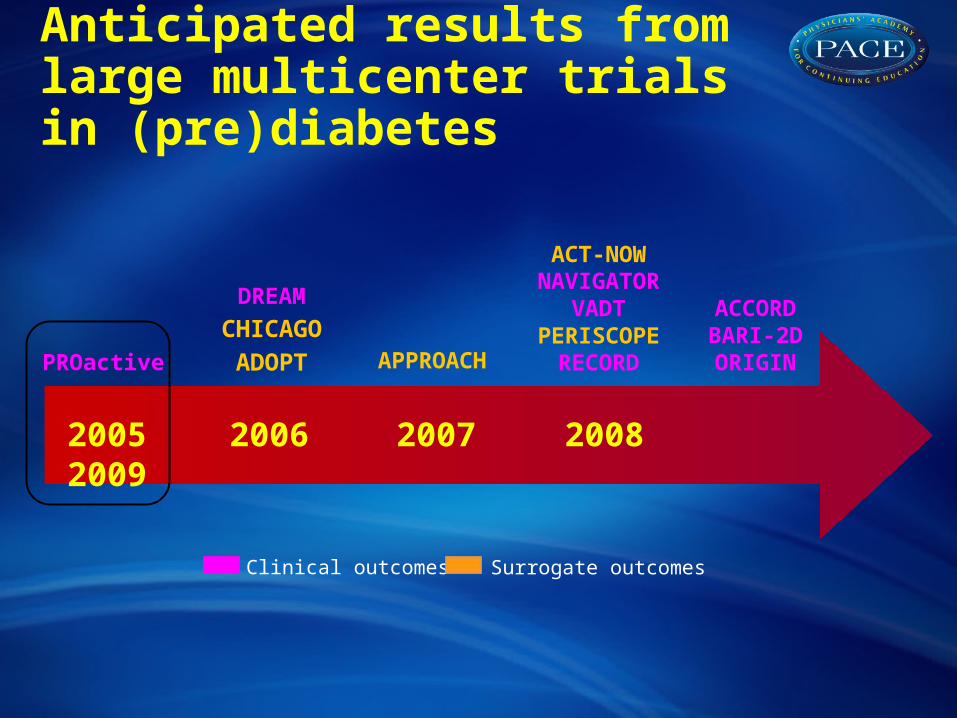
Anticipated results from large multicenter trials in (pre)diabetes
2005 2006 2007 2008 2009
PROactive
DREAMCHICAGO
ADOPT APPROACH
ACCORDBARI-2DORIGIN
Clinical outcomes Surrogate outcomes
NAVIGATOR
VADT
RECORD
ACT-NOW
PERISCOPE
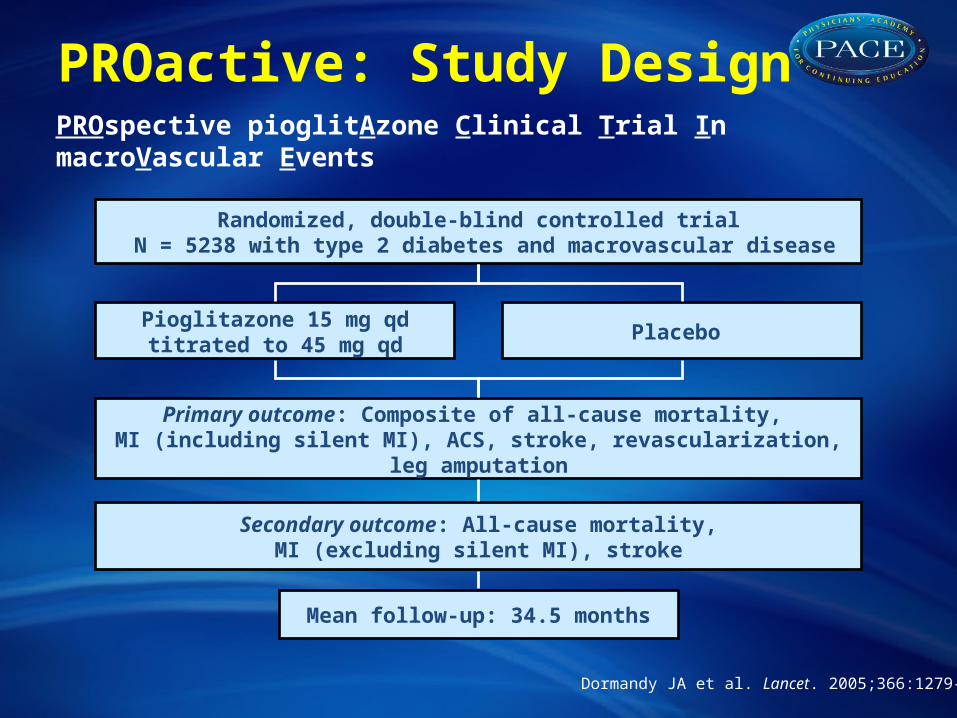
Dormandy JA et al. Lancet. 2005;366:1279-89.
PROactive: Study Design
Pioglitazone 15 mg qdtitrated to 45 mg qd
Randomized, double-blind controlled trial N = 5238 with type 2 diabetes and macrovascular disease
Primary outcome: Composite of all-cause mortality, MI (including silent MI), ACS, stroke, revascularization, leg amputation
Secondary outcome: All-cause mortality,MI (excluding silent MI), stroke
PROspective pioglitAzone Clinical Trial In macroVascular Events
Mean follow-up: 34.5 months
Placebo
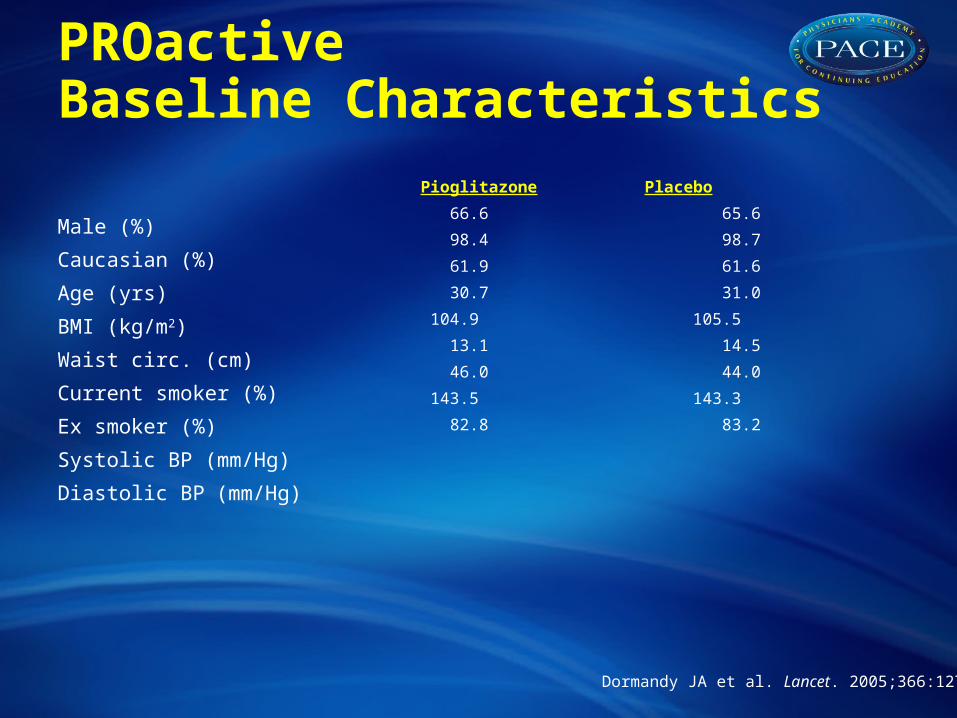
PROactive Baseline Characteristics
Male (%)
Caucasian (%)
Age (yrs)
BMI (kg/m2)
Waist circ. (cm)
Current smoker (%)
Ex smoker (%)
Systolic BP (mm/Hg)
Diastolic BP (mm/Hg)
Pioglitazone Placebo
66.6 65.6
98.4 98.7
61.9 61.6
30.7 31.0
104.9 105.5
13.1 14.5
46.0 44.0
143.5 143.3
82.8 83.2
Dormandy JA et al. Lancet. 2005;366:1279-89.
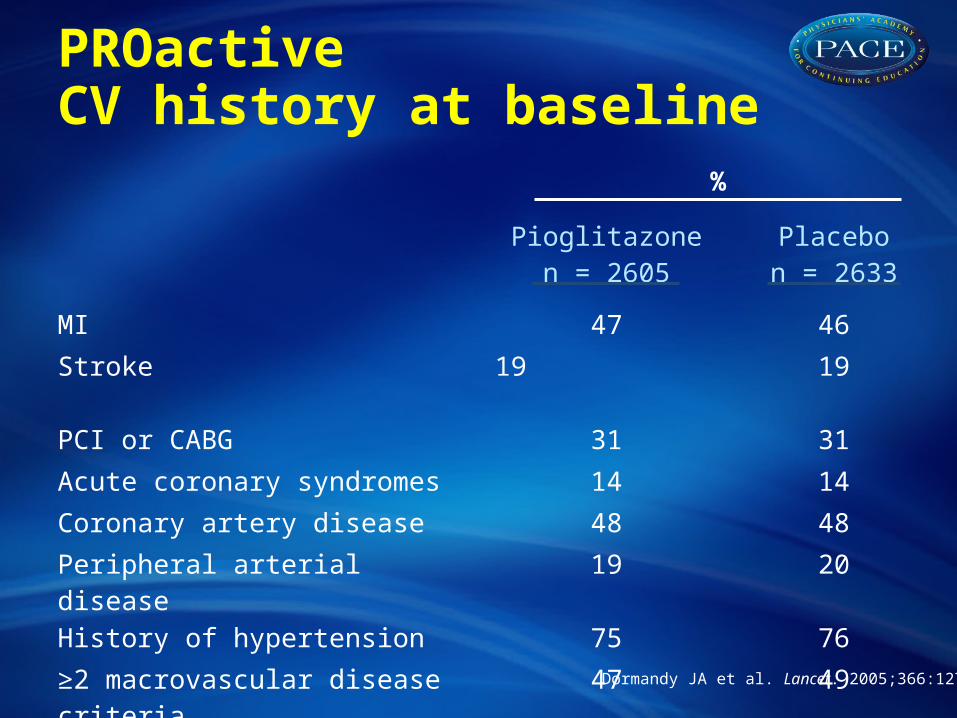
PROactive CV history at baseline
Dormandy JA et al. Lancet. 2005;366:1279-89.
Pioglitazonen = 2605
Placebon = 2633
MI 47 46
Stroke 19 19
PCI or CABG 31 31
Acute coronary syndromes 14 14
Coronary artery disease 48 48
Peripheral arterial disease 19 20
History of hypertension 75 76
≥2 macrovascular disease criteria 47 49
%
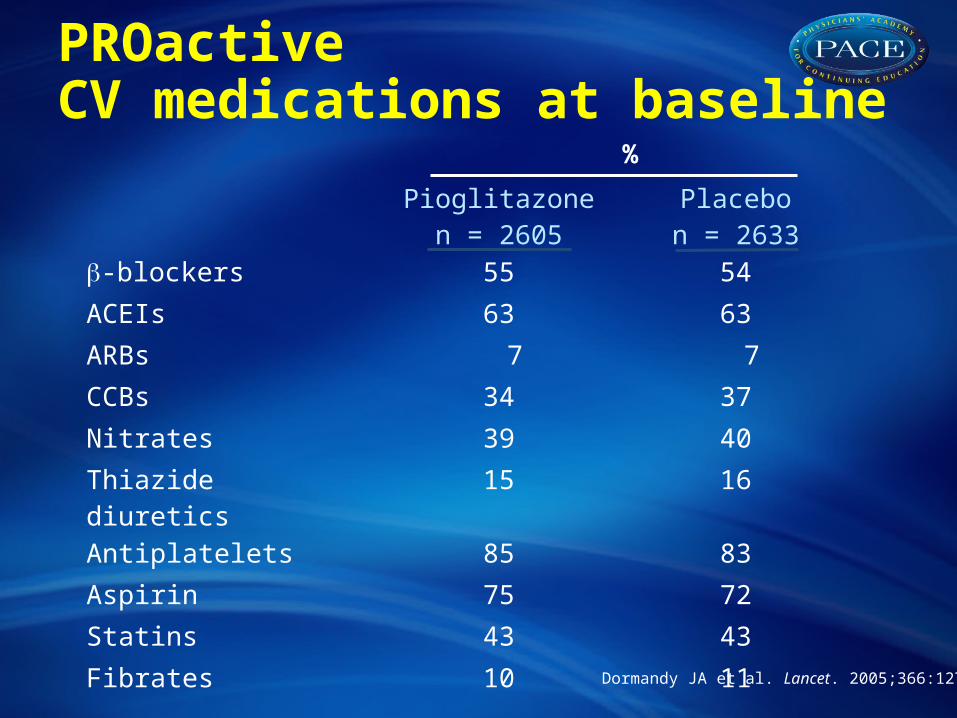
PROactive CV medications at baseline
Dormandy JA et al. Lancet. 2005;366:1279-89.
Pioglitazonen = 2605
Placebon = 2633
-blockers 55 54
ACEIs 63 63
ARBs 7 7
CCBs 34 37
Nitrates 39 40
Thiazide diuretics 15 16
Antiplatelets 85 83
Aspirin 75 72
Statins 43 43
Fibrates 10 11
%
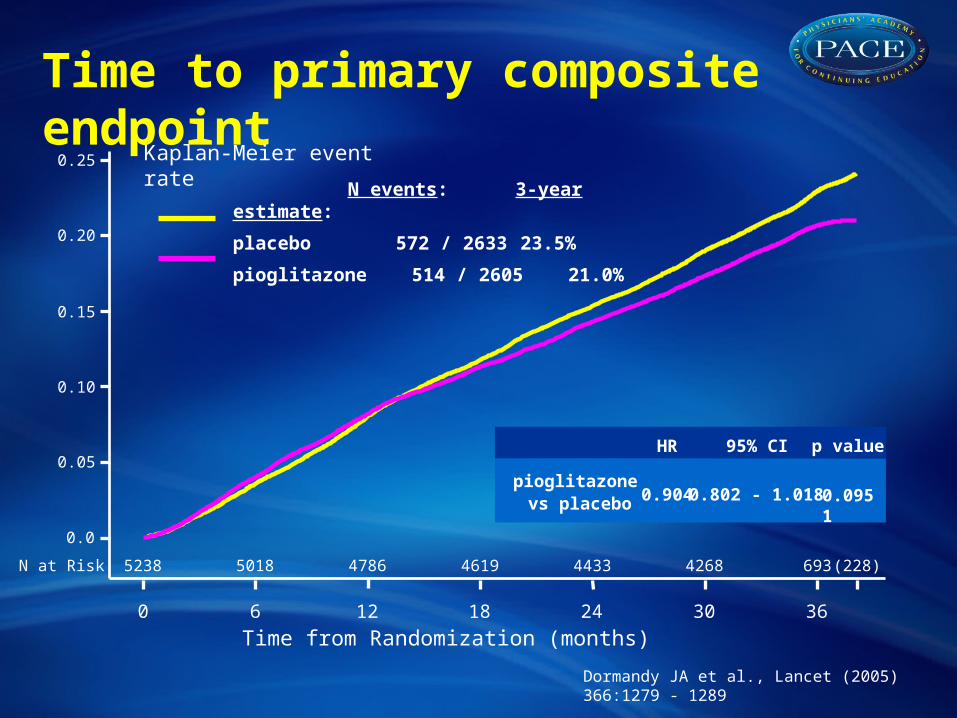
Time from Randomization (months)
N at Risk:
HR 95% CI p value
pioglitazone vs placebo 0.904 0.802 - 1.018 0.0951
N events: 3-year estimate:
placebo 572 / 2633 23.5%
pioglitazone 514 / 2605 21.0%
Time to primary composite endpoint
Kaplan-Meier event rate
0 6 12 18 24 30 36
5238 5018 4786 4619 4433 4268 693 (228)
0.0
0.05
0.10
0.25
0.15
0.20
Dormandy JA et al., Lancet (2005) 366:1279 - 1289
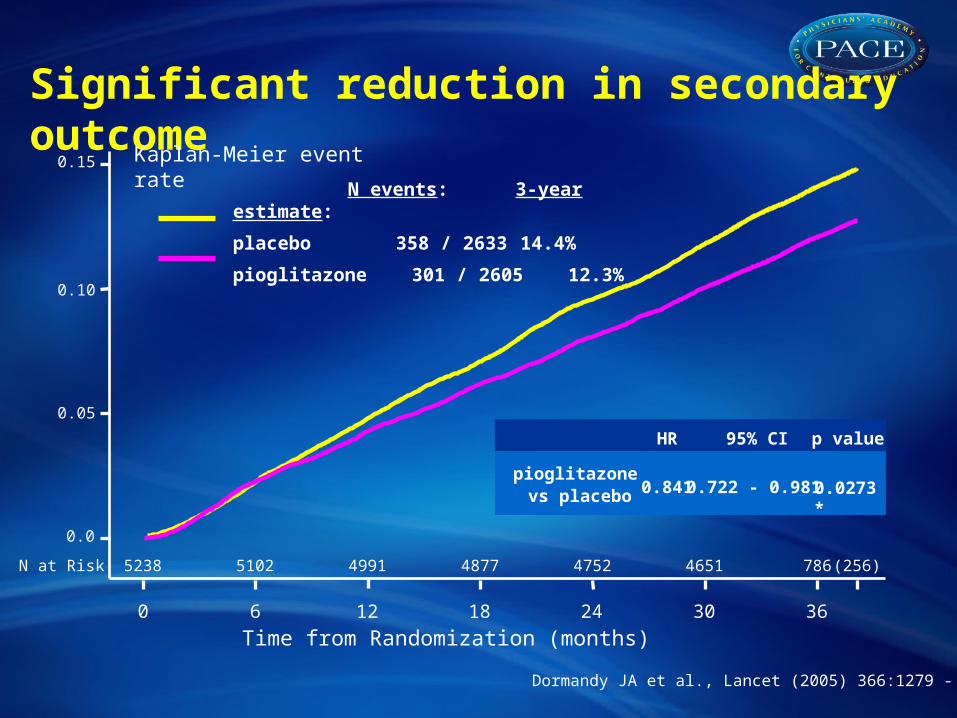
Time from Randomization (months)
N at Risk:
HR 95% CI p value
pioglitazone vs placebo 0.841 0.722 - 0.981 0.0273 *
N events: 3-year estimate:
placebo 358 / 2633 14.4%
pioglitazone 301 / 2605 12.3%
Significant reduction in secondary outcomeKaplan-Meier event rate
0 6 12 18 24 30 36
5238 5102 4991 4877 4752 4651 786 (256)
0.0
0.05
0.10
0.15
Dormandy JA et al., Lancet (2005) 366:1279 - 1289
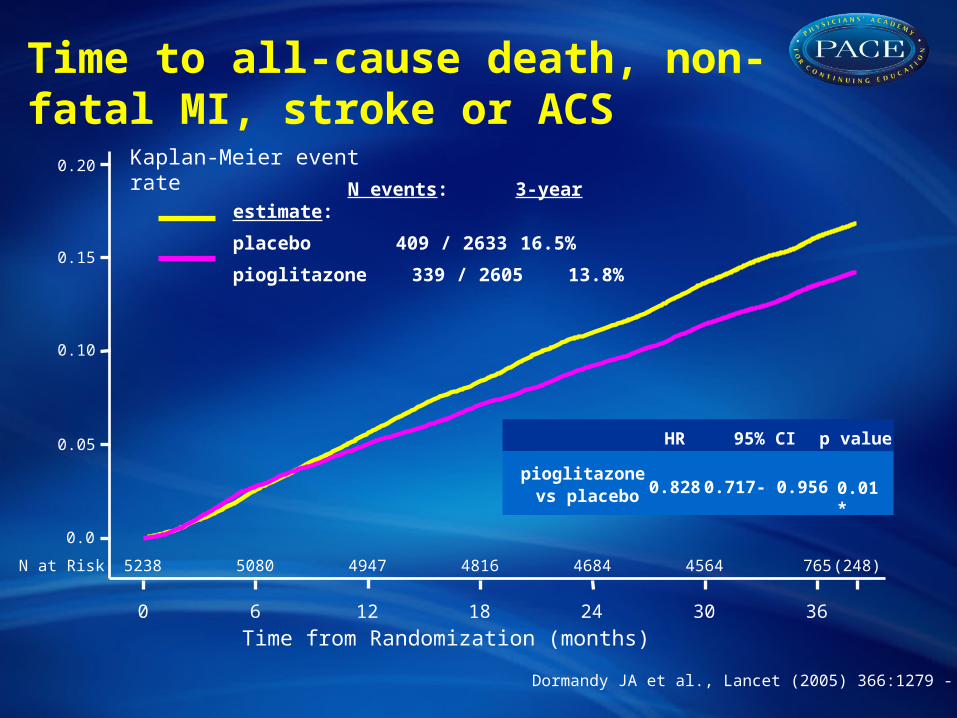
Time from Randomization (months)
N at Risk:
HR 95% CI p value
pioglitazone vs placebo 0.828 0.717- 0.956 0.01 *
N events: 3-year estimate:
placebo 409 / 2633 16.5%
pioglitazone 339 / 2605 13.8%
Time to all-cause death, non-fatal MI, stroke or ACS
Kaplan-Meier event rate
0 6 12 18 24 30 36
5238 5080 4947 4816 4684 4564 765 (248)
0.0
0.05
0.10
0.20
0.15
Dormandy JA et al., Lancet (2005) 366:1279 - 1289
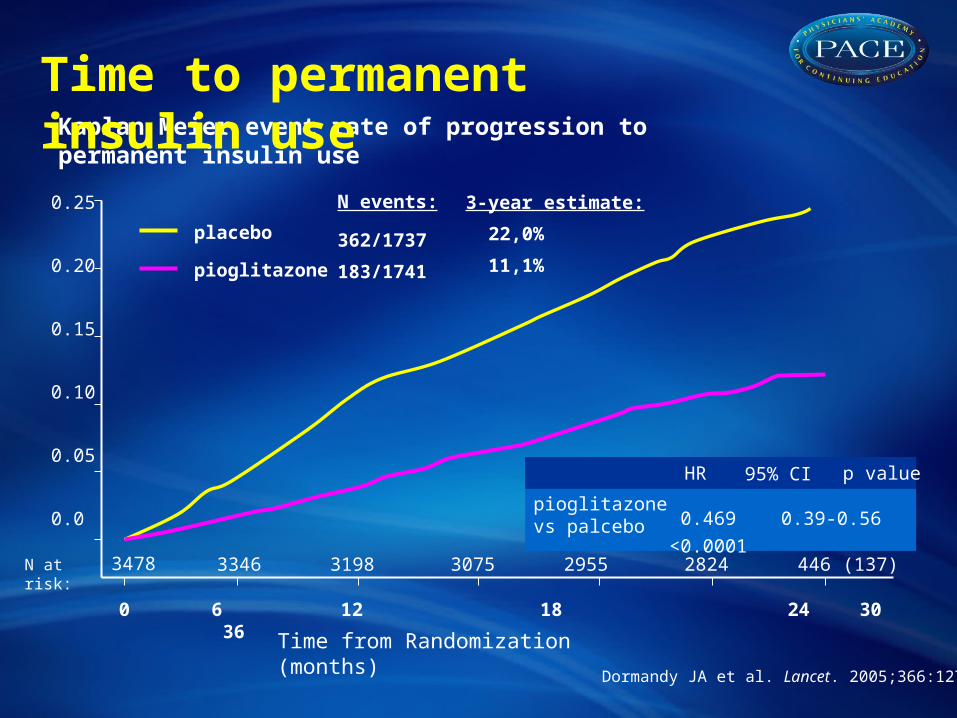
placebo
pioglitazone
N events: 3-year estimate:
362/1737
183/1741
22,0%
11,1%
Kaplan Meier event rate of progression to permanent insulin use
HR 95% CI p value
pioglitazone vs palcebo 0.469 0.39-0.56 <0.0001
Time from Randomization (months)
N at risk:
0.25
0.20
0.15
0.10
0.05
0.0
0 6 12 18 24 30 36
3478 3346 3198 3075 2955 2824 446 (137)
Time to permanent insulin use
Dormandy JA et al. Lancet. 2005;366:1279-89.
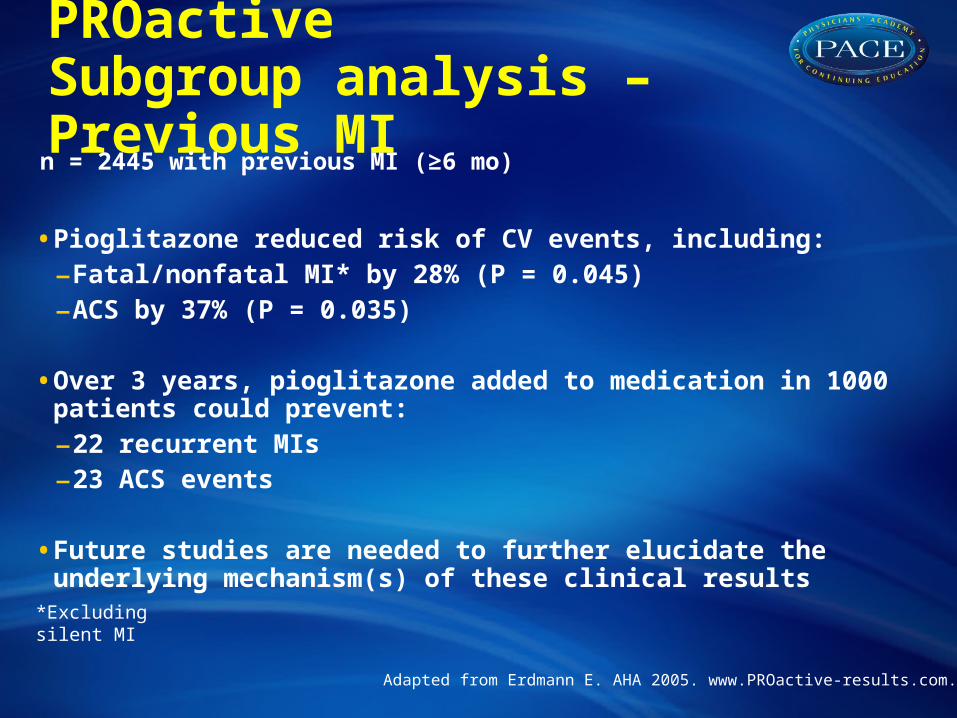
PROactive Subgroup analysis – Previous MI
• Pioglitazone reduced risk of CV events, including:
–Fatal/nonfatal MI* by 28% (P = 0.045)
–ACS by 37% (P = 0.035)
• Over 3 years, pioglitazone added to medication in 1000 patients could prevent:
–22 recurrent MIs
–23 ACS events
• Future studies are needed to further elucidate the underlying mechanism(s) of these clinical results
Adapted from Erdmann E. AHA 2005. www.PROactive-results.com.
*Excluding silent MI
n = 2445 with previous MI (≥6 mo)
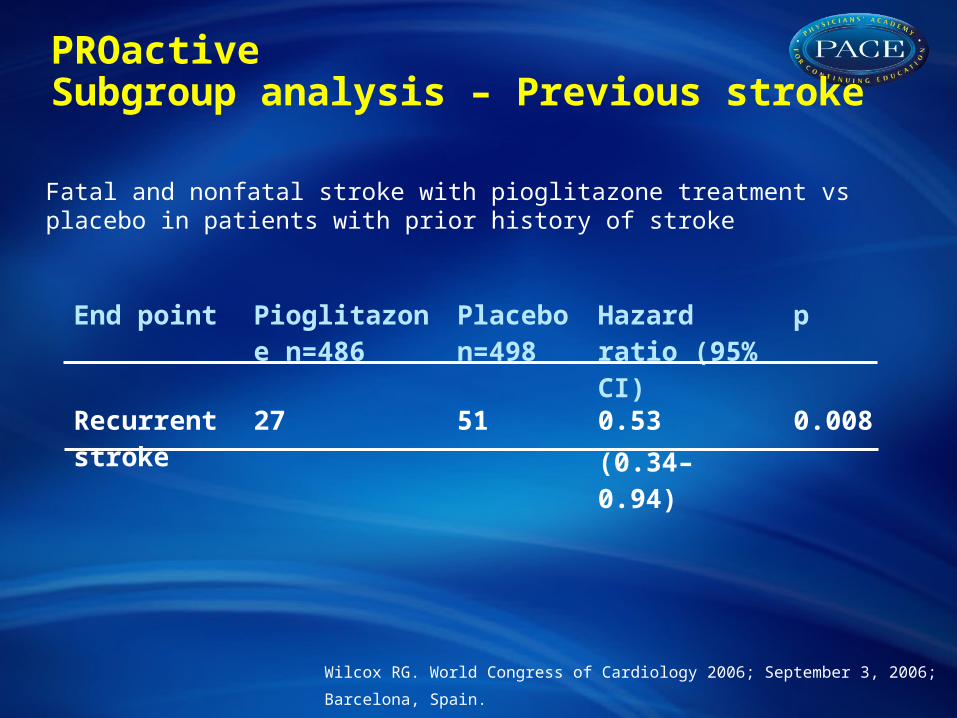
PROactive Subgroup analysis – Previous stroke
Wilcox RG. World Congress of Cardiology 2006; September 3, 2006; Barcelona, Spain.
End point Pioglitazone n=486
Placebo n=498
Hazard ratio (95% CI)
p
Recurrent stroke
27 51 0.53(0.34– 0.94)
0.008
Fatal and nonfatal stroke with pioglitazone treatment vs placebo in patients with prior history of stroke
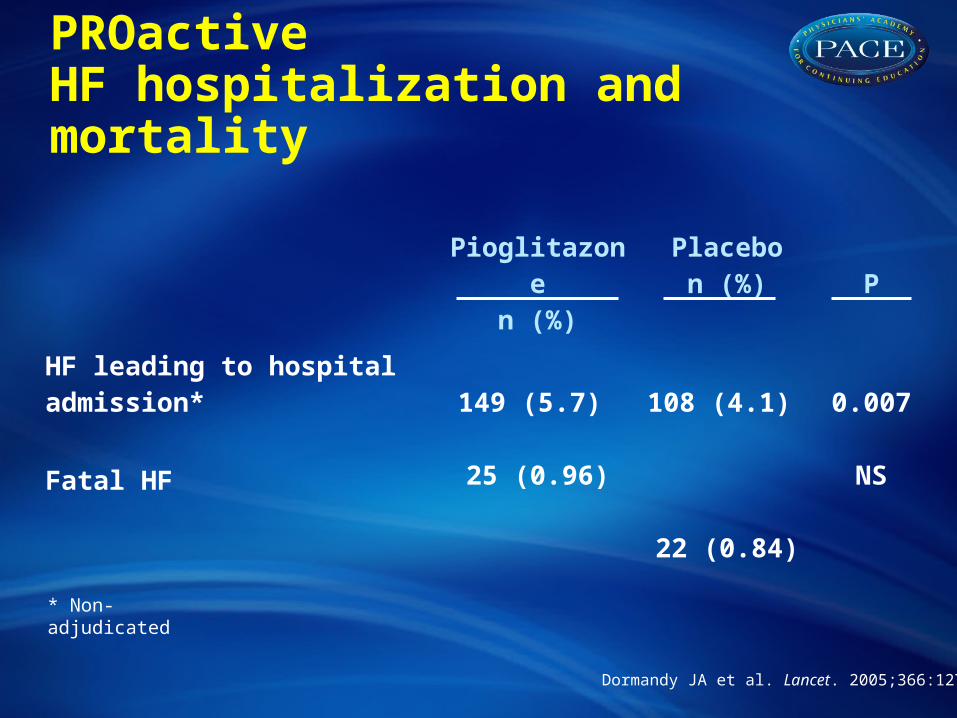
PROactiveHF hospitalization and mortality
Pioglitazonen (%)
Placebon (%) P
HF leading to hospital admission* Fatal HF
149 (5.7)
25 (0.96)
108 (4.1)
22 (0.84)
0.007
NS
Dormandy JA et al. Lancet. 2005;366:1279-89.
* Non-adjudicated
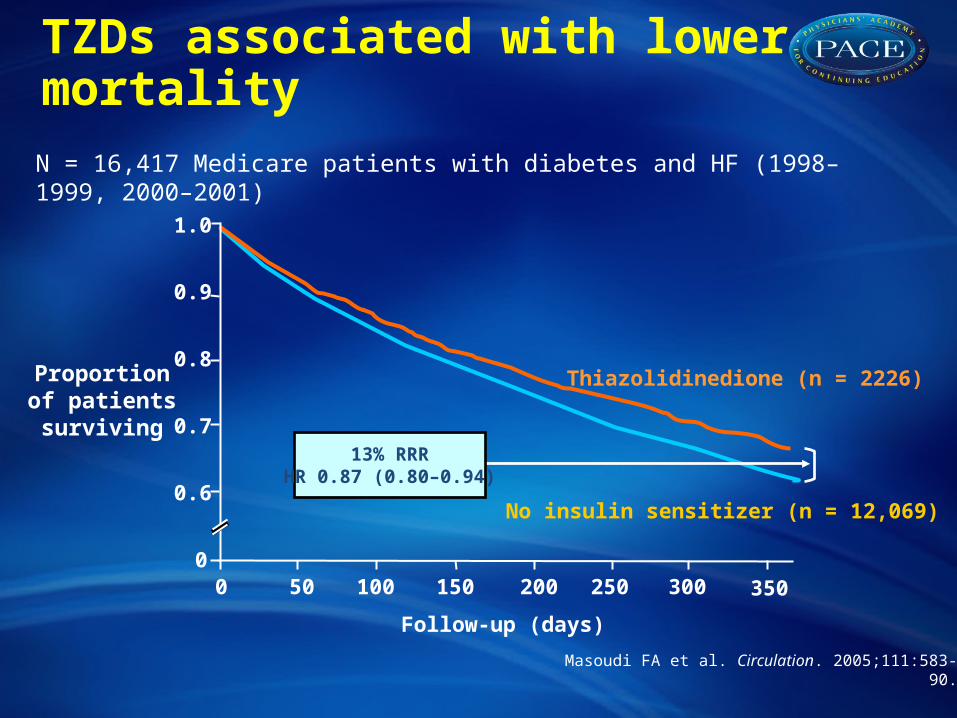
TZDs associated with lower mortality
Masoudi FA et al. Circulation. 2005;111:583-90.
N = 16,417 Medicare patients with diabetes and HF (1998–1999, 2000–2001)
Follow-up (days)
Proportionof patientssurviving
0.6
0.7
0.8
1.0
050 100 300150 200 250
0.9
0 350
13% RRRHR 0.87 (0.80–0.94)
No insulin sensitizer (n = 12,069)
Thiazolidinedione (n = 2226)
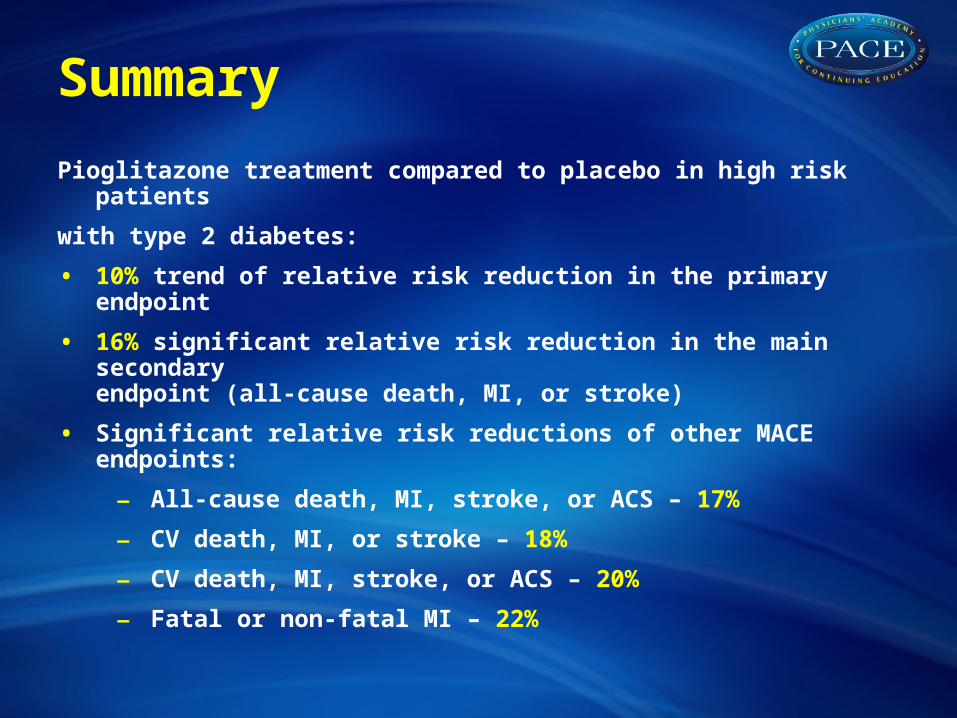
Summary
Pioglitazone treatment compared to placebo in high risk patients
with type 2 diabetes:
• 10% trend of relative risk reduction in the primary endpoint
• 16% significant relative risk reduction in the main secondary endpoint (all-cause death, MI, or stroke)
• Significant relative risk reductions of other MACE endpoints:
– All-cause death, MI, stroke, or ACS – 17%
– CV death, MI, or stroke – 18%
– CV death, MI, stroke, or ACS – 20%
– Fatal or non-fatal MI – 22%
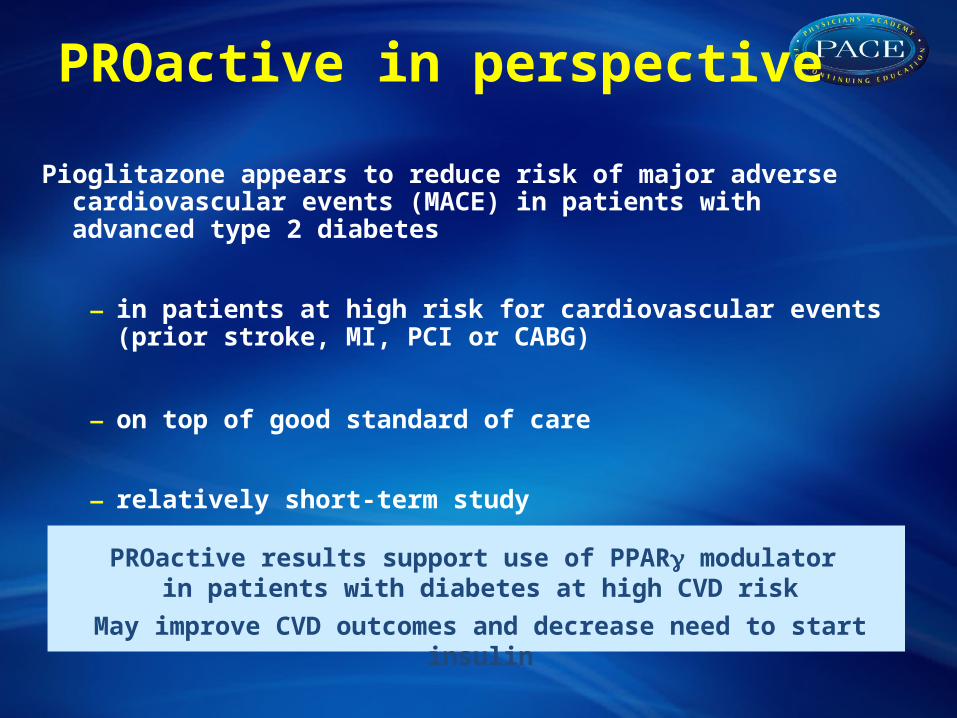
PROactive in perspective
Pioglitazone appears to reduce risk of major adverse cardiovascular events (MACE) in patients with advanced type 2 diabetes
– in patients at high risk for cardiovascular events (prior stroke, MI, PCI or CABG)
– on top of good standard of care
– relatively short-term study
PROactive results support use of PPAR modulator in patients with diabetes at high CVD risk
May improve CVD outcomes and decrease need to start insulin
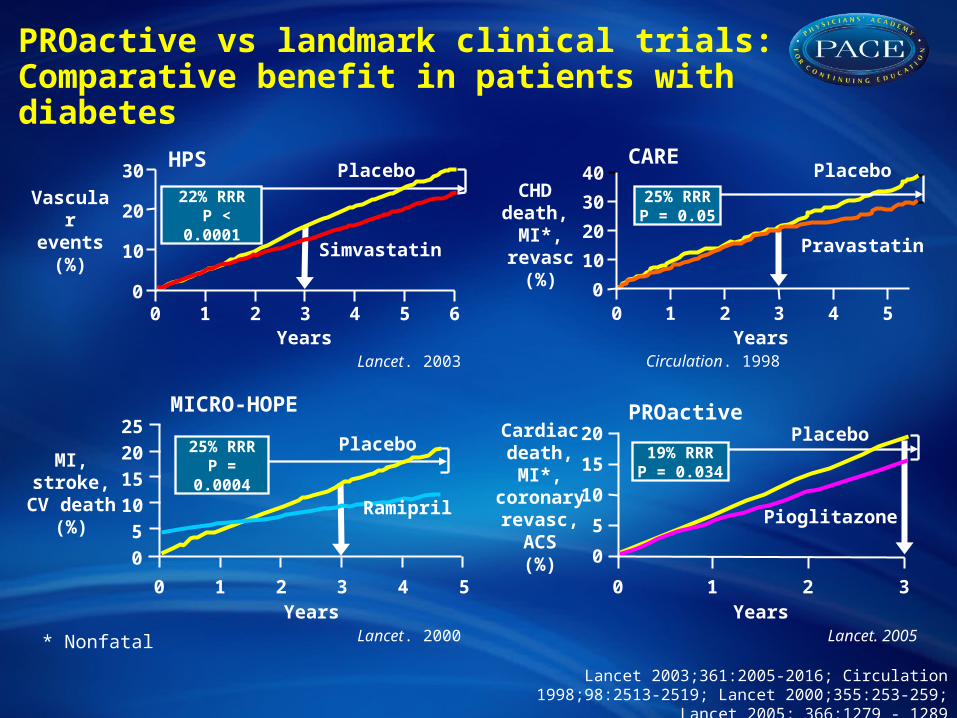
PROactive vs landmark clinical trials: Comparative benefit in patients with diabetes
MI, stroke, CV death (%)
25201510
50
0 1 2 3 4 5
0 1 2 3 4 50
10
20
30
40
* Nonfatal
CHD death,
MI*, revasc (%)
Years
Pravastatin
PlaceboCARE
Circulation. 1998
25% RRRP = 0.05
Lancet. 2005Lancet. 2000
Lancet. 2003
Vascular events (%)
Cardiac death, MI*,
coronary revasc, ACS
(%)
Years0 1 2 3
Years
0 1 2 3 4 5 6Years
Ramipril
Placebo
0
30
20
10 Simvastatin
Placebo
0
5
10
20
Pioglitazone
Placebo
HPS
MICRO-HOPE PROactive
22% RRR P < 0.0001
19% RRRP = 0.034
25% RRRP = 0.0004 15
Lancet 2003;361:2005-2016; Circulation 1998;98:2513-2519; Lancet 2000;355:253-259; Lancet 2005; 366:1279 - 1289