Embed Size (px)
Citation preview

PPA 723: Managerial Economics
First Review Session:Supply and Demand
Consumer Choice
Managerial Economics: First Review Session
The Living Wage Case
The Question: Should we recommend the living wage policy for the City of Syracuse?
We want to understand the impacts of this policy on income and employment.
We want to particularly understand the impacts of this policy on low-income households.
We do not have complete information, so we must make reasonable assumptions to use the information we do have. (People may disagree about what is reasonable!)
Managerial Economics: First Review Session
The Living Wage Case, 2
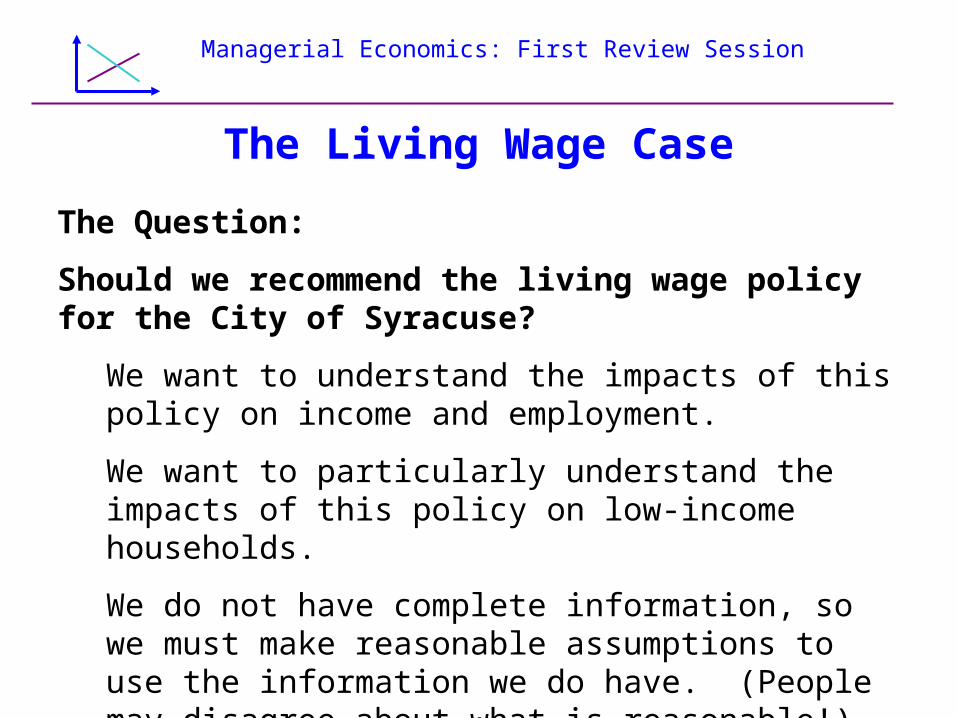
Key issue facing the analyst:
How can the information in the case be organized to help answer the main question?
Managerial Economics: First Review Session
The Living Wage Case, 3
Answer:
Use information on the price (i.e. wage) elasticity of the demand for labor to calculate the employment losses associated with the wage increase (i.e. living wage minimum).
Calculate the loss by wage class.
Managerial Economics: First Review Session
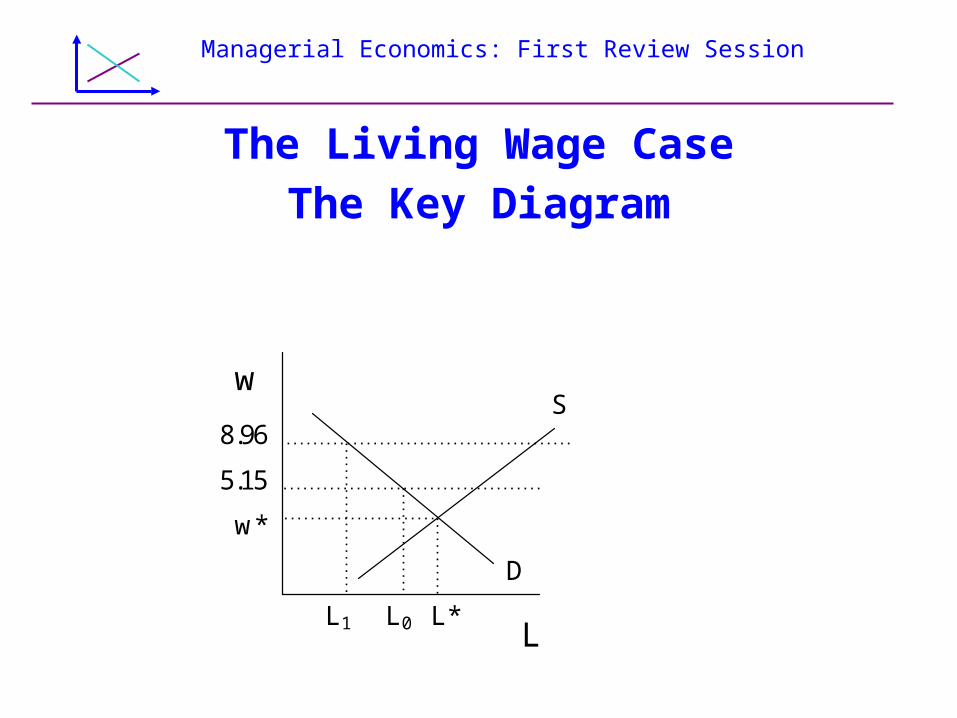
The Living Wage CaseThe Key Diagram
w
L
S
D
5.15
8.96
w*
L0 L1 L*
Managerial Economics: First Review Session
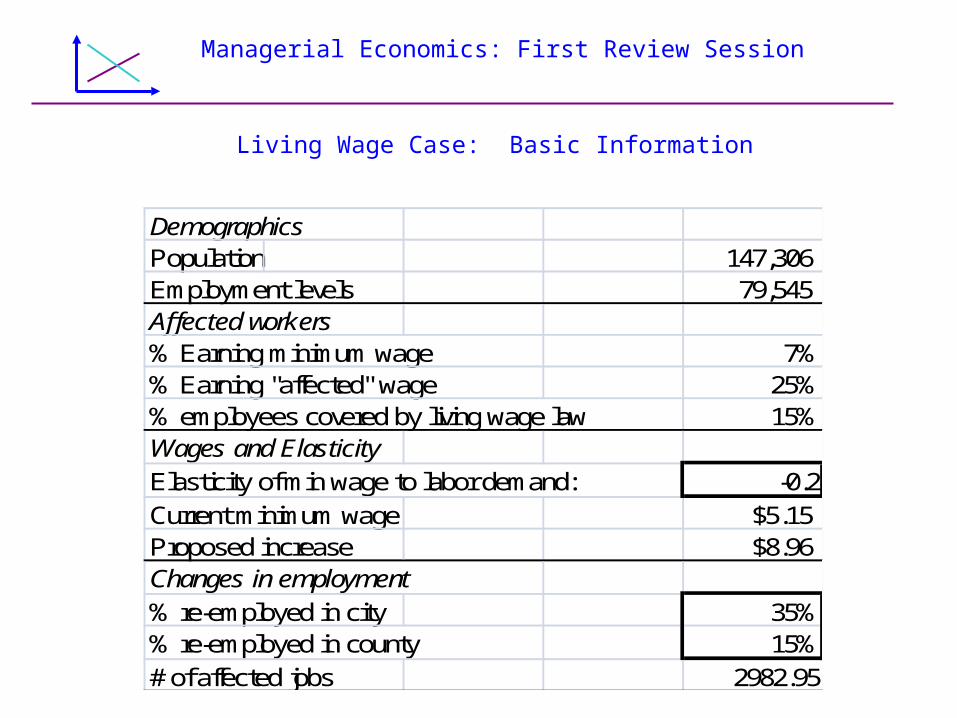
DemographicsPopulation 147,306 Employment levels 79,545 Affected workers% Earning minimum wage 7%% Earning "affected" wage 25%% employees covered by living wage law 15%Wages and ElasticityElasticity of min wage to labor demand: -0.2Current minimum wage $5.15Proposed increase $8.96Changes in employment% re-employed in city 35%% re-employed in county 15%# of affected jobs 2982.95
Living Wage Case: Basic Information
Managerial Economics: First Review Session
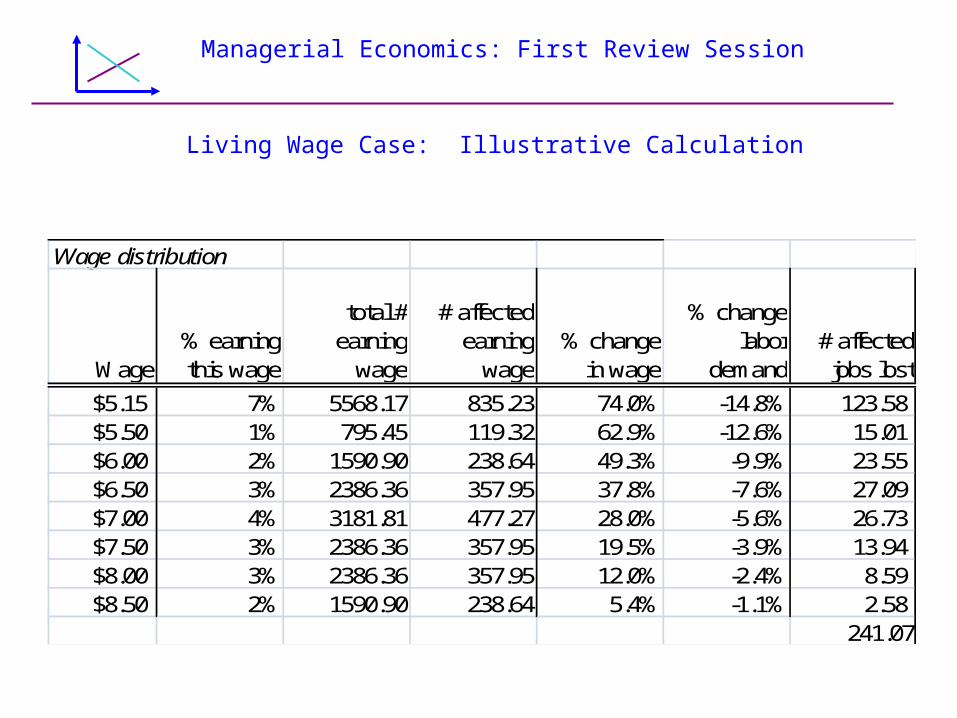
Living Wage Case: Illustrative Calculation
Wage distribution general equilibrium effects
Wage% earning this wage
total # earning
wage
# affected earning
wage% change
in wage
% change labor
demand# affected jobs lost
$5.15 7% 5568.17 835.23 74.0% -14.8% 123.58 $5.50 1% 795.45 119.32 62.9% -12.6% 15.01 $6.00 2% 1590.90 238.64 49.3% -9.9% 23.55 $6.50 3% 2386.36 357.95 37.8% -7.6% 27.09 $7.00 4% 3181.81 477.27 28.0% -5.6% 26.73 $7.50 3% 2386.36 357.95 19.5% -3.9% 13.94 $8.00 3% 2386.36 357.95 12.0% -2.4% 8.59 $8.50 2% 1590.90 238.64 5.4% -1.1% 2.58
241.07
Managerial Economics: First Review Session
Changes in employment
Elasticity# of low income
workers
# of low income
workers in affected jobs
gross number of jobs lost
net number of jobs lost
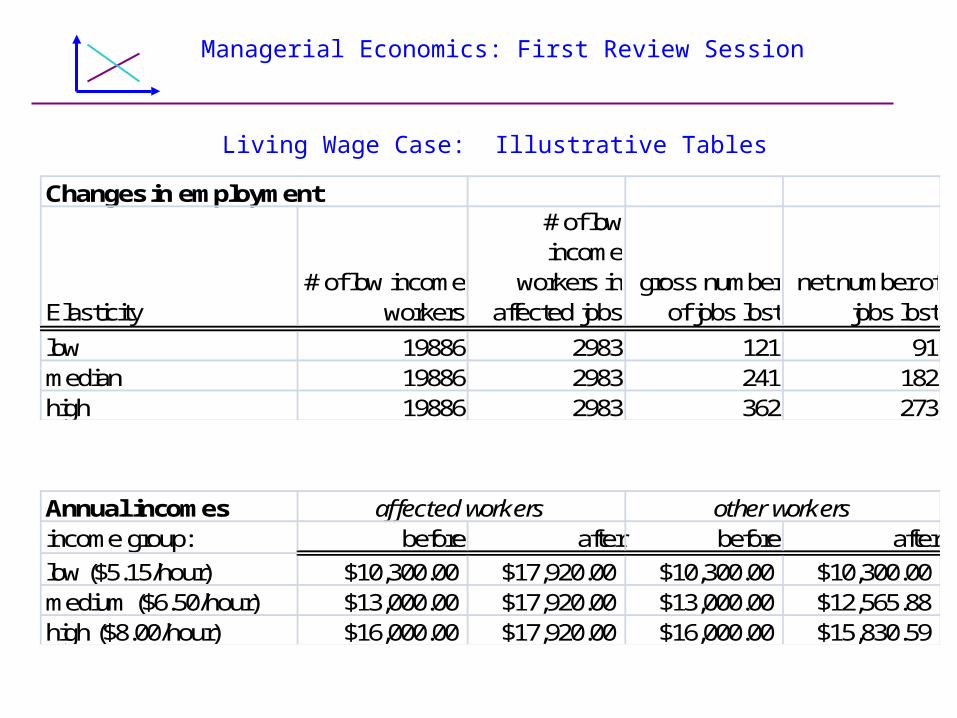
low 19886 2983 121 91median 19886 2983 241 182high 19886 2983 362 273
Living Wage Case: Illustrative Tables
Annual incomes affected workers other workersincome group: before after before after
low ($5.15/hour) $10,300.00 $17,920.00 $10,300.00 $10,300.00medium ($6.50/hour) $13,000.00 $17,920.00 $13,000.00 $12,565.88high ($8.00/hour) $16,000.00 $17,920.00 $16,000.00 $15,830.59
Managerial Economics: First Review Session
The Living Wage CaseSummary of Main Issue
These calculations show that a living wage
Raises incomes for low-income workers who keep their jobs.
Results in unemployment for some workers, particularly the poorest.
Managerial Economics: First Review Session
The Living Wage CaseOther Issues to Consider
1. Number of people re-hired in city or county (and associated wage effects)
2. Cost to the city (higher wages to city workers) of about $70 per capita.
3. Other?

Managerial Economics: First Review Session
Practice Exam

Managerial Economics: First Review Session
1. Governor Bigpol likes to claim that he has done more for education than any other governor in the history of his state. He bases this claim on the fact that state aid for education has increased from $2,500 per pupil when he took office in 1995 to $4,500 per pupil today (2006)—an increase of 80 percent!
a. You have been asked to evaluate Governor Bigpol’s claim. The first thing you did was to look up the price deflator for state and local government purchases. With 2006 as the base year, this price deflator is 50 in 1995. How much has state aid per pupil increased in real terms since 1995?
Answer: Nominal Price Index Real
2006 $4500 100 $4500 1995 $2500 50 $5000 Change -10%
Managerial Economics: First Review Session
b. The price deflator for state and local government purchases is expected to go up to 110 in 2007. How much will state aid per pupil have to increase next year to stay constant in real terms?
Answer:
$4,500 (110/100) = $4,950= $450 increase
Managerial Economics: First Review Session
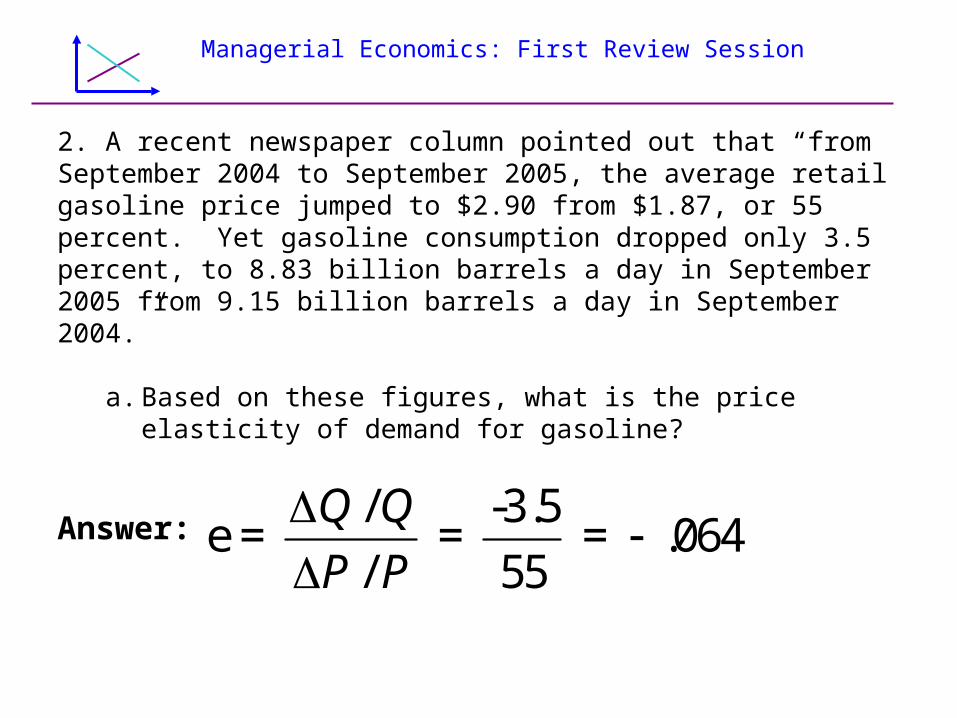
2. A recent newspaper column pointed out that “from September 2004 to September 2005, the average retail gasoline price jumped to $2.90 from $1.87, or 55 percent. Yet gasoline consumption dropped only 3.5 percent, to 8.83 billion barrels a day in September 2005 from 9.15 billion barrels a day in September 2004.”
a. Based on these figures, what is the price elasticity of demand for gasoline?
Answer:/ -3.5
e = = = .064/ 55
Q Q
P P
Managerial Economics: First Review Session
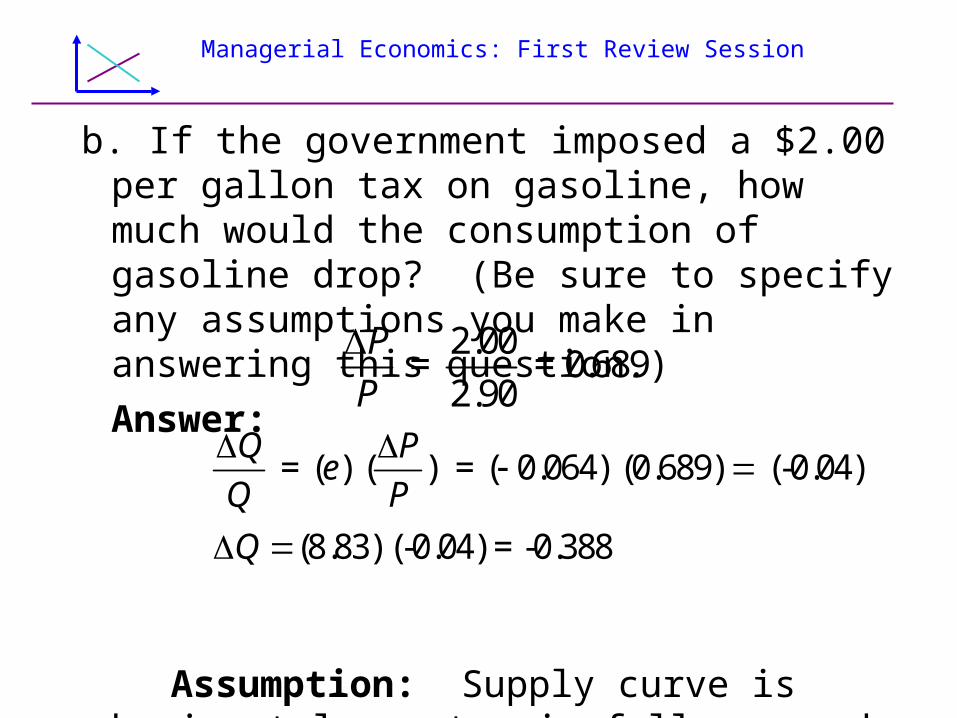
b. If the government imposed a $2.00 per gallon tax on gasoline, how much would the consumption of gasoline drop? (Be sure to specify any assumptions you make in answering this question.)Answer:
Assumption: Supply curve is horizontal, so tax is fully passed on to consumers.
2.00 = = 0.689
2.90
P
P
= ( ) ( ) = ( 0.064) (0.689) (-0.04)
(8.83) (-0.04) = -0.388
Q Pe
Q P
Q
Managerial Economics: First Review Session
c. These figures describe the short-run price elasticity of demand. Do you think the elasticity would be higher or lower in the long run? Explain.
Answer:
Elasticity measures responsiveness. Consumers can be more responsive in the long run by, e.g., buying more fuel-efficient cars, arranging car pools, or buying a bicycle.
Managerial Economics: First Review Session
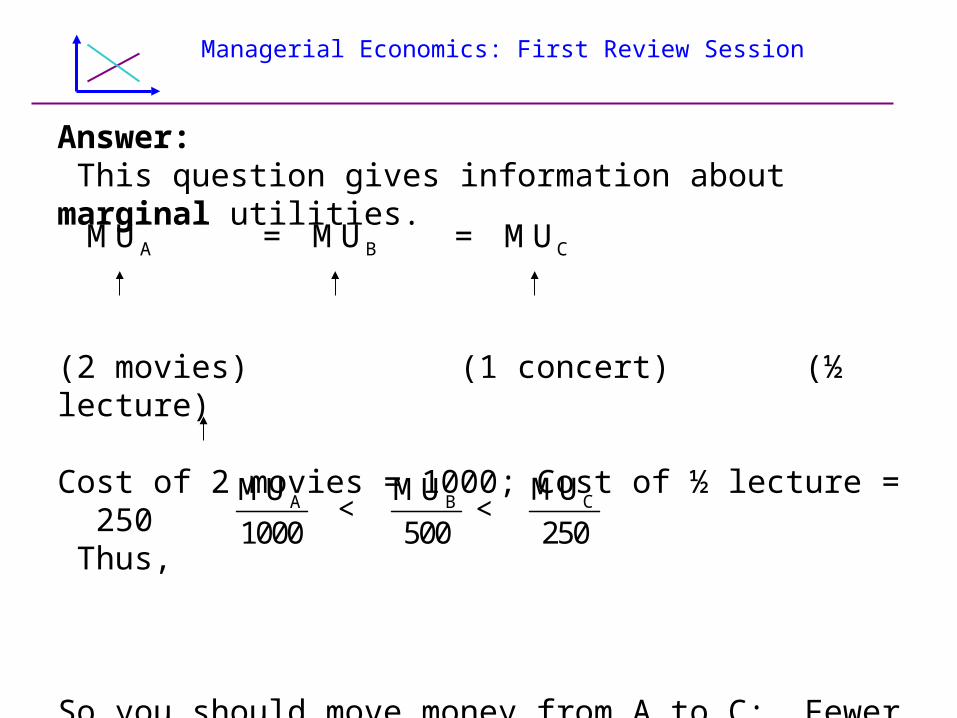
3. You run a recreation center for the elderly. Your budget is limited, but you try to provide a range of services, including movies, concerts, and lectures. A movie, a concert, and a lecture each cost you $500. To gather information about the best mix of services to provide, you recently surveyed the people who use your center. A large majority said that they would be equally happy with two more movies every month, one more concert every month, or one more lecture every two months. Given all this information, should you alter the way your budget is allocated across these three services? If so, how? Explain your answer in detail.
Managerial Economics: First Review Session
Answer: This question gives information about marginal utilities.
(2 movies) (1 concert) (½ lecture) Cost of 2 movies = 1000; Cost of ½ lecture = 250 Thus, So you should move money from A to C: Fewer movies, more lectures. This only applies at the margin; it does not indicate that you should have more lectures than movies!
A B CMU = MU = MU
CA B MUMU MU < <
1000 500 250
Managerial Economics: First Review Session
4. The high cost of heating this winter has been particularly hard on poor families. One proposal to address this problem is fuel stamps, which are coupons issued by the government that can be used to pay for the gas, oil, or electricity needed to heat a house or apartment. This proposal would give each poor family fuel stamps equal to about 150 percent of the average amount poor families are currently paying for heat.
Managerial Economics: First Review Session
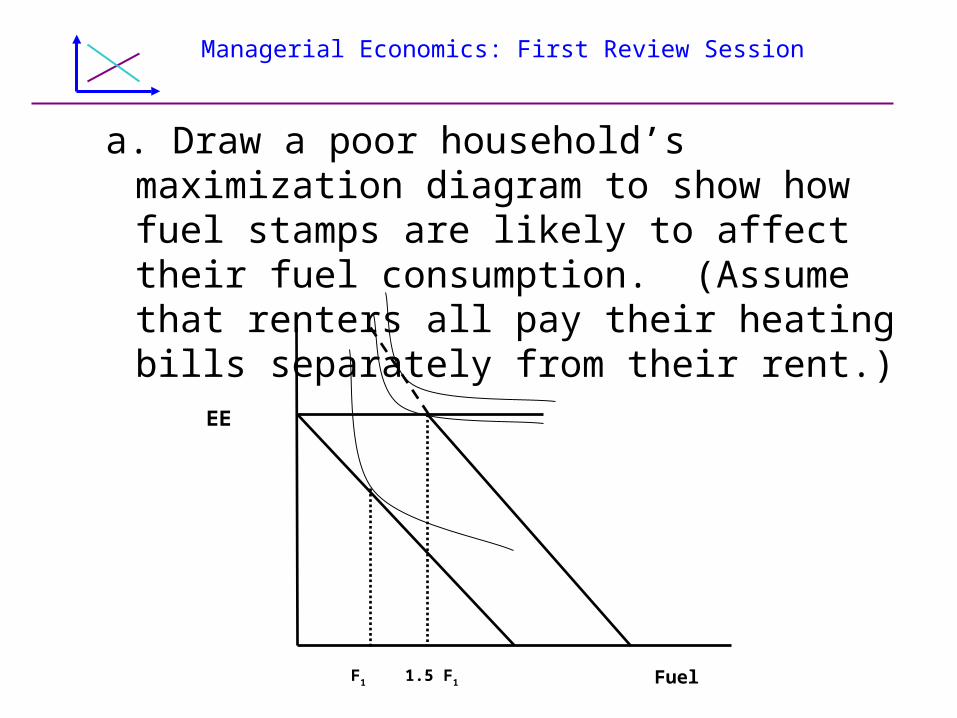
a. Draw a poor household’s maximization diagram to show how fuel stamps are likely to affect their fuel consumption. (Assume that renters all pay their heating bills separately from their rent.)
F1 1.5 F1 Fuel
EE
Managerial Economics: First Review Session
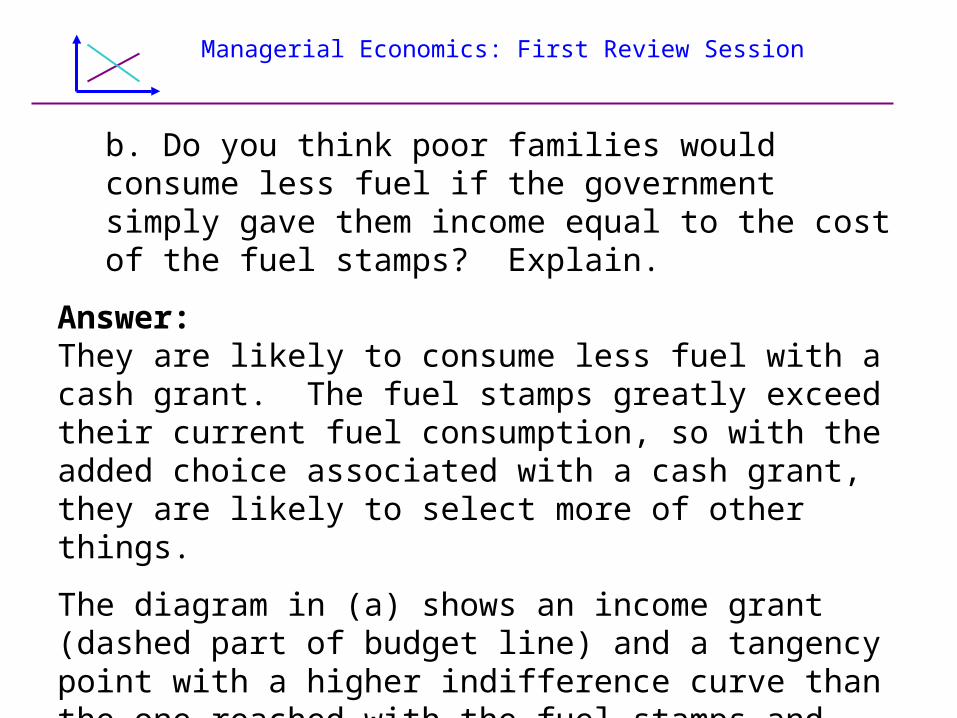
b. Do you think poor families would consume less fuel if the government simply gave them income equal to the cost of the fuel stamps? Explain.
Answer:They are likely to consume less fuel with a cash grant. The fuel stamps greatly exceed their current fuel consumption, so with the added choice associated with a cash grant, they are likely to select more of other things. The diagram in (a) shows an income grant (dashed part of budget line) and a tangency point with a higher indifference curve than the one reached with the fuel stamps—and with lower fuel consumption.
Managerial Economics: First Review Session
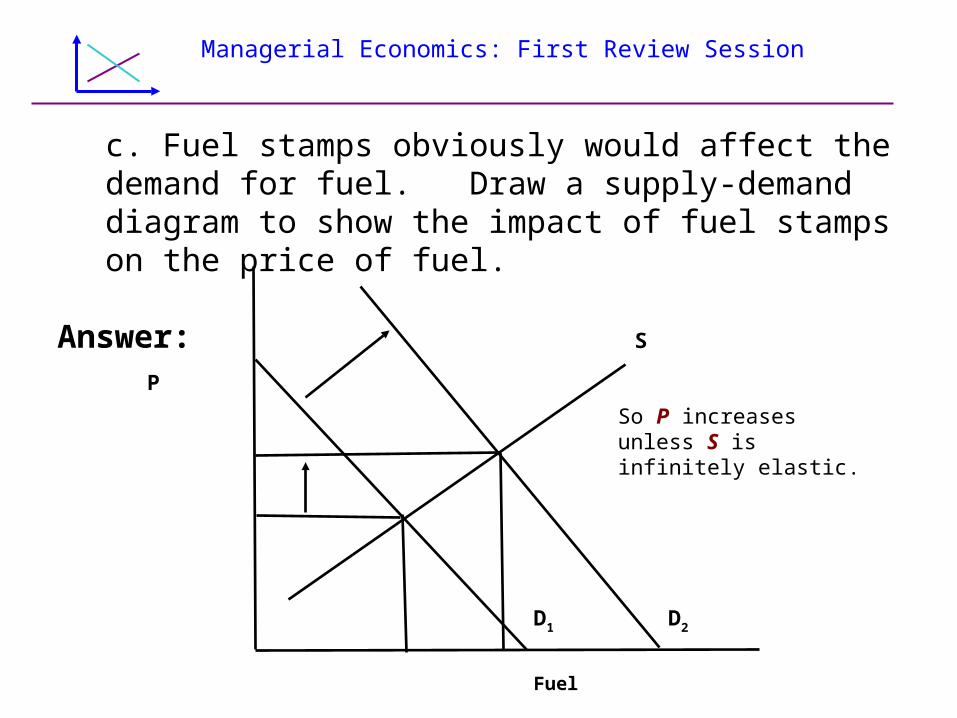
c. Fuel stamps obviously would affect the demand for fuel. Draw a supply-demand diagram to show the impact of fuel stamps on the price of fuel.
Answer:
Fuel
P
S
D1
So P increases unless S is infinitely elastic.
D2
Managerial Economics: First Review Session
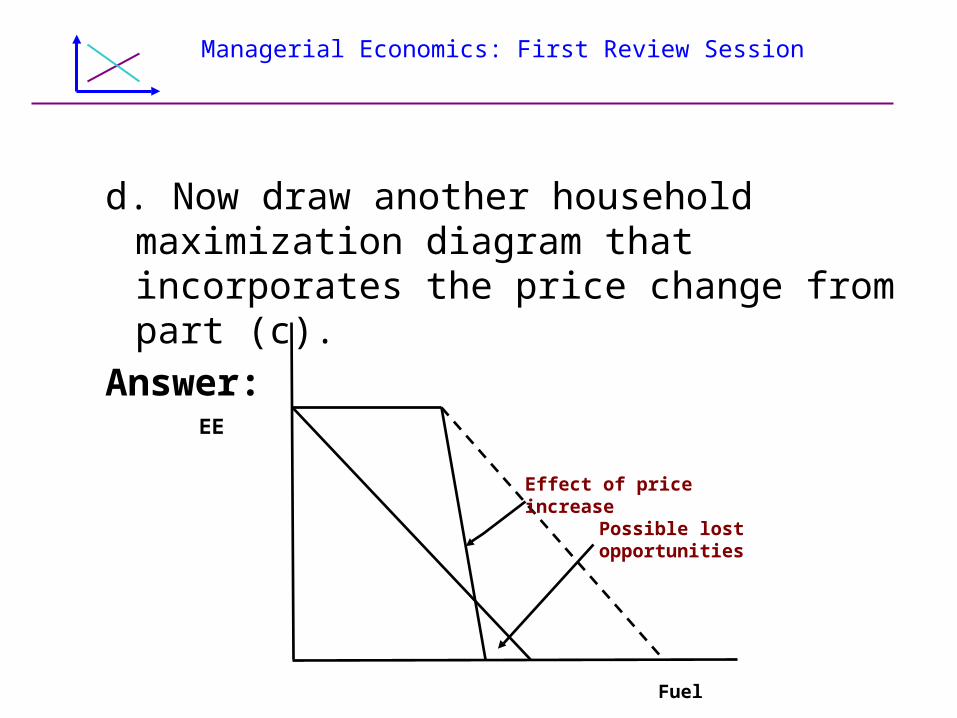
d. Now draw another household maximization diagram that incorporates the price change from part (c).
Answer:
Fuel
EE
Effect of price increase
Possible lost opportunities
Managerial Economics: First Review Session
EXTRA CREDIT. Is it possible that the fuel stamps program could make some poor families worse off? Explain.
Answer:Yes, it is possible (but unlikely) a household that consumes a lot of fuel might be hurt more by the price increase that helped by the fuel stamps. But the price increase would be substantial. In the figure drawn for part (d), the price increase would have to be so large that the budget line cut the original budget line (as in the figure drawn for part (d)), AND the household would have to consume so much fuel that their original choice was on the segment of the original budget line that is above the new line with the price increase.
Managerial Economics: First Review Session
Additional Question 1
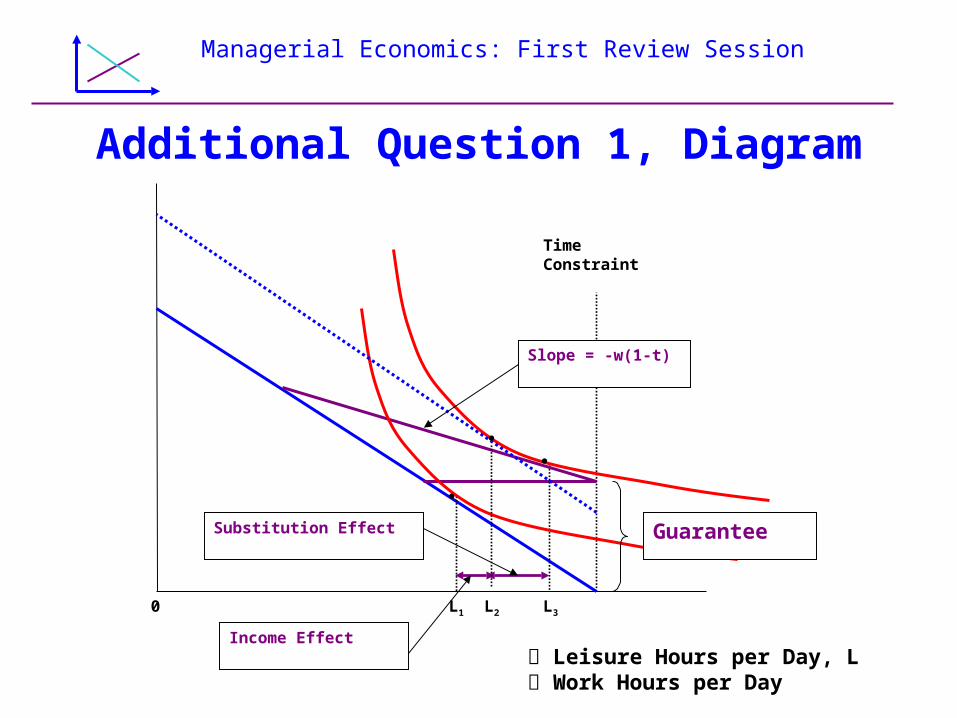
Why does a standard welfare program, which has an income guarantee and a “tax rate,” also known as a benefit reduction rate, always reduce work effort?
Answer: Because both the income effect (due to higher income) and the substitution effect (due to lower “price” of leisure) lead to more leisure.
Managerial Economics: First Review Session
Additional Question 1, Diagram
Leisure Hours per Day, L Work Hours per Day
Time Constraint
0 L1 L2 L3
Income Effect
Substitution Effect
Slope = -w(1-t)
Guarantee
Managerial Economics: First Review Session
Additional Question 2George is pondering his entertainment budget.
He likes music and movies. In his community, he has to pay $20 for a music CD or $10 for a ticket to a movie.
After some reflection, he recognizes that he would get equal satisfaction from either another CD or another movie.
Should George change the way he is allocating his entertainment budget? Explain with a diagram.
Managerial Economics: First Review Session
Additional Question 2Answer:
Yes, George should shift away from CDs toward movies.
MUmovie /Pmovie is greater than MUCD /PCD , and George would be better of by moving to the tangency point where these ratios are equal.
Managerial Economics: First Review Sesssion
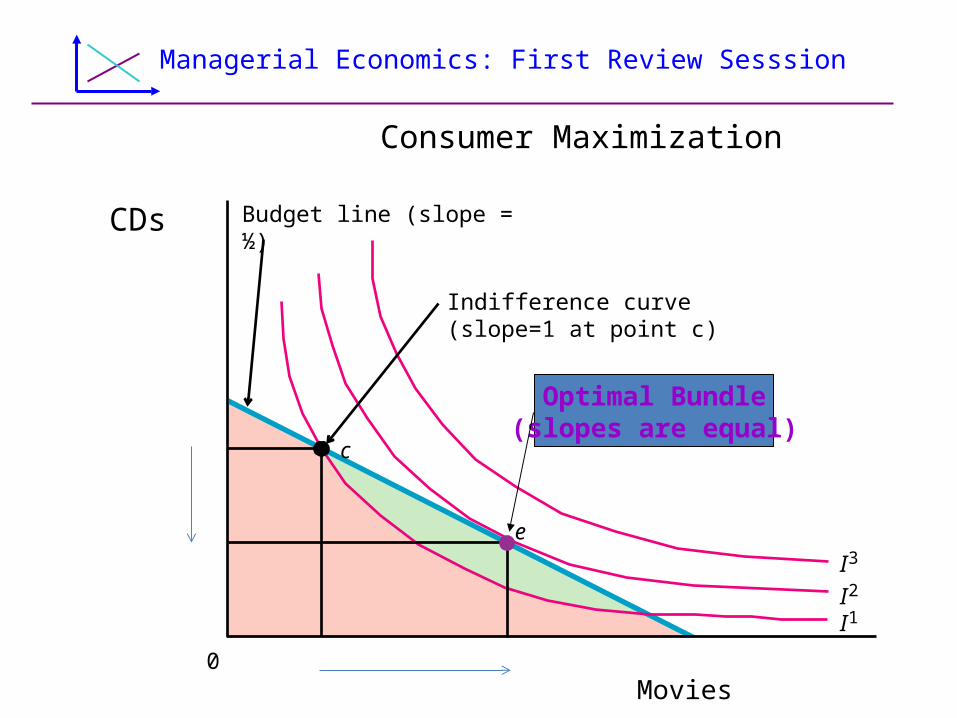
Consumer Maximization
CDs Budget line (slope = ½)
0Movies
I1I2I3
c
e
Optimal Bundle(slopes are equal)
Indifference curve (slope=1 at point c)