Embed Size (px)
Citation preview
PPA 415 – Research Methods in Public Administration
Lecture 2 - Counting and Charting Responses
Percentages and Proportions
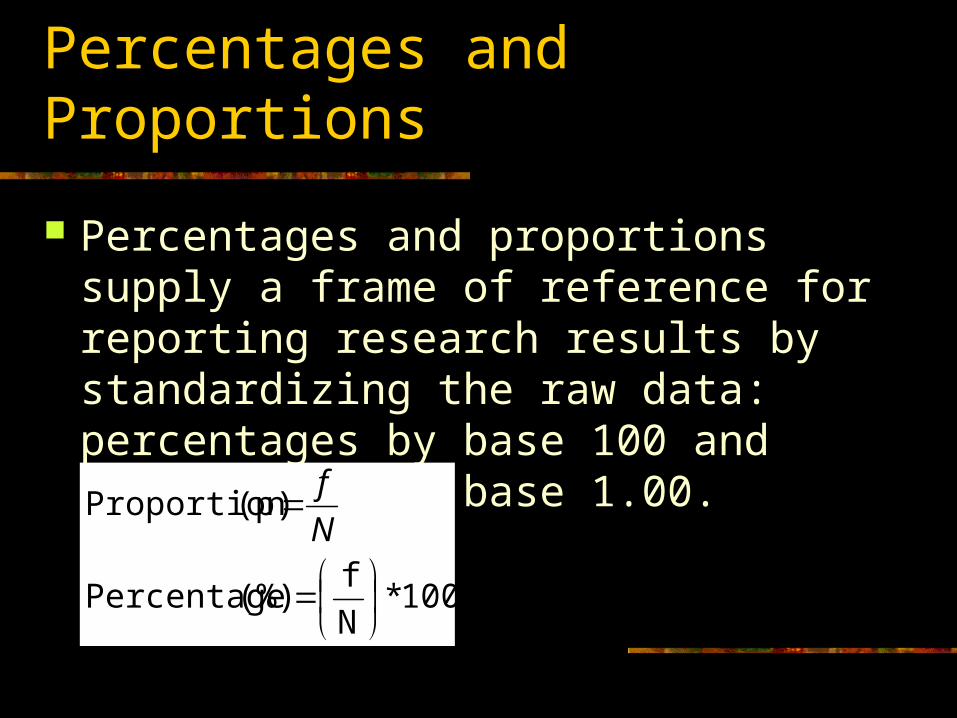
Percentages and proportions supply a frame of reference for reporting research results by standardizing the raw data: percentages by base 100 and proportions by base 1.00.
100*N
f (%) Percentage
(p) Proportion
N
f
Percentages and Proportions
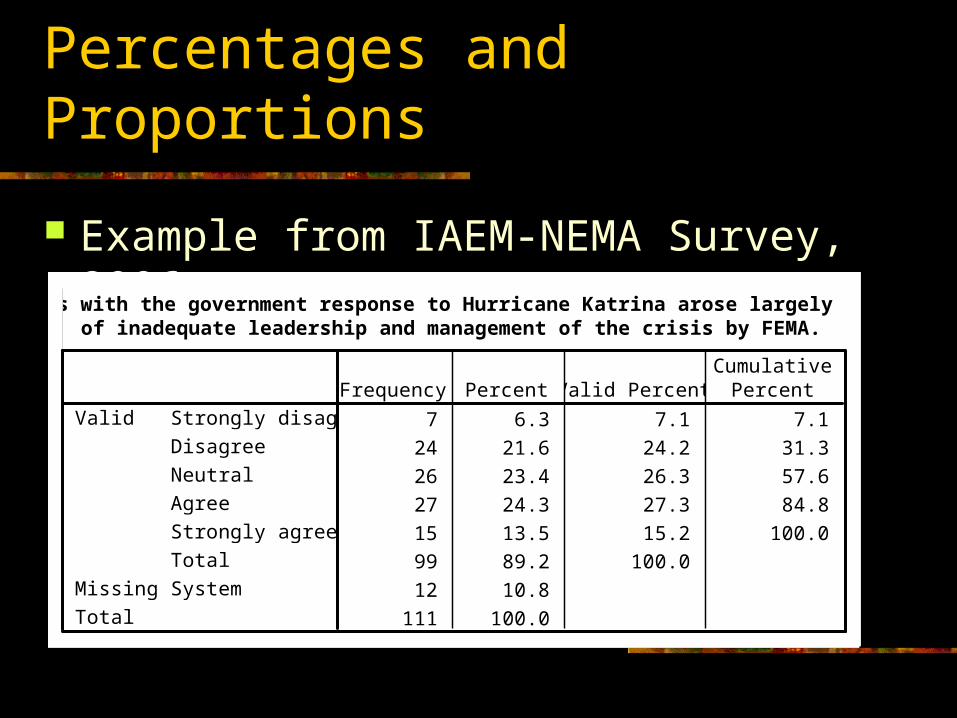
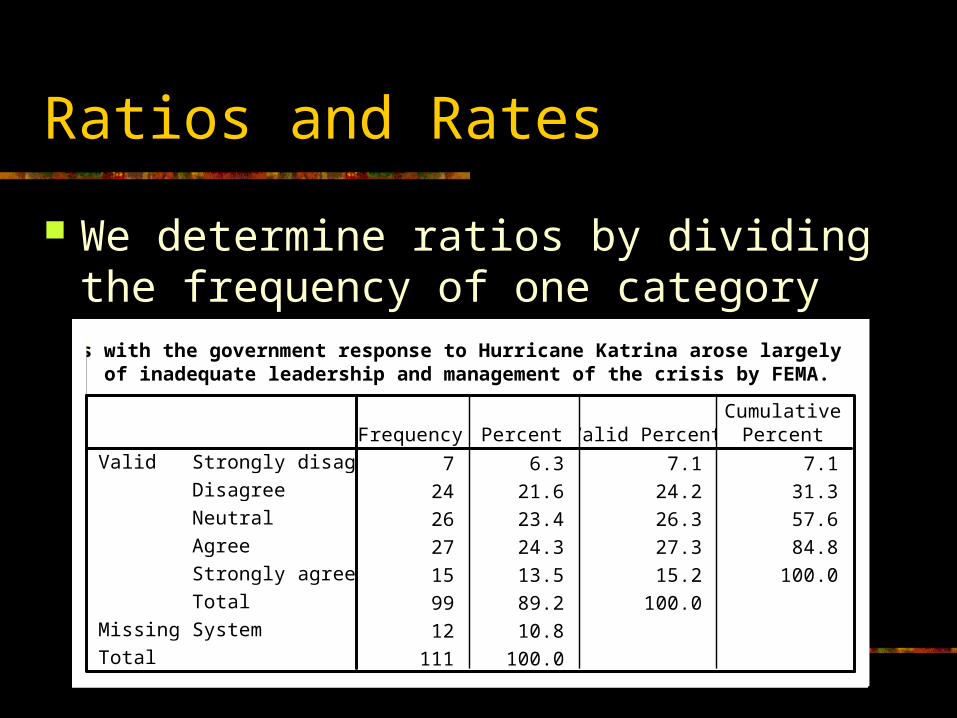
Example from IAEM-NEMA Survey, 2006.Problems with the government response to Hurricane Katrina arose largely because
of inadequate leadership and management of the crisis by FEMA.
7 6.3 7.1 7.1
24 21.6 24.2 31.3
26 23.4 26.3 57.6
27 24.3 27.3 84.8
15 13.5 15.2 100.0
99 89.2 100.0
12 10.8
111 100.0
Strongly disagree
Disagree
Neutral
Agree
Strongly agree
Total
Valid
SystemMissing
Total
Frequency Percent Valid PercentCumulative
Percent
Percentages and Proportions
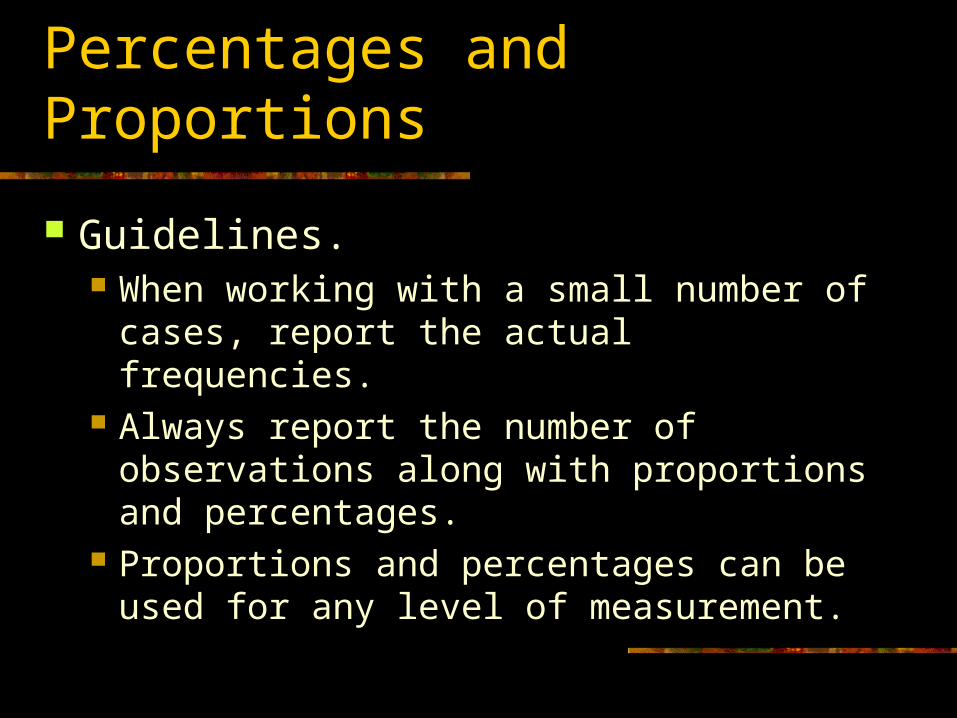
Guidelines. When working with a small number of cases,
report the actual frequencies. Always report the number of observations
along with proportions and percentages. Proportions and percentages can be used for
any level of measurement.
Percentage Change
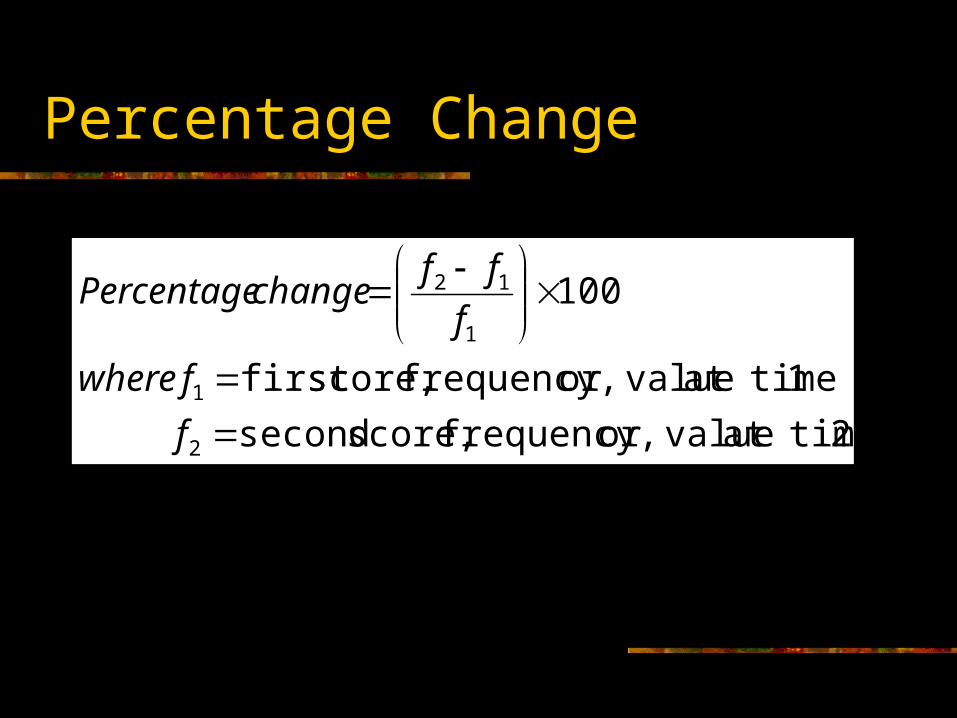
2 at time or value frequency, score, second
1 at time or value frequency, score,first
100
2
1
1
12
f
fwhere
f
ffchangePercentage
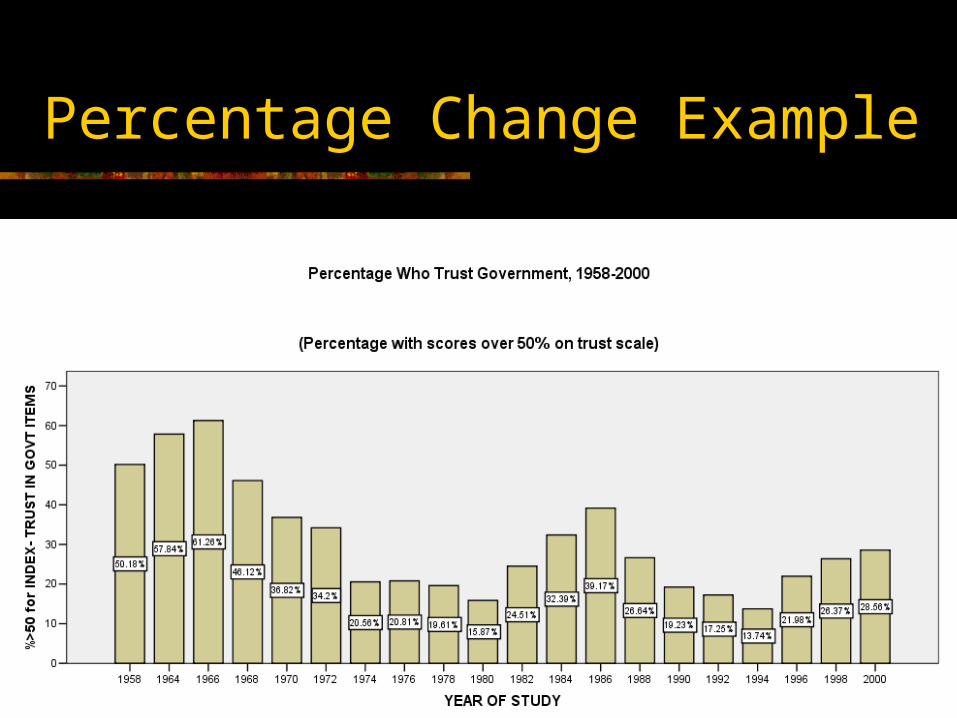
Percentage Change Example
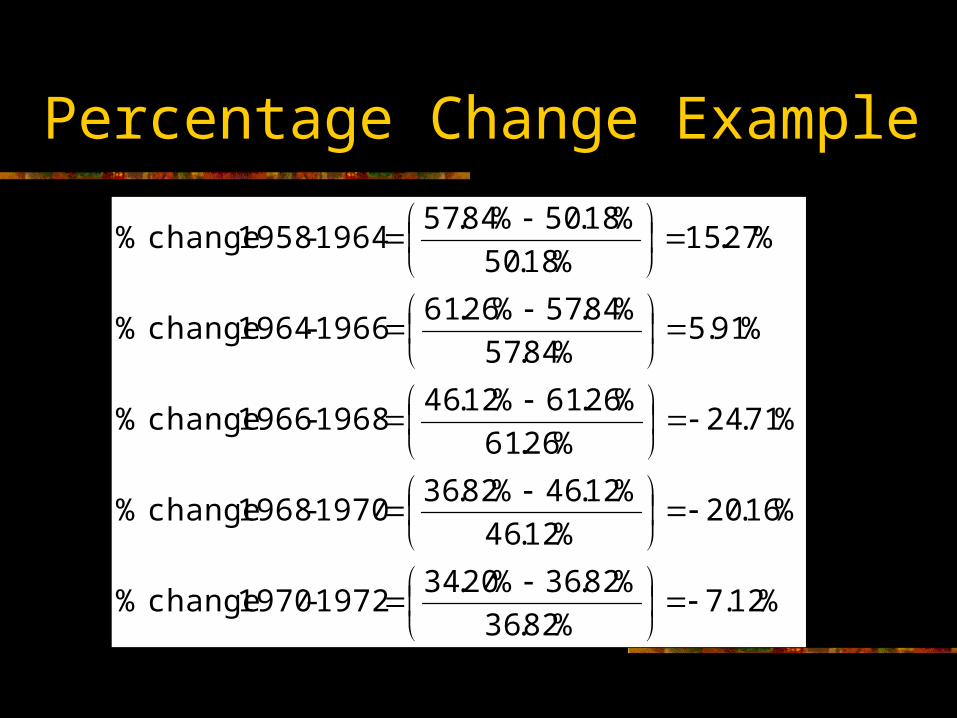
Percentage Change Example
%12.7%82.36
%82.36%20.341972-1970 change %
%16.20%12.46
%12.46%82.361970-1968 change %
%71.24%26.61
%26.61%12.461968-1966 change %
%91.5%84.57
%84.57%26.611966-1964 change %
%27.15%18.50
%18.50%84.571964-1958 change %
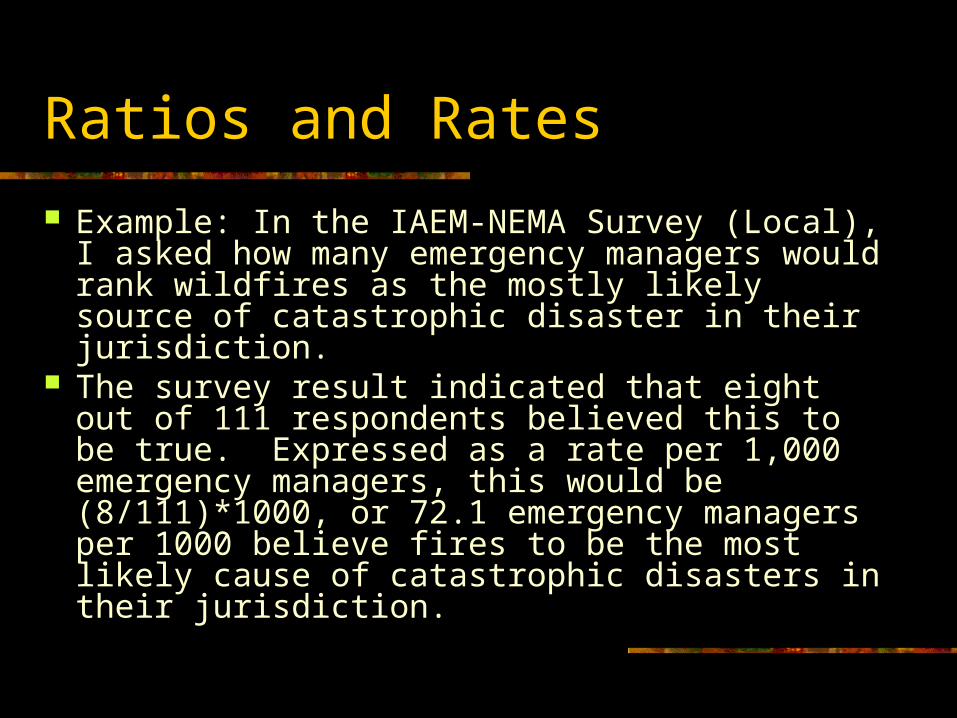
Ratios and Rates
We determine ratios by dividing the frequency of one category by another.Problems with the government response to Hurricane Katrina arose largely because
of inadequate leadership and management of the crisis by FEMA.
7 6.3 7.1 7.1
24 21.6 24.2 31.3
26 23.4 26.3 57.6
27 24.3 27.3 84.8
15 13.5 15.2 100.0
99 89.2 100.0
12 10.8
111 100.0
Strongly disagree
Disagree
Neutral
Agree
Strongly agree
Total
Valid
SystemMissing
Total
Frequency Percent Valid PercentCumulative
Percent
Ratios and Rates
The ratio of people who agree that the FEMA response was inadequate to those who disagree is (27+15)/(24+7) =42/31 = 1.35 to 1. That is, for every 10 people who disagree, there are 13.5 who agree.
Rates are defined as the number of actual occurrences of some phenomenon divided by the number of actual occurrences per some unit of population.
Ratios and Rates
Example: In the IAEM-NEMA Survey (Local), I asked how many emergency managers would rank wildfires as the mostly likely source of catastrophic disaster in their jurisdiction.
The survey result indicated that eight out of 111 respondents believed this to be true. Expressed as a rate per 1,000 emergency managers, this would be (8/111)*1000, or 72.1 emergency managers per 1000 believe fires to be the most likely cause of catastrophic disasters in their jurisdiction.
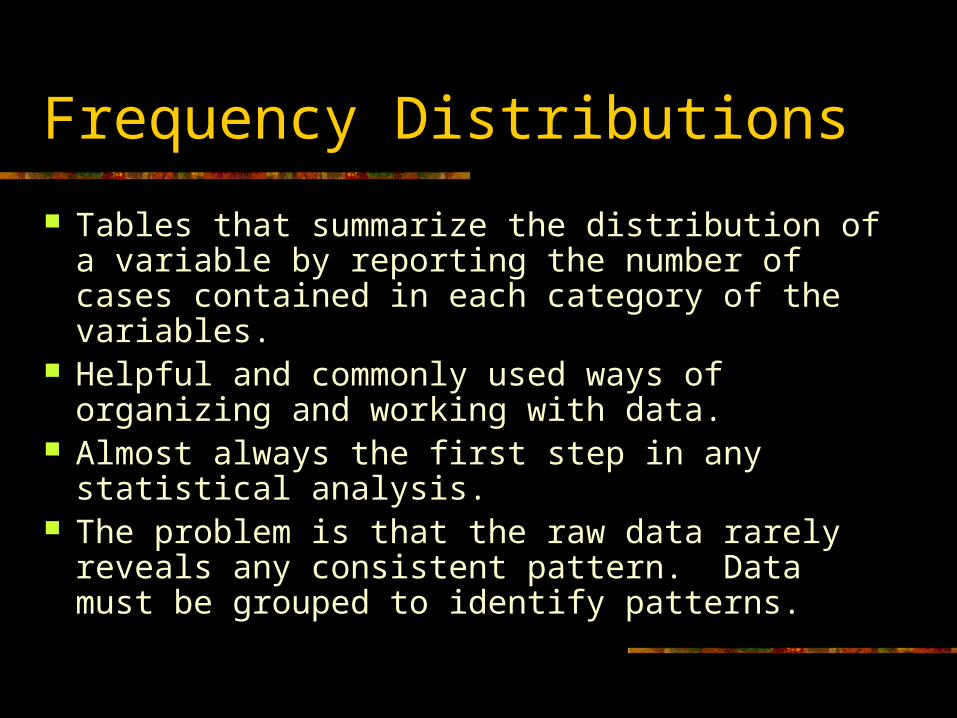
Frequency Distributions
Tables that summarize the distribution of a variable by reporting the number of cases contained in each category of the variables.
Helpful and commonly used ways of organizing and working with data.
Almost always the first step in any statistical analysis.
The problem is that the raw data rarely reveals any consistent pattern. Data must be grouped to identify patterns.
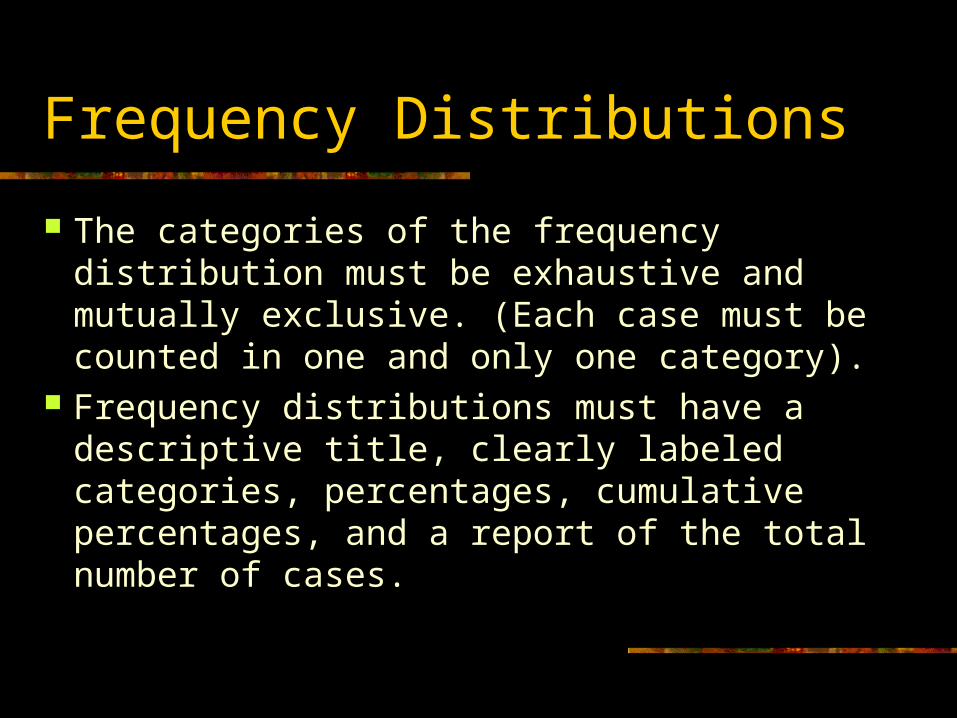
Frequency Distributions
The categories of the frequency distribution must be exhaustive and mutually exclusive. (Each case must be counted in one and only one category).
Frequency distributions must have a descriptive title, clearly labeled categories, percentages, cumulative percentages, and a report of the total number of cases.
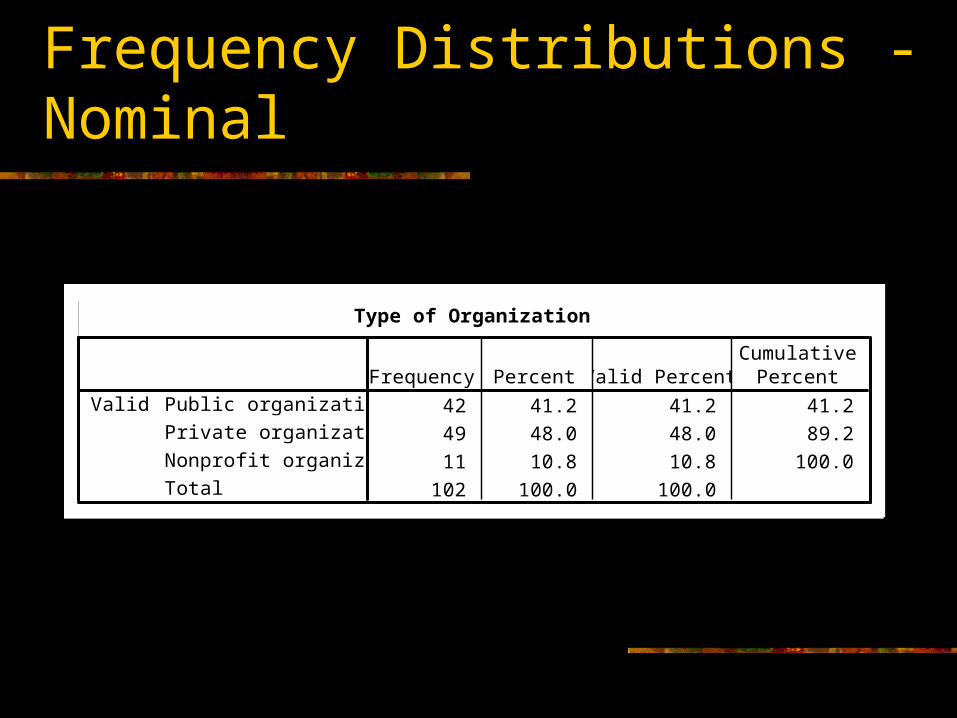
Frequency Distributions - Nominal
Type of Organization
42 41.2 41.2 41.2
49 48.0 48.0 89.2
11 10.8 10.8 100.0
102 100.0 100.0
Public organization
Private organization
Nonprofit organization
Total
ValidFrequency Percent Valid Percent
CumulativePercent
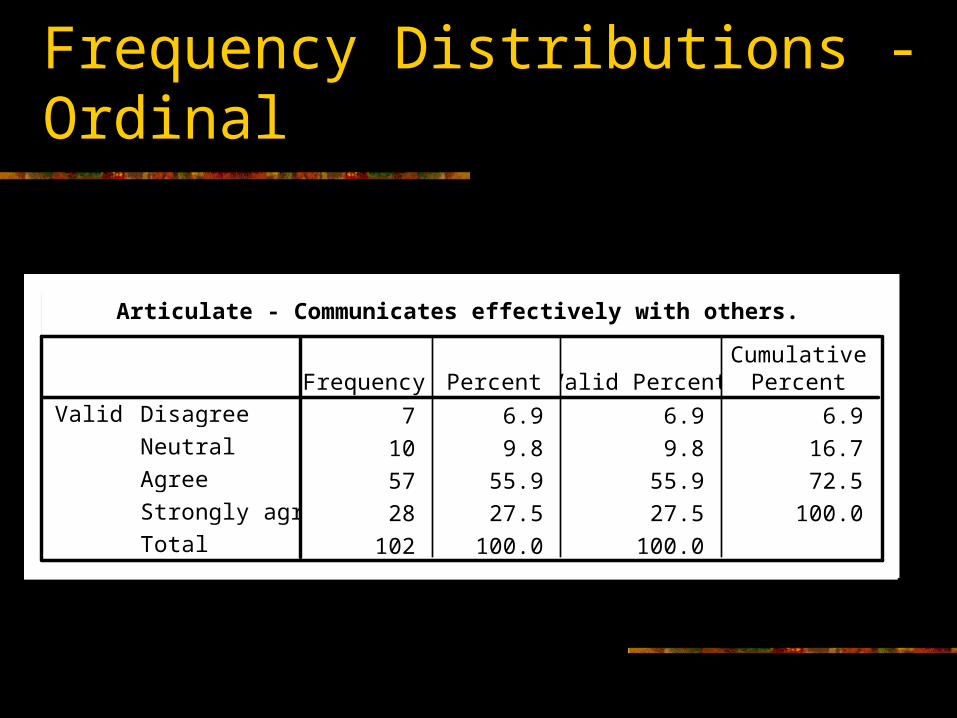
Frequency Distributions - Ordinal
Articulate - Communicates effectively with others.
7 6.9 6.9 6.9
10 9.8 9.8 16.7
57 55.9 55.9 72.5
28 27.5 27.5 100.0
102 100.0 100.0
Disagree
Neutral
Agree
Strongly agree
Total
ValidFrequency Percent Valid Percent
CumulativePercent
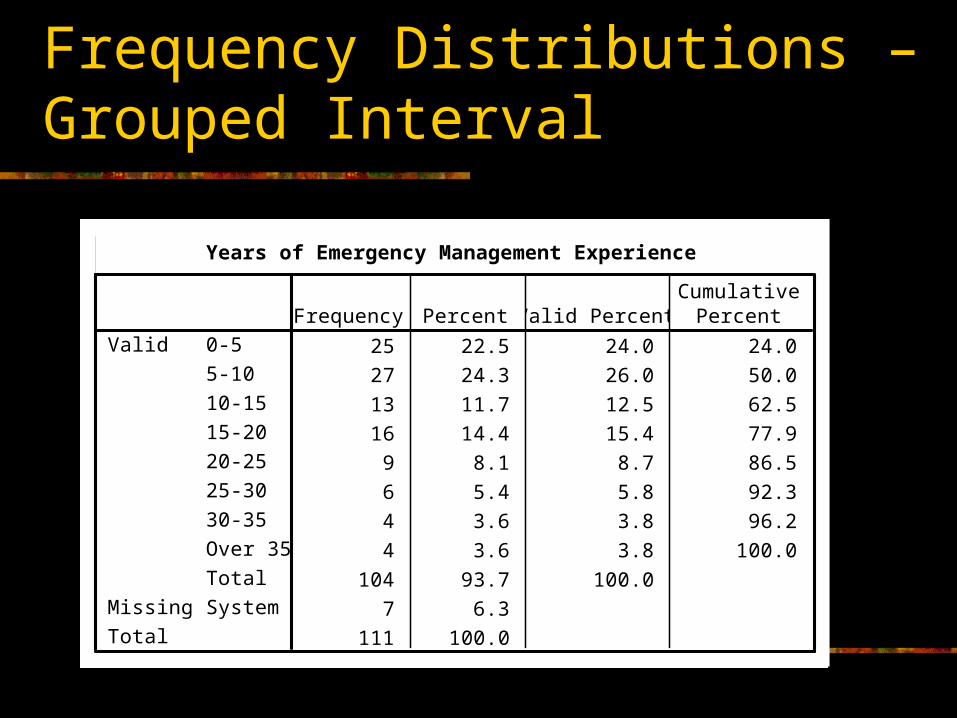
Frequency Distributions – Grouped Interval
Years of Emergency Management Experience
25 22.5 24.0 24.0
27 24.3 26.0 50.0
13 11.7 12.5 62.5
16 14.4 15.4 77.9
9 8.1 8.7 86.5
6 5.4 5.8 92.3
4 3.6 3.8 96.2
4 3.6 3.8 100.0
104 93.7 100.0
7 6.3
111 100.0
0-5
5-10
10-15
15-20
20-25
25-30
30-35
Over 35
Total
Valid
SystemMissing
Total
Frequency Percent Valid PercentCumulative
Percent
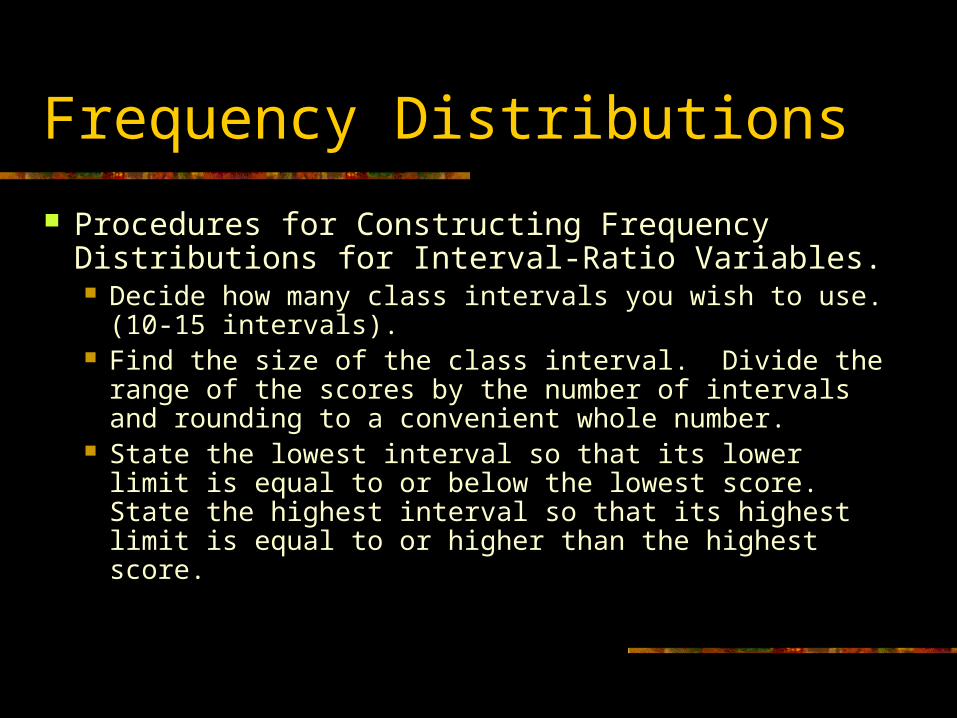
Frequency Distributions
Procedures for Constructing Frequency Distributions for Interval-Ratio Variables. Decide how many class intervals you wish to use.
(10-15 intervals). Find the size of the class interval. Divide the range of
the scores by the number of intervals and rounding to a convenient whole number.
State the lowest interval so that its lower limit is equal to or below the lowest score. State the highest interval so that its highest limit is equal to or higher than the highest score.
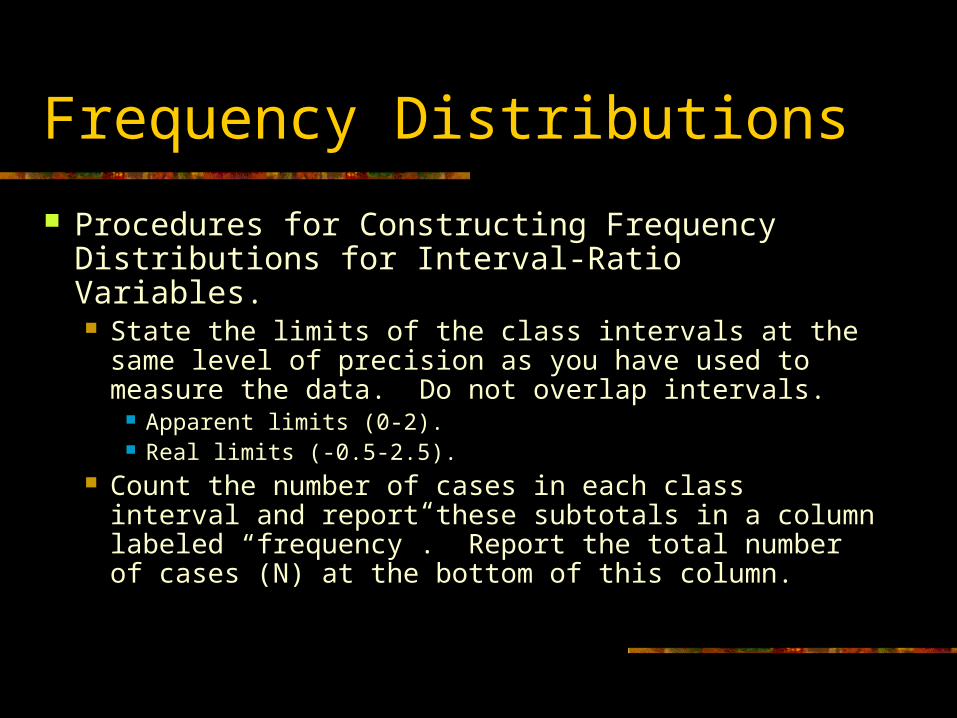
Frequency Distributions
Procedures for Constructing Frequency Distributions for Interval-Ratio Variables. State the limits of the class intervals at the same level
of precision as you have used to measure the data. Do not overlap intervals.
Apparent limits (0-2). Real limits (-0.5-2.5).
Count the number of cases in each class interval and report these subtotals in a column labeled “frequency”. Report the total number of cases (N) at the bottom of this column.
Frequency Distributions
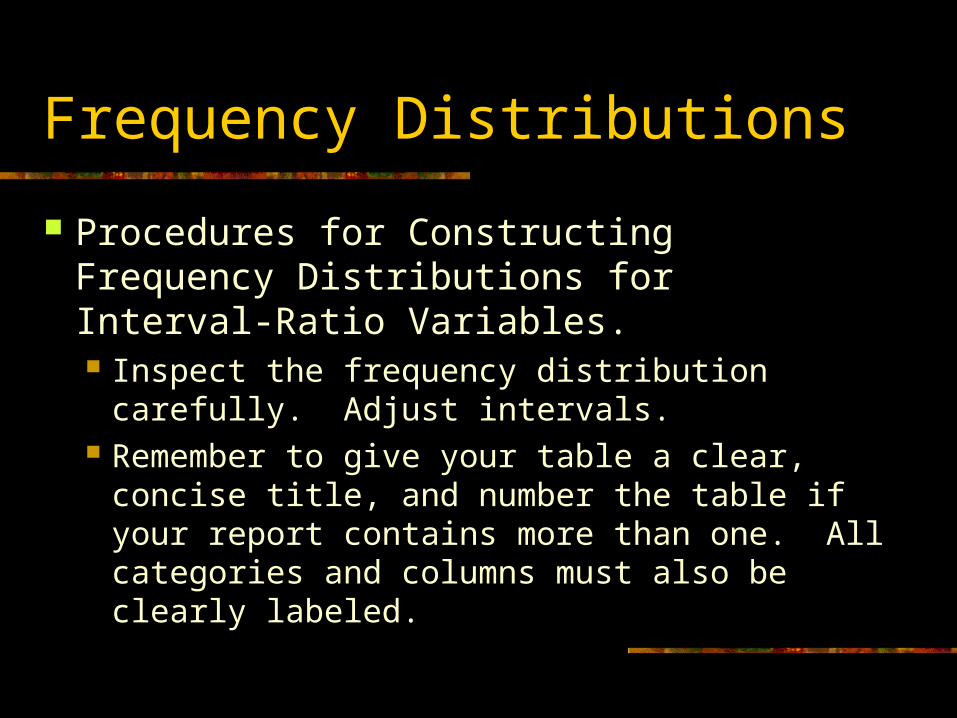
Procedures for Constructing Frequency Distributions for Interval-Ratio Variables. Inspect the frequency distribution carefully.
Adjust intervals. Remember to give your table a clear, concise
title, and number the table if your report contains more than one. All categories and columns must also be clearly labeled.
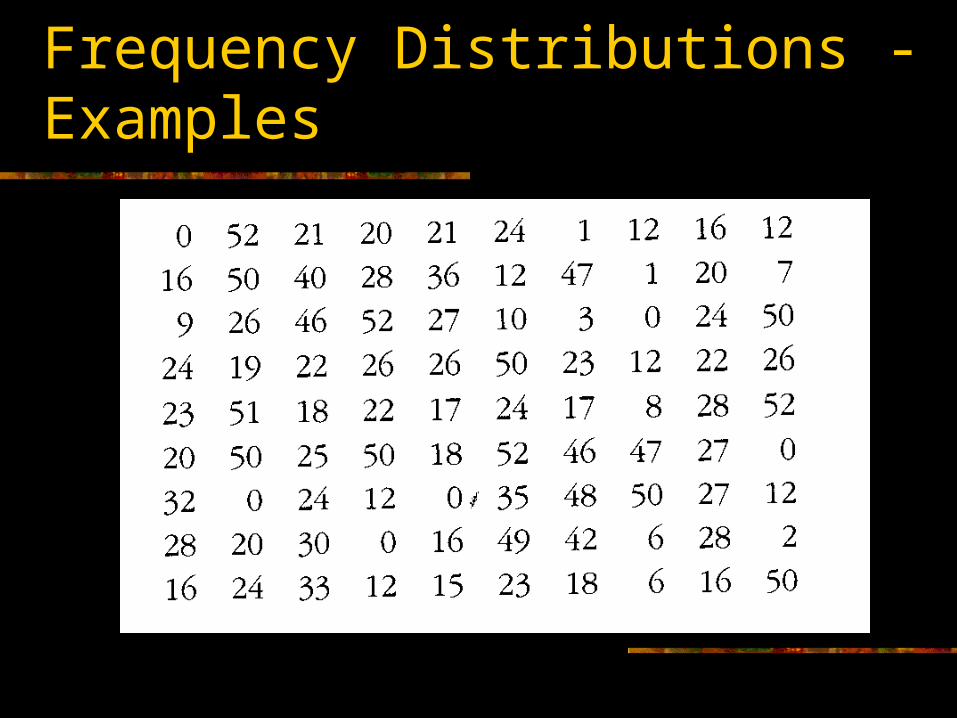
Frequency Distributions - Examples
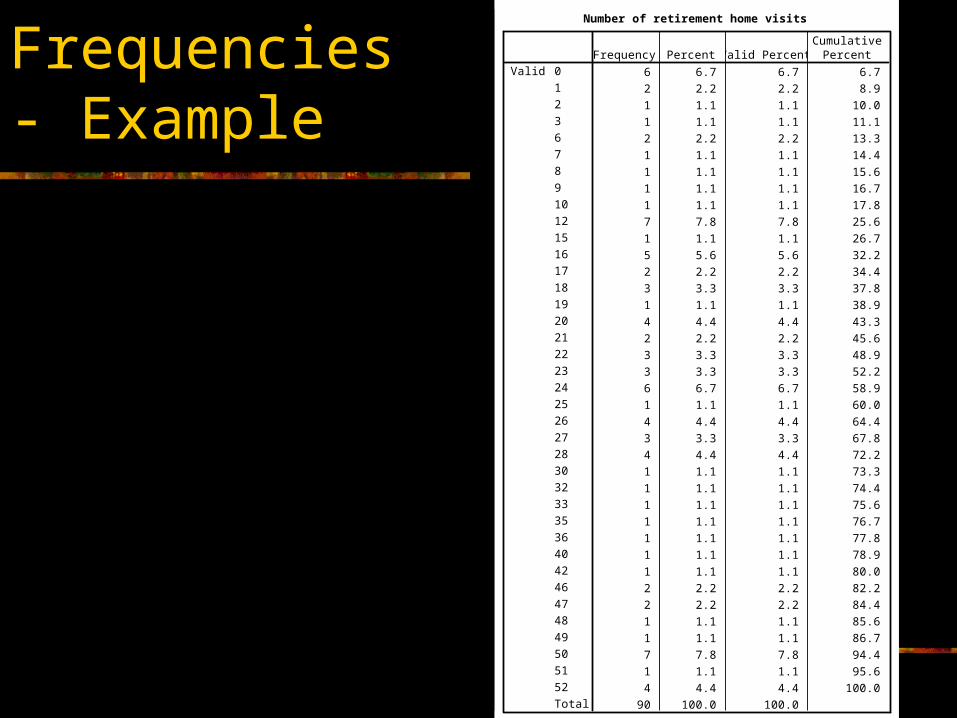
Frequencies - Example
Number of retirement home visits
6 6.7 6.7 6.7
2 2.2 2.2 8.9
1 1.1 1.1 10.0
1 1.1 1.1 11.1
2 2.2 2.2 13.3
1 1.1 1.1 14.4
1 1.1 1.1 15.6
1 1.1 1.1 16.7
1 1.1 1.1 17.8
7 7.8 7.8 25.6
1 1.1 1.1 26.7
5 5.6 5.6 32.2
2 2.2 2.2 34.4
3 3.3 3.3 37.8
1 1.1 1.1 38.9
4 4.4 4.4 43.3
2 2.2 2.2 45.6
3 3.3 3.3 48.9
3 3.3 3.3 52.2
6 6.7 6.7 58.9
1 1.1 1.1 60.0
4 4.4 4.4 64.4
3 3.3 3.3 67.8
4 4.4 4.4 72.2
1 1.1 1.1 73.3
1 1.1 1.1 74.4
1 1.1 1.1 75.6
1 1.1 1.1 76.7
1 1.1 1.1 77.8
1 1.1 1.1 78.9
1 1.1 1.1 80.0
2 2.2 2.2 82.2
2 2.2 2.2 84.4
1 1.1 1.1 85.6
1 1.1 1.1 86.7
7 7.8 7.8 94.4
1 1.1 1.1 95.6
4 4.4 4.4 100.0
90 100.0 100.0
0
1
2
3
6
7
8
9
10
12
15
16
17
18
19
20
21
22
23
24
25
26
27
28
30
32
33
35
36
40
42
46
47
48
49
50
51
52
Total
ValidFrequency Percent Valid Percent
CumulativePercent
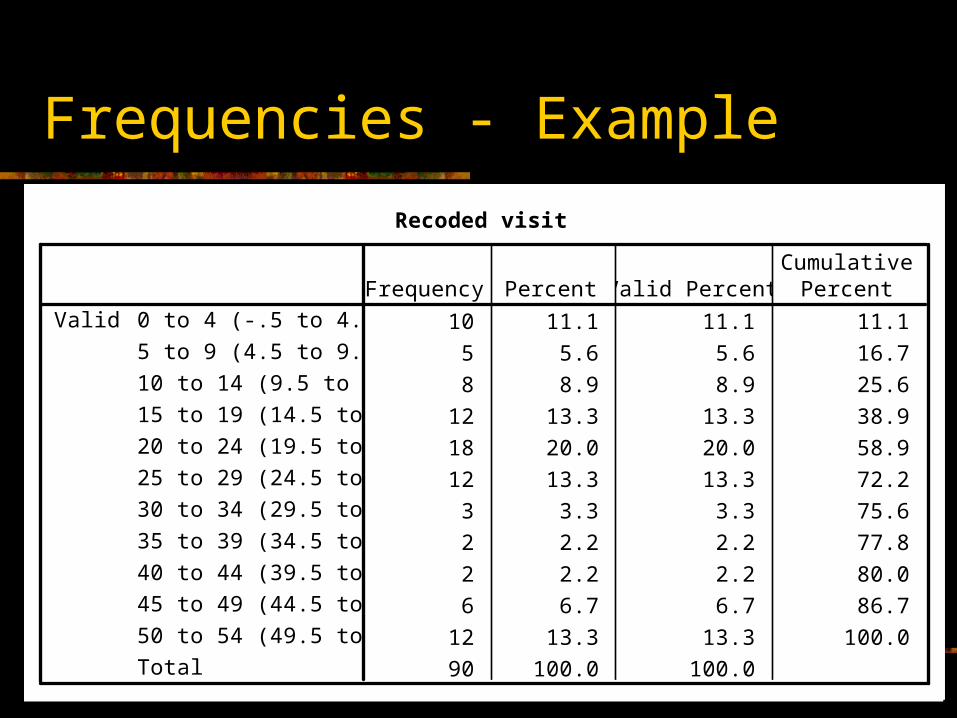
Frequencies - Example
Recoded visit
10 11.1 11.1 11.1
5 5.6 5.6 16.7
8 8.9 8.9 25.6
12 13.3 13.3 38.9
18 20.0 20.0 58.9
12 13.3 13.3 72.2
3 3.3 3.3 75.6
2 2.2 2.2 77.8
2 2.2 2.2 80.0
6 6.7 6.7 86.7
12 13.3 13.3 100.0
90 100.0 100.0
0 to 4 (-.5 to 4.5)
5 to 9 (4.5 to 9.5)
10 to 14 (9.5 to 14.5)
15 to 19 (14.5 to 19.5)
20 to 24 (19.5 to 24.5)
25 to 29 (24.5 to 29.5)
30 to 34 (29.5 to 34.5)
35 to 39 (34.5 to 39.5)
40 to 44 (39.5 to 44.5)
45 to 49 (44.5 to 49.5)
50 to 54 (49.5 to 54.5)
Total
ValidFrequency Percent Valid Percent
CumulativePercent
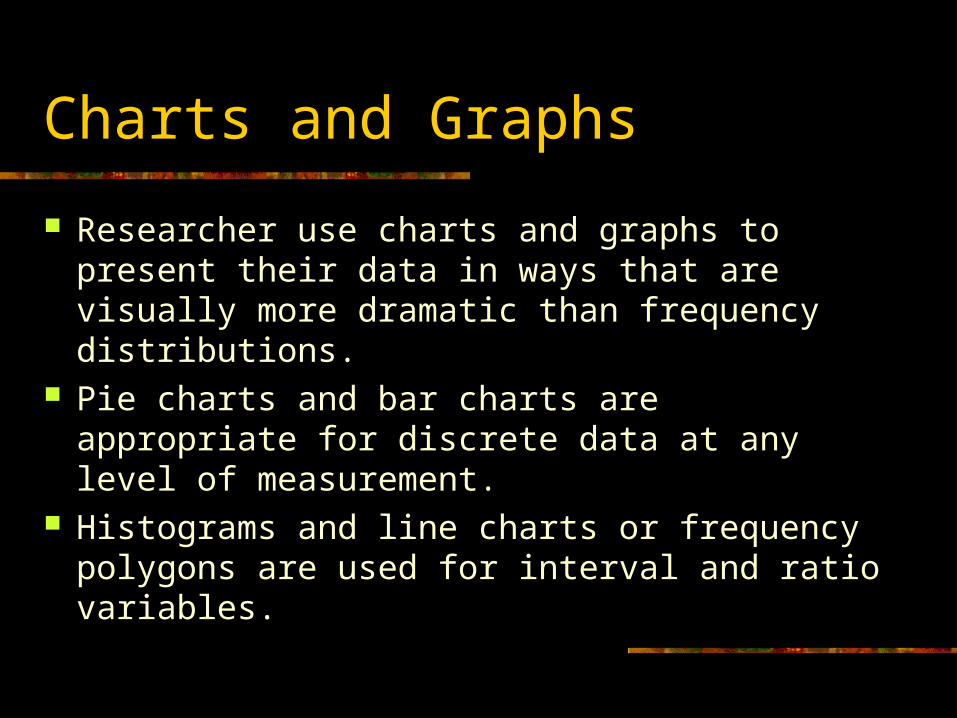
Charts and Graphs
Researcher use charts and graphs to present their data in ways that are visually more dramatic than frequency distributions.
Pie charts and bar charts are appropriate for discrete data at any level of measurement.
Histograms and line charts or frequency polygons are used for interval and ratio variables.
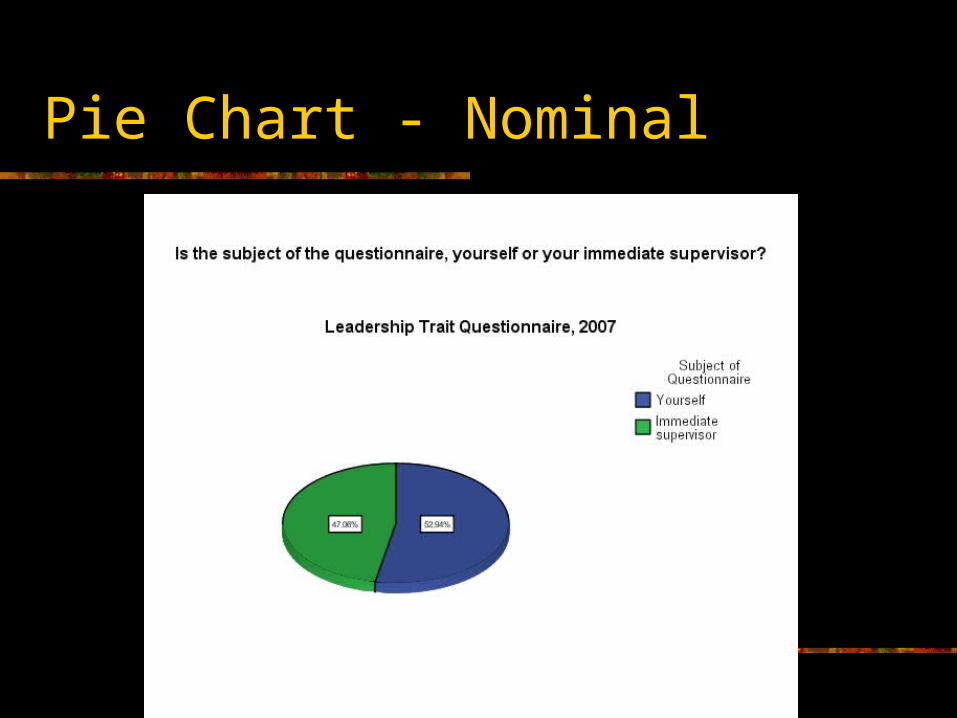
Pie Chart - Nominal
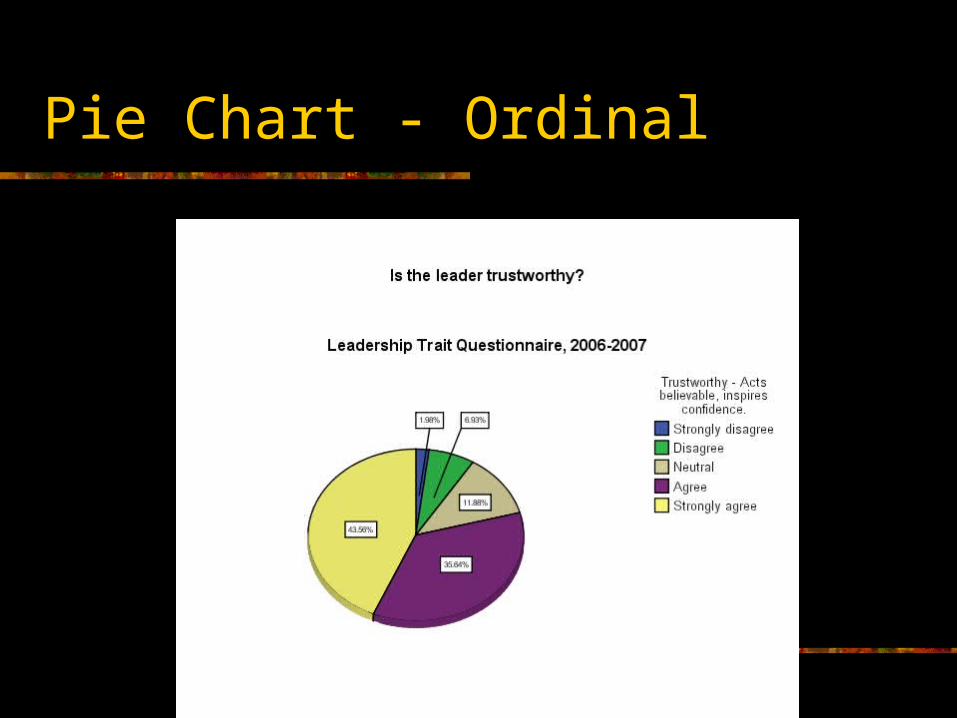
Pie Chart - Ordinal
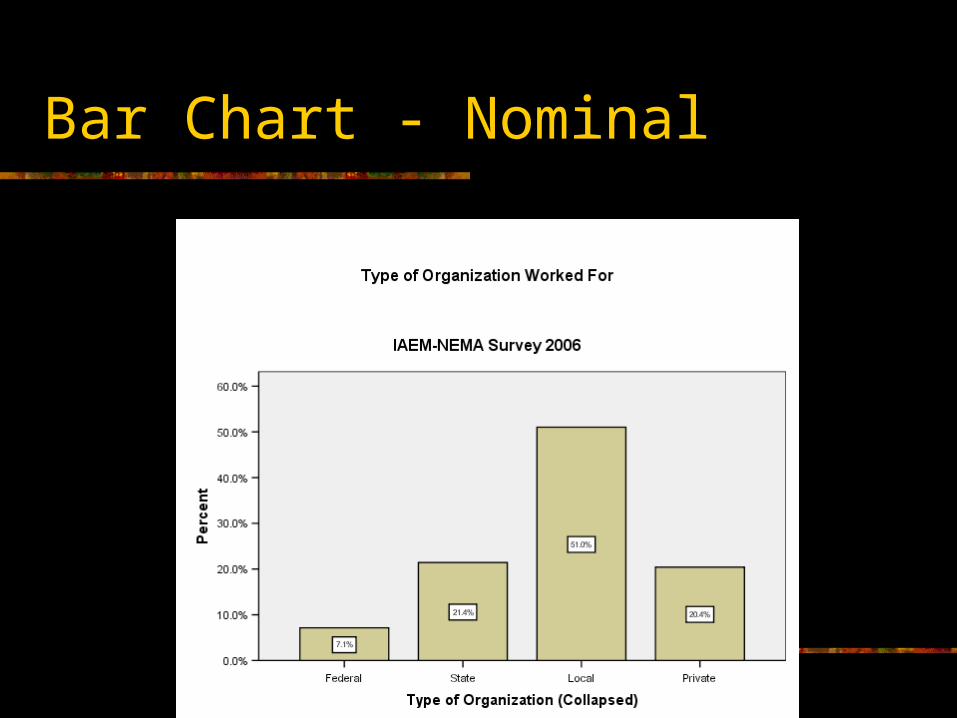
Bar Chart - Nominal
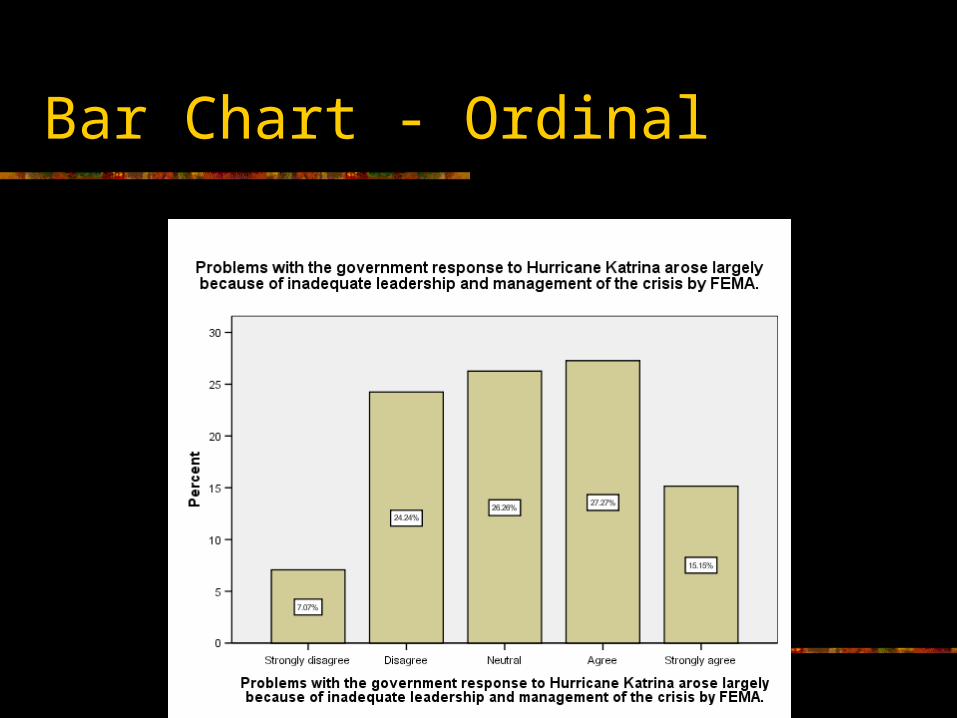
Bar Chart - Ordinal
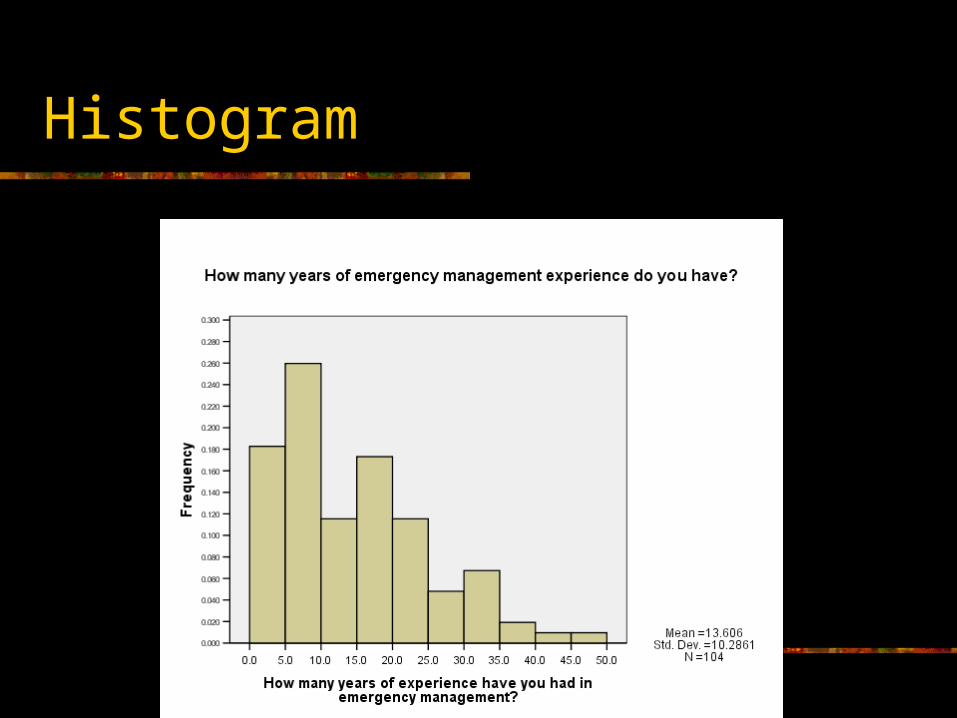
Histogram
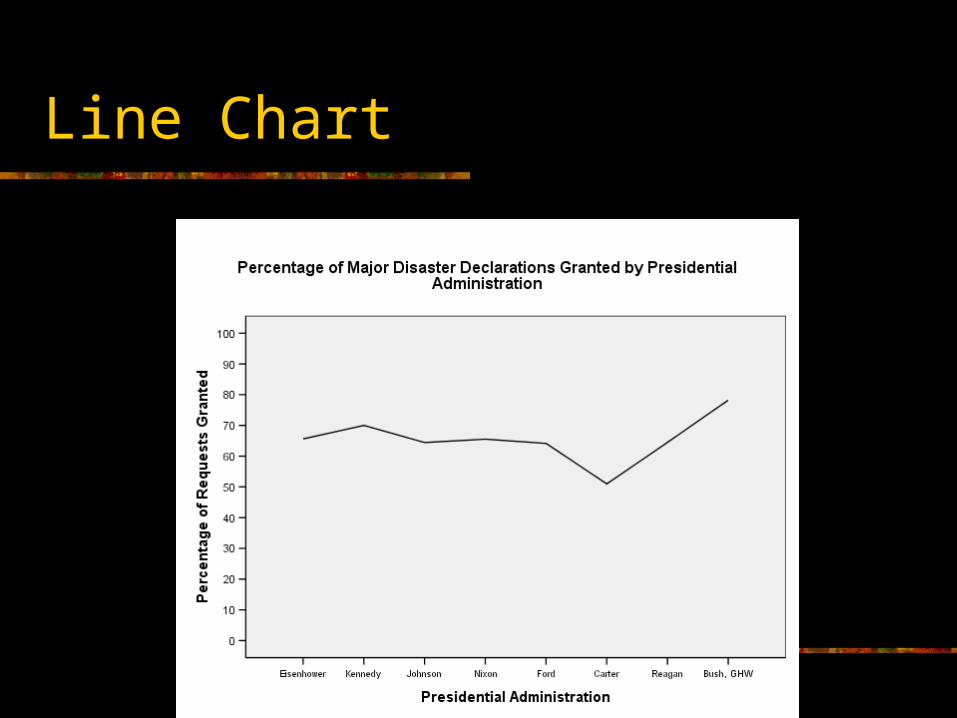
Line Chart