Embed Size (px)
Citation preview


•
•
•
•
•
•
•
•
•
•
•
•
•
•
•
•
•
•
•
•
•
•
•
•
•
•
•
•
•
•
•
•
•
•
•
•
•


•
•
•
•
•
•
1 Please refer to pages 29 and 30 for a reconciliation of Adjusted EBITDA to net income. 2 Other includes apparel, bottle openers, ice substitutes, dog bowls and other accessories. Dog bowls not sold in LTM June 2018; launched 2H 2018.3 Per the Outdoor Industry Association’s 2017 Outdoor Recreation Economy report.
4 Per May 2018 YETI Owner Study.5 Represents visits to YETI.com and YETIcustomshop.com.6 Includes Facebook and Instagram as of June 30, 2018.

•
•

(1) Represents 2018B gross sales by channel.(2) Reflects 2017 gross sales from wholesale POS and YETI.com.
•
•
•
•
•
•
•
•
•
•
•
•
•
•
•
•
•
8%
34%
2015 LTM September 2018


BEACH CAMPFIRE BACKYARDTAILGATE ON THE JOB IN THE PARK
•
•
1 Per May 2015 and May 2018 YETI Owner Study.


Source: Public company filings and equity research. 1 Instagram as of December 17, 2018.2 Heritage market region.3 Non-heritage market region.


•
•
•
•
1 Wholesale includes $8.3 million of sales to Rambler On.
¹
•
•
•
•
•
•

…

•
•
•
•
1 Represents last fiscal year international percentage of sales from international markets per public company filings as of October 3, 2018. YETI international percentage of 2017 net sales.


•
•
•
•
•
•
•


Note: $ in millions.1 Adjusted for net income before interest expense, income tax expense, depreciation and amortization expense, non-cash stock-based compensation expense, early extinguishment of debt, asset impairment charges, investments in new retail locations and international market expansion, transition to Cortec majority ownership, transition to the ongoing senior management team, and transition to a public company. Please refer to page 29 and 30 for a reconciliation of Adjusted EBITDA to net income.
¹

1 Leverage ratio defined as Net Debt to LTM Adjusted EBITDA

These are not projections; they are goals/targets and are forward-looking, subject to significant business, economic, regulatory and competitive uncertainties and contingencies, many of which are beyond the control of the Company and its management, and are based upon assumptions with respect to future decisions, which are subject to change. Actual results will vary and those variations may be material. For discussion of some of the important factors that could cause these variations, please consult the “Risk Factors” section of the preliminary prospectus. Nothing in this presentation should be regarded as a representation by any person that these goals/targets will be achieved and the Company undertakes no duty to update its goals/targets.1 Adjusted EBITDA Margin is a forward-looking non-GAAP measure. Reconciliation of this forward-looking non-GAAP financial measure to the most directly comparable GAAP financial measure is not provided because the Company is unable to provide such reconciliation without unreasonable effort, due to the uncertainty and inherent difficulty of predicting the occurrence and the financial impact of items impacting comparability and the periods in which such items may be recognized.


Note: $ in millions.
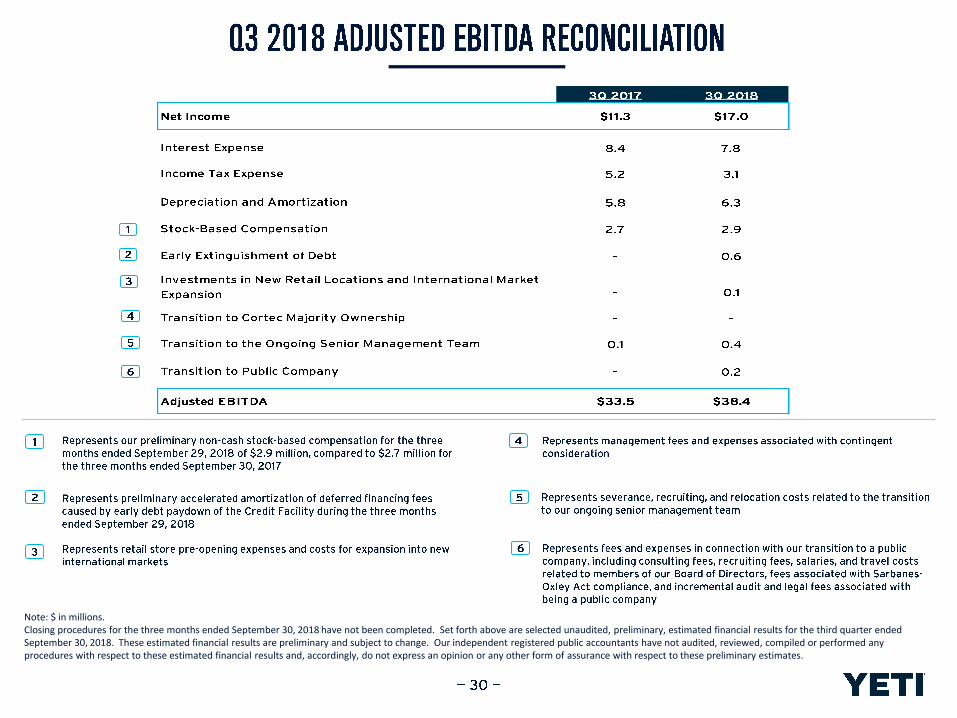
Note: $ in millions.Closing procedures for the three months ended September 30, 2018 have not been completed. Set forth above are selected unaudited, preliminary, estimated financial results for the third quarter ended September 30, 2018. These estimated financial results are preliminary and subject to change. Our independent registered public accountants have not audited, reviewed, compiled or performed any procedures with respect to these estimated financial results and, accordingly, do not express an opinion or any other form of assurance with respect to these preliminary estimates.